Simulations of cubic-tetragonal ferroelastics
Simulation of Microstructure Evolution
0.02
0.04 0.06
0.08
0.10
Microsegregation Pattern
C
Cr
MC
η
Fe
Nb
Ti
Laves
Experiment / Simulation Microsegregation and γ' precipitation in Ni-Cr-Al-Ta-W:
experiment
nucleation undercooling determined to ∆T=220K
A.Burtsev et al., EMRS proceedings (2002) M.Apel et al., Solar Energy Materials & Solar Cells 72 (2002) 201
Theoretical background: The phase field method
Multi-Phase Field Model Phase field equations
& φα = ∑ µαβ σ αβ α ,β π π2 2 2 φα φβ ∆Gαβ φβ ∇ φα − φα ∇ φβ + 2 φα − φβ + 2η η
Eutectic Fibres
NiAl-W
binary model
e.g. M.Apel et al., Journal of Crystal Growth 237-239 (2002) p. 154-158
Lamellar Eutectic Growth: Ternary alloy Al-Ag-Cu
e.g.G.Parieser et al, Steel research 72(2001) p.355
木薯仿生挖掘铲的设计及有限元静力学分析
木薯仿生挖掘铲的设计及有限元静力学分析作者:李生红易子钧卢建新张天全黄植功来源:《今日自动化》2021年第06期[摘要 ]针对木薯植株在被收获过程当中,挖掘铲容易出现自身质量过大、碎土性能不佳、减轻土壤黏性差等问题,基于仿生学理论,设计了一种土拨鼠仿生挖掘铲。
首先用MATLAB对土拨鼠爪趾进行曲线拟合得到其多项式函数,再在SolidWorks里面设计出土拨鼠仿生挖掘铲的三维模型。
最后导入到 ANSYS Workbench中进行有限元静力学仿真分析。
通过对比普通挖掘铲、实心仿生挖掘铲、空心仿生挖掘铲的应力应变情况,选择出一种满足设计要求的实心挖掘铲。
对比分析结果得到:实心仿生挖掘铲拥有良好的力学性能、使用寿命及较好的质量。
[关键词]木薯植株;挖掘铲;仿生;有限元静力学分析[中图分类号]S225.71 [文献标志码]A [文章编号]2095–6487(2021)06–00–02[Abstract]In the process of cassava plant harvesting, the digging shovel is prone to the problems of excessive weight, poor soil crushing performance and poor soil viscosity. Based on the bionics theory, a bionic digging shovel of woodchuck is designed. Firstly, the polynomial function of the claw toe of the groundhog is obtained by curve fitting with MATLAB, and then the three-dimensional model of the bionic digging shovel of the groundhog is designed in SolidWorks. Finally, it is imported into ANSYS Workbench for finite element static simulation analysis. By comparing the stress and strain of ordinary digging shovel, solid bionic digging shovel and hollow bionic digging shovel, a solid digging shovel meeting the design requirements is selected. Theresults show that the solid bionic excavator has good mechanical properties, service life and good quality.[Keywords]cassava plant; Digging shovel; bionics; Finite element static analysis在木薯產业中,收获木薯的方式会对其产生重要的影响,随着木薯种植面积的不断扩大,仅仅只依靠手工收割方式已经无法满足收获大量木薯的需求。
渐开线离散球齿轮齿面接触分析_高兴华
文章编号:1004-2539(2017)04-0044-04DOI:10.16578/j.issn.1004.2539.2017.04.010渐开线离散球齿轮齿面接触分析高兴华刘洋杨泽杨亦涛谢兰强(北华大学机械工程学院,吉林吉林132021)摘要提出了一种新型的渐开线离散球齿轮传动机构,该机构能实现在空间中的俯仰、偏摆及回转运动的传动,同时避免了现有离散球齿轮存在的传动原理误差。
使用ANSYS仿真软件对分度圆直径为512mm的渐开线离散球齿轮于不同啮合状态的齿面接触特性进行分析,发现在定转矩下渐开线离散球齿轮啮合传动的齿面接触面积与啮合角的变化成反比;且当啮合角变大时,最大接触应力作用点将移向齿顶,同时最大接触应力也随之增大,可达2.0593ˑ106MPa,通过该种齿轮传动特性的研究为空间传动机构、机械臂等研究提供应用依据。
关键词渐开线离散球齿轮齿面接触啮合角接触应力Tooth Contact Analysis of Discrete Involute Spherical GearGao Xinghua Liu Yang Yang Ze Yang Yitao Xie Lanqiang(College of Mechanical Engineering,Beihua University,Jilin132021,China)Abstract A new kind of the discrete involute spherical gear transmission mechanism is presented,this gear transmission mechanism can realize the transmission of the pitch motion,partial pendulum movement and rotary motion in the space and avoid the transmission principle error of the existing discrete spherical gear.By using the ANSYS simulation software,the tooth surface contact characteristic analysis of the discrete involute spherical gear with dividing circle diameter is512mm under different meshing states is carried out.It is found that,the tooth surface contact area of the discrete involute spherical gear transmission is inversely proportional with the change of meshing angle under the condition of fixed torque.And along with the meshing angle increa-ses,the maximum contact stress action point will move toward the tip,and the maximum contact stress will increase(up to2.0593ˑ106MPa).Through studying the transmission characteristics of this kind of gear,the basis of application for the study of spatial mechanism and mechanical arm is provided.Key words Discrete involute spherical gear Tooth surface contact Meshing angle Contact stress0引言随着仿生技术的发展,在机械领域,类似人类关节的齿轮机构被人们提出并运用于实际应用。
SJTU多尺度材料模拟与计算
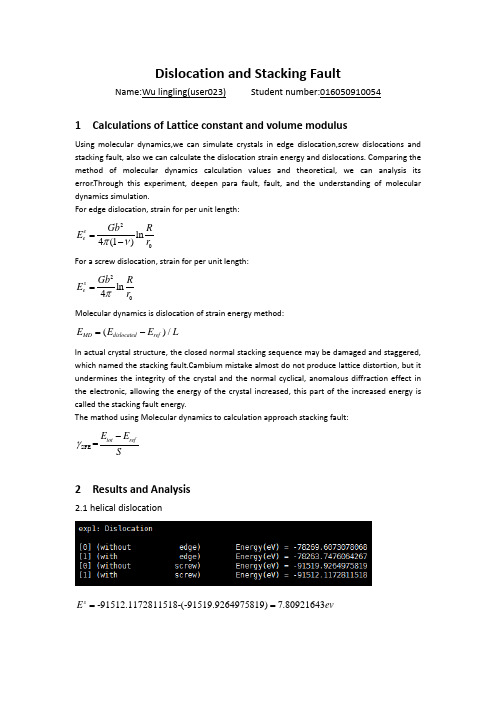
Dislocation and Stacking FaultName:Wu lingling(user023) Student number:0160509100541 Calculations of Lattice constant and volume modulusUsing molecular dynamics,we can simulate crystals in edge dislocation,screw dislocations and stacking fault, also we can calculate the dislocation strain energy and dislocations. Comparing the method of molecular dynamics calculation values and theoretical, we can analysis its error.Through this experiment, deepen para fault, fault, and the understanding of molecular dynamics simulation.For edge dislocation, strain for per unit length:20ln4(1)e eGb RE r πn =−For a screw dislocation, strain for per unit length:20ln4seGb R E r π= Molecular dynamics is dislocation of strain energy method:()/MD dislocated ref E E E L=−In actual crystal structure, the closed normal stacking sequence may be damaged and staggered,which named the stacking fault.Cambium mistake almost do not produce lattice distortion, but it undermines the integrity of the crystal and the normal cyclical, anomalous diffraction effect in the electronic, allowing the energy of the crystal increased, this part of the increased energy is called the stacking fault energy.The mathod using Molecular dynamics to calculation approach stacking fault:SFE =tot refE E Sγ−2 Results and Analysis2.1 helical dislocation-91512.1172811518-(-91519.9264975819)7.80921643sE ev =el =4.45685A A,so57.80921643 1.5326.0/7A 3A 95s s esE evE ev l ===A A When calculating Cu,0 3.639A a =A,0/2b a =,43.55G GPa =,we can get the result:20ln 0.6595(/A)4s eGb RE ev r π==A2.2 stacking fault-91512.1172811518-(-91519.9264975819)7.80921643sE ev =el =5.09537A AWhen calculating Cu,0 3.639A a =A,0/2b a =,43.55G GPa =, we can get theresult:20ln 0.6595(/A)4s eGb RE ev r π==A2.3 stacking faultE=244.0461825440018(mJ/m )For edge dislocation,when chocing x1=[6.81205 126.341 109.114] A and x2=[6.87178 126.333 141.831] A ,we can get 141.831109.11432.717A d −==A,so2102 1.30(10/)81s b J m m n πn −+•=−,2221=39.7347(/)81s b mJ m dm n γπn +••=− For helical dislocation,when chocing x1=[127.087 125.957 2.27685] A ,x2=[137.353 124.044 1.02476] A ,we can get 137.353127.08710.266A d −==A,so210230.585(10/)81s b J m m n πn −−•=−,222-31=56.9842(/)81s b mJ m d m n γπn ••=−.3 Summary form。
(凝聚态物理专业论文)钽铌酸钾及相关复合材料的制备和机理研究

华中科技大学博士学位论文钽铌酸钾及相关复合材料的制备和机理研究姓名:***申请学位级别:博士专业:凝聚态物理指导教师:***20070517华中科技大学博士学位论文摘要随着激光和红外技术的发展,热释电材料及其应用的研究不断深入,已用作热释电探测器和热摄像管等器件,在工业生产、国防科技以及日常生活中都有广泛的用途。
陶瓷聚合物复合材料采用两相复合,可兼具两相材料的优点,因而是热释电材料研究的热点。
钽铌酸钾材料具有非凡的电光效应和热释电效应,是一种非常有潜力的材料。
针对钽铌酸钾(KTN)材料较高的制备温度始终障碍着材料的实用化,本文旨在探索KTN材料新的合成方法:低温水热、溶剂热和混合溶剂热法;并进而探索制备以KTN材料为基的热释电性能优异的复合材料。
为此重点从理论上唯象地探讨提高0-3铁电复合材料的热释电性能的可能途径,并从微观上讨论了材料的极化机理,进而预测了不同极化条件下0-3铁电复合材料热释电、压电性能的变化规律。
鉴于KTN材料的制备温度较高,本文探讨反应条件温和的新的制备工艺。
为此我们采用了水热合成技术:水热法、溶剂热法和混合溶剂热法制备KTN粉体,通过系统的大量实验优化工艺最终成功制备了高纯的KTN纳米粉体,并比较深入地探讨了其合成机理。
我们发现混合溶剂热法是温和条件下合成铁电KTN纳米材料的一种有效的新途径;并且KOH浓度和溶剂组分对产物影响很大。
XRD、SEM和TEM等分析表明混合溶剂热法合成的典型样品结晶度高,且为形状规则、纳米尺寸的单晶颗粒。
晶粒尺寸增大时,KTN晶粒发生立方-四方相变。
溶剂热法和混合溶剂热法的合成条件更温和,主要是由于溶剂中的异丙醇形成了超临界流体。
采用热压法制备了KTN/P(VDF-TrFE)0-3复合材料,初步研究了其介电、铁电和热释电性能。
XRD和SEM结果表明,材料无杂相,结晶良好,KTN粉体分布比较均匀、无大的团聚。
复合材料的介电常数较KTN陶瓷大大降低,室温时约为100。
CALPHAD软件介绍
Abstract
The phase-field method has become an important and extremely versatile technique for simulating microstructure evolution at the mesoscale. Thanks to the diffuse-interface approach, it allows us to study the evolution of arbitrary complex grain morphologies without any presumption on their shape or mutual distribution. It is also straightforward to account for different thermodynamic driving forces for microstructure evolution, such as bulk and interfacial energy, elastic energy and electric or magnetic energy, and the effect of different transport processes, such as mass diffusion, heat conduction and convection. The purpose of the paper is to give an introduction to the phase-field modeling technique. The concept of diffuse interfaces, the phase-field variables, the thermodynamic driving force for microstructure evolution and the kinetic phase-field equations are introduced. Furthermore, common techniques for parameter determination and numerical solution of the equations are discussed. To show the variety in phase-field models, different model formulations are exploited, depending on which is most common or most illustrative. c 2007 Elsevier Ltd. All rights reserved.
Introduction to Molecular Dynamics Simulation
Introduction to Molecular Dynamics Simulation
Michael P. Allen
published in
Computational Soft Matter: From Synthetic Polymers to Proteins, Lecture Notes, Norbert Attig, Kurt Binder, Helmut Grubmuller, Kurt Kremer (Eds.), ¨ John von Neumann Institute for Computing, Julich, ¨ NIC Series, Vol. 23, ISBN 3-00-012641-4, pp. 1-28, 2004.
1
P Intermolecular potential v(r) r c(t) g(r)
Phases s l g T Structure
Experimental Results Complex Fluid (real system)
Make model Test model
Simulation Results
In this chapter a summary is given of the key ingredients necessary to carry out a molecular dynamics simulation, with particular emphasis on macromolecular systems. We discuss the form of the intermolecular potential for molecules composed of atoms, and of non-spherical sub-units, giving examples of how to compute the forces and torques. We also describe some of the MD algorithms in current use. Finally, we briefly refer to the factors that influence the size of systems, and length of runs, that are needed to calculate statistical properties.
齿轮疲劳断裂数值模拟 finite element simulation of fatigue crack growth in a spiral bevel pinion gear
Three-dimensional,parallel,finite element simulationof fatigue crack growth in a spiral bevel pinion gearAnıUral a,*,Gerd Heber a ,Paul A.Wawrzynek a ,Anthony R.Ingraffea a ,David G.Lewicki b ,Joaquim o caCornell Fracture Group,Rhodes Hall,Ithaca,NY 14850,USA b US Army Research Laboratory,NASA Glenn Research Center,Cleveland,OH 44135,USAc Federal University of Ceara,Fortaleza-CE 60455-760,BrazilReceived 23February 2004;received in revised form 25August 2004;accepted 31August 2004Available online 11November 2004AbstractThis paper summarizes new results for predicting crack shape and fatigue life for a spiral bevel pinion gear using computational fracture mechanics.The predictions are based on linear elastic fracture mechanics theories combined with the finite element method,and incorporating plasticity-induced fatigue crack closure and moving loads.We show that we can simulate arbitrarily shaped fatigue crack growth in a spiral bevel gear more efficiently and with much higher resolution than with a previous boundary-element-based approach [Spievak LE,Wawrzynek PA,Ingraffea AR,Lewicki DG.Simulating fatigue crack growth in spiral bevel gears.Engng Fract Mech 2001;68(1):53–76]using the finite element method along with a better representation of moving loads.Another very significant improvement is the decrease in solution time of the problem by employing a parallel PC-cluster,an approach that is becoming more common in both research and practice.This reduces the computation time for a complete simulation from days to a few hours.Finally,the effect of change in the flexibility of the cracking tooth on the location and magnitude of the contact loads and also on stress intensity factors and fatigue life is investigated.Ó2004Elsevier Ltd.All rights reserved.Keywords:Finite element method;Fatigue crack growth;Computational fracture mechanics;Gears;Three-dimensional finite element contact analysis;Parallel computation0013-7944/$-see front matter Ó2004Elsevier Ltd.All rights reserved.doi:10.1016/j.engfracmech.2004.08.004*Corresponding author.Tel.:+16072548822;fax:+16072548815.E-mail address:au14@ (A.Ural).Engineering Fracture Mechanics 72(2005)1148–1170/locate/engfracmechA.Ural et al./Engineering Fracture Mechanics72(2005)1148–117011491.IntroductionPredicting crack shapes is important in determining the failure mode of a gear.Cracks propagating through the rim may result in catastrophic failure,whereas the gear may remain intact if one tooth fails allowing for early detection of impending failure.Being able to predict crack trajectories is insightful for the designer.However,predicting growth of three-dimensional arbitrary cracks is complicated due to the difficulty of creating and evolving three-dimensional geometry and mesh models,the computing power re-quired and absence of closed-form solutions of the problem.Previously,tooth-bending fatigue failure in spiral bevel gears was investigated using the boundary ele-ment method[1].These analyses were significant in developing a method for predicting three-dimensional, non-proportional,fatigue crack growth incorporating moving loads.Prior to that study,there were few examples of three-dimensional crack growth studies on gears[2,3].Most of the gear studies in the literature employing computational fracture mechanics employed two-dimensional analyses[4–8].Furthermore, moving contact loads following a path along the tooth surface starting from the root and moving up to the top of the tooth on the heel end had not been considered in these analyses.The predictions from[1]were helpful to determine areas in need of further research.These were:improv-ing accuracy of simulation by switching from the boundary element(BEM)to thefinite element method (FEM),decreasing computation time by employing parallel FEM analysis,and improving modeling of con-tact tooth loads.The main objective of this paper is to demonstrate that we can improve accuracy and efficiency of crack growth simulations in a spiral bevel pinion gear through the use of a new computational fracture mechanics environment that synthesizes these improvements.A complete description of this environment is given in [9].It is composed of components capable of performing parallel FEM simulations of arbitrary,non-pla-nar,3D crack growth,creating volume meshes of bodies with curved surfaces and internal boundaries,and performing fracture analysis tasks such as calculating stress intensity factors(SIF)using the J-integral in an integrated manner.Another focus of this paper is performance and interpretation of three-dimensional con-tact analysis of a spiral bevel gear set incorporating cracks.These analyses are significant in determining the influence of change of toothflexibility due to crack growth on the magnitude and location of contact loads. This is an important concern since a change in contact loads might lead to differences in stress intensity factors and therefore result in alteration of the crack shape and rate of crack growth.2.Three-dimensional FEM simulations of fatigue crack growth in a spiral bevel pinion gearAn example of tooth-bending failure can be observed in a spiral bevel pinion gear used in the main rotor transmission of the US ArmyÕs OH-58Kiowa Helicopter(Fig.1).This gear is composed of19teeth and meshes with a71-tooth gear under operating conditions of6060rpm and3099in.-lb of torque.The material used for OH-58spiral bevel gears is AISI9310steel.Material properties of this steel are given in Table1as well as the Paris model parameters[10]used in the fatigue life calculations described in Section2.1.The OH-58spiral bevel pinion gear,shown in Fig.1,was tested in an actual helicopter transmission test facility at full speed under increasing loading conditions at the NASA Glenn Research Center(NASA/ GRC).Several electron-discharge-machined(EDM)notches with different sizes were introduced at thefillet of a toothÕs concave side to serve as fatigue crack initiators.The test was run for one million cycles at 2479in.-lb,one million cycles at3099in.-lb,one million cycles at3874in.-lb and1.9million cycles at 4649in.-lb.At the end of a total of4.9million cycles,five fractured teeth were observed.No crack growth measurements were taken during the test.In this respect,this test only provided an upper bound on fatigue life of a tooth of4.9million cycles.However,qualitative information on the fracture surfaces and fatiguecrack growth were extracted from the test.A detailed study of the fracture surfaces using a scanning elec-tron microscope (SEM)can be found in [1].2.1.ApproachIn the current study,as in [1],LEFM theories were used for fatigue crack growth predictions.Fatigue crack growth rates were determined using a modified Paris model accounting for crack closure.A crack is assumed to advance when its SIF is large enough to overcome closure and is larger than the SIF of the pre-vious load step.All fatigue life predictions were based on plane strain assumptions.Crack direction predic-tions were made using the maximum circumferential stress theory [11].Moving loads were takenintoFig.1.OH-58spiral bevel pinion gear showing tooth-bending fatigue fracture:(a)whole pinion;(b)close-up view of the fractured pinion;(c)broken pinion tooth.Table 1Material properties and Paris model parameters of AISI 9310steelMaterial properties of AISI 9310steelYoung Õs modulus30,000ksi Poisson Õs ratio0.3Tensile strength185ksi Yield strength160ksi Fracture toughness,K Ic85ksi in.1/2Paris model parameters of AISI 9310steelC6.19·10À20(in./cycle)/(psi in.1/2)n n 3.361150 A.Ural et al./Engineering Fracture Mechanics 72(2005)1148–1170account by discretizing loading of a tooth as it rolled through mesh into15steps.This loading created a non-proportional load history at the tooth root meaning that the ratio of Mode II to Mode I SIFs changed during the load cycle.Complex cracking problems,such as the current gear problem,require computation of mixed mode SIFs due to the combined loading that they receive.Several fundamentally different approaches for computing SIFs have been developed.Among these methods,the displacement correlation method[12–15]and equivalent domain J-integral methods[16–21]are widely used in numerical computations.In the previous BEM-based simulations of this spiral bevel pinion gear,the displacement correlation method was used for calculating SIFs.This method only requires displacement information on the boundary near the crack front and is computationally efficient.Since the BEM solves for displacement information only on the bounda-ries,this method is directly suitable for the BEM analysis.This method is only as accurate as the computed displacements at the correlation points.In the current FEM-based simulations,we used the equivalent do-main,J-integral approach.SIFs calculated by this method are known to produce more accurate values than those from displacement correlation,from the same local displacementfields,because it involves numerical integration over computedfields rather than point sampling.The overall methodology used in the present simulations is composed of the following steps:1.Create initial geometry model of the spiral bevel pinion gear with the Object Solid Modeler(OSM)[22]using the gear geometry information provided by the NASA/GRC.2.Specify boundary conditions and material properties in Fracture Analysis Code-3D(FRANC3D)[23].3.Insert the initial crack in FRANC3D at the location where the EDM defect was inserted in the testpinion.4.Create a surface mesh composed of triangular elements in FRANC3D.5.Create a3D FEM mesh composed of tetrahedra using JMesh[24]using a geometry descriptionfilewritten out from FRANC3D.6.Calculate the magnitude and location of the nodal contact loads resulting from continuous meshing ofthe pinion and the gear(Fig.2).7.Run the FEM analysis on a parallel PC-cluster for15discrete load ing the J-integral method,calculate SIF values at each specified crack front point for each load step.8.Calculate crack extension and crack growth angle due to one non-proportional load cycle using theapproach developed in[1].For each discrete crack front point:(a)Calculate amount of crack growth,d a i corresponding to each load step i=1, (15)d a i¼K iIÀK iÀ1ID K effd ad ad N¼CðD K effÞn D K eff¼K maxIÀK opð1ÞFig.2.Single,left-handed,spiral bevel pinion tooth.Note the moving load path on the tooth surface.A.Ural et al./Engineering Fracture Mechanics72(2005)1148–11701151(b)Calculate the angle of crack growth corresponding to each load step using maximum circumferen-tial stress theory.h i ¼2tan À114K i I K i II Æ14ffiffiffiffiffiffiffiffiffiffiffiffiffiffiffiffiffiffiffiffiffiffiffiffiK i I K i II2þ8s 2435ð2Þ(c)Calculate the final coordinates of the crack front points and trajectory angles by approximating thecontributions from each load step by a straight line (Fig.3).(d)Determine the number of cycles,N ,for a maximum of approximately 0.01in.of crack growth forany point along crack front which is small compared to the tooth thickness.9.Perform a least squares curve fit through the new discrete crack front points and update geometryusing the new fitted crack front in FRANC3D.10.Remesh locally and repeat steps 5–10.2.2.Modeling of moving tooth loadsContact in a spiral bevel gear occurs in three dimensions following a path along the tooth surface start-ing from the root and moving up to the top of the tooth on the heel end (Fig.2).In order to model this three-dimensional effect the magnitude and location of contact loads at different instants of time over one loading cycle have to be determined.There are no closed-form solutions for the contact loads on a pin-ion tooth due to the complexity of the gear geometry and three-dimensional effects.To this end,numerical tools were developed by Litvin and Zhang [25]to determine the mean contact points on the spiral bevel pinion tooth.In analyzing the present spiral bevel gear,it is assumed that the contact between the gear and pinion follows Hertz theory of elastic contact which takes into account only normal pressure between two bodies and produces an elliptical contact area with a semi-ellipsoidal pressure distribution.The continuous meshing process between a gear and a pinion is modeled by 15discrete load steps.Load steps 5–11are single tooth contact and 1–4and 12–15are double tooth contact.Single tooth contact steps create larger contact areas and larger loads on the tooth surface.Load step 11corresponds to the highest point of single tooth contact.The location of the 15contact ellipses and the magnitude of the contact loads applied over these areas were provided by NASA/GRC.In Ref.[1],contact ellipses were a part of the geo-metry models.Since the ellipses overlapped,four different geometry models were needed for each crack configuration.In the current approach,contact loads are no longer a part of the geometry model.This ap-proach brings a substantial decrease in computation time since only one geometry model for each crack configuration is now needed.In the current work,moving contact loads are approximated by interpolation using the shape functions on the surfaces of the loaded elements.This procedure starts with reading the1152 A.Ural et al./Engineering Fracture Mechanics 72(2005)1148–1170mesh information created by JMesh and retrieving the geometry information of the n th (n =1,2,...,15)contact ellipse.After the nodal points defined in three-dimensional coordinates are transformed into a two-dimensional contact space according to the mapping described in [25],mesh nodes falling into the con-tact area bounded by the n th ellipse are determined.If the node is within the contact area work equivalent nodal contact forces are calculated following standard finite element procedures.All the information for nodes found by this search and the corresponding loads are written out to a file completing the procedure.2.3.ResultsThree-dimensional,parallel finite element analyses were performed for an OH-58spiral bevel pinion gear for 54crack growth steps.In the previous serial BEM-based analysis,only 13crack growth steps were per-formed.One crack growth step in the FEM analyses consists of 15static finite element analyses in order to simulate moving loads on the pinion tooth.After the 54th crack growth step the analysis was stopped be-cause it was concluded that propagating the crack further would not provide additional insights into the simulations and results.All predictions were based on the methodology outlined in Section 2.1.Fig.4shows the initial surface FE mesh of the spiral bevel pinion gear.As seen in the figure,the mesh is finer on the tooth where the initial crack is located.The volume mesh of the gear is composed of 10-noded tetrahedra which model quadratic variation of displacement over the element domain.Modeling only three teeth of the pinion was adequate to obtain accurate results.A study was done in [26]which showed the comparison of SIFs between explicit modeling of three and nine teeth of the pinion.For both models,K I and K II values were very similar leading to the conclusion that the three teeth model is sufficient for the simulations.The initial flaw is modeled as a semi-elliptical crack with dimensions 0.125in.long and 0.05in.deep,although the actual EDM notch was rectangular.This difference is introduced by the attempt to avoid sharp corners which create stress concentrations leading to inaccurate numerical results.However,the initial notch shapes are still very similar in size and location and the predictions from the simulations and experimental results can still be compared.The initial crack is introduced into the fillet of the middle tooth of the concave side.The displacements in all directions with respect to the global coordinate system at the end of the long shaft of the pinion and the normal component of displacements on the surfaces of the smaller shaft are set tozero.Fig.4.A spiral bevel pinion model with surface FE mesh:(a)whole pinion,(b)close-up view of pinion teeth.Note the location of the initial crack in the middle tooth.(c)Initial crack shape and dimensions.A.Ural et al./Engineering Fracture Mechanics 72(2005)1148–11701153Figs.5–7show Mode I,II and III stress intensity factors,respectively,for the initial crack configuration for the first eleven load steps.Only load steps 1,5,9and 11are shown in the figures for clarity.Since a crack is not assumed to advance when its SIF is smaller than the SIF of the previous load step,only the first 11steps practically contribute to crack growth calculations.In these figures,crack front position cor-responds to the points near the crack front at which SIF values are evaluated.The orientation of the initial crack is shown in Fig.4c.In the initial step of crack growth simulation,the crack front was discretized such that there were 222points at which SIF values were calculated.This is compared to only 61points previ-ously used with the BEM-based model [1].In Fig.5,Mode I SIFs show an increasing trend as the load moves up the tooth surface (i.e.the load step number increases)since more load is transferred to the pinion tooth and the lever arm between the contact points and the crack increases.Maximum SIFs occurfor1154 A.Ural et al./Engineering Fracture Mechanics 72(2005)1148–1170A.Ural et al./Engineering Fracture Mechanics72(2005)1148–11701155step11after which SIF values decrease due to switching to double tooth contact.The influence of Mode III SIFs on the crack shape predictions was not taken into account.Fig.8shows the crack shape predictions by the parallel FEM on the tooth surface and cross-section of the tooth for several crack growth steps including the initial andfinal configurations of the crack.Fig.9 contains a close-up view of the last step of crack growth viewed from the toe end of the tooth,and a detail of the corresponding mesh.Fig.9b shows that JMesh is capable of meshing very complex crack shapes while still producing well-shaped elements.parison of present and previous resultsThis section compares the present results with those reported in[1]in terms of accuracy and efficiency. One of the most significant improvements in the present work is the difference in the solution time of the problem with the use of a better simulation environment and state-of-the-art hardware.This comparison is presented for historical progress reasons only.It is not to show parallel FEM is better than serial BEM.A parallel PC-cluster at the Cornell Theory Center was used to perform the crack growth simulations with an in-house-developed,parallel,FEM solution framework.The cluster is ranked49th(1068GFlops) in the21st list of the Top500supercomputer sites(published in June,2003).Its hardware consists of192 Dell PowerEdge2650servers with a Gigabit Ethernet interconnect,running Microsoft Windows2000Ad-vanced Server as its operating system.Each node is equipped with2Intel Xeon processors clocked at 2.4GHz and having4GB of RAM.For our simulations,a maximum of128nodes was used and only one processor per node was utilized(Table2).One load step of the largest problem(3,044,077DOF)takes about10min on64processors.Gigabit Ethernet is by no means a very fast(low latency)interconnect,and that is the main reason why going to128processors reduces the solution time by only about20%.Fortu-nately,all load steps can be dealt with independently and we can run two of them simultaneously on two sets of64processors each.This increases the overall throughput and lets us complete one load cycle in about1.5h on128processors.With advances in solver technology(optimized matrix ordering/storage, more effective preconditioners)and faster I/O,this time can be reduced further.Preliminary tests indicate that a further50%reduction of the execution time can be achieved this way.The performance comparison in Table 2clearly shows that there is a very significant improvement in computation time with the development of a parallel FEM solver,even when adding significant resolution to the solution.The solution time for the previous serial BEM simulations was about 65h for onecrackFig.8.Crack shape predictions by parallel FEM on tooth surface and tooth cross-section.1156 A.Ural et al./Engineering Fracture Mechanics 72(2005)1148–1170growth step,whereas the parallel FEM simulations took much less time for each crack growth step,even though the models have much higher resolution.The number of unknowns for the FEM was about a mil-lion at the initial step,and increased to more than 3million as the crack front advanced.3D volume mesh-ing of one model,still performed in sequential and not parallel mode,ranged from 20min for thesmallest Fig.9.(a)Close-up view of the simulated crack after the last step of crack growth and (b)detail of mesh corresponding (a).Table 2Comparison of performance between present parallel FEM and previous serial BEM simulationsItemFEM BEM Computer power128nodes a Single DEC-Alpha PC-cluster,2.4GHz Workstation,175MHz Number of unknowns$1–3million 6700(coefficient matrix)(sparse,symmetric)(dense,non-symmetric)Max.solution time per load cycle$1.5h $60h (one load cycle =15load steps)(4models)Typical time for one crack step$4.5h b $65h c aOnly one processor per node is used.bSolution time plus 3h post-processing and remeshing.c Solution time plus 5h post-processing and remeshing.A.Ural et al./Engineering Fracture Mechanics 72(2005)1148–11701157model to about an hour for the largest models.Of course,solution time for a single crack step using the previous serial BEM-based approach would be substantially reduced with use of a similar,faster processor. However,resolution in terms of length of crack step,and,therefore,crack geometry and accuracy of SIFs would still be wanting.Improvement in the computation time for each crack growth step allowed us to increase solution reso-lution by taking smaller crack increment steps and to simulate more steps of propagation.Figs.10–12show the comparison of crack area,depth and crack front length by FEM and BEM.The summary of the infor-mation from thesefigures is also given on Table3.These plots indicate that the current fatigue growth rate is marginally lower when we compare the crack area and the crack front length,and more cycles are re-increasequired to achieve the same amount of crack growth when compared with previous results.A rapidTable3Comparison of crack growth amount between present and previous simulationsResults Present Previous[1] Number of steps5413Total number of cycles383,000311,000 Final crack front length 1.55in. 1.42in. Final crack area0.319in.20.186in.20.188in.Final crack depth0.268in.in the slope of the curves at high cycles can be observed in Figs.10and11which indicates that the simu-lations cover most of the useful fatigue life of the pinion.Figs.13–15show the SIF comparisons for load steps3,7and11.Thesefigures show that Mode I SIF calculations using displacement correlation and the BEM are higher than those from using J-integral and the FEM for load step3and7.However for load step11,the values are almost the same throughout the crack front.Figs.16and17present the comparison of SIF variation over one load cycle and non-proportional load history.In Fig.16,it is seen that K I predictions are lower in the J-integral/FEM analysis than the displace-ment correlation/BEM analysis over most of the steps.As seen in Fig.17,the ratio of K II to K I over15load steps shows a similar trend as observed in the BEM-based analysis with a slight difference in values.These differences in SIFs influence the fatigue life predictions which depend on K I values and also crack growth direction which depend on the ratio of K II to K I.Crack shape comparisons in Fig.18show that,on the tooth surface,crack trajectory predicted by cur-rent FEM-based simulation is similar to the previous BEM-based results.The deviation of crack path at thetoe end in the previous predictions was also observed in current predictions.On the heel end,current results exhibit a less steep propagation angle than the experimental trajectory.On the tooth cross-section it is ob-served that the current predicted crack trajectory is less steep than previous BEM and experimental results.Current results also exhibit a shallower ridge formation than the experiment.Although the FEM-predicted crack path still does not exactly reproduce the crack shape observed in experiments,it captures the global behavior of the crack propagation shape.An important remark is that the crack trajectory at the cross-sec-tion changes along the crack front.The comparison shown in Fig.18is one sample for the cross-section at the midpoint of the initial crack.The reason for the deviation of crack path on the toe end is most probably the end product of the inac-curate representation of the contact loads.Hertzian model used in the simulations assumes that the location and magnitude of the contact loads are constant.However,the pinion tooth becomes more flexible as the crack grows and the amount of load transferred decreases,also changing the SIFs.Therefore,a better rep-resentation of the contact loads accounting for these effects is necessary.This can be achieved through ex-plicit 3D contact analysis which is capable of capturing the change in magnitude and location of contact.In the following section,we demonstrate the effect of a growing crack on the contact loads by performing 3D,FEM-based contact analysis.3.Three-dimensional,FEM-based contact analysisThe meshing of a gear and pinion produces loads on the tooth surface that change in magnitude and position in time.In Section 2,analyses assuming Hertzian contact theory were described.This assumption,however,is a simplification for a number of reasons:(1)the teeth and rims that transmit the load are flex-ible,(2)assumed elliptical contact area on the tooth surface may not be accurate since the curvatures of the teeth surfaces in contact are not constant over the contact zone,(3)the center of contact,where the maxi-mum contact stress occurs,may differ from the theoretical contact point and (4)most importantly for the current investigation,the tooth flexibility changes as the crack propagates in a tooth.The change in flex-ibility due to cracking may shift the contact area,and change the magnitude of the contact loading.In this section a series of three-dimensional finite element analyses that model the contact conditions be-tween the gear and pinion explicitly are described.The purpose of this study is to assess what influence the details of the load transfer through the contact conditions have on the computed stress intensity factors,and through them the predicted crack shape.Three-dimensional,finite element contact analyses in spiral bevel gears have been undertaken by sev-eral researchers to study the stresses induced at the root and on the surface of the tooth.Earlierworkparison of crack shape predicted by the serial BEM,the parallel FEM and an experiment on the tooth surface and tooth cross-section at the midpoint of crack.by Bibel et al.[27]utilized gap elements to simulate the contact boundary conditions and to evaluate the stresses on the tooth surface.Further study on this subject eliminated the need for using gap elements through the use of contact capabilities of commercialfinite element programs.Preliminary results showing the moving contact patches over the tooth surface are reported in Bibel and Handschuh[28].These analyses also incorporated automatic meshing of the gear and pinion via the addition of user subroutines to a com-mercialfinite element program.The same authors performed additional analyses in order to compare experimentally measured tooth bending stresses in spiral bevel gears to FEM results[29].Other studies on the contact analysis of spiral bevel gears,including the development of a methodology combining a sur-face integral and afinite element solution,are described by Vijayakar[30].Numerical examples carried out using this approach show the change in the contact area as a result of the misalignment of the gears.The changing stiffness of a cracking tooth was investigated in2D spur gears by an analytical model where the gear geometry was mapped to an elastic half-plane and stiffness of a cracked spur gear was calculated as a function of Mode I and II SIFs[31].3.1.ApproachThe goal of the present study is to perform contact analyses incorporating cracking to determine the ef-fect of changing toothflexibility on the magnitude and location of the contact load and,therefore,on the stress intensity factors.A commercialfinite element program,ABAQUS[32],was used to perform the con-tact analysis in conjunction with software developed by the Cornell Fracture Group to calculate fracture-related parameters.A general outline of the approach is as follows:1.Create initial geometry model of the spiral bevel pinion and gear with OSM using the geometry infor-mation provided by the NASA/GRC.2.Specify boundary conditions,material properties and contact surfaces in FRANC3D.3.Specify initial crack in FRANC3D.4.Create a surface mesh composed of triangular elements in FRANC3D.5.Create a3D FE mesh of the model composed of tetrahedra using JMesh.6.Transform the FRANC3D model into an ABAQUS inputfile.7.Perform contact analysis in ABAQUS and determine the location and magnitude of the contact loads.8.Calculate SIFs using the results of FEM contact analysis and also using the results from analysis withHertzian contact loads in pare these values and investigate their effects on the crack shape predictions.Geometries of a one-tooth sector of the spiral bevel pinion and gear were created separately in OSM using the information provided by NASA/GRC.This information regarding the geometric positions of points defining the gear set was determined analytically using the method developed by Litvin and Zhang [25].The one-tooth gear and pinion models were created in a common coordinate system with the same axis of rotation(z-axis).Additional teeth of the gear and pinion were created by copying and rotating the orig-inal tooth by an angle equal to360°divided by number of gear teeth.The resulting models were further rotated to orient them in the proper meshing position.At the meshing orientation,there was no interference between the gear and pinion teeth.The analyses used both FRANC3D and ABAQUS.FRANC3D was used to generate the complicated geometry of the gear,to specify the analysis attributes and to define the crack.Also,it was used as a post-processor to calculate the SIFs.ABAQUS was utilized forfinite element contact analysis of the model. In order to perform contact analysis on models with cracks,features that complement FRANC3D and ABAQUS were needed.In this respect FRANC3D was extended to include a capability of specifying the master and slave contact surfaces and to include a translator to convert the information regarding。
晶体自范性和自生成模板法结合生长组装多级纳米结构_谢毅

570
中国科学技术大学学报
第 38 卷
acted as the suppo rt fo r the co nst ruction of rutile TiO 2 3D hollow nanostructures . F urthermo re , VOOH hollo w “ dandelions” w ere sy nthesized owi ng t o the planar sheet nature of the bui lding blo cks in the newphased VOOH and the in-si tu produced N 2 gas bubbles as t he templates t hat acted as the sheet-like nanouni t ssupport er . Also , tit anat e 3D t ubular hierarchit ect ures w ere successfully prepared undergoing t he self-produced template methodolog y coupled w it h precurso r tem plat ing approach based on the similar st rategy . T he appearance of tit anat e nanof lakes i s actually the o ut w ard em bodiment o f the internal crystal st ructure , w hile the sacri ficed t em plat ing ef fect of the int ermediate precurso r of T iO x Cl2 -2x ( EN ) y is w ell underst ood . Key words : crystal g ro w th ; self-limi tatio n prope rty ;self-produced t emplate st rategy ; t hree-dimensi onal hie ra rchi tectures ; cry st al st ruct ure
胶质碳球为模板制备NiO空心球(英文)
( 南大 学化 学 广 162
摘 要 :以胶 质 碳 球 为 模 板 、 亚 甲基 四胺 为 沉 淀 剂 , 乙醇 中溶 剂 热 反应 , 经 5 0℃煅 烧 6h制 备 了 N O空 心 球 。 过 X 射 线 六 在 再 0 i 通
tme i r i lt t e i t g iy o h lo s he e .The we lde n d Ni hol w p e e c n b y t e ie i s c uca o h n e rt f t e hol w p r s l f e O lo s h r s a e s n h sz d i
p r us wa lc n itd o n sz d pa tc e .Mo e v r h o ma in me h n s o O lo s he e s a s o o l o sse fna o ie ril s r o e ,t e f r t c a im f Ni hol w D r s i lo o d S U s d. jC s e
,
均 一 的 NO 空心 球 。 得 产物 是 由 N O纳 米 粒 子 组 装 而 成 的具 有 多孔 结 构 的空 心 球 。 i 所 i 同时 , 本文 对 N O空 心 球 结 构 的形 成 过 程 i
和 可 能 机 理进 行 了分 析 和 讨 论 。
关键 词 :  ̄
g NO ; 心 球 ; 质 碳 球 ; 剂 热 ( i) 空 胶 溶
a ar i m lt a dh x m tyeee a ie HMT speii t gae t ne ao, n e ac e t ssei a t pae n ea eh1n tt m n ( )a rc t i g n i t n l ad t ncli d a c le r pan h h n
静电悬浮转子微陀螺信号发生电路有源带通滤波器设计

第21卷 第11期2008年11月传感技术学报CHINESE JO URN AL O F SENS ORS AND ACTUATO RSVol .21 No .11Nov .2008Design of the Active Band Pass Filter on the Signal Generator of the Electrostatically Suspended Micro Gyroscope*S H AO Dang -dang ,CH EN Wen -yuan *,X I AO Qi -jun ,CUI Feng ,Z H ANG Wei -pingResearch Institute o f Micr o /Nanometer Science an d Technolog y ,S hang hai J iaoton g Un iver sity ,S han ghai 200030,Ch inaA bstract :The signal generato r is the im po rtant par t o f the electrostatically suspended micro gy roscope sys -tem .This article introduces the principle and the structure of the DDS sig nal generator circuit .Acco rding to the request of the detailed band pass and the central frequency ,w e design the active filter circuit w ith different parameters .Throug h the sim ula tion of the circuit ,it com es out that the functio n is realizable .In the actual test ,we succeed to filter the direct current and the alternating current which generate from the circuit so that w e raise the to tal Sig nal -to -Noise and control precisio n o f the circuit and provide a g ood sig -nal g enerato r for the further circuit .Key words :micro gy ro sco pe ;electro static suspension ;direct dig ital sy nthesis ;active band pass filter EEACC :7630;1270静电悬浮转子微陀螺信号发生电路有源带通滤波器设计*邵珰珰,陈文元*,肖奇军,崔 峰,张卫平上海交通大学微纳科学技术研究院薄膜与微细技术教育部重点实验室,微米/纳米加工技术国家级重点实验室,上海200240基金项目:国家自然科学基金资助(60402003);国防预研基金资助(9140A 09020706JW 0314)收稿日期:2008-06-20 修改日期:2008-07-21摘 要:信号发生电路是静电悬浮转子微陀螺系统的重要组成部分。
钛酸钡纳米线
Surfactant-Free Hydrothermal Synthesis of Highly Tetragonal Barium Titanate Nanowires: A Structural InvestigationUpendra A.Joshi,†Songhak Yoon,‡Sunggi Baik,‡and Jae Sung Lee*,†Department of Chemical Engineering and School of En V ironmental Science and Engineering andDepartment of Materials Science and Engineering,Pohang Uni V ersity of Science and Technology(POSTECH),San31Hyoja-dong,Pohang790-784,KoreaRecei V ed:January2,2006;In Final Form:April26,2006Barium titanate nanowires synthesized with a surfactant-free hydrothermal method have been characterizedby various techniques such as transmission electron microscopy(TEM),scanning electron microscopy(SEM),synchrotron X-ray diffraction,X-ray photoelectron spectroscopy(XPS),and Raman spectroscopy.The TEMand SEM analyses show the uniform cylindrical nanowires.The Rietveld refinement with synchrotron X-raypowder diffraction showed that the lattice parameters of cubic and tetragonal phases were a()b)c))4.0134Åand a()b))3.9998Å,c)4.0303Å,respectively.The final weighted R-factor,R wp,was6.75%and the goodness of fit indicator was1.30.The mass fraction of tetragonal and cubic phases based on therefined scale factor for the two phases were98.4%and1.6%,respectively,which clearly show the nanowiresare tetragonal.The XPS analysis has shown that as-obtained BaTiO3nanowires were phase pure.The Ramanspectra confirm the tetragonal phase of the BaTiO3nanowires.The dielectric constant measurement showsthe shift in the transition temperature(T c)105°C)compared to the bulk transition temperature(T c)132°C).The dielectric constant at T c was174measured at1kHz frequency.1.IntroductionFerroelectronic oxides constitute an important class of mul-tifunctional compounds,attractive for numerous technologicalapplications such as thermisters,multilayer capacitors,andelectrooptical devices.Intense experimental efforts have beenmade recently in synthesizing and understanding ferroelectric(FE)nanostructures s BaTiO3dots,1rods,2wires,3and nano-tubes4s mainly because of their promise in increasing FE nonvolatile memory density thousands fold by reading andwriting into indi V idual nanoparticles.3,5,6Furthermore,thesestructures are also critical in light of miniaturizing piezoelectrictransducers and actuators,ultrasonic devices,and medicalimaging detectors.7,8From a fundamental point of view,ferroelectricity is caused by atomic off-center displacements,resulting from a delicate balance between long-range(LR)Coulomb interaction and short-range(SR)covalent interaction.9In nanostructures,both interactions and thus their balance arealtered with respect to bulk,since the LR interaction is truncateddue to lack of periodicity,while the SR one is significantlymodified near the surface boundary.With decreasing particle size in the BaTiO3perovskite lattice,an increase in cubic lattice parameter has been observed at roomtemperature.10-18These results are attributed to so-called size-dependent ferroelectric phase transition,which is the roomtemperature crystal structure transformation from tetragonal(ferroelectric phase)to cubic(paraelectric phase)with decreasingparticle size.Moreover,it is reported that cubic barium titanateis stabilized with expanded unit cell due to the existence ofhydroxyl ion incorporated in the lattice.19-21Depending on the transition temperature,BaTiO3has four kinds of crystal systems, i.e.,rhombohedral,orthorhombic,tetragonal,and cubic.There is an additional hexagonal modification reported by Megrew and Burbank et al.22,23Among them,the high-temperature form is the cubic phase and the stable phase at room temperature is the tetragonal phase.Cubic(space group:Pm3h m)BaTiO3has an ideal perovskite-type structure.The cubic phase transforms into a high-temperature hexagonal structure(space group: P63mmc)around1432°C.24A cubic-to-tetragonal structural phase transition occurs around132°C.The tetragonal BaTiO3 (space group:P4mm)has atomic displacements which exhibit ferroelectricity.This phenomenon implies that the phase trans-formation of BaTiO3may be a function of the temperature and the crystallite size.There is a crystallite size that makes it transform from tetragonal to cubic phase at room tempera-ture.12,25,26Depending on the synthetic methods there have been various critical sizes,ranging from25to200nm.27To predict the variation of physical properties of BaTiO3powder with the critical size,it is necessary to determine the critical size of various synthesis methods and to obtain the structural informa-tion.However,the dielectric constant of fine particles decreases with decreasing their size.It is known that the existence of impurities such as lattice hydroxyl(-OH)and carbonate(CO32-)groups in BaTiO3 particles considerably decreases the dielectric constant.Recently, Wada et al.28-30have succeeded in the preparation of BaTiO3 fine particles with very few lattice hydroxyl groups by means of a two-step thermal decomposition method from barium titanyl oxalate.The dielectric constant of the impurity-free BaTiO3fine particles increases with their decreasing size in the range from 430to140nm but decreases from140to40nm.30 Hydrothermal synthesis has been widely used for the prepara-tion of the nanostructured materials and shown to be effective in particular for the synthesis of nanowires,nanorods,and*To whom correspondence should be addressed.Phone:82-54-279-2266.Fax:82-54-279-5528.E-mail:jlee@postech.ac.kr.†Department of Chemical Engineering and School of Environmental Science and Engineering.‡Department of Materials Science and Engineering.12249J.Phys.Chem.B2006,110,12249-1225610.1021/jp0600110CCC:$33.50©2006American Chemical SocietyPublished on Web06/06/2006nanotubes.31,32It has advantages in reducing processing tem-perature and yielding a nearly site-ordered phase while produc-ing fine crystalline powders.Recently,we reported the template-free hydrothermal synthesis and investigation of the formation mechanism of single-crystalline barium titanate and strontium titanate nanowires.33As the structural data including lattice constants,atomic positions,and phase fraction are closely related to the physical properties,here we report the detailed structural characteristics of BaTiO3nanowires by means of the Rietveld refinement using X-ray powder diffraction data.The Raman spectroscopy and XPS analysis have been performed for the phase identification of BaTiO3nanowires along with dielectric measurements.2.Experimental Section2.1.Synthesis of Materials.All the operations were carried out in a glovebox filled with nitrogen in the absence of moisture or CO2.CO2-free water(distilled water boiled for15min in a nitrogen atmosphere)was used for all processes.In a typical synthesis,an equimolar amount of Ba(OH)2and TiO2particles (Merck)were mixed together in a mortar pester for1h in the presence of ethanol as a solvent.The mixture was taken out of the glovebox and transferred to a Teflon-coated reactor contain-ing water(20mL)and thereto(20mL of)liquid ammonia was added to adjust the pH above13.Then the reactor was put into hydrothermal reaction at a constant temperature(170°C)without disruption for3days.The as-synthesized white precipitate was washed with water and dried in an oven at60°C overnight.2.2.Characterization of Material.The product was char-acterized by a number of techniques,including scanning electron microscopy(FE-SEM,FEI XL30S),transmission electron microscopy(TEM,Philips CM-20with an accelerating voltage of200kV),field emission high-resolution transmission electron microscopy(FE-HRTEM,JEOL2100F),and selected area electron diffraction(SAED).The X-ray powder diffraction experiments were carried out on a8C2high-resolution powderdiffraction(HRPD)beamline at Pohang Light Source(PLS)in Pohang,Korea.The incident X-rays were monochromatized to the wavelength of1.5492Åby a double bounce Si(111) monochromator.The flat specimen was rotated in the plane of the specimen surface at60rotations/min during the scan to eliminate the influence of preferred orientation.The diffraction pattern was scanned from15°to131°(2θ)with a step length of0.01and a fixed counting time of3s.X-ray diffraction patterns have been fitted by means of a Rietveld refinement program,Fullprof,to determine the crystallite size and tetrago-nallity(c/a ratio)in the powder.A pseudo-Voigt function was chosen as a profile function among profiles in Fullprof.The composition of BaTiO3nanowires was determined by X-ray photoelectron spectroscopy(XPS,VG Scientific ESCALAB 220iXL).The spectrometer was equipped with a hemispherical analyzer and all XPS data presented here were acquired with use of Mg K R as the X-ray source(1253.6eV).All binding energies of various peaks were calibrated by using the binding energy of C1s(285.1eV).Raman spectra of various BaTiO3 nanowires were obtained with a NRS2100Raman spectrometer (JASCO,Japan)equipped with a triple-grating monochromator and a Coherent Innova90C Ar+-laser operating at514.5nm with the power of300mW.It has a spectral resolution of1 cm-1.The measurement was performed with a micro-Raman option,using a backscattering configuration.The dielectric constant measurement was performed on BaTiO3nanowire disks,using a HP4284A precision LCR meter with the four different frequencies,1,10,100,and1000kHz.Silver paste was coated on the disk as an electrode.For the measurement of dielectric constant as a function of temperature,the sample is heated at a rate of3deg/min from room temperature to the200°C.Fourier Transform Infrared spectra(FT-IR)of as-obtained nanowires were obtained with a FT-IR Instrument(MIDAC Corporation)attached with ICON FT-IR analytical software.3.ResultsA surfactant-free hydrothermal synthetic procedure for Ba-TiO3nanowires has been described in detail in our previous publication.33Representative transmission electron microscopy (TEM)images of the product obtained by hydrothermal reaction of TiO2particles and Ba(OH)2have been shown in Figure1. These images clearly show that BaTiO3nanowires have straight and uniform cylindrical structures with diameters in the range of50-200nm and lengths from a few to tens of micrometers. Figure1b shows several nanowires entangled in each other. These TEM images show that each nanowire has a uniform diameter along with their length.Figure2shows the SEM images of as-obtained BaTiO3nanowires.From Figure2a it is clear that the BaTiO3nanowires are of a straight and cylindrical structure with diameter of about50nm and lengths of several micrometers.The inset of Figure2a shows the tip of a nanowire, which clearly exhibits the circular cross section of the nanowires. Figure2b shows a single BaTiO3nanowire.It is observed from 30different samples that the as-synthesized product contained about ca.90%nanowires and about ca.10%nanoparticleaggregated.Figure1.TEM images of BaTiO3nanowires.12250J.Phys.Chem.B,Vol.110,No.25,2006Joshi et al.The evidence for the formation of single-crystalline BaTiO 3nanowires could be found in high-resolution TEM (HR-TEM)image (Figure 3a)and selected area electron diffraction (SAED)patterns along the [001]zone axis shown in Figure 3b.Figure 3a shows the lattice fringes of BaTiO 3nanowires.On the basis of the calculations of the lattice spacing and the analysis of its orientation,it was found that the nanowires grow perpendicular to [110].The HR-TEM images of BaTiO 3nanowires reveal that the surfaces of the nanowires are clean,very regular,and without any sheath of amorphous phase.This further confirms the single-crystalline nature of these nanowires.The SAED pattern in Figure 3b shows the sharp diffraction spots of (010)and (100)planes,which is characteristics of crystalline BaTiO 3.Further-more,the SAED patterns taken from different nanowires are identical,indicating that the nanowires are single crystals.Figure 4shows the Rietveld refinement patterns of as-synthesized BaTiO 3nanowires with use of the cubic and tetragonal phase model.The inset in Figure 4shows a close-up of the higher angle region.The least-squares fit of the pattern with use of the P 4mm and Pm 3h m symmetries in Fullprof yielded the structure parameters summarized in Table 1.The Rietveld refinement reveals that the structure model with two phases of the cubic and tetragonal components gives the best fit for the XRD pattern compared to the cubic phase or tetragonal phase alone.The lattice constants for BaTiO 3have been determined to be a )4.0134Åfor cubic phase and a )3.9998Åand c )4.0303Åfor tetragonal phase,which is in agreement with those for the corresponding bulk tetragonal materials (a )3.9947Åand c )4.0336Åat room temperature).34Figure 5shows theresults of the Rietveld refinement for the data of BaTiO 3nanowires,assuming three models:(a)cubic structure model,(b)tetragonal structure model,and (c)composite structure model with cubic and tetragonal components.Figure 6a,b showstheFigure 2.SEM images of BaTiO 3nanowires.Figure 3.(a)HR-TEM image of BaTiO 3nanowire and (b)selected area diffraction pattern of BaTiO 3nanowire.Figure 4.Powder X-ray diffraction data and calculated diffraction profiles from the Rietveld refinement of the tetragonal phases of BaTiO 3.The difference plots of observed and calculated diffraction profiles are shown below,and the short vertical markers represent the peak positions.The inset shows a close-up of the higher angle region.Synthesis of Highly Tetragonal BaTiO 3Nanowires J.Phys.Chem.B,Vol.110,No.25,200612251cubic and tetragonal crystal structure of BaTiO 3drown with use of refined crystal parameters.The green,light blue,and red spheres denote Ba,Ti,and O atoms,respectively.The tetragonal BaTiO 3(space group:P 4mm )has atomic displace-ments for Ti and O atoms as shown by the arrows in Figure 6b and exhibits ferroelectricity.The solid line denotes the unit cell.Figure 7a shows the survey scan XPS spectra of BaTiO 3nanowires.Figure 7b,c shows a deconvolution of spectra fitted with Gaussian shaped curves of Ba 3d 5/2and Ti 2p 3/2,respec-tively.Representative Raman spectra of BaTiO 3nanowires have been shown in Figure 8.The tetragonality of BaTiO 3wascharacterized by two peaks of 307and 715cm -1.As our BaTiO 3nanowires clearly show the peaks around 307and 715cm -1,it contains a large fraction of the tetragonal structure.To understand the dielectric properties of these BaTiO 3nanowires,we carried out the dielectric measurement.Figure 9shows the dielectric constant against the measuring temperature of BaTiO 3ceramic disk with different frequency.The ferroelectric transi-tion temperature (T c )determined by the dielectric maximum is 105°C.The dielectric constant shows considerable dispersion with frequency change.At low frequency the dielectric constant is high,and as the frequency increases,the dielectric constant decreases.This represents the behavior of a typical dielectric material.To investigate the presence of lattice hydroxyl groups we carried out FT-IR spectroscopy analysis.Figure 10shows the typical FT-IR spectrum of the as-obtained sample.It is evident that the sample shows the -OH stretching mode indicated by peaks at ∼3500and ∼1640cm -1.4.DiscussionsThe TEM images in Figure 1and SEM images in Figure 2clearly show that the nanowires are straight and without any branching.The confirmation for the single-crystalline nature of BaTiO 3nanowires can be given by HR-TEM and SAED patterns.The Rietveld refinement requires a structural model that has an approximation for the actual structure.The least-squares fit of the pattern with use of the P 4mm and Pm 3h m symmetries in Fullprof yielded the structural parameters sum-marized in Table 1.The initial Rietveld refinement was done by the zero-point shift,the unit-cell,and background parameters.After a good match in the peak position was achieved,the peak profile parameters including the peak asymmetry were refined.Figure 4shows the Rietveld refinement patterns of as-synthesized BaTiO 3nanowires,using the cubic and tetragonal phase models.The Rietveld refinement reveals that the structure model with a two-phase model of cubic and tetragonal com-ponents gives the best fit for the XRD patters compared to the cubic phase or tetragonal phase model alone.The final weighted R -factor R wp of the tetragonal phase model was considerably decreased from 8.42%to 6.75%compared to that of cubic.The profile factor R p was 4.63%.The indicator for goodness of fit indicator, 2,was decreased from 1.74to 1.34.When we use the two-phase cubic and tetragonal models,the 2value was 1.30,which is lower than that of the single tetragonal phase model and the weight percents of the tetragonal and cubic phase were 98.4%and 1.6%,respectively.TABLE 1:Refined Crystal Parameters and Reliability Factors of BaTiO 3Nanowires a,batomX Y Z U (10-2Å)tetragonal Ba 0.0000.0000.0000.61379P 4mmTi 0.5000.5000.475(5) 1.17987a )3.99984O10.5000.5000.029(1) 1.26313c )4.03033O20.5000.0000.528(2)0.21346atomX Y Z U (10-2Å)cubic Ba 0.0000.0000.000 2.57748Pm 3h m Ti 0.5000.5000.5000.89665a )4.0134O10.5000.5000.0001.53080aWeight fractions of tetragonal and cubic phases in BaTiO 3nanowires are estimated to be 0.984and 0.016,respectively.b R wp )6.75%, 2)1.30(R wp :reliability factors; 2:goodness of fit;U :isotropic thermalfactors).Figure 5.X-ray diffraction data for the {200}reflections dots and results of the Rietveld refinement (lines)for the data of BaTiO 3nanowires,assuming three models:(a)cubic structure model,(b)tetragonal structure model,and (c)composite structure model with cubic and tetragonalcomponents.Figure 6.Crystal structures of (a)cubic and (b)tetragonal BaTiO 3drawn by using refined crystal parameters.The green,light blue and red spheres denote Ba,Ti,and O atoms,respectively.The arrows in part b denote the direction of displacements for Ti and O atoms with respect to the Ba atom.The solid line denotes the unit cell.12252J.Phys.Chem.B,Vol.110,No.25,2006Joshi et al.The tetragonal phase has two peaks,(002)and (200),which are clearly separated near 2θ)45°,while only the (200)peak of the cubic phase lies between two tetragonal peaks.However,if the size of the crystallite decreases,the two separated peaks of the tetragonal phase may overlap because of the broadening of diffraction peaks.Figure 5shows the results of the Rietveld refinement for the data of BaTiO 3nanowires assuming three models (a)cubic,(b)tetragonal,and (c)composite structuremodel with cubic and tetragonal components.Among these three models,the composite structure model with cubic and tetragonal components,as shown in Figure 5c,gives the best fit.From the Rietveld refinement results,it could be concluded that as-synthesized BaTiO 3nanowires have mostly the tetragonal structure with a small portion of the cubic phase.WebelieveFigure 7.(a)Survey scan XPS spectra of BaTiO 3nanowires,(b)Ba 3d 5/2spectra,and (c)Ti 2p 3/2spectra.Figure 8.Raman spectra of BaTiO 3nanowires.Figure 9.Dielectric constant as a function of measuring temperature at various frequencies for BaTiO 3nanowiresdisk.Figure 10.FT-IR spectrum of as-obtained sample:peaks at ∼3500and ∼1640cm -1show the -OH stretching mode.Synthesis of Highly Tetragonal BaTiO 3Nanowires J.Phys.Chem.B,Vol.110,No.25,200612253that a small portion of the cubic structure originated from nanoparticles as the product contains a major portion of nanowires(ca.90%)and a small portion is made of particles (ca.10%).As the HRTEM and SAED pattern demonstrate that the nanowires are single crystalline without any sheath of amorphous phase,it is reasonable that the major reflection is of tetragonal phase from nanowires whereas the minor reflection is of cubic phase from nanoparticles.Considering the structural refinement results for cubic and tetragonal phases,the BaTiO3nanowires sample shows a major tetragonal phase.Yet,because their crystallite size is small enough,the X-ray diffraction peaks should have been broadened and it is difficult to perform the quantitative analysis with only X-ray diffraction data.Raman spectroscopy and XPS analysis as supplementary methods were chosen to identify the phase and purity of materials,respectively.We performed XPS studies in order to observe the oxidation state of the metal ions in the sample.Figure7a shows the survey scan spectra of BaTiO3nanowires.Panels b and c of Figure7 show a deconvolution of spectra fitted with Gaussian shaped curves of Ba3d5/2and Ti2p3/2,respectively.Two chemical states of Ba can be found:779.6eV is assigned to the Ba in the BaTiO3,while the higher energy at781.2eV is postulated as a Ba atom linked with the surface hydroxyl group.The binding energy of Ti2p3/2is mainly located at458.4and457.7eV. The former is consistent with that of BaTiO3and the latter can be interpreted as low valence Ti3+due to surface oxygen deficiency,which was also observed by other researchers.35,36 The formation of oxygen and/or barium vacancies must be accompanied by a change in the state of oxidation of the nearest-neighbor Ti atoms from Ti4+to Ti3+,to retain the local charge balance.The above results suggest that the planar defects can be formed due to the complex phenomena associated with Ti3+ and oxygen and/or barium vacancies.Raman scattering has been utilized as a powerful tool to investigate the tetragonal-cubic phase transition.37In fact, Raman spectroscopy is a highly sensitive spectroscopic tech-nique to probe the local structure of atoms in the materials.On the basis of the crystallography,only infrared active bonds without first-order Raman activity are predicted for cubic BaTiO3with a space group of Pm3h m.37,38However,eight Raman-active modes are expected for tetragonal BaTiO3with a space group of P4mm.37Therefore,only the tetragonal phase will show active vibration mode while the cubic phase will not show any active vibration modes.Room temperature Raman spectra of as-synthesized BaTiO3nanowires closely agree with those reported in the literature for tetragonal BaTiO3nano-powder37,39and show peaks nearly coincident with those of fundamental modes detected by Raman spectroscopy of tetragonal BaTiO3nanocrystals.40The BaTiO3having the cubic symmetry has15degrees of freedom for vibration,which are composed of one F1u triply degenerate acoustic mode and three F1u plus one F2u triply degenerate optical modes.41In the tetragonal phase,the F1u mode split into three A1plus three E modes,and the F2u mode split into B1plus an E mode due to the polarization between titanium and oxygen ions,while in the cubic phase neither the F1u nor the F2u mode is active.The four optical E modes for the tetragonal phase are doubly degenerate,which has the polariza-tion along the x-axis and the y-axis,and the three optical A1 modes are polarized along the z-axis.The E and A1modes are split into longitudinal(LO)and transverse(TO)components due to the long-range electrostatic forces associated with lattice ionicity.42-44,37In Figure8,the peaks at515,243,and185cm-1are assigned to the fundamental TO mode of A1symmetry,the peak at307cm-1to the B1mode indicating asymmetry within the TiO6octahedra of BaTiO3on a local scale.The weak peak around715cm-1is related to the highest frequency longitudinal optical mode(LO)with A1symmetry.These are typical peaks in the Raman spectrum for the tetragonal BaTiO3phase.If a peak at307cm-1is reduced in its sharpness and becomes indistinct then the tetragonal phase is not dominant.The strong peak at307cm-1suggests that the tetragonal phase is dominant in the as-synthesized BaTiO3nanowires.In addition,sharp peaks at185,515,and715cm-1indicate the formation of the tetragonal phase.Among these peaks,the peaks around305and 715cm-1disappear above the Curie temperature.This is the stable region for the cubic phase.This means that it is possible to discern between the cubic and tetragonal phases by the presence of the two peaks in the Raman spectrum.It is known that the Raman spectra of both tetragonal and orthorhombic phases of BaTiO3are similar.45The major difference,other than the difference in peak positions,is the appearance of a strong peak around190cm-1in the orthorhombic phase instead of the negative peak around180cm-1in the tetragonal phase.45 This is mainly due to the decoupling of the three A1(TO)modes in the orthorhombic phase.The presence of asymmetry in the 515cm-1peak in Figure8suggests the presence of coupling of TO modes associated with the tetragonal phase.This along with the absence of a peak at190cm-1proves that our BaTiO3nanowires have the tetragonal phase,not orthorhombic.These data are consistent with the XRD analysis.A study made by Cho39reports the tetragonal structure of BaTiO3particles20nm in size and supports our investigation. There have been several other reports on the critical size of the cubic-to-tetragonal transition and a variety of sizes have been proposed10,27,43,ranging from30to100nm.However,most of these reports involved the use of only powder XRD to analyze the grain size.Theoretical studies with use of the Ginsburg-Landau mean field approach were used earlier15to estimate the critical size(44nm)for the cubic-to-tetragonal phase transition in BaTiO3.Our study shows that the desired tetragonal phase dominantly exists in the BaTiO3nanowires prepared in the present work.Furthermore the synthetic method used here is simple,but versatile as we do not use any surfactant or template. As the nanowires obtained by the surfactant-free,hydrothermal method show high tetragonality,it should have a relatively high dielectric constant.Hence it could be used for the advancement of the device miniaturization and fabrication.Figure9shows the dielectric constant against the measuring temperature of BaTiO3ceramic disk with different frequency. The temperature of dielectric maximum obtained by various frequencies is lower(105°C)than the bulk material(132°C). This sift may be due to the defects in the crystal or the residual stresses.In the literature this shift is assigned to the size effect mainly due to long-range interaction between electric dipoles46,47 but some authors also assigned it to stress.48,49As such the dielectric constants of as-obtained nanowires are low(174at T c and1kHz),and there are many causes for size effects in ferroelectrics and it is often difficult to separate true size effects from other factors that change with the size of the sample.For instance,the extreme spreading of the results reported in the literature about the size effect in ferroelectric particles is associated with the variety of synthesis routes and processing techniques adopted.50The stability of the ferroelectric phase can be determined by additional factors such as defect chemistry, incorporation of foreign atoms and bulk hydroxyl groups, aggregation level of the particles,porosity level,residual12254J.Phys.Chem.B,Vol.110,No.25,2006Joshi et al.stresses,etc.,as these factors depends on synthesis routes.Generally,in ferroelectrics the boundary conditions can give astrong influence on the stability of the polar phase and on thenature of the size effect.51,52Because of the large electrostrictivecoupling between spontaneous lattice strain and polarization,the elastic boundary conditions must be pressiveor tensile stresses are expected to change the transition tem-perature of ferroelectrics.Gupta48correlate the effect of stressand particle size.They studied temperature-dependent Ramanspectra for sol-gel synthesized thin films(20,60,120,160,200nm)above and below the tetragonal-cubic phase trans-formation.Their conclusion shows that decrease in ferroelectrictransition temperature is due to stress but not due to particlesize effect.It is well-known that hydroxyl ions can reside as defects onoxygen sites within BaTiO3and the resulting charged defectsare probably compensated for by cation vacancies.53,54Severalspectroscopic studies have been carried out to characterize thisdefect.55-57Several authors have reported that infrared spectrafor hydrothermally prepared BaTiO3powders can be interpretedin terms of the presence of internal hydroxyls.19,58,59As a result,an intense peak is observed near3500cm-1in the IR spectrum.This peak is weak in the case of the Raman spectrum.Thepossibility that the charged defects might serve to stabilize polardomains in chemically prepared ferroelectric specimens of smallcrystalline size should also be considered.For fine hydrother-mally prepared BaTiO3powders,other authors have attemptedto separate the effect of hydroxyl defects and crystallite size onlattice structure.For instance,Hennings and Schreinemacher19clearly showed that the development of a room temperatureglobal tetragonal structure with heat treatment for BaTiO3nanoparticles of200nm diameter,and prepared under hydro-thermal conditions from acetate precursors,was associated withthe elimination of hydroxyl defect,and not with particle growth.In contrast,Begg,Vance,and Nowotny12concluded for hydro-thermal powders prepared from Ba(OH)2and hydrolyzedtitanium alkoxide that the release of water from the particleson heat treatment was not at all associated with the developmentof a tetragonal distortion observed by XRD.Recently,Spanieret al.60studied the ferroelectric phase transition in individualsingle-crystalline BaTiO3nanowires using scanning probemicroscope(SPM)and density functional theory(DFT)calcula-tions.Their study showed that as the diameter of the nanowiresdecreases the transition temperature(T c)decreases.The diameterat which T c falls below room temperature is determined to be ∼3nm.The DFT calculation indicates that ferroelectricity in nanowires is stabilized by molecular adsorbates such as OHand carboxylates,which is confirmed by FT-IR.In case of ourBaTiO3nanowires study,we essentially observed a similardecrease in transition temperature(T c)105°C);furthermore,the FT-IR spectrum(Figure10)also shows similar an-OHstretching mode at∼3500and∼1640cm-1observed byHennings et al.,19Begg et al.,12and Spanier et al.,60indicatingthat the samples contain hydroxyl groups.Finally,our studyshows that the as-obtained nanowires are highly tetragonal.Aferroelectric study shows the shift in transition temperature(T c)due to the nanosize effect in the nanowires.5.ConclusionsThe BaTiO3nanowires have been successfully synthesizedvia a surfactant-free hydrothermal process.The detailed struc-tural characterization of as-synthesized BaTiO3nanowires hasbeen carried out by means of the Rietveld refinement,usingX-ray powder diffraction,TEM,HR-TEM,SEM,Raman spectroscopy,and XPS analysis.The TEM and SEM analyses show that the nanowires have uniform cylindrical structure with diameters of50-200nm and lengths from a few to tens of micrometers.The HR-TEM images of BaTiO3nanowires reveal that the surfaces of nanowires are clean,very regular,and without any sheath of amorphous phase.The Rietveld refinement with use of X-ray powder diffraction results shows that the BaTiO3nanowires are made of a mixture of tetragonal(the major)and cubic phases.The mass fraction of tetragonal and cubic phases based on the refined scale factor for the two phases was98.4%and1.6%,respectively.The lattice constants for BaTiO3nanowires were determined as a)4.0134Åfor the cubic phase and a)3.9998Åand c)4.0303Åfor the tetragonal phase.Further evidence for the presence of the tetragonal phase in the sample could be found in Raman analysis.The sharp peaks at185,307,515,and715cm-1signify the tetragonal phase.The phase purity of as-synthesized BaTiO3 nanowires has been confirmed by XPS analysis.From the study of structural characterization it can be concluded that the BaTiO3 nanowires synthesized by the surfactant-free hydrothermal process show high tetragonality.But as we synthesized the nanowires by using ammonia,hydroxyl impurities are incor-porated.The presence of the hydroxyl ion is clearly evident from the FT-IR spectrum.The ferroelectric study shows that the transition temperature shifted to the lower values because of the size effect.Acknowledgment.This work has been supported by the National Research Laboratories Program.We appreciate the support of the Korea Ministry of Education and Human Resources Development through the BK21program.U.A.J. thanks Mr.Moongi Jeong and Mr.Young Kyu Jung of the Material Science Department for dielectric measurements and Dr.Namsoo Shin,8C2beam line of PAL,for helpful discus-sions.References and Notes(1)O’Brien,S.;Brus,L.;Murray,C.B.J.Am.Chem.Soc.2001,123, 12085.(2)Urban,J.J.;Yun,W.S.;Gu,Q.;Park,H.J.Am.Chem.Soc.2002, 124,1186.(3)Yun,W.S.;Urban,J.J.;Gu,Q.;Park,H.Nano Lett.2002,2,447.(4)Luo,Y.Appl.Phys.Lett.2003,83,440.(5)Scott,J.F.;Paz de Araujo,C.A.Science1989,246,1400.(6)Auciello,O.;Scott,J.F.;Ramesh,R.Phys.Today1998,51,22.(7)Lines,M. E.;Glass, A.M.Principles and Applications of Ferroelectrics and Related Materials;Clarendon:Oxford,UK,1979.(8)Uchino,K.Piezoelectric Actuators and Ultrasonic Motors;Kluwer Academic:Boston,MA,1996.(9)Cohen,R.E.Nature1992,358,136.(10)Uchino,K.;Sadanaga,E.;Hirose,T.J.Am.Ceram.Soc.1989,72, 1555.(11)Schlang,S.;Eicke,H.F.Solid State Commun.1994,91,883.(12)Begg,B.D.;Vance,E.R.;Nowotny,J.J.Am.Ceram.Soc.1994, 77,3186.(13)McCauley,D.;Newnham,R.E.;Randall,C.A.J.Am.Ceram. Soc.1998,81,979.(14)Suzuki,K.;Kijima,K.J.Mater.Sci.2005,40,1289.(15)Wang,Y.G.;Zhong,W.L.;Zhang,P.L.Solid State Commun. 1994,90,329.(16)Akdogan,E.K.;Safari,A.Jpn.J.Appl.Phys.2002,41,7170.(17)Tsunekawa,S.;Ishikawa,K.;Li,Z.-Q.;Kawazoe,Y.;Kasuya,A. Phys.Re V.Lett.2000,85,3440.(18)Tsunekawa,S.;Ito,S.;Mori,T.;Ishikawa,K.;Li,Z.-Q.;Kawazoe, Y.Phys.Re V.B2000,62,3065.(19)Hennings,D.;Schreinemacher,S.J.Euro.Ceram.Soc.1992,9, 41.(20)Noma,T.;Wada,S.;Yano,M.;Suzuki,T.J.Appl.Phys.1996, 80,5223.(21)Shi,E.W.;Xia,C.T.;Zhong,W.E.;Wang,B.G.;Feng,C.D.J. Am.Ceram.Soc.1997,80,1567.(22)Megaw,H.D.Proc.Phys.Soc.1946,58,133.Synthesis of Highly Tetragonal BaTiO3Nanowires J.Phys.Chem.B,Vol.110,No.25,200612255。
Geometric Modeling

Geometric ModelingGeometric modeling is a crucial aspect of computer graphics and design,playing a significant role in various industries such as architecture, engineering, and animation. It involves creating digital representations of objects and environments using mathematical and computational techniques. This process allows for the visualization, analysis, and manipulation of complex geometric shapes, ultimately contributing to the development of innovative products and designs. However, like any technological field, geometric modeling presents its own set of challenges and limitations that need to be addressed. One of the primary challenges in geometric modeling is the accurate representation of real-world objects and environments. Achieving precise and realistic depictions requires a deep understanding of mathematical concepts such as curves, surfaces, and solids. Additionally, the integration of texture, lighting, and shading furthercomplicates the process, as these elements contribute to the overall visual appeal and authenticity of the model. As a result, geometric modelers often face the daunting task of balancing mathematical precision with aesthetic quality, striving to create visually appealing representations that accurately reflect the physical world. Moreover, the scalability of geometric modeling presents anothersignificant challenge. As the complexity and size of models increase, so does the computational demand required for their creation and manipulation. This can leadto performance issues, particularly in real-time applications such as video games and virtual simulations. To address this challenge, geometric modelers must constantly innovate and optimize their techniques to ensure that large-scale models can be efficiently handled and rendered without compromising quality. In addition to technical challenges, geometric modeling also raises ethical considerations, particularly in the context of virtual reality and simulation. The ability to create highly realistic and immersive environments has the potential to blur the lines between the virtual and physical worlds, raising questions aboutthe ethical use of such technology. For instance, the creation of lifelike simulations for training or entertainment purposes may have unintended psychological effects on users, blurring their perception of reality. As such, itis crucial for geometric modelers to consider the ethical implications of theirwork and strive to use their skills responsibly. Despite these challenges, the field of geometric modeling continues to evolve, driven by advancements in technology and the increasing demand for realistic digital representations. Innovations such as 3D scanning and printing have revolutionized the way geometric models are created, allowing for the direct conversion of physical objects into digital form. Additionally, the integration of artificial intelligence and machine learning has the potential to streamline the modeling process, automating repetitive tasks and enabling more efficient creation of complex geometries. Ultimately, the future of geometric modeling holds great promise, as it continues to push the boundaries of what is possible in the digital realm. By addressing the challenges and ethical considerations inherent to the field, geometric modelers can harness the full potential of their craft, contributing to the creation of captivating virtual worlds, groundbreaking designs, and innovative technological solutions. As technology continues to advance, the role of geometric modeling will only become more prominent, shaping the way we interact with and perceive the world around us.。
基于元素成分预测等轴组织TC4钛合金室温抗拉强度的模型
基于元素成分预测等轴组织TC4钛合金室温抗拉强度的模型王飞;周隐玉;张超【摘要】基于Jmatpro软件和固溶强化理论,对随机取样的样本数据进行归纳,建立了等轴组织TC4钛合金元素成分对于室温抗拉强度的预测模型,对比三次多项式拟合模型和交叉相互作用模型发现各元素之间的相互作用微弱,与Jmatpro软件计算结果相比,两种模型的预测精度均较高.验证试验结果表明:与TC4钛合金实测抗拉强度相比,两种模型的预测误差均小于10 MPa,且与Jmatpro软件计算的结果相吻合,说明所建立模型简单易用,具有实际应用价值.%Based on Jmatpro software and solid solution strengthening theory,the models for predicating room temperature tensile strength of TC4 titanium alloy with equiaxed structure according to element compositions were established by summarizing the sample data with random distribution.By comparing the cubic polynomial fitting model and the interaction model,it was found that the interaction among different elements was weak. Compared with the calculating results of Jmatpro software,the prediction accuracies of the two models were both very high.The verification test results show that compared with the measured tensile strength of TC4 titanium alloy,the prediction errors of the two models were both less than 10 MPa,and the predicating results was consistent with those calculated by Jmatpro software,which showed that the established models were simple and easy and had practical application value.【期刊名称】《理化检验-物理分册》【年(卷),期】2017(053)010【总页数】5页(P707-711)【关键词】TC4钛合金;等轴组织;元素成分;抗拉强度;预测模型【作者】王飞;周隐玉;张超【作者单位】上海材料研究所,上海 200437;上海材料基因组工程研究院,上海200444;上海材料研究所,上海 200437;上海材料基因组工程研究院,上海 200444;上海材料研究所,上海 200437【正文语种】中文【中图分类】TG166.5;TG115.5金属钛及其合金具有比强度高、生物相容性好、耐腐蚀能力强等特点,在航海、石油、宇航、化工、医疗等行业被广泛应用[1]。
谐波齿轮传动非线性动力学建模及仿真研究
谐波齿轮传动非线性动力学建模及仿真研究罗阳1,2陈满意1,2张杰3杨燃3张瀚3(1武汉理工大学机电工程学院,湖北武汉430070)(2武汉理工大学绍兴高等研究院,浙江绍兴312000)(3浙江来福谐波传动股份有限公司,浙江绍兴312000)摘要由于结构的特殊性,迟滞刚度和动态摩擦属于谐波齿轮传动的固有属性。
传统模型将刚度考虑为定刚度或分段刚度模型,摩擦考虑为静态摩擦模型,这样的简化会导致谐波齿轮传动的动态分析精度下降。
为了提高谐波齿轮传动的动态分析精度和传动性能,考虑非线性迟滞刚度和动态摩擦现象,提出了一种基于记忆特性迟滞刚度和LuGre动态摩擦的谐波齿轮传动动力学模型,建立了相应仿真模型,讨论了谐波齿轮参数对系统输出的影响。
结果表明,“刚度迟滞现象”导致系统输出值减小,传动效率降低;传动刚度系数越大,系统越稳定;阻尼转矩系数越大,传动效率越低。
关键词谐波齿轮传动迟滞刚度LuGre摩擦模型动力学建模仿真Research on Nonlinear Dynamics Modeling and Simulation of Harmonic Gear Drive Luo Yang1,2Chen Manyi1,2Zhang Jie3Yang Ran3Zhang Han3(1School of Mechanical and Electronic Engineering,Wuhan University of Technology,Wuhan430070,China)(2Shaoxing Institute for Advanced Research,Wuhan University of Technology,Shaoxing312000,China)(3Zhejiang Laifual Drive Co.,Ltd.,Shaoxing312000,China)Abstract Due to the particularity of the structure,the hysteretic stiffness and dynamic friction belong to the inherent properties of harmonic gear drive.Traditional models consider the stiffness as a fixed stiffness or segmented stiffness model,and the friction as a static friction model.Such simplification will lead to the de⁃crease of the dynamic analysis accuracy of harmonic gear drive system.In order to improve the dynamic analysis accuracy and transmission performance of harmonic gear drive,considering the nonlinear hysteretic stiffness and dynamic friction phenomenon,a dynamics model of harmonic gear drive based on memory characteristic hystere⁃sis stiffness and LuGre dynamic friction is proposed,and the corresponding simulation model is established.The effects of harmonic gear parameters on the system output are discussed.The results show that the stiffness hys⁃teresis phenomenon leads to the decrease of system output and transmission efficiency,the larger the transmis⁃sion stiffness coefficient,the more stable the system,the larger the damping torque coefficient,the lower the transmission efficiency.Key words Harmonic gear drive Hysteresis stiffness LuGre friction model Dynamics modeling Simulation0引言谐波齿轮传动系统作为工业机器人和航天航空设备中传递运动和力的关键部件,其动态性能和精度是衡量整机性能的重要指标。
基于三维扫描和球谐分析的骨料和再生骨料颗粒形状表征

沈阳建筑大学学报(自然科学版)Journal of Shenyang Jianzhu University (Natural Science)2 02 0年9月第36卷第5期Sep 2020Vol. 36, No. 5文章编号:2095 -1922(2020)05 -0827 -09 doi :10.11717/j. issn :2095 -1922.5220.55.57基于三维扫描和球谐分析的骨料和再生骨料颗粒形状表征苏栋吴炯7肖政健7黄聪7(1.深圳大学土木与交通工程学院,广东深圳517066;2.滨海城市韧性基础设施教育部重点实验室(深圳大学),广东深圳517060)摘要目的探讨骨料颗粒的表征方法,研究点云数据的点数对表征参数的影响,以 及普通混凝土骨料颗粒和再生混凝土骨料颗粒几何特性的异同.方法利用数字光学投影(Digital Lighu Projection,DLP )成像技术对混凝土骨料颗粒进行三维扫描,获取 颗粒表面点的三维几何坐标,基于球谐函数分析(Spherical Harmouio Analyses )对不 规则颗粒进行三维重构和表征分析.结果重构的普通和再生骨料颗粒的最优点数分 别是30 000和55 000,两种骨料的球形度指标基本相同,但再生骨料的凸性较小;两种骨料的轴比指标接近,大部分骨料都属于球体形.结论数字光学三维扫描结合球谐函数计算可以对骨料颗粒进行精确重构和表征分析.关键词骨料颗粒;形状表征;三维扫描;球谐函数;最优点数中图分类号TU52文献标志码AGeometrical Characterization of Natural and RecycledAggregate Particles Based on 3D Scanning andSpherical Harmonia AnalyseeSU Dong 1,,WU Jiong 1 ,XIAO Zhengjian 1 , HUANG Cong 1(1 . Collepc of Civil ani 丁0血)0081100 Engineering , Shenzhen University , Shenzhen , Chinl, 5 1 2066; 2. Unnernroond Polls Acalemy , Shenzhen University , Shenzhen , Chirm , 5 1 9060)Abstract :3D scanning o f cencreta anhspata particles wrn performer by nsinnLighi Projection tecenolooy , ald 3D heometUc ceoOinates oO the particle snrface points were obuined. Sphericel harmonic functioo wcs nsen ta cendnct accurate tUree-dimensioucl recenshnction anZ characterizatioo oO 11X0)11110 particOs. Geemethc parameters oO reccustmcten parhcOs,he inOnence oO the numbes oO cloon points on particle characteOzation , as well as the similarities and differences in h^cmetric features oO 0x 0010 and receded anhspates are disetssed. The resnlts show that the收稿日期:2022 -04 -12基金项目:国家自然科学基金项目(5193202,51272416)作者简介:苏栋(1977—),男,教授,博士研究生导师,主要从事颗粒几何形态表征、土与结构相互作用等方面研究.828沈阳建筑大学学报(自然科学版)第36卷optimal numbes oO points are30000anZ50000foe ordinarf and receded achepates,resnectively. There is no significanr hiffednee in the sphedcith oO the two tyyes oO achopates,bet the ccnvexity oO receded achopates is henedOe smalleo.The asnect ratios oO the two tyyes oO achopates are closs and mosh oO he particles belonz to spheoiV.Key wordt:ceucrete achopate;hepmewic chaoctedzation;tUree-dimedsional scanninz;sphedcal harmonic functioo;the000x1101numbes骨料颗粒是建造行业重要的原材料,需求量大且质量要求较高,再生骨料的使用对绿色建筑的发展有重大意义,是混凝土行业实现可持续发展的重要途径[1-2].骨料在混凝土中主要起骨架和填充作用,同时可以减少混凝土硬化过程中因干缩湿胀引起的体积变化,而在硬化后,混凝土骨料颗粒的三维几何特征对混凝土的力学性能起重要作用卩-1.目前,国内外对混凝土骨料颗粒的几何特性研究虽然为数不少,但是很长一段时间都集中在混凝土骨料颗粒的二维几何特性方面,在三维层面上的研究的方法较为局限,研究手段单一,研究成果也较少.J.M.R.Fernlund等⑸提出了一种基于图像分析的粗骨料颗粒形状测定方法,该方法通过颗粒平躺和站立姿态的两张图像分析颗粒的长厚比、长宽比和宽厚比,其结果与片状和形状指数试验的测试结果接近.D.ASAHNA等⑷利用三维激光扫描仪(LS)经典投影面积法(PAM)和现代X射线计算机断层扫描(CT),对同一套岩石进行扫描,获得岩石表面点的坐标,并估算出其体积、比表面积和密度.D.SU等⑺和付茹等⑻通过“XCT试验,获取砂土颗粒的三维像素信息,并基于球谐函数对砂土颗粒的几何形态进行了分析和表征.研究表明,通过CT试验获取颗粒几何形态数据的成本较高,且适用的粒径范围较窄;而基于球谐函数分析,可准确表征三维颗粒不同层级的几何特性.基于上述分析,笔者通过数字光学投影(Digital Light Projection,DLP)成像技术对混凝土骨料颗粒和再生骨料颗粒进行非接触式三维扫描,获取颗粒表面的点云数据;利用基于球谐函数的计算几何分析,得到颗粒三维几何特性参数,包括表面积、体积、球形度、凸性和主要尺寸(长轴、中轴和短轴)等;基于计算结果,对混凝土骨料和再生骨料颗粒的几何形态进行了对比研究.结果表明:两种骨料颗粒的球形度指标基本相同,但再生骨料的凸性较小;两种骨料的轴比指标接近,大部分颗粒都属于球体形.1骨料颗粒三维扫描和颗粒表面点云模型的建立1.1骨料颗粒预处理及三维扫描从某建筑材料堆放场随机选取190个普通骨料颗粒(颗粒编号1~100)和190个再生混凝土骨料颗粒(颗粒编号191-220)进行三维扫描以获取颗粒表面的点云数据.首先浸泡、洗净混凝土骨料颗粒,保持样本混凝土骨料颗粒表面的洁净和真实,再将混凝土骨料颗粒烘干;由于DLP技术对所扫描的混凝土骨料亮度有一定的要求,因此扫描前利用着色剂对混凝土骨料颗粒进行着色处理,如图1所示.图1着色处理后的混凝土骨料颗粒Fig.l A cencreta aggogata particle aOco celoringWeatment第5期苏栋等:基于三维扫描和球谐分析的骨料和再生骨料颗粒形状表征829笔者采用华朗三维扫描仪(型号:HL- 3DX + )对混凝土骨料颗粒进行三维扫描,该 扫描仪基于数字光学投影原理,并配备了两种模式的摄像头和高质量的投影仪,确保了云点的高分辨率.基于三角测量原理,三维扫描仪放映机对扫描对象发出格栅光线,经过物体反射后通过立体相机接收其反射光束,将获 得的两条光线信息建立立体投影关系,通过两个摄像头的和投影扫描点构成了一个三角形,运用三角测距原理来对被测物体进行坐标点 的解算,最后得到了被测点的三维坐标.该扫 描仪可以扫描几毫米到几十米大小的物体,通过扫描软件的全自动智能拼接功能可实现骨 料颗粒表面三维点云模型的建立(见图9).图2颗粒三维点云模型Fig. 2 3D point cloud model of a particle1.2骨料颗粒三维点云模型的精简通过三维扫描得到各颗粒的点云数据一般超过290 000个点,这些点云数据虽然精度高,但数据密度也比较大,存在大量的冗余 数据,且不同颗粒的点云数据存在一定差异, 在使用程序处理和计算不同数量点的颗粒表面特征时,运行的时间有较大的区别.因此,在保留点云数据特征点的情况下,对这些点云数据进行数据精简处理,以提高计算效率,减少存储空间.笔者把1 ~ 100号混凝土骨料颗粒的点云精简成100 000、82 000 ,55 000、30 000、29 000、10 000、8 000、5 000、3 000 个点,把10 1 ~290号再生混凝土骨料颗粒的点云精简成 105 000,100 000,80 000,55 000 ,30 000,22 000,10 000个点进行分析计算,以找到能表征骨料颗粒三维几何特性最适合的点云数量.图3给出了一颗普通混凝土骨料在点云精简过程中的模型变化.2骨料颗粒三维形态的重构获得骨料颗粒的精简模型后,提取各个精简模型数据点的三维几何坐标,再基于球谐函数重构颗粒的三维形态.三维颗粒表面 形态的重构包括以下步骤J )确定颗粒中心的坐标和主惯性轴的方向;2)将坐标系的原点移至颗粒中心,旋转颗粒,使颗粒的三个主惯性轴方向分别与坐标系的x 轴,y 轴和z 轴一致;3)计算颗粒表面每个数据点的在坐标系中的极角和方位角;4)利用颗粒点云的极图3普通混凝土骨料在点云精简过程中的模型变化Fig. 3 Model evolutiou during the process of cloud poinireductiou230沈阳建筑大学学报(自然科学版)第36卷角和方位角和三维直角坐标进行球谐分析和颗粒表面形态重构•重构颗粒表面的顶点坐标集表示为X二(c,,),通过球谐分析,其将表示为相应极角和方位角的函数,即:X(0,°)二(x(0,°),y(0,°),)(0,卩)).(1)式中2和分别极角和方位角⑺•对于三维星形颗粒,由于颗粒表面任何一点到原点的距离(即半径)是0和cp的单值函数,因此只需要对半径厂进行球谐展开,即:8g厂(O,p)=Y Y c:n Y:(0,p)•(2)=0m=-g式中2篇为球谐函数系数;(0,p)定义为加M0时,Y(%)槡2;;99儒!乜(us”coss m p).(3)加<0时,Y m(o,p)二/(2g+1)(g-Iml)!槡4n(g+ImI)!P g mI(110)cas(I ml p).(4)式中:Pm(case)为与g度、m阶有关的勒让德函数(Lepeddre functioo),勒让德函数的表达式为P m(c)=(-1)m(1-x2)"f m P g()•(5)d x式中:P“()是g次勒让德多项式.需指出,式(2)中g的取值决定了颗粒重构模型的精度⑺,一般g值越大,精度越高,但重构过程中的计算量越大,本研究取二1进行骨料颗粒表面的重构和几何形态分3三维骨料颗粒几何形态表征分析基于球谐函数和计算几何,对重构骨料颗粒的三维几何形态进行表征,计算并比较的几何特性参数包括表面积、体积、球形度、凸性、主尺度(长轴、中轴和短轴)等.对于天然骨料,以100000个数据点的颗粒模型的分析结果为基准,其他精简模型的分析结果与其对比,以找出能表征骨料颗粒三维几何特性最优(最少)的数据点个数.3・1表面积利用基于球谐重构的表面网格计算骨料颗粒的表面积,其为所有微面元面积的总和⑻,即卩s a=Y1n x质•(6)式中:S a为骨料颗粒表面积;•和C o分别为第o个面元所包含的顶点.对比基于各精简模型与基于100000数据点模型计算出的表面积,计算误差百分比,以混凝土骨料颗粒的标号为横坐标,表面积误差百分比为纵坐标,结果如图4所示.从图中可以看出,3000个数据点模型所计算出的表面积中有个别骨料颗粒的误差较大,最大的一个超过3%,这说明在该模型中,颗粒较多局部特征已经丢失,导致个别形状比较特殊的骨料颗粒在计算中出现较大的误差.图4同时表明,当数据点超过5000时,表面积计算误差基本低于15%,超过30000点时,计算误差已经基本小于1%.图4各精简模型表面积计算误差Fn4Calculatiou erroo oO sprfaca aree based ou each simplified100134体积采用球谐函数的实数表达形式,可通过式(7)计算重构骨料颗粒的体积⑼:y=\[((O,p)siZd0dp.(7)第5期苏栋等:基于三维扫描和球谐分析的骨料和再生骨料颗粒形状表征831对比基于各精简模型与基于100000数据点模型计算出的体积,计算误差百分比,结果如图5所示.基于各精简模型计算的体积与100000点模型体积的误差均低于】%,当数据点超过5000时,计算误差基本低于0.8%,超过30000点时,计算误差已经基本小于0.4%.对比图4和图5,各精简模型的体积误差小于表面积误差,说明体积指标比表面积指标对精简点数量不同而产生误差的敏感度低.0102030405060708090100混凝土骨科颗粒编号图5各精简模型体积计算误差Fig.2Calcelatiou errut of volumv based ou each simplified modvC3.2主要尺寸主要尺寸包括长轴Q、中轴b和短轴c,它们是直接描述颗粒形状或评估其他形状描述指标的重要参数3一⑵.为了评估主要尺寸,首先基于主成分分析确定重建颗粒表面的主轴的方向.旋转重建骨料颗粒以使主轴与笛卡尔轴对齐,然后即可测量主尺寸Qb 和c⑴-⑷.对比基于各重构模型与100000数据点模型计算出的长轴、中轴和短轴,计算误差如图6、图7和图8所示.由图6可知,3000个数据点模型所计算出的长轴有个别骨料颗粒的误差较大,最大的一个超过12%,这说明在该模型中,由于较多局部特征的丢失,颗粒形状与原形状已经出现较大的区别.当模型数据点超过30000时,计算误差基本低于4%,0000数据点模型的长轴误差基本低于】%•由图7和图8可知,中轴和短轴的计算误差规律与长轴基本一致.Fig.6Calcelatiou errot of major axicFig.2Calcelatiou evoe of intermediate axicFig.2Calcelatiou errot of migot axis3.2球形度球形度(S)用来衡量颗粒与球体的接近程度•将球形度定义为等同球体(具有与被研究颗粒相同体积)的表面积与颗粒表面积的比值[⑸:S槡36nU2()对比基于各精简模型与基于100000数据点模型计算出的球形度,计算误差百分比,结果如图9所示.3000个数据点模型所计算出的球形度有个别骨料颗粒的误差较大,最大的一个接近3%.当数据点超过5000时,误差基本低于04%,超过3。
- 1、下载文档前请自行甄别文档内容的完整性,平台不提供额外的编辑、内容补充、找答案等附加服务。
- 2、"仅部分预览"的文档,不可在线预览部分如存在完整性等问题,可反馈申请退款(可完整预览的文档不适用该条件!)。
- 3、如文档侵犯您的权益,请联系客服反馈,我们会尽快为您处理(人工客服工作时间:9:00-18:30)。
A. E. Jacobs1 ∗ , S. H. Curnoe2 † and R. C. Desai1 ‡
2
arXiv:cond-mat/0302388v2 [cond-mat.mtrl-sciห้องสมุดไป่ตู้ 19 Dec 2003
Department of Physics, University of Toronto, Toronto, Ont., M5S 1A7, Canada Department of Physics and Physical Oceanography, Memorial University of Newfoundland, St. John’s, Nfld. & Lbdr., A1B 3X7, Canada (February 6, 2008)
1
We study domain patterns in cubic-tetragonal ferroelastics by solving numerically equations of motion derived from a Landau model of the phase transition, including dissipative stresses. Our system sizes, of up to 2563 points, are large enough to reveal many structures observed experimentally. Most patterns found at late stages in the relaxation are multiply banded; all three tetragonal variants appear, but inequivalently. Two of the variants form broad primary bands; the third intrudes into the others to form narrow secondary bands with the hosts. On colliding with walls between the primary variants, the third either terminates or forms a chevron. The multipy banded patterns, with the two domain sizes, the chevrons and the terminations, are seen in the microscopy of zirconia and other cubic-tetragonal ferroelastics. We examine also transient structures obtained much earlier in the relaxation; these show the above features and others also observed in experiment. PACS numbers: 81.30.Kf, 62.20.Dc I. INTRODUCTION
interface (no dislocations or disclinations), ferroelastic domain walls rotate the variants as well as join them, and (b) order-parameter strains alone are insufficient to understand the patterns. Disclinations, which have no counterpart in Ising and Potts systems, are generated however by wall collisions; they dominate patterns especially in H-O-like systems (e.g. trigonal-monoclinic lead orthovanadate). Much of ferroelastic theory follows Barsch and Krumhansl5 in expanding the free-energy density in powers of the strains and their derivatives. Analytical results are possible in a few cases5,6 , but structures formed by colliding walls require numerical effort for their understanding. Such studies7–9 in 2d gave static and transient domain patterns that reproduced nearly all aspects of those observed in H-O-like and T-O ferroelastics. Ref. 10 obtained similar results. An alternative approach, phase-field theory11 , predates Ref. 5 and has also been used extensively to understand domain patterns in H-O-like materials12 , C-T materials13,14 , etc. Ref. 15 discusses differences between the two approaches. And other lines have been pursued. In C-T ferroelastics, domain walls joining two tetragonal variants lie optimally in the cubic 110 planes16 and are then twin walls. In the solutions5,17,18 for the twin wall, the strains depart only locally from their bulk values, decaying exponentially with distance from the wall. Of course domain walls need not lie in the cubic 110 planes; they are then not twin walls, and the departures decay algebraically19. Optical and electron microscopy of zirconia20–22 , leucite23,3 , barium titanate2 and other24 C-T ferroelastics reveals a variety of patterns. The structures2 of small and large grains are respectively lamellar (with only two variants) and banded (with all three); the latter seems unique to C-T materials. The lamellar ↔ banded transition is understood2,25 , though the analysis is apparently limited to variants oriented at π/2. Other as-
Ferroelastics1–3 are crystalline solids that undergo a shape-changing, structural phase transition with decreasing temperature T . The high-T or parent phase distorts spontaneously at the transition temperature Tc to form one or more products or variants with identical energies but different orientations. In cubic-tetragonal (C-T) ferroelastics for example, only one of three four-fold axes is retained below Tc , giving three variants. Due to constraints imposed by neighbouring material, a single variant is found only rarely, perhaps only in very small grains; the displacement resulting from a strain of 10−4 in a grain of size 10 µm (both typical values) is an order of magnitude too large to be accommodated by atomic rearrangements at grain boundaries. Multiple variants can arise also from independent nucleation events. An external stress can move the walls that separate the variants, so converting one variant to the other(s) at little cost in energy; the process has been observed for example by neutron diffraction of zirconia4. Related phenomena are strongly hysteretic stress-strain relations, shape-memory effects, etc3 . Pockets of the parent phase can persist below Tc , until the gain in condensation energy overcomes the cost of introducing domain walls. Compositional inhomogeneities combined with a strong dependence of Tc on composition can also smear the transition, in cases to over 100 K; it is common to speak instead of a transformation. Domain patterns in ferroelastics have nothing in common with those in conventional order-parameter systems. Two-dimensional (2d) patterns in tetragonalorthorhombic (T-O) ferroelastics like YBa2 Cu3 O7−δ resemble not at all those in 2d Ising models, though both have two variants; neither can 2d patterns in hexagonalorthorhombic (H-O) ferroelastics be understood from 2d three-state Potts models, both with three. The difference arises because (a) in order to maintain a coherent 1