arcgis Editor工具条操作教程
Arcgis-editor数据编辑
用方位及长度创建线
中国科学院计算技术研究所教育中心
技巧 1.指定方位可用Ctrl+A 2.指定长度可用Ctrl+L 3.使用Direction/Length命令(或快捷键 Ctrl+G),可一次指定方位和距离 4.使用Deflection命令(或快捷键Ctrl+F),指 定与最后一条线段的夹角,大部份情况下这更 有用
Page
21
草图工具,重点介绍 方向交会工具(Intersection Tool)
中国科学院计算技术研究所教育中心
功能:绘制草图时使用指定的两个方向线计算 交点形成新的草图顶点 操作:在创建要素状态下,单击草图工具栏上 的 按钮,选定两条由已有要素或草图构成 的相交的方向线,系统自动将草图连接到交点 (第一线单击,移动鼠标,找到第二线单击, 则在两条线交点处,建立节点)
编辑时最好设置比例尺,在指定数据比例尺下编辑
Page 3
1、ArcMap中编辑工具的介绍
中国科学院计算技术研究所教育中心
主要:编辑(editor),高级编辑(advanced edit),注记 和要素编辑(draw,注记要素)
Page
4
1.1 编辑基础知识 编辑基本设置
中国科学院计算技术研究所教育中心
中国科学院计算技术研究所教育中心
ArcGIS10.3数据编辑教程
讲解内容
中国科学院计算技术研究所教育中心
1.ArcMap中各种编辑工具的介绍 2.属性编辑和更新 3.扫描矢量化编辑 4.各种高级编辑 5.注记标记
Page
2
1、ArcMap中各种编辑工具的介绍
中国科学院计算技术研究所教育中心
如何编辑? 加载需要编辑数据 在ArcMap中打开“编辑器editor”工具栏,执行 其中的 “开始编辑”命令,进入编辑状态。 利用“编辑器”的功能完成地图要素的分层提取, 打开图层的属性表,输入要素的相关属性 在编辑过程中,点击“编辑器”中的“保存编辑” 可以随时保存修改的结果,点“停止编辑”完成 编辑。
Arcgis使用技巧
Arcgis使⽤技巧1.裁剪图⽚添加数据⾯A,B后,单击window--arctoolbox,单击Analysis Tools⽬录下的Extract,选中并点击clip命令,点击clip后弹出如图⽰填写:被裁切的在第⼀个input feature,按照什么模样裁切在第⼆个clip feature,裁切完成后数据保存路径为第三个output feature class。
2.保存为相对路径打开gis 在⼯具条中选中file(⽂件),在选择document properties(⽂档属性),在出来的对话框中选择data source option (数据源选项)选择红框中的选项,如果要以后所有的⽂档都保存相对路径就将蓝框中也勾选(建议勾选),这样就完成了。
3.分割shp地图1.从“⽂件”菜单下找到“添加数据”然后选择“添加数据”或者直接从⼯具栏上找到单击进⾏添加。
这⾥以中国地图为例,我们要得到湖北省地图。
2.开始编辑假设你是中⽂版arcgis则应在⼯具栏找到,英⽂版的找到名为editor的⼯具即可,⾸先保证你添加该⼯具,若没有添加,⿏标右键单击菜单栏或者⼯具栏空⽩处,找到编辑器(editor)。
3.点击开始编辑,选择不需要的地区,单击键盘delete键或者右键选择“删除”,如果你难以确定你的⽬标区域,你可以在内容列表中右键单击该图层找到“属性”,单击后再“标注”中选择“标注字段”为你想要做的标注,如name,将“标注此图层中要素”勾选,确定后,地图将显⽰name标注,便于找到⽬标区域。
4. 最后得到的编辑完的图形,在内容列表中右键单击图层选择“数据”-“导出数据”,更改“输出要素类”的路径并命名。
⾄此⼯作基本完成。
5.回到⼯具栏中“编辑器⼯具”单击停⽌编辑,不保存编辑即可(主要是不破坏原始图层)。
我学习了⼀种更简单的⽅法,打开图层后,选择“analysis tools”>"extract">"select",直接在sql表达式中输⼊“name”(或者其他关键字)=‘湖北’(以湖北为例),即可快速得到湖北地图,还是⾃⼰知识太浅薄了。
ArcGIS图形数据编辑操作
创建完 成。 6.在数据集上右键,创 建图层。 7.给图层命 名,并选择创建的图层类型 8.引用数据表结构,或者自己 创建字段属性 当需要把 a 图层的数据内容合并到 b 图层中, 处理方 法有两种。 1.直接选中需要合并到 b 图层的要素, 点击 工具, 选择 b 图层(目标层), 点击 工具,此 种方 法是在只保留图形,对属性没有要求下的一种 处理方法。 2.在 catalog 中在 b 图层上点击右键,选择“Load Data” 点 击“下一步”,设置图层的字段对应关系,把需要 的属性信 息对应导入到目标图层的字段中。 在导入过程中可以根据 属性进行选择性导入。 一、数据属性的查看,修改 在 arcgis 中经常需要对图形的属性信息进行查看和修改, 属 性的查看工具主要使用 工具,点击所需要查看的图 形, 就会弹出属性对话框。如下图: 在下拉箭头下有根据用户 要求的选项 国图信息系统中列出所有查询到的信息 对需 要修改属性的图形步骤为: 1.启动编辑; 2.使用选择图形 工具选中需要修改属性的图形; 3.点击 属性浏览工具,弹 出对话框; 4.在对话框中,根据需要修改字段内容; 5.修 改完成后,点击保存编辑。 二、Arcgis 中的查询,面积汇 总 在处理数据过程中,需要对图形数据进行一些条件 查 询,以得到想要的结果,并可以对这些结果进行 汇总。 在图层上点击右键,打开属性表。 弹出查询窗口,如我们 需要查询地类代码为“203”的 地类,则使用以下方式: 如
LOGO 图形数据编辑操作 图形数据编辑操作 文件标准菜 单新建文件打开文件保存文件打印文件 剪切复制粘贴复制属性删除清除图层撤 销 恢 复 添 加 数 据 设 置 比 例 尺 启动 arccatalog 启动 arctoolbox Arcmap 标准文件菜单 国图 3.0 信息系统 标准文件菜单 常用的工具介绍 Arccatalog 标准工具条 Arcmap 标准工具条 国图 3.0 信息系统标准工具条 放大 缩小 固定比例放大 固定比例缩小 选择要素 选择注记 全 图显示 全景视图 后一视图 前一视图 漫游 属性信息查看 图层控制 查找 量算工具 缩放到选中要素 清除选中要素 Arcmap 编辑工具条 国图 3.0 信息系统编辑工具条 启 动 编辑停止编辑保存编辑抓点编辑草图工 具编辑工具创建任务选项编辑图层选择 旋转要素属性浏览草图属性自定义属性 赋 值 图 层 控 制 编辑工具菜单 国图 3.0 信息系统编辑 菜单 Arcmap 编辑下拉菜单 启动编辑 停止编辑 保存编辑 移动 缓冲 合并 节点扑捉 高级选项 一、图层的创建与合 并 在处理数据过程中,需要创建一个新的图层,或者 把 两个图层的数据合并到一个图层中。图层的创建 是在 Catalog 中进行。 1.右键创建一个新的.mdb 数据库 2.在数 据库上右键创建数据集 3.对数据集进行命名 4.引用数据集 坐标系 5.选中需要引用的数据集,后面 的全部点击下一步,
arcgis工具使用方法
arcgis工具使用方法a r c g i s工具使用方法公司内部编号:(GOOD-TMMT-MMUT-UUPTY-UUYY-DTTI-在矢量叠加,即将同一区域、同一比例尺的两组或两组以上的多边形要素的数据文件进行叠加产生一个新的数据层,其结果综合了原来图层所具有的属性。
矢量叠加操作分为:交集(Intersect)、擦除(Erase)、标识叠加(又称交补集,Identify)、裁减(Clip)、更新叠加(Update)、对称差(Symmetrical Difference)、分割(Split)、合并叠加(Union)、添加(Append)、合并(Merge)以及融合(Dissolve)等类型。
这里首先提醒一下:编辑里边的merge是将同一要素类里边的要素合并生成新的要素,并将原要素删除,其属性按指定的要素修改。
编辑里边的union可将同一要素类或不同要素类的要素合并生成新的要素,不删除原要素,新要素的属性为系统默认值(空格或0等,根据字段属性而定)。
编辑里的merge和union是对选中的要素进行操作,而arctoolbox里的是对要素类进行操作。
◆交集(Intersect),计算两个图层几何对象相交的部分。
对于ArcT oolBox 中的Intersect工具来说,可以选择保留所有的属性字段或是只有FID或是除了FID所有的字段。
而相应的Editor Tool中也有一个类似于Intersect的工具,对于这个工具来说,与我们ArcT oolBox中Intersect不同的是,它所产生的最后结果是没有属性的,是需要人工输入属性值的。
此工具要求input features 是简单要素类,如point、line、polygon,不能是复杂要素类,如annotation、network等。
当input features是不同的要素类型时(如point和polygon、line和polygon),输出的结果默认是维数较低的类型,如line和polygon的默认结果是line,point与line 的默认结果是point。
ArcGIS常用功能和操作
12
熟悉ArcGIS
坐标系统
投影坐标系统(平面) 地理坐标系统(球面)
13
熟悉ArcCatalog
ArcCatalog:是ArcGIS Desktop中最常 用的应用程序之一,它是地理数据的资源管 理器,用户通过ArcCatalog来组织、管理 和创建GIS数据。比如地图,数据集,模型, 元数据,服务等。
54
数据编辑——编辑操作
3、选择目标图层
1、开始编辑
2、选择编辑任务
55
数据编辑——编辑操作
1、选择绘图工具
3、查看地物属性
46
格式转换
•通过ArcToolbox工具箱
•通过ArcMap数据导出
图层上右击Data→ Export Data
•通过ArcCatalog数据导出
•右击Export→To CAD…
47
格式转换——ArcCatalog
48
图片配准
打开ArcMap,添加矢量数据,添加“Georeferencing”(影像配准 )工具栏。 把需要进行配准的图片.jpg增加到ArcMap中,会发现 “Georeferencing”工具栏中的工具被激活。
根据坐标生成图形
数据格式: 1、 Polyline后面不能有空格;(如果 要生成面,将Polyline改成Polygon ) 2、数据间的空格间隔只能是一个字符; 3、生成线的每一点要按顺序排列,按 不同顺序排列会生成不同的图像; 4、第一个点的序号从0开始编号; 5、若要生成多条线,对每条线要编号; 且要符合上述的要求,每条线的点重 新从0开始编号; 6、最后一行要加上END。
需要进行空间连接的图层
连接最近点的属性
34
熟悉ArcMap——图层属性设置
arcgis多种编辑方法
一、面转线方法:1、打开一个空的线文件,开始编辑线文件,选择所有面,拷贝,粘贴,保存编辑。
2、打开arctoolbox工具箱,选择data management tools中的features中的featue to line工具二、ArcGis Polyline线转换为Polygon面1、打开ArcMap用Add Data加载shp Polyline线文件。
2、选Editor编辑\Start Editing开始编辑。
3。
选Editor编辑\More Editing Tools\Topology拓扑4。
在Topology拓扑工具栏中选Map Topology 再在Shp文件上打勾Ok5。
用Select Features 选择指针把线全部选中,这时Topology拓扑工具栏中的Construct Features选项为激活状态。
6。
这时点击Construct Features来检查图中有无多余的线段和点与线分离的过远,多次输入0.1和0.2的值仔细调整。
7。
调整好后选Editor编辑\Save Edits保存。
8。
打开ArcToolbox选Data Management Tools\Features\双击Feature To Polygon特性到面在Input Features选中正在编辑的Shp文件,在Output Feature Class处输出文件名可改。
点击Ok即可完成线面转换。
检查有错误,缺线等,可重做第6。
三、ArcGIS点、线、面数据拓扑处理1. 线自动连接分两种情况:a:如果线只是相交自动打断,即没有间隔,从表面上看是相连的一条(其实是两条),可以用Arctoolbox里的工具DataManagement Tools-Generalization-Dissolve工具来做融合,可以设置融合的参考字段,字段名称内容一致的自动融合成一条。
融合后的图层保留参考字段属性,其他属性字段删除。
b:如果线段之间有间隔,可以用ArcMap中的Topology工具条来做,先加载需处理的线图层lineA,最好复制一个空的lineB图层,字段结构和lineA一致,只是内容清空,然后开始编辑,设置target layer为lineB,选择lineA里的线要素,设置Map Topology 图层为lineB,然后单击Construct features按钮,设置容差值,在容差之之内的间隔线段将自动连接起来。
ARCGIS常用操作
1. 要素的剪切与延伸实用工具TASK 任务栏Extend/Trim feature 剪切所得内容与你画线的方向有关。
2. 自动捕捉跟踪工具点击Editor工具栏中Snapping来打开Snapping Environment对话框捕捉设置中有3个选项, vertex edge end 分别是节点、终点、和边,选择end应该会捕捉端点3. 图斑面积计算及长度计算应用工具CALCULATE AREA 或者使用VBA代码实现新建字段并开启Advanced 写入代码,面积计算:Dim Output as doubleDim pArea as IareaSet pArea = [shape]在最后的一个空格里面写入代码(即:字段名)pArea.area长度计算:Dim Output as doubleDim pCurve as ICurveSet pCurve = [shape]Output = pCurve.Length4. 剪切图斑T ask任务栏cut polygon feature工具,需要sketch工具画线辅助完成5. 配准工具Spatial Adjustment 工具需要注意先要set adjustment data 然后配准6. 影像校正Georeferncing工具7. 要素变形T ask 工具条中的reshape feature 配合sketch工具8. 添加节点Modify feature 在需要加点的地方右键单击insert vertex也可单击右键选择properties 打开edit sketch properties对话框,在坐标点位置右键插入节点9. 共享多边形生成Auto-complete polygon 工具生成共享边的多边形,配合snapping environment更好。
10. 画岛图1).使用任务栏中的sketch工具,当画完外面的一圈时,右键选择finish part 然后画中间的部分再右键finish sketch2).分别画连个图斑然后应用Editor 工具栏中的工具先intersect(图斑重叠的地方创建一个新的图斑)然后Clip(剪切)即可。
ArcGIS矢量数据编辑基本操作

矢量数据编辑基本操作一、失量化数据基本操作(一)切割1.在ArcMap工具栏中编辑器工具中,单击编辑器下拉菜单中的“开始编辑”按钮2.在弹出的窗口中,选择单击要编辑的矢量图层,然后单击"确定”。
3.选中要编辑的要素,使它处于选中状态。
4.然后,单击编辑器工具栏中的切割按钮,对选中的要素进行切割。
(二)整形要素工具1、选中中要编辑的图形要素。
2、单击编辑器工具栏中的,整形要素工具按钮( Reshape Feature Tool)中讯,选中的图形要素进行裁切。
(三)“自动完成面”构造工具1、单击编辑器工具栏中,编辑器下拉菜单中的“开始编辑”,界面右侧出现的创建要素窗口,然后单击要修改的矢量面图形图层。
2、单击在右侧界面中构造工具窗口中的“自动完成面”。
3、鼠标移至主界面区域,单击确定起始点,完成绘制后,双击结束,则系统将自动面要素绘制。
二、字段赋值(一)赋值操作(二)赋值检查1、右击内容列表窗口中矢量图层,在打开快捷菜单中单击属性。
2、在属性窗口中,点击符号系统选项卡,在“显示”选项中单击“类别”| “唯一值”,在符号化界面中,在“值字段”下拉列表框中选择一个字段作为“唯一值”的字段。
3、点击下面添加所有值按钮,右击一个标注值的分类,在弹出的快捷菜单选择"所有面的属性,设置填充颜色。
4、分别点击确定后,对矢量图层的矢量数据分别检查。
5、检查方法是每一种值的颜色设置“非填充颜色”进行检查三、投影(一)坐标系参数(二)设置投影参数1、点击右侧Catalog窗口中目标矢量图形文件,右击打开快捷菜单中的属性。
2、在打开的属性窗口中,点击XY坐标系选项卡,设置投影坐标系为CGCS_2000_Albers。
3、最后点击确定即可。
四、矢量图层的拆介与合并(一)合并接边1、点主菜单中的地理处理中的合并命令。
2、输入要素选择要合并的矢量图层文件,并选择输出的文件夹。
(二)拆分1、拖入要拆分的矢量文件2、在Catalog窗口中,右击所在的子目录文件夹打开快捷菜单新建个午量图形。
ARCGIS 分割、融合面文件的方法
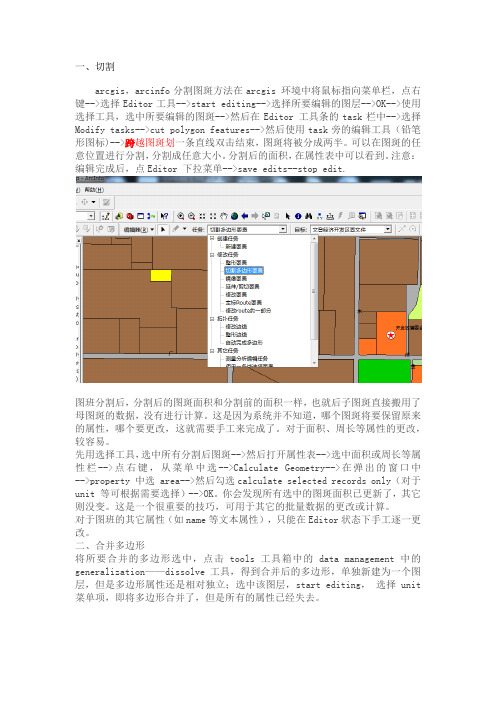
一、切割arcgis,arcinfo分割图斑方法在arcgis 环境中将鼠标指向菜单栏,点右键-->选择Editor工具-->start editing-->选择所要编辑的图层-->OK-->使用选择工具,选中所要编辑的图斑-->然后在Editor 工具条的task栏中-->选择Modify tasks-->cut polygon features-->然后使用task旁的编辑工具(铅笔形图标)-->跨越图斑划一条直线双击结束,图斑将被分成两半。
可以在图斑的任意位置进行分割,分割成任意大小。
分割后的面积,在属性表中可以看到。
注意:编辑完成后,点Editor 下拉菜单-->save edits--stop edit.图班分割后,分割后的图斑面积和分割前的面积一样,也就后子图斑直接搬用了母图斑的数据,没有进行计算。
这是因为系统并不知道,哪个图斑将要保留原来的属性,哪个要更改,这就需要手工来完成了。
对于面积、周长等属性的更改,较容易。
先用选择工具,选中所有分割后图斑-->然后打开属性表-->选中面积或周长等属性栏-->点右键,从菜单中选-->Calculate Geometry-->在弹出的窗口中-->property 中选 area-->然后勾选calculate selected records only(对于unit 等可根据需要选择)-->OK。
你会发现所有选中的图斑面积已更新了,其它则没变。
这是一个很重要的技巧,可用于其它的批量数据的更改或计算。
对于图班的其它属性(如name等文本属性),只能在Editor状态下手工逐一更改。
二、合并多边形将所要合并的多边形选中,点击tools工具箱中的data management 中的generalization——dissolve工具,得到合并后的多边形,单独新建为一个图层,但是多边形属性还是相对独立;选中该图层,start editing,选择unit 菜单项,即将多边形合并了,但是所有的属性已经失去。
ArcGIS基本操作教程
ArcGIS基本操作教程Arcgis基本操作教程(所有资料来⾃⽹络)⽬录1.配准栅格地图 (1)1.1跟据图上已知点来配准地图 (1)1.1.1选择标志性程度⾼的配准控制点 (1)1.1.2从基础数据底图上获取控制点坐标 (1)1.1.3增加Georeferncing ⼯具条 (2)1.1.4加载需要配准的地图 (2)1.1.5不选择Auto Adjust (2)1.1.6在要配准的地图上增加控制点 (3)1.1.7重复增加多个控制点检查残差 (4)1.1.8更新地图显⽰ (4)1.1.9保存配准图像 (5)1.1.10增加有坐标的底图检验配准效果 (6)1.2根据GPS观测点数据配准影像并⽮量化的步骤 (7)2.图形的失量化录⼊ (9)2.1半⾃动失量化 (9)2.1.1启动ArcMap (9)2.1.2栅格图层的⼆值化 (10)2.1.3更改Symbology设置 (10)2.1.4定位到跟踪区域 (11)2.1.5开始编辑 (12)2.1.6设置栅格捕捉选项 (12)2.1.7通过跟踪栅格像元来⽣成线要素 (14)2.1.8通过跟踪栅格像元⽣成多边形要素 (15)2.1.9改变编辑⽬标图层 (16)2.1.10结束你的编辑过程 (17)2.2批量⽮量化 (17)2.2.1启动ArcMap,开始编辑 (18)2.2.2更改栅格图层符号 (18)2.2.3定位到实验的清理区域 (19)2.2.6使⽤像元选择⼯具来帮助清理栅格 (21)2.2.7使⽤⽮量化设置 (24)2.2.8预览⽮量化结果 (25)2.2.9⽣成要素 (26)2.2.10结束编辑过程 (27)2.3⼿⼯数字化 (27)2.3.1在ArcCatalog下新建⼀个空的shapefile: (27)2.3.2为boundary添加属性字段 (28)2.3.3新建地图,并添加需要的数据 (28)2.3.4进⾏栅格显⽰设置: (28)3.拓普错误检查 (29)3.1ArcGIS 拓扑介绍 (29)3.2Geodatabase组织结构。
ESRI ArcGIS的样式编辑器指南说明书
STYLING1.Can you click on features to see all the attributes you can edit at any zoom level?If you click on a feature it will show all the attributes you can edit. If there are scale range based attributes, you will be able to edit those too. The scale based attributes are separated into categories called ‘stops’.2.If you change styling settings, does it overwrite the quick edits you have already made?Yes. Once you go beyond the Quick Editor pane those changes you make will take hold.3.Is scale based transparency supported?Yes. It is called opacity, but it is most definitely supported. Use the gear icon to select ‘Set Value by Zoom Level’ option. Then you can set scale based settings called ‘stops’.4.Can we use our own custom aerial imagery in conjunction with ESRI labels?Yes. You can use a Reference layer or create your own stylized label layer and put that on top of your imagery in a web map. (See enhancements #1)5.Can you add your own layers/data into the basemap?Not directly. However, you could combine your own data and basemap data together as separate layers in a web map. (See enhancements #2)6.Does the quick editor color change output different colors on different features? For example, if changingthe water to a certain hex value do some water features get different shades of blue?When a quick editor color is changed it will adjust most of the impacted features to that color. The exceptions are things liking road casings and bathymetry. Sometimes that color is ramped so that the casing of a road is maintained or the essence of the bathymetry is kept.7.How does the quick editor adjust road widths?You can either select to widen them or narrow them (and this will be done across all scales). It will keep the relative road hierarchy intact and road casing intact.8.How do you turn off labels based on feature type?You can go to the specific feature and switch the visible toggle to off.9.Why do some layers have limited zoom ranges (i.e. Land Use\ Park or Farming)To make the Vector Tiles as small and efficient as possible some features are only generated out to certain scales.10.Are there any tutorials available to walk through the process of making a custom basemap?There are various blogs and story maps that walk through the process. The blogs with the following tag will collect most of those: #vector basemaps.The Basics: https://arcg.is/19KaySColors: https://arcg.is/0Lj5zvLines: https://arcg.is/1f0T18Labels: https://arcg.is/1eD5aeFonts and Sprites: https://arcg.is/1PDSCS11.How do you lock the extent if you have styled the map for a specific place?You cannot lock the extent in the editor but you could in app you are making it for (depending on which app)12.How does the reset style button differ from the undo button?The reset will revert back to the original style while the undo will undo the last change.13.What are the terms of use (copyright) for custom basemaps if we create them for a specific business orwebsite?14.Can you style by scale?Yes. Use the Set Value by Zoom level functionality found in the gear icon for each feature’s attributes and then add stops which will allow you to design based on scale.15.Can you center the map somewhere else?You are free to move all four map windows to whatever scale and location you want. If you save the web map centered on a location/scale, that location will be preserved when you open the web map again.16.How are scale dependencies determined?Features are ‘cooked’ into the tiles based on a predetermined scale. For the basemaps this is determined by Esri. For your content, it would be determined by your settings in Pro. With the editor, you have the ability to turn off features if they were cooked into a scale but you can never turn them on beyond the scales they were cooked.17.Why are those sub windows based on the scales that they are?They show the map at various scales where there is often a transition in the way features are symbolized.18.How does one change the code for disputed names?You will need to make a copy of the tile layer and save to your own account. Download the root.json file and make the edits to the filter values based on the available names listed in the Esri Vector Basemap Reference Document (v2) pages 29-30. This blog also discusses filter editing in the JSON. Once edited (and root.json file is validated through ) you can update your item’s style (root.json file).19.Can I share my custom style to Enterprise (Portal)?If you have a custom style in an ArcGIS Online account (not Enterprise) you can download that style’s root.json to port over to Enterprise. Save a copy of the Esri vector basemap style you started with so the sprites are the same in your online account. Update the style in Enterprise using your online custom root.json.20.When adjusting the width of roads via the quick editor do the buildings and other items adjust too?The option to adjust road widths in the quick editor will only affect the roads.21.Can you use a predefined color set or do you have to manual enter the colors in the quick editor?You can totally use a predefined color set but at this point you do have to manually enter the colors. However, due to the way the categories are grouped in the quick editor the amount of manual cutting and pasting is very minimal.22.Are the road icons vector?The icons are PNG and are referenced in the vector map via a sprite sheet. There are two sprite sheets: one PNG file for high resolution devices and one PNG file for typical resolution devices.23.Can you delete labels?You cannot delete anything with the Vector Editor. Instead you can turn features on and off getting the same effect.24.Will the amount of styling have any effect on the load time for the basemap?In general, the expectations are it will not. Certain styling may increase load time for the vector basemaps. This includes adding duplicated layers of features or heavy use of patterned sprites across large areas of the map. Certain styling may decrease load time if you make many features not visible.25.Is it possible to take the style from an ESRI basemap and apply it to a custom vector layer? Is it possiblethrough JSON?Not directly, but can be done and would require manual application of the styles from our features to a custom vector layer. The attributes being styled through the JSON most likely would not be reflected in your custom vector layer, but you could apply the specifications from one to the other.26.How do I load my own vector basemap into the editor?If you are signed in with your online account, the ‘My Styles’ tab of the editor will display your own basemap.JSON1.How can I see the JSON file behind the Editor?You can do this via the content item which is created. Log in to your Online account and go to My Content, select the item you want to review. On the map item page there will be a view style button. You can also download the root.json file.2.Can you use Google fonts in the JSON file?No. We do use Google fonts but in order to be used in the vector format they are encoded as PBF files. You cannot reference Google fonts directly in the JSON. The list of fonts we currently include in our Esri vector basemaps can be found in the Reference Document (v2) on page 31.CUSTOM VECTOR MAPS1.Can I use my own scales to create vector basemaps e.g. 1:250, 1:500 etc.?Yes. If you are creating your own custom vector map in ArcGIS Pro you can use whatever tiling scheme you want. However, if you want to combine that with an Esri Basemap it will not be compatible.2.Does the Vector Editor work with VTPK’s we create and upload?Yes. The only functionality not available will be the quick editor as that is locked into an Esri basemap experience. But everything else will be fully functional.3.Are there plans to allow the uploading of a shapefile to the vector editor?No.4.Are there known max scale limitations for creating vector tile layers?The min and max cached scales you choose must be scales defined within the tiling scheme.5.Are you able to edit your Organization’s Vector Basemaps or only Esri’s?You definitely can use the Vector Editor to edit your own vector basemaps.ENVIRONMENT1.Can I use a vector map in ArcGIS desktop (what platforms are supported)?ArcGIS desktop is not supported. One should use ArcGIS Pro as the desktop solution for vector maps. More information on Vector tiles can be found here.2.Is it possible to have the basemap stored locally/exported to a PMF fileNo, see this support article. PMF are only created through the Publisher extension of ArcGIS for Desktop, not Pro. Desktop does not support vector tiles, Pro does.3.Is this Editor available for ArcGIS Enterprise (Portal)?Currently, no it is not.4.Are custom Vector maps compatible with the offline Collector workflow?The next generation of Collector is planning to be compatible with vector maps.5.How do you use these custom maps in Business Analyst?In Business Analyst (Online) > Maps > Add Data > Web Maps and Layers > find your custom vector basemap in your account or add any of the Esri Vector Basemaps (including our creative styles) from the Living Atlas > Basemaps category.6.What browser works best?Vector tile layers have the best performance on machines with newer hardware, and they can be displayed in most current versions of desktop browsers, including Chrome, Firefox, Safari, Internet Explorer 11, and Edge. You can add vector tile layers as operational layers or basemaps to Map Viewer or Scene Viewer.7.Are we able to use our custom basemaps for applications that are already built?Yes, if the client supports vector basemaps. You will need to replace your existing map with the new custom vector basemap.ONLINE1.Is there any credit consumption using the vector editor?No. The only credit consumption would be the standard storage of any item created.2.Can a custom basemap be set as the default for an AGOL organization?Yes, you need to create a group and share the custom basemap (web map) to that group. Then the administrator can make changes on the Settings > Map section of the Organization in . Set the Basemap Gallery to the group. Set the Default basemap from within this group.3.Does the Vector Editor require an Online Account?Yes, if you wish to save your custom style.4.Is this in BETA?Yes, currently the Vector Editor is in BETA5.How do I access the generated JSON after saving?Log in to your account and go to the item page of this saved custom style. There will be buttons to View Style and Download Style (downloads root.json).6.What type of online account do you need?Is student or personal okay or do you need an organizational account?Any of the accounts (Student, Personal or Organization) are okay; however, there are different terms of use based on account type. For example, items in a personal account are not for commercial use.7.How do you access the customized basemap through online?To access the Esri Vector Basemap Customized maps, there are three main ways: through the Vector Basemaps Group, through the Living Atlas > Basemaps > Vector Tiles, or through the Map Viewer > Add > Browse Living Atlas > Basemaps > Vector Tiles. To access your own customized basemap through online, if public item you can add them through the Map Viewer > Add > Search for Layer > My Content. If private item, you will need to log in first.8.How do you access the custom style in Online if it is saved privately?If you own the item, log in to your online account. You can access a custom style that you saved through the My Content tab. Also, in the Map Viewer > Add > Search for Layer > My Content for the item name of your saved style (tile layer). For others to be able to find the style or for you to find others’ privately saved styles, the styles will need to be shared (either within your organization or publicly).9.How do you access the saved style via online?The styles saved from the Vector Style Editor will appear in the My Content section of the online account that you logged in to the Editor with. They can be accessed through the Map Viewer > Add a layer > browse your content for the item name of your saved style (tile layer).10.Can the customized basemaps be taken offline?Yes, currently through this developers story. There are plans to create the vector basemaps for offline use out of Pro. The next generation of Collector is expected to consume vector tiles. Please be aware of the terms of use for vector basemaps.11.How do you add a vector map to portal?Adding a vector map to Enterprise is similar to ArcGIS Online. Starting with Enterprise 10.5.1, Esri Vector Basemaps are accessible through the Living Atlas for Portal. Maps are found under the Gallery tab > Basemaps > EsriBasemaps. In newer versions of Enterprise, there is also a Living Atlas tab under Content. In the Map Viewer > Add > Browse Living Atlas > Basemaps category > Vector Tiles sub-category.12.Can I tag a custom style as authoritative so that everyone knows in my org that it meets our orgstandards?If you are the administrator you will have the Mark as Authoritative button on the Settings tab for the custom style item. See this blog for more information on authoritative items.13.Where are vector maps available?Esri Vector Basemaps are available in , Pro, and some mobile applications like Explorer for ArcGIS. Find them easily through the ArcGIS Living Atlas of the World, Basemap category, Vector sub category.14.How do you incorporate a vector basemap into the web app builder? Do you just reference the portal orAGOL url?The app created by Web AppBuilder for ArcGIS is based on a web map or web scene from ArcGIS Online or Portal for ArcGIS. Reference the Web AppBuilder doc for more information.15.How do you combine the refence and map layers?In the map viewer, when you modify the map, add the layer(s) you wish to include in your map. For Reference layers, you can move them to the basemap and then set that layer as a reference layer. With this configuration, any operational data you add will appear “sandwiched” between your base layer and the reference layer. You can also add the layer(s) in Pro to build the map you want.16.How would I go about publishing my basemap style for use on a website?One way is the save your basemap style as a web map, then share the map. This will provide a URL to access the map. This URL can be included on your website.ArcGIS Pro1.How do you load a saved vector style into ArcGIS Pro?When you are logged into your portal and have it set as active, you can access the Catalog pane and add the saved vector style (tile layer) from your portal.2.When exporting a custom style from pro the labels are not at a high resolution. Can this be fixed?Yes. You need to have the fonts installed on your machine to get them to export at a high resolution. If you are unsure about the font, go to the Vector Editor to find it. For the most part, these fonts are open source and can be found and downloaded from Google fonts. The list of fonts we currently include in our Esri vector basemaps can be found in the Reference Document (v2) on page 31.3.Can you take an ArcMap document used to create raster tiles and move it to ArcGIS Pro to create vectortiles?Yes, but results may vary depending on the functions applied to the styles in ArcMap (e.g. Maplex label engine setting). Pro has some additional settings useful for vector tile creation, such as scale based display of features. There may be some tweaking of the file once you move it to Pro.4.Can you export vector maps as high resolution or vector files into graphic packages like Illustrator?Yes, on the Share tab, Export map offers several different file formats.Please follow the terms of use of the basemap.5.Can you shed some light on exporting?See question above for exporting vector maps from Pro. Exporting maps for offline use, the vector basemaps have primarily a Developers story. User interface for taking the vector basemaps offline from Pro and for use in Collector is planned. Please follow the terms of use of the basemap.6.How do you change the coordinate system?In Pro > Contents > Map > Properties > Coordinate SystemJAVASCRIPT1.What is the best way to publish these styled maps and load into an ARCGIS JavaScript applications? Refer to ArcGIS for Developers page for details. This is another link on the developers site for the JavaScript API.CONTENT1.How is Community content updated?Through the Community Maps Program, contributors provide updates on a cycle they set (some of our participants update monthly, quarterly, semi-annually, or annually. Data is integrated into our central database and included as part of our core tile set. These updates appear online about every three weeks. See the CMP page on what is accepted.2.Do you have a method in place to verify the source of the feedback on the basemaps and can I be verifiedas an expert in my geographic region?The verification depends on the source of the data being mapped. We use a mixture of commercial, community and open sourced data depending on the area. Suggestion if you are submitting feedback is to include reference information (URLs) showing the correct information. If you have data for a specific area, consider becoming a data steward through the Community Maps Program.3.Is there a way to customize a basemap to use your own aerial photography?As long as your aerial imagery and the basemap (reference layer) are in the scale coordinate system, you can use your aerial imagery as the base layer and then either an Esri Vector Basemap reference layer or your own customized reference layer. The Esri Vector Basemaps are available in Web Mercator and WGS84 GCS.4.How do you add a specific basemap like 1997 imagery to the basemap gallery?As an administrator, create a web map from this specific imagery layer, share it to a group. The group can be set where the contents will be used for the basemap gallery. organization > Settings > Map > Basemap Gallery. Any web maps added to this group will appear in the gallery.ENHANCEMENTEnhancement requests to the Vector Editor (Beta) are best added in the Style Editor space on GeoNet. Enhancement requests to the Esri Vector Basemaps are best added in the Living Atlas space on GeoNet.Content issues of the Esri Vector Basemaps are best reported on the Vector Basemap Feedback map.1.Can we use our own custom aerial imagery as reference in the Vector Editor?Not as of yet. It is an item in the backlog.2.Can you add your own layers into a basemap?Currently you would need to use separate layers. A layer for the Esri Vector Basemap, plus one or more of your own layers. Layers need to be in the same coordinate system.3.Can one mark or limit features in a basemap to one state or filter to show UTAH as green and the rest ofthe US as grey, for example)?Not as of yet. It is an item in the backlog.4.Can you upload custom fonts?Not as of yet. It is an item in the backlog.5.Can we apply styles from a basemap to our own data?Not yet. It is an item in the backlog.6.Are legends supported?No.7.Can you add a reference layer to a base layer in the Vector Editor?Not yet. It is an item in the backlog.8.Can you filter the labels via the Vector Editor?Not yet.9.Are there plans to implement these capabilities natively to ArcGIS?Plans to implement into ArcGIS Online have been discussed, but no timetable has been set.10.Can I use a raster as a pattern fill in a background?Yes, if that pattern is current ly part of the map’s sprite set. In a future update, will you be able to upload your own raster fill or icon.。
Arcgis使用技巧
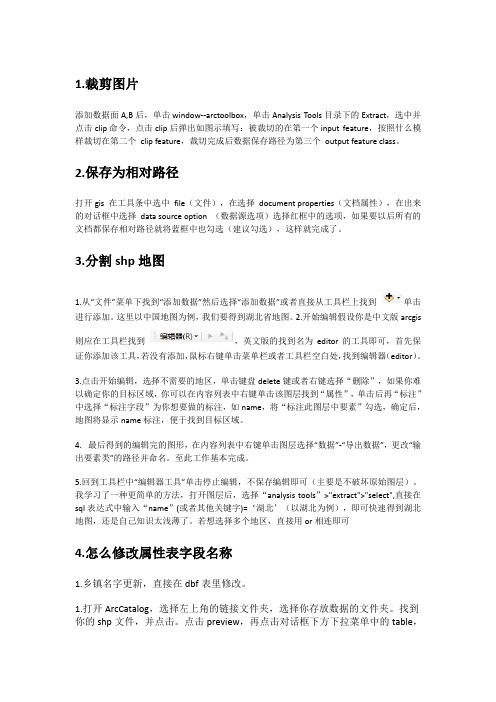
1.裁剪图片添加数据面A,B后,单击window--arctoolbox,单击Analysis Tools目录下的Extract,选中并点击clip命令,点击clip后弹出如图示填写:被裁切的在第一个input feature,按照什么模样裁切在第二个clip feature,裁切完成后数据保存路径为第三个output feature class。
2.保存为相对路径打开gis 在工具条中选中file(文件),在选择document properties(文档属性),在出来的对话框中选择data source option (数据源选项)选择红框中的选项,如果要以后所有的文档都保存相对路径就将蓝框中也勾选(建议勾选),这样就完成了。
3.分割shp地图1.从“文件”菜单下找到“添加数据”然后选择“添加数据”或者直接从工具栏上找到单击进行添加。
这里以中国地图为例,我们要得到湖北省地图。
2.开始编辑假设你是中文版arcgis则应在工具栏找到,英文版的找到名为editor的工具即可,首先保证你添加该工具,若没有添加,鼠标右键单击菜单栏或者工具栏空白处,找到编辑器(editor)。
3.点击开始编辑,选择不需要的地区,单击键盘delete键或者右键选择“删除”,如果你难以确定你的目标区域,你可以在内容列表中右键单击该图层找到“属性”,单击后再“标注”中选择“标注字段”为你想要做的标注,如name,将“标注此图层中要素”勾选,确定后,地图将显示name标注,便于找到目标区域。
4. 最后得到的编辑完的图形,在内容列表中右键单击图层选择“数据”-“导出数据”,更改“输出要素类”的路径并命名。
至此工作基本完成。
5.回到工具栏中“编辑器工具”单击停止编辑,不保存编辑即可(主要是不破坏原始图层)。
我学习了一种更简单的方法,打开图层后,选择“analysis tools”>"extract">"select",直接在sql表达式中输入“name”(或者其他关键字)=‘湖北’(以湖北为例),即可快速得到湖北地图,还是自己知识太浅薄了。
ARCGIS实习课程之几何纠正、遥感数据和矢量数据的配准、矢量数据的编辑
2)设置节点和边线捕捉,以便精确获取原有节点 和边线的位置。
点击Editor菜单,选择Snapping工具-Snapping Toolbar,在Snapping小窗口选择,Point、End、 Vertex、Edge snapping
41
3)Reshape地理要素。
首先点击Editor工具条的Edit Tool,将我国 的边界线选中,然后点击Reshape Feature Tool (整形工具),从新边界起始位置开始点点,沿 着新边界点击产生一系列点,回到我国边界处双 击,即可改变边界的形状。
32
地图的分类:普通地图和专题地图
普通地图以 相对平衡的 详细程度表 示地球表面 上的自然地 理和社会经 济要素。
33
专题地图着 重反映一种 或少数几种 专题要素, 如地质、地 貌、土壤、 植被和土地 利用等原始 资料。
34
一、实习目的
通过该部分的实习了解基于参考地图进行矢 量数据的编辑的过程
42
其次使用Edit Tool,将印度的边界线选中, 然后点击Reshape Feature Tool,从新边界起 始位置开始点点,沿着新边界点击产生一系列 点,回到印度边界处双击,即可印度边界的形 状。
由于印度和我国分别数字化,容易产生边界的 冗余、空隙以及重叠
43
4、用拓扑编辑工具条(Topology工具)提供的工 具对中印边界进行编辑
23
2、打开Georeferencing工具条,并且工具条上对应的 图层为spot-pan.bil。
24
3、使用快捷菜单的Zoom to Layer查看road和spotpan.bil,但是不能同时查看两个图层。原因是它们的 坐标系不同。如果要同时查看他们,首先必须用一个 或更多的链接来与spot-pan.bil进行地理坐标匹配。
ArcMap的Editor工具,实现要素拖动、编
ArcMap的Editor工具,实现要素拖动、编辑。
本来根本没有写这个工具的意思,自己一直用的Ae自带的工具。
虽然可控制力弱了一些,但终究还是凑或能用。
一天,问到一个同学,想请教一下,居然以百般理由回绝。
算了,秉承毛老人家的口号:自力更生,丰衣足食!好了,闲话少说,各位看官,咱步入正题了。
首先,说一下,所有的要素的更新、插入、删除最好放在编辑的Session 里面,即以一对StartEditing和StopEditing 包裹。
一开始我的疑问在于,为什么我用IWorkspaceEdit的StartEditing方法后,怎么鼠标不会变成AcrMap里面Editor的开始编辑那样呢,为什么不能选中要素,为什么不能双击后编辑要素?原来,选中要素和使要素处于编辑状态还是要自己写的(经高人指点,呵呵)。
先介绍一下程序中用到的变量:Code那我们就按照逻辑顺序来一一展示这个到底是怎么做的。
首先是,开始和结束编辑的代码:///<summary>///开始编辑///</summary>///<param name="bWithUndoRedo"></param>public void StartEditing(bool bWithUndoRedo){if (m_SelectedLayer == null) return;IFeatureLayer featureLayer = m_SelectedLayer as IFeatureLayer;if (featureLayer == null) return;IFeatureClass featureClass = featureLayer.FeatureClass;if (featureClass == null) return;IDataset dataset = featureClass as IDataset;IWorkspaceEdit workspaceEdit = dataset.Workspace as IWorkspaceEdit;try{workspaceEdit.StartEditing(bWithUndoRedo);m_IsEdited = true;}catch{return;}}当然你可以直接传进来IWorkspace,这个可根据你具体的需求,我这里用当前图层获取工作空间。
ArcGis 操作
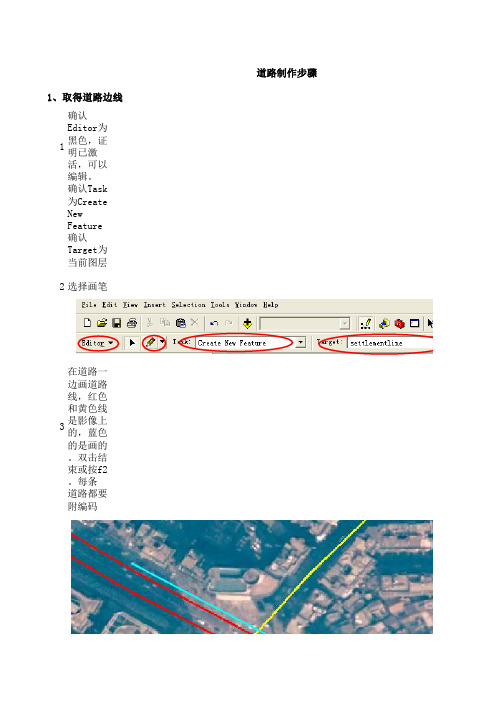
1确认Editor为黑色,证明已激活,可以编辑。
确认Task为Create New Feature确认Target为当前图层2选择画笔3在道路一边画道路线,红色和黄色线是影像上的,蓝色的是画的。
双击结束或按f2。
每条道路都要附编码道路的两边是对称且平行的,所以要进行偏移1在工具栏中选择尺子的工具道路制作步骤1、取得道路边线2.道路偏移点击图标会出现一个Measure的对话框,红色圈内显示的是道路宽度(蓝色圈内的为尺子2选中道路,在工具栏中选择Editor,又会弹出一个工具栏3选择Copy Parallel工具,会弹出一个对话框,在Distance中填写道路宽度,在Side中选择偏移的方向,下面都是默认的4偏移好的道路3.处理十字路口的两种方法当十字路口出现时,我们有两种解决方法,一种是针对直角的路口,另一种是针对圆滑一.做直角的路口应注意:1选中要保留的道路,再在工具栏中选择红圈的工具,点击要连接的道路2绿色圈为效果图3因为绿色圈内的道路不美观还需再次处理,选择工具栏中的红色圈内的工具,选中保留的道路,点击红圈内的工具再点击要裁切的道路4绿色圈为效果图二.做圆滑拐角的道路时应注意:1选中要打断的道路,点击打断工具(红色圈内的),再在道路上找到相应的位置打断2选择(红色圈内的)工具,再点击需要连接的道路,把弧线拉到相应的位置3以此类推一个带有圆滑拐角的十字路口就形成了。
因为拐角处是曲线,需要把曲线转成线段(节点4选中四条曲线,点击红色圈内的工具,会弹出一个对话框,在上面填上相应的值,点击ok。
4.合并道路(相同等级的道路线可以合并在一起,不同等级的道路线是不能合并在一1选中要合并的道路(按住shift可以多选),点击红色圈内的工具2弹出一个对话框,红色圈内表示有三条线段需要合并,道路都没有属性时可以直接点ok合并。
道路有属性时,哪条道路信息重要,就在红圈内选择那条有重要信息的道路。
选择任意一条道路其它两条道路都会合并到那条道路里合并后的道路的属性会是选择的那条道路的属性5.道路生面,1道路生面,先把道路口封上,拓扑检查道路口是否都封好了,选择红色圈内的工具,又会出现一个工具栏(ArcToolbox)2先选择红色圈内的工具(由上到下),双击Feature To Polygon弹出一个对话框,在蓝色圈内选择要生面的图层,紫色圈内选择图层输出的位置,点击ok3弹出一个提示框,黑色的字母表示没有问题,出现红色的字母表示数据有问题。
ArcGis固定工具条释义(六)
ArcGis固定工具条释义(六)新的一天又开始了,ArcGisdada的任务又来了。
各位小伙伴前面章节中有什么不太清楚的可以留言讨论哦。
今天我们同样是对固定工具条进行讲解不同的是今天是最后一篇,下一篇,ArcGis将会对固定工具条使用以录制视频的方式更加清楚明了的把每一个功能键呈现给大家,同样希望觉得赞的朋友能够转发,并点击右下方的在看按钮,把你觉得有用的知识分享给到更多的人。
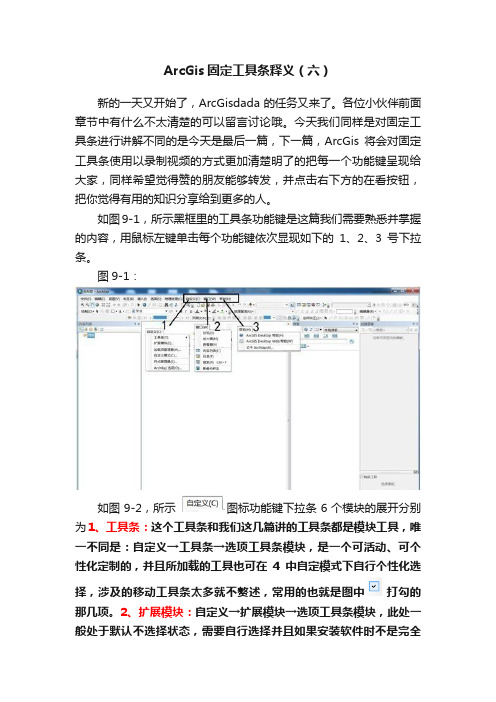
如图9-1,所示黑框里的工具条功能键是这篇我们需要熟悉并掌握的内容,用鼠标左键单击每个功能键依次显现如下的1、2、3号下拉条。
图9-1:如图9-2,所示图标功能键下拉条6个模块的展开分别为1、工具条:这个工具条和我们这几篇讲的工具条都是模块工具,唯一不同是:自定义→工具条→选项工具条模块,是一个可活动、可个性化定制的,并且所加载的工具也可在4中自定模式下自行个性化选择,涉及的移动工具条太多就不赘述,常用的也就是图中打勾的那几项。
2、扩展模块:自定义→扩展模块→选项工具条模块,此处一般处于默认不选择状态,需要自行选择并且如果安装软件时不是完全安装还需要重新安装相应模块。
目前为止,我个人近用过3D分析、ArcScan两个功能,ArcScan可用于仅有二维影像又想提取等高线的操作,也可以利用栅格图的二值化提取相应所需元素,3D分析就是利用DEM等图形做立地条件的分析和提取,关键是要获取数据材料。
其他的功能键ArcGisdada个人也在探索学习中,希望有兴趣的小伙伴可以先行使用然后把使用经历分享给ArcGisdada.3、加载项管理器:这个没用过,但看了似乎需要联网,建议各位慎用。
有经历的小伙伴同样可以分享给ArcGisdada。
4、自定义模式:这个就是个性化工具条操作功能键,第一章讲ArcGis操作界面有所涉及,这里就此略过。
5、样式管理器:如图所示是对工程文件中矢量图层显示样式图样进行选择管理的功能键。
这个比较实用,尤其是制图电脑由于下乡等原因还有一点没有完成,需要从台式电脑转到笔记本电脑制图时,之前繁琐的制图样式就可以通过此管理器导出.style文件,具体如何操作到专题制图时再向大家展示,请多多关注给予ArcGisdada写下去的动力,呵呵。
ARCGIS教程 第二十章 线、多边形要素的高级编辑
第二十章线、多边形要素的高级编辑启动ArcMap,打开地图文档\gis_ex09\ex20\ex20.mxd,data frame1 中已经加载了一个扫描处理后的图像文件scan01.tif。
点击按钮(Add Data,或选用菜单File / Add Data…),选用数据库(Geodatabase)gis_ex09\ex20\data20.mbd,双击后显示该数据库的要素集(Feature Dataset)District,双击要素集District,出现3 个要素类(Feature Class):多边形要素类County、线要素类Road、点要素类Town。
借助Windows 的Shift 键,选择这3 个要素类,点击按钮Add,3 个要素类被加载,进入data frame1。
这是个空的Geodatabase,还没有要素(如何新建Geodatabase,参见本教程第24 章)。
本练习以Geodatabase 的空间数据输入、编辑为例,练习线、多边形要素的高级编辑技巧和方法。
1 线要素的高级编辑在ArcMap标准按钮一栏中点击按钮(或菜单中选用View / Toolbars / Editor),调出Editor 工具条,在Editor 工具栏中选用菜单Editor / Start Editing,进入编辑状态。
在Task 下拉列表中,选择Create Task / Create New Features;在Target 下拉列表中选择要编辑的目标图层Road,开始线要素Road 的输入。
使用第19 章中已经练习过的线要素基本输入、编辑方法,沿扫描图上的道路输入。
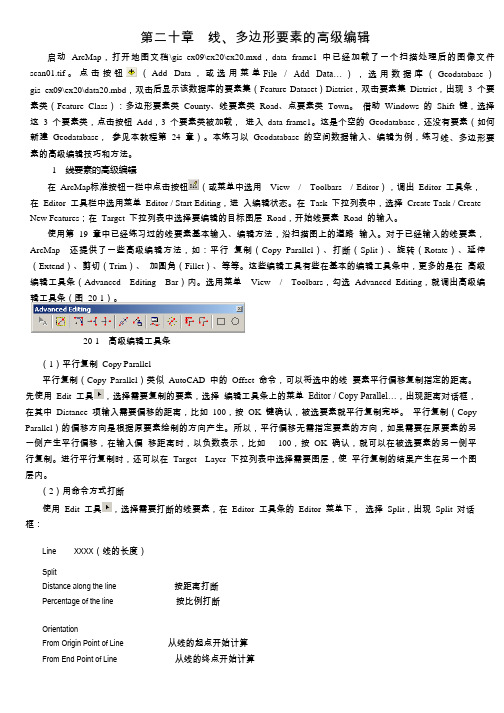
对于已经输入的线要素,ArcMap 还提供了一些高级编辑方法,如:平行复制(Copy Parallel)、打断(Split)、旋转(Rotate)、延伸(Extend)、剪切(Trim)、加圆角(Fillet)、等等。
这些编辑工具有些在基本的编辑工具条中,更多的是在高级编辑工具条(Advanced Editing Bar)内。
arcgis面转点逻辑
在ArcGIS中,将面要素转换为点要素可以通过以下步骤完成:
1. 打开ArcMap软件并加载包含面要素的图层。
2. 确保编辑工具栏处于激活状态。
如果未显示编辑工具栏,请导航到"Customize(自定义)"菜单,选择"Toolbars(工具栏)",然后勾选"Editor(编辑器)"。
3. 单击编辑工具栏上的"Editor(编辑器)"按钮,并选择"Start Editing(开始编辑)"以启动编辑模式。
4. 在编辑工具栏上,选择"Create Features(创建要素)"工具。
5. 在要素类列表中,选择包含面要素的图层。
6. 在要素模板列表中,选择要创建的点要素类型。
7. 单击地图上的面要素的任意位置,以创建与面相交的点要素。
你可以重复此步骤以创建更多的点要素。
8. 完成点要素的创建后,单击编辑工具栏上的"Editor(编辑器)"按钮,并选择"Stop Editing(停止编辑)"以退出编辑模式。
9. 保存编辑结果。
经过以上步骤,你就可以将面要素转换为点要素。
请注意,这种转换会在原始面要素上创建新的点要素,但不会删除或改变原始面要素。
1。
- 1、下载文档前请自行甄别文档内容的完整性,平台不提供额外的编辑、内容补充、找答案等附加服务。
- 2、"仅部分预览"的文档,不可在线预览部分如存在完整性等问题,可反馈申请退款(可完整预览的文档不适用该条件!)。
- 3、如文档侵犯您的权益,请联系客服反馈,我们会尽快为您处理(人工客服工作时间:9:00-18:30)。
中点工具
a单击编辑工具条中的中点工具;
b在图中点击两点画一条线;
d这条线的中点将作为新创建的线的一个点;
e继续画线,每一条线的中点将作为新创建线的点.
Midpoint
n.中点,正中央
终点弧工具
a单击编辑工具条中的工具中点弧工具;
b点击弧线的起点;
c点击弧线的终点;
d移动鼠标确定合适的弧度.
切线工具
a在画完一段弧线之后,单击编辑工具条中的工具切线工具;
b点击任意一点画第二个点;
c确定的弧线和原来的弧线相切.
Tangent。['tændʒənt]
n.<数>正切;切线,(铁路或道路的)直线区间,突兀的转向;离题,
adj.<数>正切的;相切的;切线的,离题的;背离原来途径的
距离-距离工具
a单击编辑工具条中的距离-距离工具;
b单击图中任意一点,以此点为圆心画圆,按D键后输入数字,确定半径;
c单击图中任意一点,以此点为圆心画圆,按D键后输入数字,确定半径;
d两个圆的交点作为创建线的一个点;
e按上述方法继续创建线的其他点.
Distance
n.距离,间距,远处,远方,(时间或空间的)相距
方向-距离工具
a单击编辑工具条中的方向-距离工具;
b单击图中任意一点,确定方向后单击;
c单击图一点,以此点为圆心画圆,按D键后输入数字,确定半径;
d圆与线的交点将做为新创建线的一点;
e按上述方法继续创建线的其他点.
跟踪工具
例如,要在已知的地块边界线,输入离开边界10m的建筑物控制线。先用要素选择工具(Edit Tool)选中地块边界线,然后选择跟踪工具(Trace Tool),按键盘O键,在对话框中输入要偏移的距离(e.g. 10)按OK键确认,就可用光标追踪输入相距单位为10的控制线.
旋转工具
选取要素后,点击Rotate按钮可以旋转要素.
Rotate
vt. & vi.(使某物)旋转[转动],(使某人或某物)轮流[按顺序循环]
vi.回溯;追溯,沿着路(或路线)走,
打断工具
略
Split
vt. & vi.(使)裂开; (使)破裂,
vt.分裂,使分裂(成不同的派别);使分离,使不团结,分开,使分开(成为几个部份),分担;分摊;分享,划破;割破;碰破,
n.分歧;分裂;分离,划分;分别;份额,裂缝;裂口,
vi.[口语](人与人)关系不和;离婚,被撞碎,破碎成片,
在绘制面状图层的时候利用自动跟踪工具,可以减少很多工作量。比如利用县界绘制面状的线。先选中目标屠城,将要跟镇南关的线段选中,再选择trace tool开始跟踪,最后回到起点的时候双击鼠标,就会得到闭合多边形。
Trace
vt.跟踪,追踪,发现;找到,描绘;标出;画出…的轮廓;画曲线;描绘;草拟,
n.踪迹;痕迹;形迹,极微的量,记录器的图录,描记线,【电子学】示踪;轨迹;脉迹,
Editor工具条操作教程
பைடு நூலகம்工具
使用方法
单词备注
草图工具
略
Sketch: [sketʃ. n.草图;素描;速写,梗概,大意,幽默短剧;小品,
vt. & vi.素描;作…的略图,概述;简述,草草地做;应付;敷衍,
交点工具
Intersection
n.横断;交叉,交叉点,十字路口,交集
弧线工具
Arc
n.弧,弧线,弧形,弧形物,
