Oracle小型机日常巡检
oracle日常维护巡检工作汇总
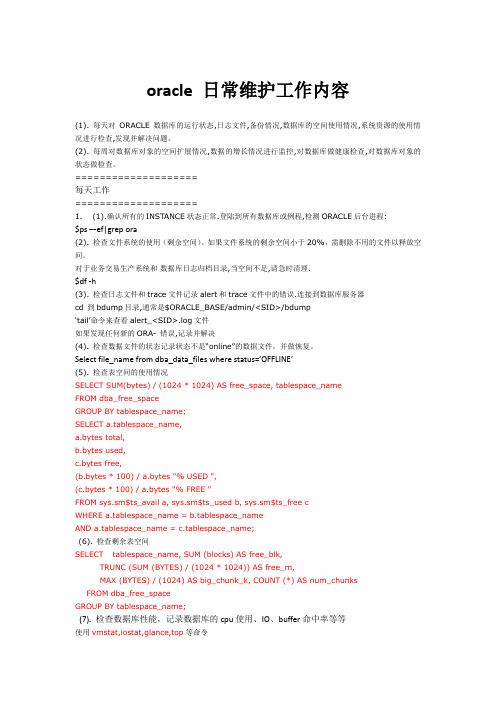
oracle 日常维护工作内容(1). 每天对ORACLE数据库的运行状态,日志文件,备份情况,数据库的空间使用情况,系统资源的使用情况进行检查,发现并解决问题。
(2). 每周对数据库对象的空间扩展情况,数据的增长情况进行监控,对数据库做健康检查,对数据库对象的状态做检查。
====================每天工作====================1.(1).确认所有的INSTANCE状态正常.登陆到所有数据库或例程,检测ORACLE后台进程:$ps –-ef|grep ora(2). 检查文件系统的使用(剩余空间)。
如果文件系统的剩余空间小于20%,需删除不用的文件以释放空间。
对于业务交易生产系统和数据库日志归档目录,当空间不足,请急时清理.$df -h(3). 检查日志文件和trace文件记录alert和trace文件中的错误.连接到数据库服务器cd 到bdump目录,通常是$ORACLE_BASE/admin/<SID>/bdump‘tail’命令来查看alert_<SID>.log文件如果发现任何新的ORA- 错误,记录并解决(4). 检查数据文件的状态记录状态不是“online”的数据文件,并做恢复。
Select file_name from dba_data_files where status=’OFFLINE’(5). 检查表空间的使用情况SELECT SUM(bytes) / (1024 * 1024) AS free_space, tablespace_nameFROM dba_free_spaceGROUP BY tablespace_name;SELECT a.tablespace_name,a.bytes total,b.bytes used,c.bytes free,(b.bytes * 100) / a.bytes "% USED ",(c.bytes * 100) / a.bytes "% FREE "FROM sys.sm$ts_avail a, sys.sm$ts_used b, sys.sm$ts_free cWHERE a.tablespace_name = b.tablespace_nameAND a.tablespace_name = c.tablespace_name;(6). 检查剩余表空间SELECT tablespace_name, SUM (blocks) AS free_blk,TRUNC (SUM (BYTES) / (1024 * 1024)) AS free_m,MAX (BYTES) / (1024) AS big_chunk_k, COUNT (*) AS num_chunks FROM dba_free_spaceGROUP BY tablespace_name;(7). 检查数据库性能,记录数据库的cpu使用、IO、buffer命中率等等使用vmstat,iostat,glance,top等命令====================每周工作====================(1). 监控数据库对象的空间扩展情况根据本周每天的检查情况找到空间扩展很快的数据库对象,并采取相应的措施alter tablespace 表空间名add datafile '/u1/oradata/userdata_002.ora' size *m;(2). 检查无效的数据库对象SELECT owner, object_name, object_typeFROM dba_objectsWHERE status = 'invalid';(3). 检查不起作用的约束SELECT owner, constraint_name, table_name, constraint_type, statusFROM dba_constraintsWHERE status = 'DISABLED' AND constraint_type = 'P' ;(4). 检查无效的triggerSELECT owner, trigger_name, table_name, statusFROM dba_triggersWHERE status = 'DISABLED';====================每月的工作====================(1). 检查表空间碎片根据本月每周的检查分析数据库碎片情况,找到相应的解决方法(2). 寻找数据库性能调整的机会比较每天对数据库性能的监控报告,确定是否有必要对数据库性能进行调整(3). 数据库性能调整如有必要,进行性能调整(4). 提出下一步空间管理计划根据每周的监控,提出空间管理的改进方法============================================================================|| ★★★Oracle DBA 日常管理★★★||============================================================================目的:这篇文档有很详细的资料记录着对一个甚至更多的ORACLE 数据库每天的,每月的,每年的运行的状态的结果及检查的结果,在文档的附录中你将会看到所有检查,修改的SQL和PL/SQL 代码。
Oracle巡检内容

Oracle巡检内容1. Oracle进程检查Ps –ef |grep ora2. CRS进程检查$ps –df |grep d.bin应有:crsd.bin ocssd.bin evmd.bincrsctl check crscrs_stat –tcrs_stat –lsasm进程检查:ps –ef|grep asmORACLE_SID=+ASM1select group_number,name,state,total_mb,free_mb from v$asm_diskgroup;select * from v$asm_disk;检查数据库状态:srvctl status database –d dbname3. Oracle数据库实例状态检查SELECT inst_id, instance_name, host_name, VERSION, TO_CHAR(startup_time, 'yyyy-mm-dd hh24:mi:ss') startup_time, status, archiver,database_status FROM gv$instance;4. Oracle数据库打开状态检查SELECT inst_id, dbid, NAME, TO_CHAR (created, 'yyyy-mm-dd hh24:mi:ss') created, log_mode, TO_CHAR (version_time, 'yyyy-mm-dd hh24:mi:ss') version_time,open_modeFROM gv$database;5. 数据库表空间使用情况检查;5.1 表空间的空间使用情况SELECT df.tablespace_name, COUNT (*) datafile_count,ROUND (SUM (df.BYTES) / 1048576) size_mb,ROUND (SUM (free.BYTES) / 1048576, 2) free_mb,ROUND (SUM (df.BYTES) / 1048576 - SUM (free.BYTES) / 1048576, 2 ) used_mb,ROUND (MAX (free.maxbytes) / 1048576, 2) maxfree,100 - ROUND (100.0 * SUM (free.BYTES) / SUM (df.BYTES), 2) pct_used, ROUND (100.0 * SUM (free.BYTES) / SUM (df.BYTES), 2) pct_freeFROM dba_data_files df,(SELECT tablespace_name, file_id, SUM (BYTES) BYTES, MAX (BYTES) maxbytes FROM dba_free_space GROUP BY tablespace_name, file_id) free WHERE df.tablespace_name = free.tablespace_name(+) AND df.file_id =free.file_id(+)GROUP BY df.tablespace_name ORDER BY 8;5.2 表空间可用性检查select tablespace_name,status from dba_tablespaces;5.3 临时表空间使用情况和性能检查SELECT tablespace_name, extent_management, block_size, initial_extent,next_extent, min_extents, max_extents, pct_increase FROM dba_tablespaces WHERE CONTENTS = 'TEMPORARY';SELECT username, default_tablespace, temporary_tablespace FROM dba_users;期望结果:根据现场实际情况,应用用户的缺省表空间不能为system,临时表空间必须为temp。
oracle日常巡检内容
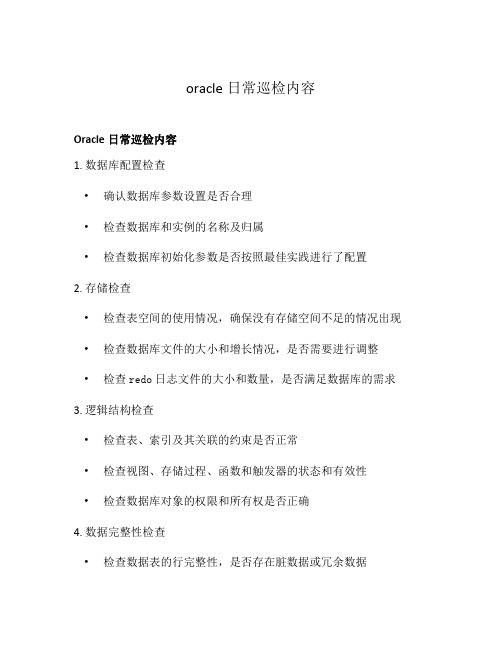
oracle日常巡检内容Oracle日常巡检内容1. 数据库配置检查•确认数据库参数设置是否合理•检查数据库和实例的名称及归属•检查数据库初始化参数是否按照最佳实践进行了配置2. 存储检查•检查表空间的使用情况,确保没有存储空间不足的情况出现•检查数据库文件的大小和增长情况,是否需要进行调整•检查redo日志文件的大小和数量,是否满足数据库的需求3. 逻辑结构检查•检查表、索引及其关联的约束是否正常•检查视图、存储过程、函数和触发器的状态和有效性•检查数据库对象的权限和所有权是否正确4. 数据完整性检查•检查数据表的行完整性,是否存在脏数据或冗余数据•检查约束的有效性和唯一性,是否存在违反约束的数据5. 性能检查•检查数据库的运行性能,包括CPU利用率、内存使用和磁盘I/O 等指标•检查SQL的执行计划,优化可能存在的性能瓶颈•检查数据库连接数和会话数,是否超过系统的承载能力6. 安全性检查•检查用户权限,确保每个用户的权限不超过其所需•检查密码策略和账号锁定设置,防范未授权访问和暴力破解•检查数据库日志和审计功能的开启情况,以跟踪和监控潜在的安全风险7. 备份和恢复检查•检查数据库的备份策略是否合理,并进行备份的可行性验证•检查恢复策略和操作步骤,确认数据库故障时的可靠性和可恢复性•检查归档日志的生成和转储情况,确保数据库的连续性和完整性8. 资源利用检查•检查数据库的资源利用情况,包括SGA和PGA的大小及利用率•检查数据文件、临时文件和日志文件的大小和利用率•检查并发和批处理作业,以保障系统资源的合理分配与利用以上是Oracle日常巡检的一些常见内容,通过对数据库配置、存储、逻辑结构、数据完整性、性能、安全性、备份恢复和资源利用等方面的检查,可以确保数据库的稳定性、安全性和可靠性。
巡检内容的具体细节可以根据实际需求进行适当调整和补充。
9. 日志监控•检查数据库日志文件的大小和增长情况,是否超过了预设阈值•检查日志文件的生成和转储是否正常,确保日志的连续性和完整性•监控错误日志和警告日志,及时发现并解决潜在的问题10. 定期维护•执行定期维护任务,例如统计表和索引的信息,更新数据库统计信息•定期收集和分析数据库性能指标,并作出相应的调整和优化•检查数据库软件及补丁的更新情况,确保数据库系统的安全和稳定11. 连接和会话管理•检查数据库连接数和会话数的变化趋势,确保系统的可用性和稳定性•监控长时间运行的会话和阻塞会话,及时解决可能的问题•检查连接和会话的权限和资源限制,防止滥用和资源浪费12. 监控和告警•设置数据库的监控和告警机制,及时发现和解决潜在的问题•监控数据库的系统资源利用率,预测和避免系统性能下降•监控数据库对象的变化和异常操作,保障数据的安全性和完整性13. 灾备和容灾•检查灾备和容灾系统的配置和状态,确保备份和恢复的可靠性•定期测试灾备和容灾方案的可行性,并进行必要的调整和优化•监控主备数据库之间的数据同步情况,保证数据的一致性和可用性14. 文档和记录•维护数据库巡检的文档和记录,包括巡检日期、巡检内容和发现的问题•归档和备份巡检记录,以便日后的审查和比对•根据巡检结果制定和执行相应的改进措施,持续优化数据库的运行和管理巡检内容的详细执行方法和频率将根据数据库的特定需求和环境进行调整和规划。
Oracle小型机日常巡检
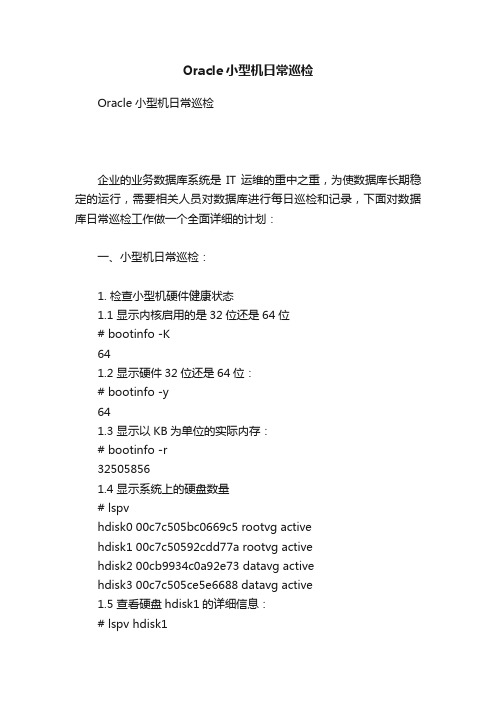
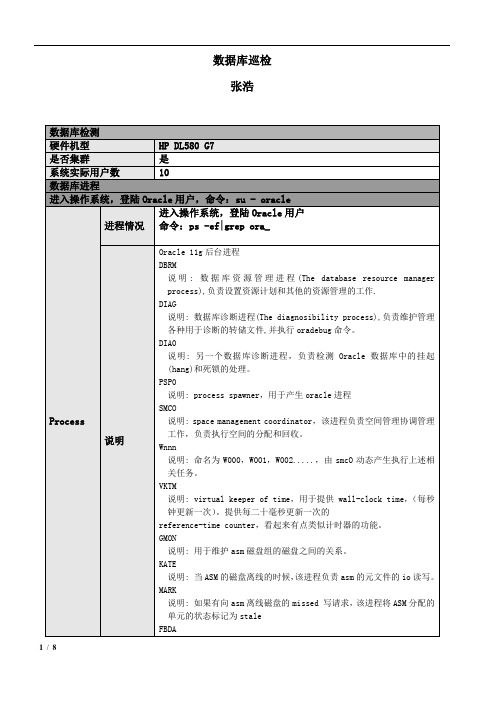
Oracle小型机日常巡检Oracle小型机日常巡检企业的业务数据库系统是IT运维的重中之重,为使数据库长期稳定的运行,需要相关人员对数据库进行每日巡检和记录,下面对数据库日常巡检工作做一个全面详细的计划:一、小型机日常巡检:1. 检查小型机硬件健康状态1.1 显示内核启用的是32位还是64位# bootinfo -K641.2 显示硬件32位还是64位:# bootinfo -y641.3 显示以KB为单位的实际内存:# bootinfo -r325058561.4 显示系统上的硬盘数量# lspvhdisk0 00c7c505bc0669c5 rootvg activehdisk1 00c7c50592cdd77a rootvg activehdisk2 00cb9934c0a92e73 datavg activehdisk3 00c7c505ce5e6688 datavg active1.5 查看硬盘hdisk1的详细信息:# lspv hdisk1PHYSICAL VOLUME: hdisk1 VOLUME GROUP: rootvgPV IDENTIFIER: 00c7c50592cdd77a VG IDENTIFIER 00c7c50500004c0000000129bc06773fPV STATE: activeSTALE PARTITIONS: 0 ALLOCATABLE: yesPP SIZE: 512 megabyte(s) LOGICAL VOLUMES: 14TOTAL PPs: 558 (285696 megabytes) VG DESCRIPTORS: 2FREE PPs: 224 (114688 megabytes) HOT SPARE: noUSED PPs: 334 (171008 megabytes) MAX REQUEST: 1 megabyteFREE DISTRIBUTION: 01..00..00..111..112USED DISTRIBUTION: 111..112..111..00..00MIRROR POOL: None# smitty fs# smitty lvm1.6 查看处理器数量:# lscfg | grep proc+ proc0 Processor+ proc2 Processor+ proc4 Processor+ proc6 Processor1.7 查看一个CPU的详细信息:# lsattr -El proc0frequency 4204000000 Processor Speed Falsesmt_enabled true Processor SMT enabled Falsesmt_threads 2 Processor SMT threads Falsestate enable Processor state Falsetype PowerPC_POWER6 Processor type False#1.8 查看系统硬件资源列表:#lscfg1.9 查看芯片类型:# uname -ppowerpc1.10 查看操作系统版本号:oslevel1.11 显示系统名称:# uname -sAIX1.12 显示节点名称:# uname -nDL-DB-021.13 显示uname的很多信息(系统名称、节点名称、版本、计算机ID):# uname -aAIX DL-DB-02 1 6 00C7C5054C001.14 显示系统型号:# uname -MIBM,8204-E8A1.15 显示操作系统版本:# uname -v61.16 显示运行系统的硬件的计算机ID编号:# uname-m00C7C5054C001.17 显示系统ID编号:# uname -uIBM,02067C5051.18 显示AIX的主要版本、次要版本和维护级:# oslevel -r6100-04# lslpp -h bos.rteFileset Level Action Status Date Time----------------------------------------------------------------------------Path: /usr/lib/objreposbos.rte6.1.4.0 COMMIT COMPLETE 07/10/10 19:07:31Path: /etc/objreposbos.rte6.1.4.0 COMMIT COMPLETE 07/10/10 19:07:31#1.19 查看磁盘使用情况(参数k表示以k为单位,m表示以M为单位):# df -kFilesystem 1024-blocks Free %Used Iused %Iused Mounted on/dev/hd4 5242880 5039512 4% 14271 2% //dev/hd2 11534336 5382688 54% 52471 5% /usr/dev/hd9var 5242880 4544720 14% 7487 1% /var/dev/hd3 10485760 10397956 1% 4002 1% /tmp/dev/fwdump 1048576 1046932 1% 13 1% /var/adm/ras/platform/dev/hd1 5242880 5241708 1% 8 1% /home/dev/hd11admin 524288 523848 1% 5 1% /admin/proc - - - - - /proc/dev/hd10opt 10485760 5696856 46% 10713 1% /opt/dev/livedump 524288 523880 1% 4 1% /var/adm/ras/livedump/dev/oradmpbak 10485760 4488028 58% 28042 3% /orainstbak1/dev/oraclebak 62914560 9605248 85% 33 1% /oradatabak1 /dev/oradata 367001600 321016968 13% 33 1% /oradata/dev/orainst 20971520 14943512 29% 28707 1% /orainst1.20 查看文件大小# du -s tmp166552 tmp2. 检查系统报错信息2.1 显示简短报错信息# errpt | moreTIMESTAMP: MMDDHHMMYY (月日时分年)T(类型): P 永久; T 临时; U 未知(永久性的错误应引起重视)C(分类): H 硬件; S 软件; O 用户; U未知2.2 列出所有硬件出错信息:# errpt -d H2.3 列出所有软件出错信息:# errpt -d S2.4 查看具体某个ID的报错信息:# errpt -aj D666A8C7 > aaa.txtD666A8C7是简短报错信息中的ID号。
Oracle巡检手册

如果有记录返回,则说明存在无效对象。若这些对象与应用相关,那么需要重新编译生成这个对象。
3.6检查回滚段情况
3.6.1检查回滚段状态
输出结果中所有回滚段的“STATUS”该为“ONLINE”。
3.6.2检查是否有回滚段争用
发生回滚段争用时,需要审视争用情况,即哪些用户正在使用回滚段资源
检查监听进程是否存在:
二、检查系统和Oracle日志文件
检查相关的日志文件,包含:检查操作系统的日志文件,检查Oracle日志文件,检查Oracle核心转储目录,检查root用户和oracle用户的email,检查数据库的字符集,总共五个部分。
2.1检查操作系统日志文件
查看是否有与Oracle用户相关的出错信息。
3.3检查Oracle表空间情况
输出结果中STATUS应该都为ONLINE。
3.4检查Oracle所有数据文件情况
输出结果中“STATUS”应该都为“ONLINE”。
或者:
输出结果中“STATUS”应该都为“AVAILABLE”。
3.5检查对象情况
3.5.1检查对象类别和大小
合理分配资源,将冗余以及临时表定期进行清理,释放资源空间。
表空间不够
增加数据文件到相应的表空间
出现ORA-600
根据日志文件的内容查看相应的TRC文件,如果是Oracle的bug,要及时打上相应的补丁
Listener日志:$ORACLE_HOME/network/log/sqlnet.log
2.3检查Oracle核心转储目录
如果上面命令的结果每天都在增长,则说明Oracle进程经常发生核心转储。这说明某些用户进程或者数据库后台进程由于无法处理的原因而异常退出。频繁的核心转储特别是数据库后台进程的核心转储会导致数据库异常终止。
小型机日常检查维护和备份

三、日常检查维护1.文件系统是否满方法:df –k 可以以K为单位检查文件系统的使用率。
(90%以上,需要调整)df –m –groot@smk_exchange2:〉df -mFilesystem MB blocks Free %Used Iused %Iused Mounted on/dev/hd4 4096.00 4012.76 3%6152 1% //dev/hd2 8192。
00 6277。
69 24% 41437 3%/usr/dev/hd9var 8192.00 7947。
95 3% 7095 1%/var/dev/hd3 2048.00 1929.64 6%102 1%/tmp/dev/hd1 40960。
00 40451.16 2% 1775 1% /home/proc —- —- - /proc/dev/hd10opt 40960.00 40756.11 1% 8568 1% /optroot@smk_exchange2:〉df —gFilesystem GB blocks Free %Used Iused %Iused Mounted on/dev/hd4 4.00 3。
92 3% 6152 1%//dev/hd2 8。
00 6.13 24%41437 3%/usr/dev/hd9var 8。
00 7.76 3% 7095 1% /var/dev/hd3 2.00 1。
88 6% 102 1%/tmp/dev/hd1 40。
00 39。
50 2%1775 1% /home/proc —- - - - /proc/dev/hd10opt 40。
00 39。
80 1% 8568 1%/optroot@smk_exchange2:>“Iused"是什么意思?已使用的i-node,i-node是分配给文件系统的文件节点,它决定文件系统中文件和文件夹的总数.节点,文件系统下,每个文件,目录都需要的,如果节点用完了,就是该文件系统还有空间,也不能再往里面放东西了,节点和文件,目录一一对应的。
oracle健康检查(巡检)手册

性能检查
数据库性能
检查数据库的整体性能,包括响应时间、吞吐量 和资源利用率等。
查询性能
检查特定查询的性能,包括执行计划、索引和查 询优化等方面。
锁和争用
检查数据库中的锁和争用情况,以发现潜在的性 能瓶颈和问题。
03 Oracle数据库巡检方法
手动巡检方法
数据库日志检查
检查Oracle数据库的日志文件,包括警告日志、跟踪文件等,以发现 潜在的问题和错误。
远程巡检方法
远程监控
01
通过远程监控工具,实时监控Oracle数据库的运行状态和性能
指标。
远程诊断
02
通过远程诊断工具,远程连接到数据库服务器,对数据库进行
故障排除和诊断。
远程备份与恢复
03
通过远程备份与恢复工具,远程备份和恢复Oracle数据库的数
据和日志文件。
04 Oracle数据库巡检结果分 析
Oracle Enterprise Manager (OEM): OEM是一个集成的平台,用于自动监控、 诊断和优化Oracle数据库的性能。
Automatic Database Diagnostic Monitor (ADDM):ADDM是一个 自动化的性能诊断工具,可以自动 发现和解决性能问题。
在此添加您的文本16字
内存优化
在此添加您的文本16字
调整内存参数:根据数据库的实际需求,合理配置内存参 数,如SGA和PGA的大小。
在此添加您的文本16字
内存泄漏检测:定期检查内存使用情况,发现内存泄漏并 及时处理。
软件优化建议
调整初始化参数
根据数据库的性能需求,调整初始化参数,如打开表的数量、共 享池的大小等。
巡检结果数据收集
如何对Oracle数据库进行日常巡检
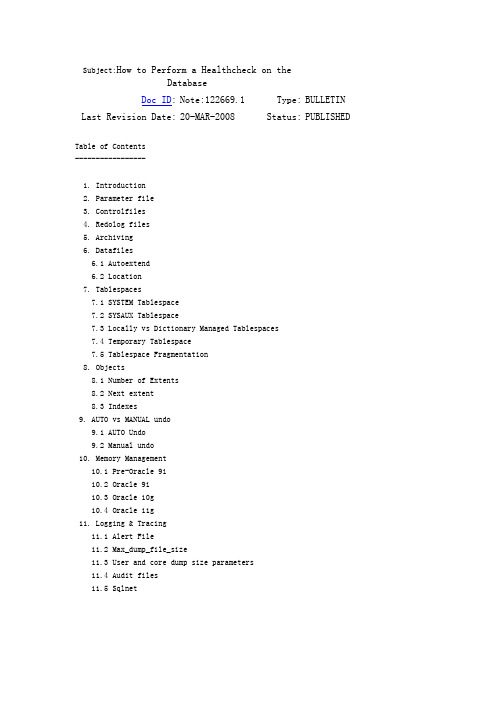
Subject:How to Perform a Healthcheck on theDatabaseDoc ID: Note:122669.1 Type: BULLETIN Last Revision Date: 20-MAR-2008 Status: PUBLISHEDTable of Contents-----------------1. Introduction2. Parameter file3. Controlfiles4. Redolog files5. Archiving6. Datafiles6.1 Autoextend6.2 Location7. Tablespaces7.1 SYSTEM Tablespace7.2 SYSAUX Tablespace7.3 Locally vs Dictionary Managed Tablespaces7.4 Temporary Tablespace7.5 Tablespace Fragmentation8. Objects8.1 Number of Extents8.2 Next extent8.3 Indexes9. AUTO vs MANUAL undo9.1 AUTO Undo9.2 Manual undo10. Memory Management10.1 Pre-Oracle 9i10.2 Oracle 9i10.3 Oracle 10g10.4 Oracle 11g11. Logging & Tracing11.1 Alert File11.2 Max_dump_file_size11.3 User and core dump size parameters11.4 Audit files11.5 Sqlnet1. Introduction---------------This article explains how to perform a health check on the database. General guidelines are given on what areas to investigate to get a better overview onhow the database is working and evolving. These guidelines will reveal common issues regarding configuration as well as problems that may occur in the future.The areas investigated here are mostly based on scripts and are brought to you without any warranty, these scripts may need to be adapted for next database releases and features. This article will probably need to be extended to serve specific application needs/checks.Although some performance areas are discussed in this article, it is not the intention of this article to give a full detailed explanation of optimizing the database performance.General scripts that help track information on the database:=)> Note 250262.1 Health Check / Validation Engine Guide=)> Note 136697.1“hcheck8i.sql” script to check for known problems in Oracle8i, Oracle9i, and Oracle10g2. Parameter file-----------------The parameter file can exists in 2 forms. First of all we have the text-based version, commonly referred to as init.ora or pfile, and a binary-based file, commonly referred to as spfile. The pfile can be adjusted using a standard Operating System editor, while the spfile needs to be managed through the instance itself.It is important to realize that the spfile takes presedence above the pfile, meaning whenever there is an spfile available this will be automatically taken unless specified otherwise.NOTE: Getting an RDA report after making changes to the database configuration is also a recommendation. Keeping historical RDA reports will ensure you havean overview of the database configuration as the database evolves.Reference:Note 249664.1: Pfile vs SPfile3. Controlfiles---------------It is highly recommended to have at least two copies of the controlfile. This can be done by mirroring the controlfile, strongly recommended on different physicaldisks. If a controlfile is lost, due to a disk crash for example, then you canuse the mirrored file to startup the database. In this way fast and easy recovery from controlfile loss is obtained.connect as sysdbaSQL> select status, name from v$controlfile;STATUS NAME------- ---------------------------------/u01/oradata/L102/control01.ctl/u02/oradata/L102/control02.ctlThe location and the number of controlfiles can be controlled by the 'control_files' initialization parameter.4. Redolog files----------------The Oracle server maintains online redo log files to minimize loss of data in the database. Redo log files are used in a situation such as instance failure to recover commited data that has not yet been written to the data files. Mirroring theredo log files, strongly recommended on different physical disks, makes recovery more easy in case one of the redo log files is lost due to a disk crash, user delete, etc.connect as sysdbaSQL> select * from v$logfile;GROUP# STATUS TYPE MEMBER--------- ------- ------ -----------------------------------1 ONLINE /u01/oradata/L102/redo01_A.log1 ONLINE /u02/oradata/L102/redo01_B.log2 ONLINE /u01/oradata/L102/redo02_A.log2 ONLINE /u02/oradata/L102/redo02_B.log3 ONLINE /u01/oradata/L102/redo03_A.log3 ONLINE /u02/oradata/L102/redo03_B.logAt least two redo log groups are required, although it is advisable to have at least three redo log groups when archiving is enabled (see the following chapter). It is common, in environments where there are intensive log switches, to see the ARCHiver background process fall behind of the LGWR background process. In this case the LGWRprocess needs to wait for the ARCH process to complete archiving the redo log file.References :Note 102995.1 Maintenance of Online Redo Log Groups and Members5. Archiving------------Archiving provides the mechanism needed to backup the changes of the database.The archive files are essential in providing the necessary information to recover the database. It is advisable to run the database in archive log mode, although you may have reasons for not doing this, for example in case of a TEST environment where you accept to loose the changes made between the current time and the last backup.You may ignore this chapter when the database doesn't run in archive log mode.There are several ways of checking the archive configuration, below is one of them:connect as sysdbaSQL> archive log listDatabase log mode No Archive Mode --OR-- Archive ModeAutomatic archival Disabled --OR-- EnabledArchive destination <arch. dest.> --OR-- USE_DB_RECOVERY_FILE_DESTOldest online log sequence seq. noCurrent log sequence seq. noPre-10g, if the database is running in archive log mode but the automatic archiver process is disabled, then you were required to manually archive the redolog files. If this is not done in time then the database is frozen and any activity is prevented. Therefore you should enable automatic archiving when the database is running in archive log mode. This can be done by setting the 'log_archive_start' parameter to true in the parameter file.Starting from 10g, this parameter became obsolete and is no longer required to be set explicitly. It is important that there is enough free space on the dedicated disk(s) for the archive files, otherwise the ARCHiver process can't write and a crash is inevitable.References:Note 69739.1 How to Turn Archiving ON and OFFNote 122555.1 Determine how many disk space is needed for the archive files6. Datafiles------------6.1 Autoextend~~~~~~~~~~~~~~~The autoextend command option enables or disables the automatic extension ofdata files. If the given datafile is unable to allocate the space needed, itcan increase the size of the datafile to make space for objects to grow.A standard Oracle datafile can have, at most, 4194303 Oracle datablocks.So this also implies that the maximum size is dependant on the Oracle Block size used.DB_BLOCK_SIZE Max Mb value to use in any command~~~~~~~~~~~~~ ~~~~~~~~~~~~~~~~~~~~~~~~~~~~~~~~~~~2048 8191 M4096 16383 M8192 32767 M16384 65535 Mstarting from Oracle 10g, we have a new functionality called BIGFILE, whichallows for bigger files to be created. Please also consider that every Operating System has its limits, therefore you should make sure that the maximum size ofa datafile cannot be extended past the Operating System allowed limit.To determine if a datafile and thus, a tablespace, has AUTOEXTEND capabilities:SQL> select file_id, tablespace_name, bytes, maxbytes, maxblocks, increment_by, file_namefrom dba_data_fileswhere autoextensible = 'YES';Reference:Note 112011.1: ALERT: RESIZE or AUTOEXTEND can "Over-size" Datafiles and Corrupt the DictionaryNote 262472.1: 10g BIGFILE Type Tablespaces Versus SMALLFILE Type6.2 Location~~~~~~~~~~~~~Verify the location of your datafiles. Overtime a database will grow and datafiles may be added to the database. Avoid placing datafiles on a 'wherever there is space' basis as this will complicate backup strategies and maintenance.Below is an example of bad usage:SQL> select * from v$dbfile;FILE# NAME--------- --------------------------------------------------1 D:\DATABASE\SYS1D806.DBF2 D:\DATABASE\D806\RBS1D806.DBF3 D:\DATABASE\D806\TMP1D806.DBF5 D:\DATABASE\D806\USR1D806.DBF6 D:\USR2D806.DBF7 F:\ORACLE\USR3D806.DBF7. Tablespaces--------------7.1 SYSTEM Tablespace~~~~~~~~~~~~~~~~~~~~~~User objects should not be created in the system tablespace. Doing so can lead to unnecessary fragmentation and preventing system tables of growing. The following queryreturns a list of objects that are created in the system tablespace but not owned by SYS or SYSTEM.SQL> select owner, segment_name, segment_typefrom dba_segmentswhere tablespace_name = 'SYSTEM'and owner not in ('SYS','SYSTEM');7.2 SYSAUX Tablespace (10g Release and above)~~~~~~~~~~~~~~~~~~~~~~The SYSAUX tablespace was automatically installed as an auxiliary tablespace to the SYSTEM tablespace when you created or upgraded the database. Some database components that formerly created and used separate tablespaces now occupy theSYSAUX tablespace.If the SYSAUX tablespace becomes unavailable, core database functionality will remain operational. The database features that use the SYSAUX tablespace could fail, or function with limited capability.The amount of data stored in this tablespace can be significant and may growover time to unmanageble sizes if not configured properly. There are a fewcomponents that need special attention.To check which components are occupying space:select space_usage_kbytes, occupant_name, occupant_descfrom v$sysaux_occupantsorder by 1 desc;Reference:Note 329984.1: Usage and Storage Management of SYSAUX tablespace occupants SM/AWR, SM/ADVISOR, SM/OPTSTAT and SM/OTHER7.3 Locally vs Dictionary Managed Tablespaces~~~~~~~~~~~~~~~~~~~~~~~~~~~~~~~~~~~~~~~~~~~~~~Locally Managed Tablespaces are available since Oracle 8i, however they becamethe default starting from Oracle 9i. Locally Managed Tablespaces, also referred to as LMT, have some advantage over Data Dictionary managed tablespaces.To verify which tablespace is Locally Managed or Dictionary Managed, you can run the following query:SQL> select tablespace_name, extent_managementfrom dba_tablespaces;Reference:Note 93771.1: Introduction to Locally-Managed TablespacesNote 105120.1: Advantages of Using Locally Managed vs Dictionary Managed Tablespaces7.4 Temporary Tablespace~~~~~~~~~~~~~~~~~~~~~~~~~o Locally Managed Tablespaces use tempfiles to serve the temporary tablespace, whereas Dictionary Managed Tablespaces use a tablespace of the type temporary. When you are running an older version (pre Oracle 9i), then it is important to check the type of tablespace used to store the temporary segments. By default, all tablespaces are created as PERMANENT, therefore you should make sure that the tablespace dedicated for temporary segments is of the type TEMPORARY.SQL> select tablespace_name, contentsfrom dba_tablespaces;TABLESPACE_NAME CONTENTS------------------------------ ---------SYSTEM PERMANENTUSER_DATA PERMANENTROLLBACK_DATA PERMANENTTEMPORARY_DATA TEMPORARYo Make sure that the users on the database are assigned a tablespace of thetype temporary. The following query lists all the users that have a permanent tablespace specified as their default temporary tablespace.SQL> select ername, t.tablespace_namefrom dba_users u, dba_tablespaces twhere u.temporary_tablespace = t.tablespace_nameand t.contents <> 'TEMPORARY';Note: User SYS and SYSTEM will show the SYSTEM tablespace as there defaulttemporary tablespace. This value can be altered as well to prevent fragmentation in the SYSTEM tablespace.SQL> alter user SYSTEM temporary tablespace TEMP;o The space allocated in the temporary tablespace is reused. This is done forperformance reasons to avoid the bottleneck of constant allocating and de-allocating of extents and segments. Therefore when looking at the free space in the temporary tablespace, this may appear as full all the time. The following are a few queries that can be used to list more meaningful information about the temporary segment usage:This will give the size of the temporary tablespace:SQL> select tablespace_name, sum(bytes)/1024/1024 mbfrom dba_temp_filesgroup by tablespace_name;This will give the "high water mark" of that temporary tablespace (= max used at one time):SQL> select tablespace_name, sum(bytes_cached)/1024/1024 mbfrom v$temp_extent_poolgroup by tablespace_name;This will give current usage:SQL> select ss.tablespace_name,sum((ed_blocks*ts.blocksize))/1024/1024 mb from gv$sort_segment ss, sys.ts$ tswhere ss.tablespace_name = group by ss.tablespace_name;7.5 Tablespace Fragmentation~~~~~~~~~~~~~~~~~~~~~~~~~~~~~Heavly fragmented tablespaces can have an impact on the performance, especially when a lot of Full Table Scans are occurring on the system. Another disadvantage of fragmentation is that you can get out-of-space errors while the total sum of all free space is much more then you had requested.The only way to resolve fragmentation is drop and recreate the object. In most cases doing an export and import will solve the problem. If you need todefragment your system tablespace, you must rebuild the whole database sinceit is NOT possible to drop the system tablespace.References:Note 1020182.6 SCRIPT to detect tablespace fragmentationNote 1012431.6 Common causes of Fragmentation8. Objects----------8.1 Number of Extents~~~~~~~~~~~~~~~~~~~~~~While the performance hit on over extended objects is not significant, theaggregate effect on many over extended objects does impact performance. Thefollowing query will list all the objects that have allocated more extentsthan a specified minimum. Change the <--minext--> value by an actual number,in general objects allocating more then 100 a 200 extents can be recreatedwith larger extent sizes:SQL> select owner, segment_type, segment_name, tablespace_name,count(blocks), SUM(bytes/1024) "BYTES K", SUM(blocks)from dba_extentswhere owner NOT IN ('SYS','SYSTEM')group by owner, segment_type, segment_name, tablespace_namehaving count(*) > <--minext-->>order by segment_type, segment_name;8.2 Next extent~~~~~~~~~~~~~~~~It is important that segments can grow and therefore allocate their next extentwhen needed. If there is not enough free space in the tablespace then the nextextent can not be allocated and the object will fail to grow.The following query returns all the segments that are unable to allocate theirnext extent :SQL> select s.owner, s.segment_name, s.segment_type,s.tablespace_name, s.next_extentfrom dba_segments swhere s.next_extent > (select MAX(f.bytes)from dba_free_space fwhere f.tablespace_name = s.tablespace_name);Note that if there is a lot of fragmentation in the tablespace, then this querymay give you objects that still are able to grow. The above query is based onthe largest free chunk in the tablespace available. If there are a lot of'small' free chunks after each other, then Oracle will coalesce these to servethe extent allocation.Therefore it can be interesting to adapt the script in Note 1020182.6 'SCRIPTto detect tablespace fragmentation' to compare the next extent for each objectwith the 'contiguous' bytes (table space_temp) in the tablespace.8.3 Indexes~~~~~~~~~~~~An index needs to be maintained, every delete or insert on a table resultindirectly on a delete or insert on the underlying index. Over time an indexstructure can get fragmented and therefore the index should be rebuilt.9. AUTO vs MANUAL undo-----------------------Starting from Oracle 9i we introduced a new way of managing the before-images. Previously this was achieved through the RollBack Segments or also referred to as manual undo. Automatic undo is used when the UNDO_MANAGEMENT parameter is set to AUTO. When not set or set to MANUAL then we use the 'old' rollback segment mechanism. Although both versions are still available in current release, automatic undo is preferred.9.1 AUTO UNDO~~~~~~~~~~~~~~~There is little to no configuration involved to AUM (Automatic Undo Management). You basically define the amount of time the before image needs to be kept available.This is controlled through the parameter UNDO_RETENTION, defined in seconds. So a value of 900 indicates 15 minutes.It is important to realize that this value is not honored when we are under space pressure in the undo tablespace.Therefore the following formula can be used to calculate the optimal undo tablespace size:Note 262066.1: How To Size UNDO Tablespace For Automatic Undo ManagementStarting from Oracle 10g, you may choose to use the GUARANTEE option, to make sure the undo information does not get overwritten before the defined undo_retention time.Note 311615.1: Oracle 10G new feature - Automatic Undo Retention Tuning9.2 MANUAL UNDO~~~~~~~~~~~~~~~~~~o Damaged rollback segments will prevent the instance to open the database. Only if names of rollback segments are known, corrective action can be taken. Therefore specify all the rollback segments in the 'rollback_segments' parameter in theinit.orao Too small or not enough rollback segments can have serious impact on the behavior of your database. Therefore several issues must be taken into account. Thefollowing query will show you if there are not enough rollback segments onlineor if the rollback segments are too small.SQL> select d.segment_name, d.tablespace_name, s.waits, s.shrinks,s.wraps, s.statusfrom v$rollstat s, dba_rollback_segs dwhere n = d.segment_idorder by 1;SEGMENT_NAME TABLESPACE_NAME WAITS SHRINKS WRAPS STATUS---------------- ----------------------- --------- --------- --------- --------RB1 ROLLBACK_DATA 1 0 160 ONLINERB2 ROLLBACK_DATA 31 1 149 ONLINESYSTEM SYSTEM 0 0 0 ONLINEThe WAITS indicates which rollback segment headers had waits for them. Typically you would want to reduce such contention by adding rollback segments.If SHRINKS is non zero then the OPTIMAL parameter is set for that particularrollback segment, or a DBA explicitly issued a shrink on the rollback segment.The number of shrinks indicates the number of times a rollback segment shrinkedbecause a transaction has extended it beyond the OPTIMAL size. If this value is too high then the value of the OPTIMAL size should be increased as well as theoverall size of the rollback segment (the value of minextents can be increasedor the extent size itself, this depends mostly on the indications of the WRAPScolumn).The WRAPS column indicate the number of times the rollback segment wrapped toanother extent to serve the transaction. If this number is significant then you need to increase the extent size of the rollback segment.Reference:Note 62005.1 Creating, Optimizing, and Understanding Rollback Segments10. Memory Management---------------------This chapter is very version driven. Depending on which version you are running the option available will be different. Overtime Oracle has invested a great deal of time and effort in managing the memory more efficiently and transparently for the end-user.Therefore it is advisable to use the automation features as much as possible.10.1 Pre Oracle 9i~~~~~~~~~~~~~~~~~~~The different memory components (SGA & PGA) needed to be defined at the startup of thedatabase. These values were static. So if one of the memory components was too low thedatabase needed to be restarted to make the changes effective.How to determine the optimal or best value for the different memory components is not covered in this note, since this would lead us too far. However a parameter that was often misused in these versions is the sort_area_size.The 'sort_area_size' parameter in the init.ora defines the amount of memory that can beused for sorting. This value should be chosen carefully since this is part of the User Global Area (UGA) and therefore is allocated for each user individually.If there are a lot of concurrent users performing large sort operation on the databasethen the system can run out of memory.E.g.: You have a sort_area_size of 1Mb, with 200 concurrent users on the database. Although this memory is allocated dynamically, it can allocate up to 200Mband therefore can cause extensive swapping on the system.10.2 Oracle 9i~~~~~~~~~~~~~~~Starting from Oracle 9i we introduced the parametersworkarea_size_policy = [AUTO | MANUAL]pga_aggregate_target = <value>This allows you define 1 pool for the PGA memory, which will be shared across sessions. When you often receive ORA-4030 errors, then this can be an indication that this valueisspecified too low.10.3 Oracle 10g~~~~~~~~~~~~~~~~Automatic Shared Memory Management (ASMM) was introduced in 10g. The automatic shared memorymanagement feature is enabled by setting the SGA_TARGET parameter to a non-zero value.This feature has the advantage that you can share memory resources among the different components.Resources will be allocated and deallocated as needed by Oracle automatically.Automatic PGA Memory management is still available through the 'workarea_size_policy' and'pga_aggregate_target' parameters.10.4 Oracle 11g~~~~~~~~~~~~~~~~Automatic Memory Management (AMM) is being introduced in 11g. This enables automatic tuningof PGA and SGA with use of two new parameters named MEMORY_MAX_TARGET and MEMORY_TARGET.Reference:Note 443746.1: Automatic Memory Management(AMM) on 11g11. Logging & Tracing---------------------11.1 Alert File~~~~~~~~~~~~~~~~The alert log file of the database is written chronologically. Data is always appended and therefore this file can grow to an enormous size. It should becleared or truncated on a regular basis, as a large alert file occupiesunnecessary disk space and can slow down OS write performance to the file.SVRMGR> connect internal/<password>SVRMGR> show parameter background_dump_destNAME TYPE VALUE------------------------------ ------- ----------------------------------background_dump_dest string D:\Oradata\Admin\PROD\Trace\BDumpNote: starting from Oracle 11g, this location is controlled by the 'diagnostic_dest' parameter11.2 Max_dump_file_size~~~~~~~~~~~~~~~~~~~~~~~~Oracle Server processes generate trace files for certain errors or conflicts.These trace files are of use for further analyzing the probleThe init.oraparameter 'max_dump_file_size' limits the size of these trace files. The value of this parameter should be specified in Operating System blocks.Make sure the disk space can handle the maximum size specified, if not thenthis value should be changed.SVRMGR> connect internal/<password>SVRMGR> show parameter max_dump_file_sizeNAME TYPE VALUE----------------------------------- ------- ---------------------max_dump_file_size integer 1024011.3 User and core dump size parameters~~~~~~~~~~~~~~~~~~~~~~~~~~~~~~~~~~~~~~~~The parameters 'user_dump_size' and 'core_dump_size' can contain a lot of trace information.It is important to clear this directory at regular times as this can take up a significantamount of space.Note: starting from Oracle 11g, this location is controlled by the 'diagnostic_dest' parameter11.4 Audit files~~~~~~~~~~~~~~~~~By default, every connection as SYS or SYSDBA is logged in an operating system file. The location is controlled through the parameter 'audit_file_dest'. If this parameter isnot set then the location defaults to $ORACLE_HOME/rdbms/audit.Overtime this directory may contain a lot of auditing information and can take up a significant amount of space.11.5 Sqlnet~~~~~~~~~~~~By default sqlnet tracing is disabled while logging for sqlnet connections andthe listener is enabled. These log files are written chronologically and data is always appended. This causes some log files to grow to enormous sizes. Theselarge log files should be cleared or truncated on a regular basis.Activate tracing in case there is a problem that needs to be analyzed. Unnecessary tracing will slow down the system and occupy free disk space. Therefore youshould disable sqlnet and listener tracing when it is not required.To find the location of the logfiles or to activate tracing see:Note 219968.1: SQL*Net, Net8, Oracle Net Services - Tracing and Logging at a Glance <<E--End--。
oracle巡检 手册
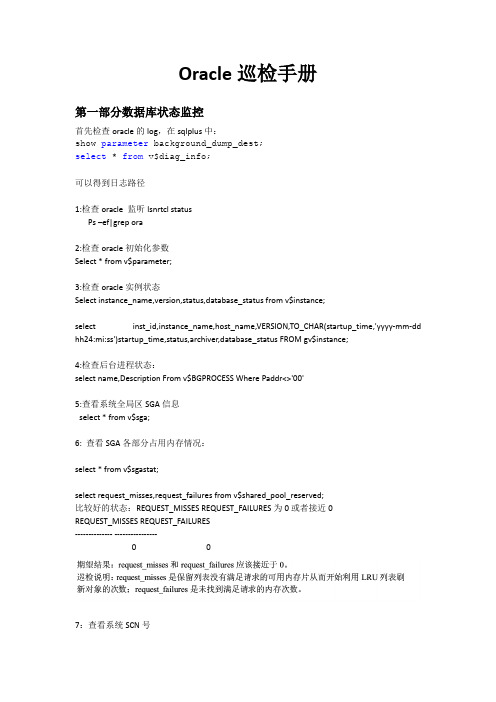
Oracle巡检手册第一部分数据库状态监控首先检查oracle的log,在sqlplus中:show parameter background_dump_dest;select * from v$diag_info;可以得到日志路径1:检查oracle 监听lsnrtcl statusPs –ef|grep ora2:检查oracle初始化参数Select * from v$parameter;3:检查oracle实例状态Select instance_name,version,status,database_status from v$instance;select inst_id,instance_name,host_name,VERSION,TO_CHAR(startup_time,'yyyy-mm-dd hh24:mi:ss')startup_time,status,archiver,database_status FROM gv$instance;4:检查后台进程状态:select name,Description From v$BGPROCESS Where Paddr<>'00'5:查看系统全局区SGA信息select * from v$sga;6: 查看SGA各部分占用内存情况:select * from v$sgastat;select request_misses,request_failures from v$shared_pool_reserved;比较好的状态:REQUEST_MISSES REQUEST_FAILURES为0或者接近0REQUEST_MISSES REQUEST_FAILURES-------------- ----------------007:查看系统SCN号select (select dbms_flashback.get_system_change_number from dual)scn,current_scn,scn_to_timestamp(current_scn)from v$database;8:检查数据库状态:select name,log_mode,open_mode,platform_name from v$database;select inst_id,dbid,name,to_char(created,'yyyy-mm-dd hh24:mi:ss')created,log_mode,to_char(version_time,'yyyy-mm-ddhh24:mi:ss')version_time,open_mode from gv$database;第二部分:数据库空间监控检查表空间使用率select A.tablespace_name, (1 - (A.total) / B.total) * 100 used_percentfrom (select tablespace_name, sum(bytes) totalfrom dba_free_spacegroup by tablespace_name) A,(select tablespace_name, sum(bytes) totalfrom dba_data_filesgroup by tablespace_name) Bwhere A.tablespace_name = B.tablespace_name;检查system表空间内的内容select distinct (owner)from dba_tableswhere tablespace_name = 'SYSTEM'and owner != 'SYS'and owner != 'SYSTEM'unionselect distinct (owner)from dba_indexeswhere tablespace_name = 'SYSTEM'and owner != 'SYS'and owner != 'SYSTEM';输出:no rows selected分析:如果有记录返回,则表明system表空间内存在一些非system和sys用户的对象。
Oracle数据库系统巡检报告

XXXXXXXX数据库系统巡检报告福华网络2017年2月15日目录1文档控制 (1)2巡检记录 (1)3巡检概述 (2)4巡检结果记录 (2)5检查项目分析与建议 (2)6数据库实例检查 (3)6.1获取实例基本信息 (3)6.1.1查看实例启动时间,运行状态 (3)6.1.2查看系统会话数 (3)6.2查看数据库文件状态 (3)6.2.1查看日志文件状态 (3)6.2.2查看表空间状态 (4)6.2.3查看表空间使用率 (5)6.2.4查看数据库文件状态 (6)6.3查看数据对象状态 (6)6.3.1查看异常用户对象 (6)6.3.2查看系统表空间的非系统对象 (7)6.3.3查找失效的索引 (7)6.3.4查找失效的约束 (7)6.3.5查找失效的触发器 (7)6.4使用AWR收集实例信息 (8)7RAC健康检查 (9)7.1RAC运行状态信息 (9)7.2ASM磁盘容量检查 (11)8DATAGUARD健康检查 (12)8.1主库确认没有日志缺口 (12)8.2确认主库可以进行角色切换,查询主库 (12)8.3查询备库是否可以切换为主库,查询备库: (12)1文档控制2巡检记录3巡检概述2017年2月14日,福华网络对XXXXXXX现运行的维保合同相关Oracle数据库系统进行了一次全面细致的巡检服务。
巡检围包括数据库服务器操作系统和Oracle RAC数据库。
目前,数据库服务器和数据库运行稳定。
4巡检结果记录合同相关的数据库系统巡检结果记录如下表所示:5检查项目分析与建议系统当前运行状态良好。
6数据库实例检查6.1获取实例基本信息6.1.1查看实例启动时间,运行状态启动时间为实例最近一次启动时间,该时间变化表明实例有重启动作,需要关注。
实例运行状态应为OPEN,数据库状态应为ACTIVE。
否则数据库运行状态异常。
SQL> select instance_name ,startup_time,status,database_status from gv$instance;INSTANCE_NAME STARTUP_T STATUS DATABASE_STATUS---------------- --------- ------------ -----------------xtbg1 30-JUL-16 OPEN ACTIVExtbg3 30-JUL-16 OPEN ACTIVExtbg2 30-JUL-16 OPEN ACTIVE6.1.2查看系统会话数系统会话数应和基线参数基本一致,过高和过低以为着系统存在异常。
Oracle数据库日常巡检指令

Oracle 数据库日常巡检指令Oracle数据库的日常巡检内容包括:Oracle数据库基本状况检查;Oracle相关资源的使用情况检查;Oracle数据库性能检查;数据库服务器cpu、mem和I/O 性能检查;数据库服务器安全性及其他事项检查等五大检查项目。
1、数据库基本状况检查(1)、数据库实例状况检查说明:其中“STATUS”表示Oracle当前的实例状态,必须为“OPEN”;“DATABASE_STATUS”表示Oracle当前数据库的状态,必须为“ACTIVE”。
(2)、数据库表空间状态检查说明:输出结果中STATUS应该都为“ONLINE”。
(3)、数据库数据文件检查1 select tablespace_name,status from dba_tablespaces;说明:输出结果中“STATUS”应该都为“AVAILABLE”。
(4)、数据库在线日志检查1 select group#,status,type,member from v$logfile;说明:输出结果应该有3条或3条以上记录,“STATUS”应该为非“INVALID”,非“DELETED”。
“STATUS”的值为空表示正常。
(5)、数据库回滚段检查1 select segment_name,status from dba_rollback_segs;说明:输出结果中所有回滚段的“STATUS”应该为“ONLINE”。
2、数据库相关资源使用情况检查(1)、检查Oracle初始化文件中相关参数值1 select resource_name,max_utilization,initial_allocation, limit_value from v$resource_limit;说明:若字段值【LIMIT_VALU】-【MAX_UTILIZATION】<=5,则表明与RESOURCE_NAME相关的Oracle初始化参数需要调整。
如何对Oracle数据库进行日常巡检
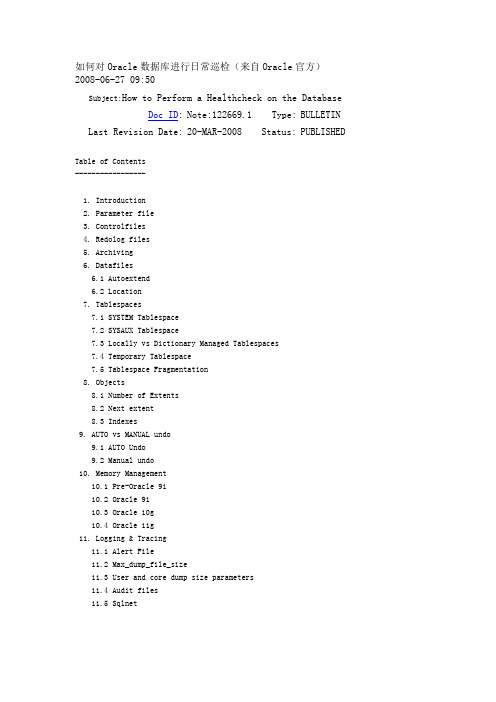
如何对Oracle数据库进行日常巡检(来自Oracle官方)2008-06-27 09:50Subject:How to Perform a Healthcheck on the DatabaseDoc ID: Note:122669.1 Type: BULLETIN Last Revision Date: 20-MAR-2008 Status: PUBLISHEDTable of Contents-----------------1. Introduction2. Parameter file3. Controlfiles4. Redolog files5. Archiving6. Datafiles6.1 Autoextend6.2 Location7. Tablespaces7.1 SYSTEM Tablespace7.2 SYSAUX Tablespace7.3 Locally vs Dictionary Managed Tablespaces7.4 Temporary Tablespace7.5 Tablespace Fragmentation8. Objects8.1 Number of Extents8.2 Next extent8.3 Indexes9. AUTO vs MANUAL undo9.1 AUTO Undo9.2 Manual undo10. Memory Management10.1 Pre-Oracle 9i10.2 Oracle 9i10.3 Oracle 10g10.4 Oracle 11g11. Logging & Tracing11.1 Alert File11.2 Max_dump_file_size11.3 User and core dump size parameters11.4 Audit files11.5 Sqlnet1. Introduction---------------This article explains how to perform a health check on the database. General guidelines are given on what areas to investigate to get a better overview onhow the database is working and evolving. These guidelines will reveal common issues regarding configuration as well as problems that may occur in the future.The areas investigated here are mostly based on scripts and are brought to you without any warranty, these scripts may need to be adapted for next datab ase releases and features. This article will probably need to be extended to serve specific application needs/checks.Although some performance areas are discussed in this article, it is not the intention of this article to give a full detailed explanation of optimizing the database performance.General scripts that help track information on the database:=)> Note 250262.1 Health Check / Validation Engine Guide=)> Note 136697.1“hcheck8i.sql” script to check for known problems in Oracle8i, Oracle9i, and Oracle10g2. Parameter file-----------------The parameter file can exists in 2 forms. First of all we have the text-based version, commonly referred to as init.ora or pfile, and a binary-based file, commonly referred to as spfile. The pfile can be adjusted using a standard Operating System editor, while the spfile needs to be managed through the instance itself.It is important to realize that the spfile takes presedence above the pfile, meaning whenever there is an spfile available this will be automatically taken unless specified otherwise.NOTE: Getting an RDA report after making changes to the database configuration is also a recommendation. Keeping historical RDA reports will ensure you havean overview of the database configuration as the database evolves.Reference:Note 249664.1: Pfile vs SPfile3. Controlfiles---------------It is highly recommended to have at least two copies of the controlfile. This canbe done by mirroring the controlfile, strongly recommended on different physical disks. If a controlfile is lost, due to a disk crash for example, then you canuse the mirrored file to startup the database. In this way fast and easy recovery from controlfile loss is obtained.connect as sysdbaSQL> select status, name from v$controlfile;STATUS NAME------- ---------------------------------/u01/oradata/L102/control01.ctl/u02/oradata/L102/control02.ctlThe location and the number of controlfiles can be controlled by the 'control_files' initialization parameter.4. Redolog files----------------The Oracle server maintains online redo log files to minimize loss of data in the database. Redo log files are used in a situation such as instance failure to recover commited data that has not yet been written to the data files. Mirroring theredo log files, strongly recommended on different physical disks, makes recovery more easy in case one of the redo log files is lost due to a disk crash, user delete, etc.connect as sysdbaSQL> select * from v$logfile;GROUP# STATUS TYPE MEMBER--------- ------- ------ -----------------------------------1 ONLINE /u01/oradata/L102/redo01_A.log1 ONLINE /u02/oradata/L102/redo01_B.log2 ONLINE /u01/oradata/L102/redo02_A.log2 ONLINE /u02/oradata/L102/redo02_B.log3 ONLINE /u01/oradata/L102/redo03_A.log3 ONLINE /u02/oradata/L102/redo03_B.logAt least two redo log groups are required, although it is advisable to have at least three redo log groups when archiving is enabled (see the following chapter). It is common, in environments where there are intensive log switches, to see the ARCHiverbackground process fall behind of the LGWR background process. In this case the LGWR process needs to wait for the ARCH process to complete archiving the redo log file.References :Note 102995.1 Maintenance of Online Redo Log Groups and Members5. Archiving------------Archiving provides the mechanism needed to backup the changes of the database.The archive files are essential in providing the necessary information to recover the database. It is advisable to run the database in archive log mode, although you may have reasons for not doing this, for example in case of a TEST environment where you accept to loose the changes made between the current time and the last backup.You may ignore this chapter when the database doesn't run in archive log mode.There are several ways of checking the archive configuration, below is one of them:connect as sysdbaSQL> archive log listDatabase log mode No Archive Mode --OR-- Archive ModeAutomatic archival Disabled --OR-- EnabledArchive destination <arch. dest.> --OR-- USE_DB_RECOVERY_FILE_DESTOldest online log sequence seq. noCurrent log sequence seq. noPre-10g, if the database is running in archive log mode but the automatic archiver process is disabled, then you were required to manually archive the redolog files. If this is not done in time then the database is frozen and any activity is prevented. Therefore you should enable automatic archiving when the database is running in archive log mode. This can be done by setting the 'log_archive_start' parameter to true in the parameter file.Starting from 10g, this parameter became obsolete and is no longer required to be set explicitly. It is important that there is enough free space on the dedicated disk(s) for the archive files, otherwise the ARCHiver process can't write and a crash is inevitable.References:Note 69739.1 How to Turn Archiving ON and OFFNote 122555.1 Determine how many disk space is needed for the archive files6. Datafiles------------6.1 Autoextend~~~~~~~~~~~~~~~The autoextend command option enables or disables the automatic extension ofdata files. If the given datafile is unable to allocate the space needed, itcan increase the size of the datafile to make space for objects to grow.A standard Oracle datafile can have, at most, 4194303 Oracle datablocks.So this also implies that the maximum size is dependant on the Oracle Block size used.DB_BLOCK_SIZE Max Mb value to use in any command~~~~~~~~~~~~~ ~~~~~~~~~~~~~~~~~~~~~~~~~~~~~~~~~~~2048 8191 M4096 16383 M8192 32767 M16384 65535 Mstarting from Oracle 10g, we have a new functionality called BIGFILE, whichallows for bigger files to be created. Please also consider that every Operating System has its limits, therefore you should make sure that the maximum size ofa datafile cannot be extended past the Operating System allowed limit.To determine if a datafile and thus, a tablespace, has AUTOEXTEND capabilities:SQL> select file_id, tablespace_name, bytes, maxbytes, maxblocks, increment_by, file_namefrom dba_data_fileswhere autoextensible = 'YES';Reference:Note 112011.1: ALERT: RESIZE or AUTOEXTEND can "Over-size" Datafiles and Corrupt the DictionaryNote 262472.1: 10g BIGFILE Type Tablespaces Versus SMALLFILE Type6.2 Location~~~~~~~~~~~~~Verify the location of your datafiles. Overtime a database will grow and datafiles may be added to the database. Avoid placing datafiles on a 'wherever there is sp ace' basis as this will complicate backup strategies and maintenance.Below is an example of bad usage:SQL> select * from v$dbfile;FILE# NAME--------- --------------------------------------------------1 D:\DATABASE\SYS1D806.DBF2 D:\DATABASE\D806\RBS1D806.DBF3 D:\DATABASE\D806\TMP1D806.DBF5 D:\DATABASE\D806\USR1D806.DBF6 D:\USR2D806.DBF7 F:\ORACLE\USR3D806.DBF7. Tablespaces--------------7.1 SYSTEM Tablespace~~~~~~~~~~~~~~~~~~~~~~User objects should not be created in the system tablespace. Doing so can lead to unnecessary fragmentation and preventing system tables of growing. The following queryreturns a list of objects that are created in the system tablespace but not owned by SYS or SYSTEM.SQL> select owner, segment_name, segment_typefrom dba_segmentswhere tablespace_name = 'SYSTEM'and owner not in ('SYS','SYSTEM');7.2 SYSAUX Tablespace (10g Release and above)~~~~~~~~~~~~~~~~~~~~~~The SYSAUX tablespace was automatically installed as an auxiliary tablespace to the SYSTEM tablespace when you created or upgraded the database. Some database components that formerly created and used separate tablespaces now occupy theSYSAUX tablespace.If the SYSAUX tablespace becomes unavailable, core database functionality will remain operational. The database features that use the SYSAUX tablespace could fail, or function with limited capability.The amount of data stored in this tablespace can be significant and may growover time to unmanageble sizes if not configured properly. There are a fewcomponents that need special attention.To check which components are occupying space:select space_usage_kbytes, occupant_name, occupant_descfrom v$sysaux_occupantsorder by 1 desc;Reference:Note 329984.1: Usage and Storage Management of SYSAUX tablespace occupants SM/AWR, SM/ADVISOR, SM/OPTSTAT and SM/OTHER7.3 Locally vs Dictionary Managed Tablespaces~~~~~~~~~~~~~~~~~~~~~~~~~~~~~~~~~~~~~~~~~~~~~~Locally Managed Tablespaces are available since Oracle 8i, however they becamethe default starting from Oracle 9i. Locally Managed Tablespaces, also referred to as LMT, have some advantage over Data Dictionary managed tablespaces.To verify which tablespace is Locally Managed or Dictionary Managed, you can run the following query:SQL> select tablespace_name, extent_managementfrom dba_tablespaces;Reference:Note 93771.1: Introduction to Locally-Managed TablespacesNote 105120.1: Advantages of Using Locally Managed vs Dictionary Managed Tablespaces7.4 Temporary Tablespace~~~~~~~~~~~~~~~~~~~~~~~~~o Locally Managed Tablespaces use tempfiles to serve the temporary tablespace, whereas Dictionary Managed Tablespaces use a tablespace of the type temporary. When you are running an older version (pre Oracle 9i), then it is impo rtant to check the type of tablespace used to store the temporary segments. By default, all tablespaces are created as PERMANENT, therefore you should make sure that the tablespace dedicated for temporary segments is of the type TEMPORARY.SQL> select tablespace_name, contentsfrom dba_tablespaces;TABLESPACE_NAME CONTENTS------------------------------ ---------SYSTEM PERMANENTUSER_DATA PERMANENTROLLBACK_DATA PERMANENTTEMPORARY_DATA TEMPORARYo Make sure that the users on the database are assigned a tablespace of thetype temporary. The following query lists all the users that h ave a permanent tablespace specified as their default temporary tablespace.SQL> select ername, t.tablespace_namefrom dba_users u, dba_tablespaces twhere u.temporary_tablespace = t.tablespace_nameand t.contents <> 'TEMPORARY';Note: User SYS and SYSTEM will show the SYSTEM tablespace as there defaulttemporary tablespace. This value can be altered as well to prevent fragmentation in the SYSTEM tablespace.SQL> alter user SYSTEM temporary tablespace TEMP;o The space allocated in the temporary tablespace is reused. This is done forperformance reasons to avoid the bottleneck of constant allocating and de-allocating of extents and segments. Therefore when looking at the free space in the temporary tablespace, this may appear as full all the time. The following are a few queries that can be used to list more meaningful information about the temporary segment usage:This will give the size of the temporary tablespace:SQL> select tablespace_name, sum(bytes)/1024/1024 mbfrom dba_temp_filesgroup by tablespace_name;This will give the "high water mark" of that temporary tablespace (= max used at one time):SQL> select tablespace_name, sum(bytes_cached)/1024/1024 mbfrom v$temp_extent_poolgroup by tablespace_name;This will give current usage:SQL> select ss.tablespace_name,sum((ed_blocks*ts.blocksize))/1024/1024 mbfrom gv$sort_segment ss, sys.ts$ tswhere ss.tablespace_name = group by ss.tablespace_name;7.5 Tablespace Fragmentation~~~~~~~~~~~~~~~~~~~~~~~~~~~~~Heavly fragmented tablespaces can have an impact on the performan ce, especially when a lot of Full Table Scans are occurring on the system. Another disadvantage of fragmentation is that you can get out-of-space errors while the total sum of all free space is much more then you had requested.The only way to resolve fragmentation is drop and recreate the object. In most cases doing an export and import will solve the problem. If you need todefragment your system tablespace, you must rebuild the whole database sinceit is NOT possible to drop the system tablespace.References:Note 1020182.6 SCRIPT to detect tablespace fragmentationNote 1012431.6 Common causes of Fragmentation8. Objects----------8.1 Number of Extents~~~~~~~~~~~~~~~~~~~~~~While the performance hit on over extended objects is not significant, theaggregate effect on many over extended objects does impact performance. Thefollowing query will list all the objects that have allocated more extentsthan a specified minimum. Change the <--minext--> value by an actual number,in general objects allocating more then 100 a 200 extents c an be recreatedwith larger extent sizes:SQL> select owner, segment_type, segment_name, tablespace_name,count(blocks), SUM(bytes/1024) "BYTES K", SUM(blocks)from dba_extentswhere owner NOT IN ('SYS','SYSTEM')group by owner, segment_type, segment_name, tablespace_namehaving count(*) > <--minext-->>order by segment_type, segment_name;8.2 Next extent~~~~~~~~~~~~~~~~It is important that segments can grow and therefore all ocate their next extent when needed. If there is not enough free space in the tablespace then the next extent can not be allocated and the object will fail to grow.The following query returns all the segments that are unable to allocate theirnext extent :SQL> select s.owner, s.segment_name, s.segment_type,s.tablespace_name, s.next_extentfrom dba_segments swhere s.next_extent > (select MAX(f.bytes)from dba_free_space fwhere f.tablespace_name = s.tablespace_name);Note that if there is a lot of fragmentation in the tablespace, then this query may give you objects that still are able to grow. The abov e query is based onthe largest free chunk in the tablespace available. If there are a lot of'small' free chunks after each other, then Oracle will coalesce these to servethe extent allocation.Therefore it can be interesting to adapt the script in Note 1020182.6 'SCRIPTto detect tablespace fragmentation' to compare the next extent for each objectwith the 'contiguous' bytes (table space_temp) in the tablespace.8.3 Indexes~~~~~~~~~~~~An index needs to be maintained, every delete or insert on a table resultindirectly on a delete or insert on the underlying index. Over time an indexstructure can get fragmented and therefore the index should be rebuilt.9. AUTO vs MANUAL undo-----------------------Starting from Oracle 9i we introduced a new way of managing the before-images. Previously this was achieved through the RollBack Segments or also referred to as manual undo. Automatic undo is used when the UNDO_MANAGEMENT parameter is set to AUTO. When not set or set to MANUAL then we use the 'old' rollback segment mechanism. Although both versions are still available in current release, automatic undo is preferred.9.1 AUTO UNDO~~~~~~~~~~~~~~~There is little to no configuration involved to AUM (Automatic Undo Management).You basically define the amount of time the before image needs to be kept available. This is controlled through the parameter UNDO_RETENTION, defined in seconds. So a value of 900 indicates 15 minutes.It is important to realize that this value is not honored when we are under space pressure in the undo tablespace.Therefore the following formula can be used to calculate the optimal undo tablespace size:Note 262066.1: How To Size UNDO Tablespace For Automatic Undo ManagementStarting from Oracle 10g, you may choose to use the GUARANTEE optio n, to make sure the undo information does not get overwritten before the defined undo_retention time.Note 311615.1: Oracle 10G new feature - Automatic Undo Retention Tuning9.2 MANUAL UNDO~~~~~~~~~~~~~~~~~~o Damaged rollback segments will prevent the instance to open the database. Only if names of rollback segments are known, corrective action can be taken. Therefore specify all the rollback segments in the 'rollback_segments' parameter in theinit.orao Too small or not enough rollback segments can have serious impact on the behavior of your database. Therefore several issues must be taken into account. Thefollowing query will show you if there are not enough rollback segments onlineor if the rollback segments are too small.SQL> select d.segment_name, d.tablespace_name, s.waits, s.shrinks,s.wraps, s.statusfrom v$rollstat s, dba_rollback_segs dwhere n = d.segment_idorder by 1;SEGMENT_NAME TABLESPACE_NAME WAITS SHRINKS WRAPS STATUS---------------- ----------------------- --------- --------- --------- --------RB1 ROLLBACK_DATA 1 0 160 ONLINERB2 ROLLBACK_DATA 31 1 149 ONLINESYSTEM SYSTEM 0 0 0 ONLINEThe WAITS indicates which rollback segment headers had waits for them. Typicallyyou would want to reduce such contention by adding rollback segments.If SHRINKS is non zero then the OPTIMAL parameter is set for that particularrollback segment, or a DBA explicitly issued a shrink on the rollback segment.The number of shrinks indicates the number of times a rollback segment shrinkedbecause a transaction has extended it beyond the OPTIMAL size. If this value is too high then the value of the OPTIMAL size should be increased as well as t heoverall size of the rollback segment (the value of minextents can be increasedor the extent size itself, this depends mostly on the indications of the WRAPScolumn).The WRAPS column indicate the number of times the rollback segment wrapped toanother extent to serve the transaction. If this number is significant then you need to increase the extent size of the rollback segment.Reference:Note 62005.1 Creating, Optimizing, and Understanding Rollback Segments10. Memory Management---------------------This chapter is very version driven. Depending on which version you are running the option available will be different. Overtime Oracle has in vested a great deal of time and effort in managing the memory more efficiently and transparently for the end-user.Therefore it is advisable to use the automation features as much as possible.10.1 Pre Oracle 9i~~~~~~~~~~~~~~~~~~~The different memory components (SGA & PGA) needed to be defined at the startup of thedatabase. These values were static. So if one of the memory components was too low thedatabase needed to be restarted to make the changes effective.How to determine the optimal or best value for the different memory components is not covered in this note, since this would lead us too far. However a parameter that was often misused in these versions is the sort_area_size.The 'sort_area_size' parameter in the init.ora defines the amount of memory that can beused for sorting. This value should be chosen carefully since this is part of the User Global Area (UGA) and therefore is allocated for each user individually.If there are a lot of concurrent users performing large sort operation on the database then the system can run out of memory.E.g.: You have a sort_area_size of 1Mb, with 200 concurrent users on the database. Although this memory is allocated dynamically, it can allocate up to 200Mb and therefore can cause extensive swapping on the system.10.2 Oracle 9i~~~~~~~~~~~~~~~Starting from Oracle 9i we introduced the parametersworkarea_size_policy = [AUTO | MANUAL]pga_aggregate_target = <value>This allows you define 1 pool for the PGA memory, which will be shared across sessions. When you often receive ORA-4030 errors, then this can be an indication that this value isspecified too low.10.3 Oracle 10g~~~~~~~~~~~~~~~~Automatic Shared Memory Management (ASMM) was introduced in 10g. The automatic shared memorymanagement feature is enabled by setting the SGA_TARGET parameter to a non-zero value.This feature has the advantage that you can share memory resources among the different components.Resources will be allocated and deallocated as needed by Oracle automatically.Automatic PGA Memory management is still available through the 'workarea_size_policy' and'pga_aggregate_target' parameters.10.4 Oracle 11g~~~~~~~~~~~~~~~~Automatic Memory Management (AMM) is being introduced in 11g. This enables automatic tuningof PGA and SGA with use of two new parameters named MEMORY_MAX_TARGET and MEMORY_TARGET.Note 443746.1: Automatic Memory Management(AMM) on 11g11. Logging & Tracing---------------------11.1 Alert File~~~~~~~~~~~~~~~~The alert log file of the database is written chronologically. Data is always appended and therefore this file can grow to an enormous size. It should becleared or truncated on a regular basis, as a large alert file occupiesunnecessary disk space and can slow down OS write performance to the file.SVRMGR> connect internal/<password>SVRMGR> show parameter background_dump_destNAME TYPE VALUE------------------------------ ------- ----------------------------------background_dump_dest string D:\Oradata\Admin\PROD\Trace\BDumpNote: starting from Oracle 11g, this location is controlled by the 'diagnostic_dest' parameter11.2 Max_dump_file_size~~~~~~~~~~~~~~~~~~~~~~~~Oracle Server processes generate trace files for certain errors or conflicts.These trace files are of use for further analyzing the probleThe init.oraparameter 'max_dump_file_size' limits the size of these trace files. The value of this parameter should be specified in Operating System blocks.Make sure the disk space can handle the maximum size specified, if not thenthis value should be changed.SVRMGR> connect internal/<password>SVRMGR> show parameter max_dump_file_sizeNAME TYPE VALUE----------------------------------- ------- ---------------------max_dump_file_size integer 1024011.3 User and core dump size parameters~~~~~~~~~~~~~~~~~~~~~~~~~~~~~~~~~~~~~~~~The parameters 'user_dump_size' and 'core_dump_size' can contain a lot of trace information.It is important to clear this directory at regular times as this can take up aamount of space.Note: starting from Oracle 11g, this location is controlled by the 'diagnostic_dest' parameter11.4 Audit files~~~~~~~~~~~~~~~~~By default, every connection as SYS or SYSDBA is logged in an operating system file. The location is controlled through the parameter 'audit_file_dest'. If this parameter isnot set then the location defaults to $ORACLE_HOME/rdbms/audit.Overtime this directory may contain a lot of auditing information and can take up a significant amount of space.11.5 Sqlnet~~~~~~~~~~~~By default sqlnet tracing is disabled while logging for sqlnet connections andthe listener is enabled. These log files are written chronologically and data is always appended. This causes some log files to grow to enormous sizes. Theselarge log files should be cleared or truncated on a regular basis.Activate tracing in case there is a problem that needs to be analyzed. Unnecessary tracing will slow down the system and occupy free disk space. Therefore youshould disable sqlnet and listener tracing when it is not required.To find the location of the logfiles or to activate tracing see:Note 219968.1: SQL*Net, Net8, Oracle Net Services - Tracing and Logging at a Glance <<E--End--。
Oracle数据库巡检命令手册
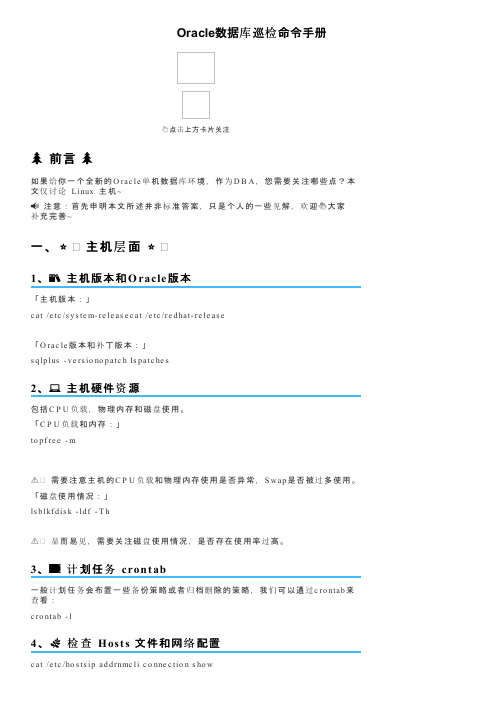
Oracle数据库巡检命令手册点击上方卡片关注前言如果给你一个全新的O ra c le单机数据库环境,作为D B A,您需要关注哪些点?本文仅讨论L inux主机~注意:首先申明本文所述并非标准答案,只是个人的一些见解,欢迎 大家补充完善~一、⭐ 主机层面⭐1、 主机版本和O racle版本「主机版本:」c a t /e tc/s y s te m-re le a s e c a t /e tc/red ha t-re le a s e「O ra c le版本和补丁版本:」s q lp lus-v e rs io no p a tc h ls p a tc he s2、 主机硬件资源包括C P U负载,物理内存和磁盘使用。
「C P U负载和内存:」to p f re e-m⚠ 需要注意主机的C P U负载和物理内存使用是否异常,S w a p是否被过多使用。
「磁盘使用情况:」ls b lkf d is k -ld f-T h⚠ 显而易见,需要关注磁盘使用情况,是否存在使用率过高。
3、 计划任务 cron t ab一般计划任务会布置一些备份策略或者归档删除的策略,我们可以通过c ro nta b来查看:c ro nta b-l4、 检查H ost s 文件和网络配置c a t /e tc/ho s ts ip ad d rnmc li c o nne c tio n s ho w5、 检查系统参数文件c a t /e tc/s y s c tl.c o nf⚠ 需注意是否有设置非常规参数。
6、 检查 rc.local 文件rc.lo c a l文件用于配置开机自启动脚本,一般会设置关闭透明大页或者O ra c le数据库开机自启。
c a t /e tc/rc.lo c a l7、 环境变量配置查看环境变量配置,进一步熟悉环境。
c a t ~/.b a s h_p ro f ile c a t /ho me/o ra c le/.b a s h_p ro f ile8、 检查系统服务s y s te mc tl s ta tus f ire w a lld.s e rv ic e g e te nf o rc e c a t /p ro c/c md line c a t /e tc/s y s c o nfig/ne tw o rk二、 数据库层面1、 查看数据库实例和监听p s-e f|g re p s mo ns u -o ra c le ls nrc tl s ta tus2、 数据库表空间使用s q lp lus/ a s s y s d b a c o l TA B L E S P A C E_N A M E f o r a20s e le c t tb s_us e d_inf o.ta ble s p a c e_na me,tb s_us e d_inf o.a llo c_mb,tb s_us e d_inf e d_mb,tb s_us e d_inf o.ma x_mb,tb s_us e d_inf o.f re e_o f_ma x_mb,tb s_us e d_inf e d_o f_ma x|| '%'us e d_o f_ma x_p c t f ro m (s e le c t a.ta b le s p a c e_na me,ro und(a.b y te s_a llo c/ 1024/ 1024) a llo c_mb,ro und((a.b y te s_a llo c-nv l(b.b y te s_f re e,0)) / 1024/ 1024) us e d_mb,ro und((a.b y te s_a llo c-nv l(b.b y te s_f re e,0)) *100/ a.ma x b y te s) us e d_o f_ma x,ro und((a.ma x b y te s-a.b y te s_a llo c+nv l(b.b y te s_f re e,0)) / 1048576) f re e_o f_ma x_mb,ro und(a.ma x b y te s/ 1048576) ma x_mb f ro m (s e le c t f.ta b le s p a c e_na me,s um(f.b y te s) b y te s_a llo c,s um(d e c o d e(f.a uto e x te ns ib le,'Y E S',f.ma x b y te s,'N O', f.b y te s)) ma x b y te sf ro m d b a_d a ta_f ile s fg ro up b y ta b le s p a c e_na me) a,(s e le c t f.ta b le s p a c e_na me,s um(f.b y te s) b y te s_f re e f ro m d b a_f re e_s p a c efg ro up b y ta b le s p a c e_na me) b w he re a.ta b le s p a c e_na me=b.ta b le s p a c e_na me(+)) tb s_us e d_inf o o rd e r b y tb s_us e d_inf e d_o f_ma x de s c;3、 检查RMA N备份情况rma n ta rg e t /lis t b a c kup;s q lp lus/ a s s y s d b a c o l s ta tus f o r a10c o l inp ut_ty p e f o r a20c o l I N P U T_B Y T E S_D I S P L AY f o r a10c o l O U T P U T_B Y T E S_D I S P L AYf o r a10c o l T I M E_TA K E N_D I S P L AY f o r a10s e le c t inp ut_ty p e,s ta tus,to_c ha r(s ta rt_time,'y y y y-mm-d d hh24:mi:s s'),to_c ha r(e nd_time,'y y y y-mm-d d hh24:mi:s s'),inp ut_b y te s_d is p la y,o utp ut_b y te s_d is p la y,time_ta ke n_d is p la y,C O M P R E S S I O N_R AT I Of ro m v$rma n_b a c kup_jo b_d e ta ils w he re s ta rt_time>d a te'2021-07-01'o rd e r b y3d e s c;4、 检查控制文件冗余查看控制文件数量和位置,是否处于多份冗余状态。
Oracle常用巡检脚本

column c3 heading 'Est|LC(M) '
column c4 heading 'Est LC|Mem. Obj.'
column c5 heading 'Est|Time|Saved|(sec)'
OR (pool = 'shared pool' AND
(name IN
('dictionary cache', 'enqueue', 'library
cache', 'parameters', 'processes', 'sessions', 'free memory')))
select name,
physical_reads,
(consistent_gets + db_block_gets) logic_reads,
1 - (physical_reads) / (consistent_gets + db_block_gets) hit_radio
shared_pool_size_factor c2,
estd_lc_size c3,
estd_lc_memory_objects c4,
estd_lc_time_saved c5,
estd_lc_time_saved_factor c6,
COUNT(KSMCHCLS) NUM,
SUM(KSMCHSIZ) SIZ,
To_char(((SUM(KSMCHSIZ) / COUNT(KSMCHCLS) / 1024)), '999,999.00') || 'k' "AVG SIzE"
oracle巡检脚本

where tablespace_name in (select tablespace_name
from dba_tablespaces
where extent_management != 'LOCAL')
WHERE a.owner = b.table_owner
AND a.table_name = b.table_name
AND a.tablespace_name = b.tablespace_name
AND a.tablespace_name not in ( 'SYSTEM', 'SYCRM1UX' );
( SELECT nvl( pool, name ) pool, SUM( bytes ) pool_bytes
FROM v$sgastat
GROUP BY nvl( pool, name ) )
ORDER BY 3 DESC;
prompt
prompt
prompt ################################################################
d.tot_grootte_mb "ts-bytes(m)",
d.tot_grootte_mb - f.total_bytes "ts-used (m)",
f.total_bytes "ts-free(m)",
to_char(round((d.tot_grootte_mb - f.total_bytes) / d.tot_grootte_mb * 100,2),'990.99') "ts-per"
oracle日常巡检内容

Oracle日常巡检内容1. 概述Oracle数据库是一款功能强大的关系型数据库管理系统,用于存储和管理大量的数据。
为了保证Oracle数据库的正常运行,必须进行日常巡检工作,及时发现并解决潜在的问题,确保数据库的稳定性和性能。
本文将介绍Oracle日常巡检的内容,包括数据库基本信息、存储空间、性能优化、安全性、备份与恢复等方面。
2. 数据库基本信息在进行日常巡检时,首先需要了解数据库的基本信息,以便更好地管理和维护数据库。
以下是需要关注的内容:•数据库名称、版本和补丁级别•数据库的物理和逻辑结构•数据库的字符集和语言设置•数据库的运行状态和连接数•数据库的启动参数和配置文件3. 存储空间数据库的存储空间是关键的资源,需要定期检查和管理。
以下是存储空间的巡检内容:•数据文件和表空间的大小和增长趋势•磁盘空间的使用情况和剩余容量•数据文件的布局和分布情况•表空间的使用率和碎片情况•确保数据文件和表空间的备份和恢复策略4. 性能优化数据库的性能是用户体验的重要因素,需要进行定期的性能优化工作。
以下是性能优化的巡检内容:•数据库的响应时间和吞吐量•SQL语句的执行计划和性能指标•索引的使用情况和效率•内存和缓冲区的配置和利用率•确保数据库的统计信息是最新的5. 安全性数据库的安全性是非常重要的,需要进行巡检和加固。
以下是安全性的巡检内容:•用户和角色的权限和访问控制•数据库的审计和日志记录设置•数据库的加密和身份验证策略•数据库的防火墙和网络安全设置•确保数据库的补丁和安全更新是最新的6. 备份与恢复数据库的备份和恢复是数据库管理的核心任务之一,需要定期进行巡检和测试。
以下是备份与恢复的巡检内容:•数据库备份的策略和计划•数据库备份的完整性和可用性•数据库恢复的速度和可靠性•确保备份文件的存储和保护措施•确保备份和恢复的文档和操作步骤是最新的7. 总结Oracle数据库的日常巡检是保证数据库稳定性和性能的重要工作。
Oracle11gRAC巡检手册
fs.freespace "FreeMB",
df.totalspace "Total MB",
round(100 * (fs.freespace / df.totalspace)) "Pct Free"
from
(select
tablespace_name,
round(sum(bytes)/1048576) TotalSpace
from
dba_data_files
group by
tablespace_name
) df,
(select
tablespace_name,
round(sum(bytes)/1048576) FreeSpace
Tnsping tnsname(数据库实例名)
Alert
配置情况
标准配置
/u01/app/oracle/diag/rdbms/<SID>/<INSTANCE>/trace/alert_sid.log
运行情况
正常
More alert_sid.log
CRS
服务运行情况
crsctl check crs
检查crs的健康情况
select ername||' '||t2.sid||' '||t2.serial#||' '||t2.logon_time||' '||t3.sql_text
from v$locked_object t1,v$session t2,v$sqltext t3
- 1、下载文档前请自行甄别文档内容的完整性,平台不提供额外的编辑、内容补充、找答案等附加服务。
- 2、"仅部分预览"的文档,不可在线预览部分如存在完整性等问题,可反馈申请退款(可完整预览的文档不适用该条件!)。
- 3、如文档侵犯您的权益,请联系客服反馈,我们会尽快为您处理(人工客服工作时间:9:00-18:30)。
USED PPs: 334 (171008 megabytes) MAX REQUEST: 1 megabyte
FREE DISTRIBUTION: 01..00..00..111..112
/dev/orainst 20971520 14943512 29% 28707 1% /orainst
1.20 查看文件大小
# du -s tmp
166552 tmp
2. 检查系统报错信息
2.1 显示简短报错信息
# errpt | more
USED DISTRIBUTION: 111..112..111..00..00
MIRROR POOL: None
# smitty fs
# smitty lvm
1.6 查看处理器数量:
# lscfg | grep proc
+ proc0 Processor
STALE PARTITIONS: 0 ALLOCATABLE: yes
PP SIZE: 512 megabyte(s) LOGICAL VOLUMES: 14
TOTAL PPs: 558 (285696 megabytes) VG DESCRIPTORS: 2
+ proc6 Processor
1.7 查看一个CPU的详细信息:
# lsattr -El proc0
frequency 4204000000 Processor Speed False
/proc - - - - - /proc
/dev% 10713 1% /opt
/dev/livedump 524288 523880 1% 4 1% /var/adm/ras/livedump
Path: /usr/lib/objrepos
bos.rte
6.1.4.0 COMMIT COMPLETE 07/10/10 19:07:31
Path: /etc/objrepos
bos.rte
6.1.4.0 COMMIT COMPLETE 07/10/10 19:07:31
1.15 显示操作系统版本:
# uname -v
6
1.16 显示运行系统的硬件的计算机ID编号:
# uname -m
00C7C5054C00
1.17 显示系统ID编号:
# uname -u
IBM,02067C505
1.18 显示AIX的主要版本、次要版本和维护级:
# oslevel -r
?
会出现所有邮件的列表,这时在“?”后面按数字表示要查看那一封邮件。按“h”表示查看邮件列表。
hdisk1 00c7c50592cdd77a rootvg active
hdisk2 00cb9934c0a92e73 datavg active
smt_enabled true Processor SMT enabled False
smt_threads 2 Processor SMT threads False
state enable Processor state False
AIX
1.12 显示节点名称:
# uname -n
DL-DB-02
1.13 显示uname的很多信息(系统名称、节点名称、版本、计算机ID):
# uname -a
AIX DL-DB-02 1 6 00C7C5054C00
1.14 显示系统型号:
# uname -M
IBM,8204-E8A
# bootinfo -K
64
1.2 显示硬件32位还是64位:
# bootinfo -y
64
1.3 显示以KB为单位的实际内存:
# bootinfo -r
32505856
1.4 显示系统上的硬盘数量
# lspv
hdisk0 00c7c505bc0669c5 rootvg active
/dev/fwdump 1048576 1046932 1% 13 1% /var/adm/ras/platform
/dev/hd1 5242880 5241708 1% 8 1% /home
/dev/hd11admin 524288 523848 1% 5 1% /admin
6100-04
# lslpp -h bos.rte
Fileset Level Action Status Date Time
----------------------------------------------------------------------------
errpt -a | head -150
4. 查看相关用户mail
# su - oracle
31 esaadmin Sun Jan 9 03:01 15/735 "Electronic Service Agent not"
/dev/oradmpbak 10485760 4488028 58% 28042 3% /orainstbak1
/dev/oraclebak 62914560 9605248 85% 33 1% /oradatabak1
/dev/oradata 367001600 321016968 13% 33 1% /oradata
Oracle小型机日常巡检
企业的业务数据库系统是IT运维的重中之重,为使数据库长期稳定的运行,需要相关人员对数据库进行每日巡检和记录,下面对数据库日常巡检工作做一个全面详细的计划:
一、小型机日常巡检:
1. 检查小型机硬件健康状态
1.1 显示内核启用的是32位还是64位
TIMESTAMP: MMDDHHMMYY (月日时分年)
T(类型): P 永久; T 临时; U 未知 (永久性的错误应引起重视)
C(分类): H 硬件; S 软件; O 用户; U未知
2.2 列出所有硬件出错信息:
# errpt -d H
2.3 列出所有软件出错信息:
# errpt -d S
type PowerPC_POWER6 Processor type False
#
1.8 查看系统硬件资源列表:
#lscfg
1.9 查看芯片类型:
# uname -p
powerpc
1.10 查看操作系统版本号:
oslevel
1.11 显示系统名称:
# uname -s
hdisk3 00c7c505ce5e6688 datavg active
1.5 查看硬盘hdisk1的详细信息:
# lspv hdisk1
PHYSICAL VOLUME: hdisk1 VOLUME GROUP: rootvg
.3 位代码,通常为0yyy,只看后3位。
.8 位和4位代码可查看系统服务手册 (Service Guide)。
3 位代码可查看系统诊断手册(Diagnostic Information for Multiple Bus System)。
.闪动的 888, 系统崩溃,硬件或软件原因造成。按reset 键会显示更多内容。
PV IDENTIFIER: 00c7c50592cdd77a VG IDENTIFIER 00c7c50500004c0000000129bc06773f
PV STATE: active
/dev/hd2 11534336 5382688 54% 52471 5% /usr
/dev/hd9var 5242880 4544720 14% 7487 1% /var
/dev/hd3 10485760 10397956 1% 4002 1% /tmp
#
1.19 查看磁盘使用情况(参数k表示以k为单位,m表示以M为单位):
# df -k
Filesystem 1024-blocks Free %Used Iused %Iused Mounted on
/dev/hd4 5242880 5039512 4% 14271 2% /
+ proc2 Processor
+ proc4 Processor
2.6 SMS (System Management Service) 故障记录
当主控台出现键盘图标后(LED 显示E1F1时)按1键。进入SMS 菜单
选择"Utilities"
选择"Error Log", 抄下8位故障代码
(在SMS 中还可以更改系统启动顺序表
3. 查看操作系统日志
888-102 一般为软件故障(888-102-207 例外)
系统会产生一个dump。
888-102-xxx-0C9 系统正在做dump, 请等待。
888-102-xxx-0C0 系统dump完成,可关电重启。
888-103 或 105
硬件故障,一般有 SRN 代码及位置代码。
2.4 查看具体某个ID的报错信息:
# errpt -aj D666A8C7 > aaa.txt
D666A8C7是简短报错信息中的ID号。
2.5 3.控制面板上的LED 代码
.一般为8 位代码,通常系统故障灯会同时亮起。某些机型还会同时显示故障设备位置代码。
.4 位代码,通常是Exxx。