2009-wear-Slurry and cavitation erosion resistance of thermal spray coatings!
A Vision for Carbon Fiber in the Automotive Market,2009
The composites industry is markedly lagging the metals industry in terms of fast fabrication technology, e.g., there is no composite processing alternative, to date, to high-speed metal stamping. A consortium of industries needs to come Easy repair technology and bonding solutions are just starting to be introtogether and attack the problem from all duced for structural composites. One angles, which include improvements in dispensing technologies, curing chem- problem with permanent bonding technology is disassembly, which is not a istries and the energy sources that drive concern for metals. Using conventional cure. The most talked-about effort within metal fastening technology for composthe automotive composites sector is that of a Japanese consortium lead by Nissan, ites usually leads to disasters, due to crack initiation and propagation from the which has reduced cycle time from 160 high stress concentration regions. But to 10 minutes for resin transfer molding (RTM] simple flat panels with carbon fi- clever assembly designs that circumvent ber/epoxy. The fact that this is newswor- such situations are few and far between. Engineering knowledge for designing thy clearly indicates that the challenge is parts with composites, although growformidable; Composites musí increase manuing, is still limited. While universities are facturing speed f}y almost an order of magnitude teaching courses on this topic, the emlo become competitive. phasis is still on metals. When students In the realm of reinforcements, comface real-world situations, they soon realposites will require carbon fiber if they ize that there would have to be a huge change in how cars are put together before they could take full advantage Current carbon fiber of composites. One-to-one replacetechnology is hostage to ment of a metal part is often the best way to prove the deficiency of a comexcessive cost. posite solution. Conversely, the biggest advantage is realized only by comare to replace metals in high-perfor- bining various functionalities in one part. mance applications- Carbon fiber perIn my opinion, multifunctional carbon formance and cost are important parts composites could become commonplace of the equation when considering com- in mainstream automobiles by 2030 if posites for an automotive application. several factors fall into place: the price of Aerospace-grade carbon fibers of 600 to carbon fiber comes down; designers be1,000 ksi tensile strength and 40 msi to come more comfortable designing cars 60 msi modulus are in the range of Si 5/ with monocoque and/or highly integrated, Ib to $50/lb ( USD). While standard-grade multifunctional structures; and fabricacarbon fibers of 550 to 650 ksi tensile tors reach a part cycle time on the order strength and 32 to 37 msi modulus are two to four minutes. Is it possible? Peravai lable at S7 to S14/lb, the need is great haps. But it will be a long process that will for higher performance at lower cost. require several breakthroughs, including Current carbon fiber technology is hos- a willingness on the part of automotive OEMs to invest in the technology. • tage to the excessive cost of either the precursor or the conversion technology.
米兰设计周

MILAN DESIGN WEEK 2009
My Bauhaus Is Better Than Yours 45 Kilo's "Hallo Lamp" sits on a beautiful conical concrete base and has simple yet exciting details like a wire handle on the lamp head and a leather loop height adjustment.
MILAN DESIGN WEEK 2009
Fiam At the fairgrounds Fiam displayed a series of glass furniture, and table ornaments.
MILAN DESIGN WEEK 2009
MILAN DESIGN WEEK 2009
Campeggi At the Campeggi both, everything was not only what it seemed, but transformed into much more. Check out the Tent Sofa Video Drive-by for an example
MILAN DESIGN WEEK 2009
Hale Waihona Puke ecal Alejandro Bona's playful 813m woven blue rope furniture was one of many woven pieces this year in Milan but stood out because of its intense color and excellent craftsmanship. I almost thought the lamp was going to walk away as I approached it as if I had stumbled across some unknown alien creature.
可食用涂膜材料对白芦笋品质的影响
Impact of edible coatings and packaging on quality of white asparagus (Asparagus officinalis ,L.)during cold storageMaria V.Tzoumaki a ,Costas G.Biliaderis a,*,Miltiadis Vasilakakis ba Laboratory of Food Chemistry and Biochemistry,Department of Food Science and Technology,School of Agriculture,Aristotle University,GR-54124Thessaloniki,Greece bLaboratory of Pomology,Department of Horticulture,School of Agriculture,Aristotle University,GR-54124Thessaloniki,Greecea r t i c l e i n f o Article history:Received 18December 2008Received in revised form 14February 2009Accepted 19March 2009Keywords:White asparagus spears quality Edible coatings TextureAnthocyanins Lignificationa b s t r a c tThe effects of edible coatings and plastic packaging on quality aspects of refrigerated white asparagus spears were studied using two different experimental protocols.The first included four coating formula-tions based on carboxymethyl-cellulose and sucrose fatty acid esters,whey protein isolate alone and in combination with stearic acid,and pullulan and sucrose fatty acid esters,and an uncoated sample serving as a control.The second set consisted of four treatments;uncoated asparagus spears (control),coated with a carboxymethyl-cellulose formulation,packaged in plastic packaging and combination of coated and packaged asparagus spears.All products were stored at 4°C and the quality parameters such as weight loss,texture,visual appearance,lignin and anthocyanins concentration,and colour were evalu-ated during their storage.Edible coatings exhibited a beneficial impact on the quality of asparagus by retarding moisture loss,reducing hardening in their basal part and slowing down the purple colour devel-opment.The plastic packaging had a remarkable influence in reducing weight loss and retarding harden-ing but its impact to the rest of the quality parameters was similar to that of the edible coatings.The combination of packaging and edible coating did not seem to offer any additional advantage on asparagus spears apart from the fact that the product had a brighter appearance at the middle part of the stem com-pared to the packaged spears alone.Ó2009Elsevier Ltd.All rights reserved.1.IntroductionAsparagus (Asparagus officinalis ,L.)has very short shelf life due to its high respiration rate,which continues after harvesting.White asparagus undergoes a sequence of considerable physiological and biochemical changes which quickly influence its chemical compo-sition and lead to quality loss,mainly due to an increase of hard-ness,water loss and the synthesis of anthocyanins (Chang,1987).Therefore,ensuring an extended shelf-life by adequate post-har-vest conservation appears to be very challenging for commerciali-zation of this highly valued vegetable (Villanueva,Tenorio,Sagardoy,Redondo,&Saco,2005).Postharvest treatments to in-crease storage and shelf life included storage in modified atmo-sphere packaging (MAP)(Siomos,Sfakiotakis,&Dogras,2000)and prestorage hot water treatments (Siomos,Gerasopoulos,&Tsouvaltzis,2005).The role of packaging on vegetable conservation,distribution and marketing is also quite popular and is frequently used in com-bination with other conservation methods,an approach called hur-dle technology (Hoover,1997).However,the final disposal of the packaging materials leads to ecological problems and additionalrecycling costs (Viña et al.,2007).On the other hand,the applica-tion of edible coatings appears to be one of the most innovative ap-proaches to extend the commercial shelf life of fruits and vegetables by,among other mechanisms,acting as a barrier against gas transport and showing similar effects to storage under con-trolled atmospheres (Park,1999).Indeed,over the last two decades the development and use of bio-based packaging materials to pro-long the shelf-life and improve the quality of fresh products has been receiving increased attention.The reasons for such an interest are mainly related to environmental issues due to disposal of con-ventional synthetic food-packaging materials.However,in order such edible films and coatings to be used at a commercial level in food products they must fulfill some basic requirements:accept-able sensorial characteristics,appropriate barrier properties,good mechanical strength,reasonable microbial,biochemical and phys-icochemical stability,safety,low cost and simple technology for their production (Diab,Biliaderis,Gerasopoulos,&Sfakiotakis,2001).The effectiveness of edible coatings for protection of fruits and vegetables also depends on controlling the wettability of the coating solutions,which affects the coating thickness (Park,1999).Thus,edible coating formulations must wet and spread uni-formly on the vegetable’s surface and,after drying,a coating that has adequate adhesion,cohesion and durability to function prop-erly must be formed (Ribeiro,Vicente,Teixeira,&Miranda,2007).0308-8146/$-see front matter Ó2009Elsevier Ltd.All rights reserved.doi:10.1016/j.foodchem.2009.03.076*Corresponding author.Tel./fax:+302310991797.E-mail address:biliader@agro.auth.gr (C.G.Biliaderis).Food Chemistry 117(2009)55–63Contents lists available at ScienceDirectFood Chemistryj o u r n a l h o m e p a g e :/locate/foodchemEdiblefilms and coatings are generally based on biological materials such as proteins,lipids and polysaccharides.The main polysaccharides that can be included in edible coating formula-tions are starch and starch derivatives,cellulose derivatives,chito-san,pectin,alginate and other gums.Carboxymethyl-cellulose is a cellulose derivative that has received considerable attention with several examples of applications in many fruits and vegetables.A commercial edible coating formulation based on carboxymethyl-cellulose and sucrose fatty acid esters,named Semperfresh TM,has been applied to pears(Zhou et al.,2008),cherries(Yaman&Bayo-indirli,2002)and many other fruits.Pullulan,an extracellular poly-saccharide produced by Aureobasidium pullullans,also is capable of forming ediblefilms but has not been largely exploited as a coating material in fruits and vegetables,presumably because of its high water solubility.One example of pullulan used as a coating hydro-colloid was for strawberries and kiwifruit(Diab et al.,2001).Pro-teins that can also be used in formulations of edible coatings for fruits and vegetables include those derived from animal sources, such as casein and whey proteins,or obtained from plant sources, like corn zein,wheat gluten and soy protein(Vargas,Pastor,Chir-alt,McClements,&Gonzalez-Martinez,2008).Whey protein based coatings have been extensively used to extend the shelf life of fruits and vegetables(Cisneros-Zevallos&Krochta,2003;Ler-dthanangkul&Krochta,1996).To the best of our knowledge there are no available data regard-ing the effect of edible coatings on postharvest quality aspects of white asparagus spears.Therefore,the aims of the present work were to evaluate the effect of different edible coating formulations on quality parameters of white asparagus spears during refriger-ated storage,to compare the impact of one of these edible coatings with that of a plastic packaging on the extension of asparagus post-harvest life,and to explore if there is any additional beneficial ef-fect of a combined treatment using edible coating and packaging with the syntheticfilm.2.Materials and methods2.1.Plant materialWhite asparagus(Asparagus officinalis,L.)spears were harvested from commercial farms in the regions of Imathia and Pella,Greece. The spears were hydrocooled and transported to the laboratory within3h after harvest,under refrigerated conditions.Straight, undamaged samples,around18–22mm in diameter,with closed bracts were carefully selected and cut at18cm from the tip.2.2.Coating solutions preparation and applicationSodium carboxymethyl-cellulose(CMC2500F Tic Gums,USA), whey protein isolate(WPI)(Bi-ProÒ,Davisco Foods International, USA)and pullulan(Hyashibara Biochem Laboratory Inc.,Okayama, Japan)were used as biopolymer matrices in the coating formula-tions.Other substances used were sucrose fatty acid ester F-50 with an HLB value of six(Dai Ichi Kogyo Seyaku Co.,Ltd.,Tokyo,Ja-pan),polyethylenoglycol PEG400(Merck,Darmstadt,Germany), sorbitol and stearic acid(Sigma–Aldrich GmbH,Steinheim,Ger-many).Ethyl alcohol was reagent grade and water used in all experiments was distilled.The carboxymethyl-cellulose based coating(CMC)was pre-pared byfirstly dissolving the CMC(0.2%w/w)in a water–ethanol mixture(4:1v/v)under magnetic stirring at60°C and then adding the plasticizer PEG(0.1%w/w)and the sucrose fatty acid ester F-50 (0.8%w/w),followed by stirring for1h.Two different coatings using the whey protein isolate were prepared;WPI1and WPI2, which included4%w/w WPI and1%w/w sorbitol as a plasticizer, both dissolved in distilled water.The solutions were denatured for30min in a90°C water bath under continuous shaking and then were rapidly cooled in an ice bath,in order to stop further protein denaturation,andfinally equilibrated to room tempera-ture.WPI2also included1%w/w stearic acid as a lipid constituent, which was incorporated to the coating solution just after the dena-turation step by homogenization at19,000rpm for4min using an UltraTurrax T25homogenizer(IKA Labortechnik,Staufen,Ger-many).The pullulan based coating solution(P)was obtained by dissolving pullulan(5%w/w)in distilled water under magnetic stirring at60°C with subsequent addition of sorbitol(1%w/w) and a sucrose fatty acid ester F-50(1%w/w),followed by stirring for1h.All the coating solutions were left overnight at4°C in order to eliminate air bubbles.The composition of the coatings used in this work was selected among a large number of other coatings examined in preliminary trials.Coating was carried out at room temperature by dipping the asparagus spears for30s in the formulated suspensions and then slow drying at ambient conditions,by turning them from time to time,for about2h.After the coating treatment the samples were placed in plastic trays and subjected to cold storage.2.3.Coating characterizationThe surface tension of each suspension was measured by the Ring Method using a Kruss tensiometer at20°C.Rheological char-acterization of the coating formulations was conducted by a rota-tional Physica MCR300rheometer(Physica Massterchnic GmbH, Stuttgart,Germany)using a double gap cylindrical geometry;tem-perature was regulated by a Paar Physica circulating bath and a controlled peltier system(TEZ150P/MCR)with an accuracy of ±1°C.The data of the rheological measurements were analyzed with the supporting software US200V2.21.Flow curves were per-formed by measuring steady shear viscosity(g)over a range of shear rates between0.1and1200sÀ1at25°C.The contact angles at the asparagus surface were measured following the Choi and Han procedure(Choi&Han,2002),using a digital microscope(Intel QX3,Mattel Inc.,El Segundo,CA).All the liquid drops used for the measurements were axecimetric.The estimation of the critical surface tension(c C)of the white asparagus surface was obtained by extrapolation from the Zisman plot(Zisman,1964),which was developed using water(HPLC grade),glycerol,ethylene glycol and dimethyl sulfoxide(DMSO) (Sigma–Aldrich GmbH,Steiheim,Germany),as reference liquids. Their surface tensions are72.8,63.4,48.0and44.0mN/m2,respec-tively.To avoid changes on the asparagus surface,the measure-ments took place in less than30s.Ten replicates of contact angle measurements were obtained at20(±1)°C.2.4.Sample treatmentsTwo different experimental sets were adopted.Thefirst(set A) included application of four different coatings,CMC,WPI1,WPI2 and P on white asparagus spears and uncoated spears served as control(C).The samples were placed in a cold room at4°C and 95%RH for11days and the quality parameters were evaluated on days6and11after harvest.In the second experimental set (set B),four different treatments were employed:(a)uncoated samples(control–C),(b)CMC coated spears,(c)packaged aspara-gus in plastic trays wrapped with a16l m stretchfilm(Fabri Arti Grafiche S.R.L.-Vignola,Modena,Italy).The syntheticfilm had O2 and CO2transmission rates of583and1750ml mÀ2hÀ1atmÀ1, respectively,and a moisture vapor transmission rate of 14.6g mÀ2hÀ1atmÀ1at39°C and90%RH(film permeabilities were measured by the manufacturer)(Pack).The fourth treatment (d)involved a combination of CMC coating and the above packag-ing(Pack+CMC),in order to investigate if there is any additional56M.V.Tzoumaki et al./Food Chemistry117(2009)55–63effect when combining edible coating and synthetic film packag-ing.All trays were placed in cold storage at 4°C and 95%RH for 17days.The determination of asparagus quality was held at the day of harvest (day 0)and at days 11and 17.Each sample,contain-ing five lots (6–7spears/lot),was included for each experimental set,storage condition and sampling time.2.5.Weight lossWeight loss was measured periodically by weighting five trays containing 6–7spears,for each treatment.The results were ex-pressed as the percentage loss of initial weight.2.6.Texture determinationThe asparagus spears,18cm in length,were marked at 6-cm intervals from the tip and then sectioned at the ink markings into three cylindrical portions;apical,middle and basal,since it is known that there is evidence for significant differences in texture over the different parts of white asparagus (Rodríguez et al.,2004).The texture was measured at the middle of each of the three sections of each spear by applying the cutting test using a Texture Analyzer (NF -{N 2i,Stable Microsystems).Values were expressed as maximum force (kg),using a Warner–Blatzler cell with a blade (0.3cm width)that cut the spears at a speed of 5mm/s (average of 20replicates).2.7.Visual evaluation of appearanceThe general appearance of the products was assessed by at least 10trained panelists.Samples were evaluated using the following hedonic scale:1=bad,2=fairly good,3=good,4=very good and 5=excellent.A value of three was considered as the commercial acceptability threshold.2.8.Colour measurementsColour readings of the spears were performed with a chroma-tometer (Minolta CR-400/410,Minolta,Osaka,Japan),equipped with an 8-mm measuring head.The meter was calibrated using the manufacturer’s standard white plate.Colour changes were quantified in the L *,a *,b *colour space.Chroma value ðChroma ¼ffiffiffiffiffiffiffiffiffiffiffiffiffiffiffiffiffiffiffia Ã2þb Ã2q Þwas also calculated in order to compare changes among treatments.On each spear two readings in two different areas were taken;the first at 2cm from the tip,in order to study if there is a violet colour development,and the second at 10cm,so as to explore if there is any ‘greying’appearance on the spear surface.The colour was also assessed visually by a 10-member trained panel using the following hedonic scale:5=total white,4=violet colour development at 2cm from the tip,3=violet colour at 3cm,2=violet colour at 4cm,1=violet colour at 5cm and 0=vio-let colour development over longer distance.2.9.Lignin determinationThe lignin content of the different parts of the asparagus spears (apical,middle,and basal)was determined with the thioacidoglyc-olysis method,as described by Bruce and West (1989).About 150g of tissue was homogenised with 95%ethanol for 5min.The mix-ture was vacuum filtered,the residue was washed with 100ml of ethanol and then dried at 50°C for 24h.About 0.25g of the above dry residue was mixed with 7.5ml of 2N HCl and 0.5ml of thiogly-colic acid which was then boiled with occasional shaking for 4h and centrifuged at 7500g for 15min.The residue (lignin thioglyco-late)was washed with 10ml of water,suspended again in 10ml of 0.5N NaOH with occasional shaking for 18h at room temperature and centrifuged;2ml of concentrated HCl was added to the super-natant liquid.The lignin thioglycolic acid complex was precipitated at 4°C for 4h,centrifuged (7500g ,15min)and the residue was dis-solved in 10ml of 0.5N NaOH.After the appropriate dilutions,the absorbance was read at 280nm,using a Metertech UV/vis SP8001(Taipei,Taiwan)spectrophotometer.Quantification was carried out using a standard lignin curve.The lignin standard was pur-chased from Sigma–Aldrich GmbH (Steinheim,Germany).2.10.Anthocyanin determinationThe anthocyanin content was determined on the peel of aspar-agus,which was obtained by a sharp razor from 1cm from the tip until 6cm from the tip;this region is where most of the colour development occurs.The method of Fuleki and Francis (1968)was employed for the determination of anthocyanins with a few changes which were proposed by Flores,Oosterhaven,Martínez-Madrid,and Romojaro (2005).The plant tissue was chopped in a mortar,and 2g were extracted with 5ml of extractant solution;the latter was 100%ethanol/0.5N HCl (85:15v/v),and was kept in agitation with the tissue for 1min.The resulting homogenate was incubated for 4h in darkness.Every step was carried out in an ice bath in order to keep the temperature at 4°C.The homoge-nate was then centrifuged at 7500g for 15min and the supernatant was used to perform the spectrophotometric measurement at 533nm,using the extraction medium as blank.The extinction coefficient of anthocyanins,984(g/100ml)À1cm À1,was used for calculation of the anthocyanin content in the peel of white aspar-agus (Fuleki &Francis,1968).The results were expressed as mg anthocyanins per g FW of peel.2.11.Statistical analysisAll results are means ±s.e.,and the data were statistically eval-uated by ANOVA with mean differentiation by the Duncan’s multi-ple range test (a =0.05).The statistical software used was the SPSS,version 15.0.3.Results and discussion 3.1.Coating characterizationFor coating solutions,Cisneros-Zevallos and Krochta (2003)have found that the average liquid film thickness on coated apples is a function of viscosity,draining time,density of the biopolymer solutions,surface tension of the fruit,surface tension of the liquid,and the surface roughness.Since the film thickness can greatly af-fect the gas and water barrier properties of the coatings,it was con-sidered important to study the asparagus surface properties and the surface tension and rheological properties of the coating solutions.The critical surface tension of the white asparagus peel,derived from the Zisman plot,was 26.7mN/m.This indicates that the asparagus peel is a solid surface with low surface energy.Several authors have reported the values of critical surface tension ob-tained from a Zisman plot for various fruits and vegetables like gar-lic peel with a value of 18.3mN/m (Hershko &Nussinovitch,1998),strawberry with a value of 18.8mN/m (Ribeiro et al.,2007),and to-mato and carrot with values of 17.4and 24.1mN/m,respectively (Casariego et al.,2008).The peel or surface of many fruits and veg-etables has low surface tension for protection purposes;however,this natural advantage is a shortcoming for application of aqueous coatings on plant tissues (Viña et al.,2007).M.V.Tzoumaki et al./Food Chemistry 117(2009)55–6357The surface tension of a coating suspension is an essential factor for determining coating success.Table1shows the surface tensions of the four different coatings applied on white asparagus spears.The coatings CMC and P had a surface tension of37.0and 38.3mN/m,respectively.These values were significantly lower than those of coatings based on whey protein isolate;the WPI1 and WPI2had values of50.0and49.0mN/m,respectively,typical for protein solutions.Thefirst two coatings,CMC and P,had a low surface tension due to the sucrose fatty acid ester which was in-cluded in their formulation as a surface active ingredient.Another reason for the low surface tension of the CMC coating may be the fact that the diluent was a water–ethanol mixture4:1.These re-sults show that the CMC and P coatings were more prone to spreading on white asparagus peel since their surface tension val-ues were closer to the critical surface tension of the asparagus peel obtained from the Zisman’s plot,compared to the respective values of WPI1and WPI2.Theflow properties of afilm forming liquid greatly affect its coating quality in the solid state.Moreover,the smoothness of the surface to be coated has a strong influence on the coating appearance.Levelling of the coating surface takes place after appli-cation of the liquid and during drying,due to solvent evaporation and is a crucial part of the coating process.The levelling of irregu-larities in liquid coating depends on the rheological properties and surface tension of the liquid,the effects of gravity and the charac-teristics of the surface to coat.A positive characteristic of coatings in the liquid state is the presence of a yield stress or a viscosity(g0) high enough to prevent gravity effects(sagging and dripping),but sufficiently small to allow capillarity-driven levelling(Peressini,Bravin,Lapasin,Rizzotti,&Sensidoni,2003).In Table1,the apparent viscosities at100sÀ1of the four differ-ent coatings applied on white asparagus are given.The CMC coat-ing exhibited a pseudoplastic behavior(flow curves not shown)as the viscosity decreased with the increase of shear rate and it showed the highest apparent viscosity at100sÀ1(52.9mPa s), compared to the rest of the coating solutions.The pullulan-based (P)coating showed Newtonian behavior with an apparent viscosity of19.6mPa s.The whey protein isolate coating solutions,WPI1 and WPI2,also showed Newtonian-like behavior and their appar-ent viscosities were lower than the others,with values of2.8and 3.5mPa s,respectively.The addition of stearic acid in the whey protein solution did not seem to alter the apparent viscosity to a great extent.In a previous study,starch-based coatings exhibited a pseudoplastic behavior and the most viscous formulation(med-ium amylose content starch-based with20g lÀ1of glycerol) showed an apparent viscosity of22.6mPa s at512sÀ1(Garcìa, Martino,&Zaritzky,1998).3.2.Weight lossThis quality parameter is quite crucial,since every loss in weight is translated into an economic loss.Additionally,the weight loss has a strong impact on the spear appearance,due to shrinkage, and an8%weight loss makes asparagus spears unsaleable(Siomos, 2003).Fig.1shows the weight loss of the asparagus spears for both experimental sets A and B.The weight loss increased progressively upon storage,and is mainly attributed to the water loss by transpi-ration due to differences in the water vapour pressure of water be-tween the atmosphere and the asparagus surface(Park,Chinnan,& Shewfelt,1994).After11days of storage(set A),the weight losses of the control and the coated samples were7.3%and$5.0%,respec-tively.The edible coatings applied on white asparagus spears sig-nificantly reduced the weight loss,probably due to the hydrophobic ingredients they contained,such as the sucrose fatty acid ester,and stearic acid,which may had decreased the water va-pour permeability of the surface.However,the WPI1coating, without including any of these substances,also acted as a water vapour barrier,presumably due to denaturation of its protein com-ponents.Among all the coatings employed,there were no major differences,in spite of the variation in the solids content,biopoly-mer type and other substances used.Several studies had dealt with the effect of various coatings based on polysaccharides in controlling the weight loss of several fruits and vegetables.Many of them referred to the application of commercial formulations that contained carboxymethyl cellulose and sucrose fatty acid esters,e.g.,Semperfresh TM and TAL Pro-long, exerting a better weight loss control of many products such as cherries(Yaman&Bayoindirli,2002).Pullulan coatings applied on strawberries and kiwifruit also exhibited a positive impact by extending their shelf life(Diab et al.,2001).Furthermore,the prop-erties of protein basedfilms have been extensively studied in applications of fruits and vegetables.More specifically,whey pro-tein ediblefilms attracted much of attention as it was found thatTable1Characterization of the coating formulations.Coating formulation Surface tension(mN/m)Apparent viscosityat100sÀ1,g ap(mPa s)CMC37.1±1.052.9 WPI150.0±1.0 2.8 WPI249.2±1.0 3.5 P38.3±0.619.658M.V.Tzoumaki et al./Food Chemistry117(2009)55–63they can afford moderate potential as moisture barriers for food systems.The reduction in water vapour permeability of WPI based films could be further enhanced through the addition of lipids (McHugh&Krochta,1994).Placing the asparagus spears in plastic packaging significantly reduced their weight loss,as shown in Fig.1for set B,whereas the combination of coating with packaging offered no additional protection to weight loss,compared to the packaging alone.The prevention of weight loss due to the mainte-nance of a high relative humidity environment is a major advan-tage of vegetable packaging;the beneficial effect of this approach in asparagus spears,as evidenced by the presentfindings is in agreement with thefindings of Siomos et al.(2000).In another work,the effects of starch-based coatings and combination treat-ments of plasticfilm packaging with the coatings on weight loss of Brussels sprouts were studied(Viña et al.,2007);the coatings did not seem to reduce the weight loss during storage,whereas the plastic packaging substantially reduced the weight loss below the maximum admissible level in coated or uncoated sprouts.3.3.Visual evaluation of appearanceAfter six days of refrigerated storage(set A)the appearance of the coated samples was rated as‘‘excellent”or‘‘very good”,in con-trast to the uncoated control C which fell into the‘‘good”category. The uncoated asparagus spears exhibited a more dehydrated sur-face than the coated spears.The differences among the four differ-ent coating treatments were significant,with the WPI1and P giving the highest rating values in the appearance,probably be-cause of the glossiness that these coating formulations imparted to the surface of the plant tissue.Samples coated with WPI2had the lowest score,possibly due to the incorporation of stearic acid which can lead to an undesirable opaque appearance after drying. After11days of storage the uncoated samples showed a strongly dehydrated surface,especially at the basal part of the spears,thus leading to quality ratings well below the acceptability threshold. Instead,all the asparagus spears treated with the CMC,WPI1, WPI2and P coatings maintained their quality above the accep-tance threshold level(see Fig.2).With respect to experimental set B,after11days of refrigerated storage,the uncoated product exhibited significantly lower quality levels compared to the other treatments and far below the accep-tance level.In contrast,the treatments with CMC,Pack and the combination Pack+CMC did not differ significantly in their quality ratings.At day17,the asparagus spears that were not packaged showed significantly lower quality ratings,compared to the treat-ments of Pack and Pack+CMC which were ranked under the‘‘very good”category.No differences were observed among the last two treatments(Pack,Pack+CMC),probably because the packaging in a plastic container has a stronger impact on quality preservation than the edible coating alone.3.4.TextureThe texture of asparagus has been related tofibrousness and the process of hardening that occurs after harvesting;the latter is accompanied by the lignification of the pericyclic(schlerenchyma)fibres(Rodríguez et al.,2004).Additionally,changes in texture may also reflect losses of tissue water and increases in other phenolic compounds apart from lignin.Several methods have been devel-oped to determine textural changes along with thefibre content and the degree of lignification.Currently,textural measurements involve shearing through the asparagus spears by using the War-ner–Blatzler geometry(Rodríguez et al.,2004).Fig.3represents the texture of the three distinct asparagus parts for the different treatments of set B samples,measured as maxi-mum cutting force F max.Regarding the apical part of asparagus spears all the samples(C,CMC,Pack and Pack+CMC)exhibited sig-nificantly increasedfirmness values during storage,compared to the day of harvest(day0).On the other hand,thefirmness values in the middle part of samples Pack and Pack+CMC were main-tained to similar levels with the fresh asparagus(day0),while the uncoated(C)and the coated with CMC spears showed signifi-cantly increased values compared to the day of harvest(day0).Sim-ilarly,the basal parts of the packaged samples(Pack and Pack+CMC)retained their texture values during storage at levels similar to the fresh asparagus.The basal part of CMC coated aspar-agus seemed to maintain its texture to initialfirmness levels after 11days of storage,but after17days thefirmness value significantly increased.The CMC coating used is expected to modify the internal gas composition of white asparagus,especially by reducing oxygen and elevating carbon dioxide concentration,thus retarding the bio-chemical reactions that lead to hardening;the latter might explain the slower textural changes observed for the basal part of the coated spears.Additionally,the packaging helped maintain the tex-ture of asparagus spears.In a previous work it was found that the use of Modified Atmosphere Packaging in green asparagus exhib-ited a beneficial effect in retarding the hardening process,especially of the basal part of the stalks(Villanueva et al.,2005).Finally,the uncoated spears exhibited significantly higherfirmness value in the basal part during storage compared to the day of harvest.3.5.Lignin contentLignin is the cell wall component frequently associated with tissue hardening.The lignification in asparagus is controlled by Set BC CMC Pack Pack+CMCbaa acbaaSet A611Time (days)C CMC WPI1WPI2dbc aaaabbcaM.V.Tzoumaki et al./Food Chemistry117(2009)55–6359。
土木专业英语词汇统计

civil engineering 土木工程slopes and fills 边坡和路堤settlement 沉降stability 稳定性hydraulic 水利的,液压的runoff 流量,流泻,流放behavior 性能,性质hazardous 危险的major 专业科目remedy 补救,修理roadway 路面,道路asphalt 沥青concrete 混凝土combustible 易燃的slurry 浆,泥浆,翻浆冒泥execution 施工,实施,执行specific 特殊的,专门的,具体的dynamic 动力的,冲击的static 静力的characteristic 特有的;特性,性能intensity 强度,密度sump 排水坑,集水坑carbon fiber 碳纤维excavation 挖掘,开挖landscape 风景,美化fill 填土ancillary 辅助的,附属的foundation 基础excavator 挖掘机,开凿者proceed 继续进行,开始interlock 使联结,使组合construction 建造,施工surveyor 测量员dewater 排水placement and curing 浇筑与养护cast 浇筑superstructure 上部结构duration 持续时间destroy 破坏,毁坏initially 最初,开始specialize 专门研究,使专业化geodetic 大地测量学topographical 地形学的powerhouse 动力室,发电厂skyscraper 摩天楼initiate 产生slag inclusion 夹渣gas pocket 气孔under cutting 咬边fatigue 疲劳black bolt 粗制螺栓high-strength fraction grip bolt 摩擦型高强度螺栓forge 打制,锻造thread 螺纹shank 螺杆asymmetrical 非对称的symmetrical 对称的neutral axis 中和轴bracing 支撑purlin 檩条shear wall structure 剪力墙结构long-time 长期的,持久的civilization文明urbanization 都市化architectural 建筑的spiral 螺旋的habitation 住所,居住rigidity 刚度,刚性multifunctional 多功能的,多用途的integrity 完整性,完善ductility 塑性,韧性uniformity 均匀性weldability 可焊性fire resistance 耐火性corrosion resistance 耐腐蚀性plateau 平台stress-strain curve 应力应变曲线yield strength 屈服强度sulphur 硫silicon 硅manganese 锰phosphorus 磷proportional 成比例的,比例上的ultimate 最后的,最终的strain harden 应变硬化specimen 试样delimitation 界限,分界periodically 定期地,周期地Poisson ratio 泊松比modulus 模量coefficient 系数distortion 扭曲,变形cement 水泥bituminous 沥青eco-materials 生态材料calcareous 石灰质的,钙质的argillaceous 黏土质的,黏土的calcined 焙烧的,煅烧的clinker 水泥熟料,熟料gypsum 石膏pulverize 粉碎set 凝固,安置,调节,硬化Portland cement 波特兰水泥,硅酸盐水泥rapid hardening cement 快硬性水泥formwork 模板工程,模板Portland pozzolana cement 火山灰质硅酸盐水泥air-entraining cement 引气水泥fineness 细度,纯度prestressed concrete 预应力混凝土mould 塑造,模具,模型shell structure 壳体结构paneling 嵌板,格子,镶板falsework 脚手架,临时支撑glued-laminated 胶合叠层metallic luster 金属光泽load bearing capacity 承载能力modulus of elasticity 弹性模量yield stress 屈服应力elongation 伸长率,伸长度waterproof 防水,抗水,防水的,耐水的,不透水的emulsion 乳液,乳化剂,乳胶capillary 毛细,毛细管polymer 聚合物,高分子,高分子聚合物crack 开裂,裂纹,裂缝pour 浇注,倾倒pump 抽吸,泵送spray 喷涂reinforcing steel=reinforcing bar 钢筋longitudinal 长度的,纵向的,轴向的shear force 剪力multistory building 多层建筑rate of contraction 收缩率rate of expansion 膨胀率embed 放入,埋入,埋置,嵌入reinforced concrete 钢筋混凝土adhesion 附着力,黏合力bond 结合力,黏合力,黏结,握裹hot-rolled reinforcing bar 热轧钢筋rib-shaped surface 肋形表面alkaline 碱性的,碱性corrosion 腐蚀,侵蚀,锈spalling 剥落,层裂galvanized 镀锌的epoxy-coated 环氧涂层的rigid 刚性的frame 框架anchorage 锚固,锚具curtain wall 幕墙bearing wall 承重墙durability 耐久性deterioration 恶化,损坏,退化chloride 氯化物,漂白剂sulphate 硫酸盐alkali 碱absorption 吸收性,吸收permeability 渗透性,渗透率homogeneous 同类的,均质的,均相的disruptive 破坏性的thaw 解冻,融化reservoir 水库,蓄水池compatible 相容的,能共处的workability 和易性,可用性deicing 去冰,除冰leaching 浸析,浸出carbonation 碳化cement paste 水泥浆cavitation 气蚀,气穴,凹穴abrasive 磨蚀的,磨平的attrition 磨损,磨耗erosion 腐蚀,侵蚀fly ash 粉煤灰silica fume 硅粉mineral admixture 矿物掺合料calcium hydroxide 氢氧化钙porosity 孔隙率,多孔性segregation 离析,分离deformable 可变形的axially 轴向地torsion 扭转,扭力shell 壳体distortion 扭转,扭曲,翘曲,变形formula 公式,方程式,方案strain 应变deflection 挠度,挠曲,偏离,偏差角failure 失效,失败,破裂,故障criterion 准则,判据,标准criteria (复数)准则,判据,标准factor of safety 安全系数fracture 破裂,破碎,折断,断裂collapse 坍塌,破坏,倒塌,陷落,倒闭static 静的,静力的,静电的code 规范,标准linear elastic range 线弹性范围allowable stress 允许应力mild steel 低碳钢ultimate stress 极限应力margin 边缘部分,栏外,页面的空白intensity强度,密度carbon fiber 碳纤维novel 新的,异常的bracing 支撑immense 无限的,广大的placement and curing 浇筑和养护shrinkage收缩,缩减dimension 大小,尺寸,维数,量纲equilibrium condition 平衡条件boom 悬臂,吊杆dragline 拉牵,导索,拉铲挖土机impair 损害,损伤,断裂diagram 图表,图解,立体图cross-sectional横截面的linear 线性的,线的negligible 可不计的,可忽视的gray cast iron 灰口铸铁curvature 弧度,曲率,弯曲Y oung’s modulus 杨氏模量proportional 成比例的plastic deformation 塑性变形slip 滑动,滑移creep 徐变,蠕变ductile 延性的,可延展的,可塑的,柔软的neck down 颈缩concentric 同心(轴)的(with),集中的eccentric 离心的,偏心的midspan 跨中pre-tensioned method 先张法post-tensioned method 后张法grout 灰浆mortar 砂浆,灰浆,水泥浆,用灰浆涂抹net tensile stress 纯拉应力pretension 张拉indeterminancy 不确定性eccentricity 偏心,偏心距,离心率flexural member 受弯构件segmental 分节的,分段的versatility 多方面适用性,多用性,多功能性principle 原理capacity 承载力yield stress 屈服应力ultimate strength 极限强度plastic design 塑性设计margin 安全系数,边界fraction 零头,小部分,系数nominal 标定的,名义上的Allowable Stress Design 容许应力设计法Load and Resistance Factor Design 荷载与抗力系数设计法client 顾客,委托人,业主joint 接合,连接处systematically 系统地inertia 惯性,惯量sincere 实在的,真诚的preliminary 初步的,预备的specification 说明书,规范code 章程,法规elasticity 弹性plastic hinge 塑性铰connection 连接,联系coefficient of thermal expansion热膨胀系数shell structure 壳结构structural engineering 结构工程geotechnical engineering 岩土工程transportation engineering 交通运输工程fluid mechanics 流体力学position 定位expand 膨胀contract 收缩installation 安装criteria 准则,尺度,标准tension 拉力,张力compression 压力,压缩bending moment 弯矩shear 剪力torsion扭转; 扭力; 扭曲excessive 过量的,大量的sway 摇摆,摇动lateral 横向的longitudinal 纵向的vertical 竖向的horizontal 水平的external force 外力internal force 内力blast 爆破proceed继续进行, 开始, 着手process 过程procedure 程序,规程,手续probability 概率instruction 指示,指令expansion膨胀, 扩展, 扩充defect 缺陷brittle fracture 脆性破坏ductile fracture 延性破坏distortion 变形,扭曲,曲解stiffness 刚性attribute 性能,属性,特性slender细长的, 苗条的, 微薄的, 少量的uncertainty 不确定性simplify 简化assumption 假定,设想timber木材, 木料aggregate 骨料,集料temporary structure 临时结构permanent structure永久结构fatigue 疲劳impact 冲击wear磨损, 穿戴abrasion擦伤, 磨损, 磨损处crack 破裂,裂开impermeability不渗透性permeability渗透; 可透性; 渗透性; 导磁性compact 压紧,紧密的restraint 约束expansion 膨胀contraction 收缩absorption 吸收性assembly集合, 装配, 集会, 集结manipulate操纵, 操作, 利用fatigue failure 疲劳破坏allowable stress 允许应力undergo 承受,经历particle 粒子,散体,颗粒deflection 挠曲,挠度rupture破裂, 裂开, 断裂resultant load 合力eliminate除去, 剔除, 排除,消除utilize 利用,发展impose 施加,强加,利用anchor 锚固anchorage 锚固,锚具component 构件,杆件validity合法性, 有效性, 正确性rib-shaped surface肋形表面interlock相互咬合alkaline碱性的corrosion腐蚀erosion 腐蚀etching腐蚀,蚀刻load bearing capacity承载能力earthquake 地震factor 因素,系数panic 恐慌,惊慌vibratory 振动的,震荡的tsunami 海啸,地震海浪sizable 相当大的,广大的slippage 滑移,滑动propagation 传递,传导,传播partitioning wall 隔墙cladding wall 填充墙rectangular coordinate 直角坐标beam 梁column 柱deflect 挠曲,下垂statically indeterminate structure 超静定结构static determinacy 静定appreciation 评价,鉴赏the law of equilibrium 平衡原理suspension bridge 悬索桥geometry 几何形状,几何学buckling 弯曲,屈曲,翘曲bracing 撑杆,支撑drastically 彻底地,激烈地resultant 合成的,总的mixer 搅拌机,搅拌器cobble 鹅卵石,中砾,圆石coarse aggregate 粗集料,粗骨料homogeneous 同种的,同类的,均一的,均匀的unduly 不适当地,过度地agitator 搅拌器,搅拌机chute 斜槽,滑槽insert 插入,插入物systematically 系统地,有组织地,有条理地segregation 隔离,分离,离析stratification 层化,成层,分层preliminary 初步的,预备的,在前的optimum 最优的,最适宜的glisten 闪亮,闪耀,闪光cement paste 水泥浆bleeding 泛油,泛浆laitance 水泥翻沫,浮浆皮,浮浆joint 接合,粘接处,铰接,接缝,接头construction joint 施工缝curing compound 养护剂membrane 膜,隔膜,表层discoloration 变(脱,褪)色,漂白,污点shutdown period 停工期hoist 绞车hoisting 起重,提升excavating 挖掘,挖取hauling 搬运,运输grading 等级,分阶段,坡度缓和paving 铺面,铺砌drilling 演练,钻孔configuration 结构,布局,形态sound attenuation 消音,消声,声衰减tractor 拖拉机heavy-duty tractor 重型拖拉机endless 无止境的,没完没了的track 小路,跑道,轨道,惯例,常规bulldozer 推土机debris 碎片,残骸boulder 大圆石scraper 铲运机grader 平地机finishing equipment 精整设备backhoe 反向铲scoop 铲子,舀取front-end 前端dragline 拉索shovel 铲bucket 水桶derrick 动臂起重机cableway 空中索道conveyor 输送机monorail 单轨铁路sheaves 滑轮pulley 滑车winch 卷扬机blocks 吊链,滑轮组grooved 开槽的eye 吊环trolley 缆车jib crane 回转起重机,臂架起重机overhead-traveling crane 桥式起重机gantry crane 龙门起重机scaffolding脚手架framework 结构,构架,框架gin wheel 起重滑轮sheeting 薄片(薄膜,挡板,护墙板)guard rail 护栏seasoned 经验丰富的norm 标准,规范jack 插座,千斤顶,抬起stage 台架,脚手架anchorage 下锚,停泊所,停泊税transom 横档,横楣,横梁tubular 管状的unit 7。
Agricultural Water Management
Application of the Soil and Water Assessment Tool (SWAT)to predict the impact of alternative management practices on water quality and quantityAntje Ullrich *,Martin VolkHelmholtz Centre for Environmental Research –UFZ,Department of Computational Landscape Ecology,Permoserstr.15,D-04318Leipzig,Germany1.IntroductionDue to insufficient water quality of European streams environmental programs such as the European Water Framework Directive (WFD)were implemented to achieve good ecological and chemical conditions of water quality of groundwater and surface water bodies (EC,2000;Rekolainen et al.,2003).Main nutrient input comes from nonpoint source pollution,mainly forced by intensive agricultural activities (Behrendt et al.,1999).Therefore,alternative land management practices are increasingly used to reduce nonpoint source pollution.Reduction of soil tillage intensity positively affects numerous soil properties,such as aggregate stability,macroporosity,and saturated hydraulic con-ductivity and consequently increases infiltration rates and reduces surface runoff,nutrient loss,and soil erosion (Jones et al.,1969;Pitka¨nen and Nuutinen,1998;Schmidt et al.,2001;Kirsch et al.,2002;Pandey et al.,2005;Tripathi et al.,2005).Alternative land management practices may include reduced tillage such asconservation tillage (e.g.without deep ploughing,field preparation just before planting)or no-tillage (direct drilling)(Sullivan,2003;LfULG,2006).In Germany the implementation of alternative tillage systems is increasingly supported by agro-environmental pro-grams.In the German State of Saxony,for instance,conservation tillage and mulch seeding on arable land has increased from <1%to about 27%during 1994–2004with support from the Saxonian Program for Environmental Agriculture (LfL,2006).A number of field studies have illustrated the positive effects of conservation tillage and no-tillage practices on water and material fluxes at the field local level (e.g.Sloot et al.,1994;King et al.,1996;Schmidt et al.,2001),but this effect needs to be assessed on the watershed level to guide river basin management programs as WFD claimed (Kirsch et al.,2002;Chaplot et al.,2004;Pandey et al.,2005;Behera and Panda,2006;Bracmort et al.,2006).Therefore,watershed models are useful tools and have been used for decades to evaluate nonpoint source pollution and the short-and long-term impacts of alternative management practices.In order to fulfill the objectives of the WFD,we have chosen the semi-distributed river basin model,Soil and Water Assessment Tool (SWAT)2005(Neitsch et al.,2002;Arnold and Fohrer,2005)to examine the impact of alternative management practices on waterAgricultural Water Management 96(2009)1207–1217A R T I C L E I N F O Article history:Received 3September 2008Accepted 6March 2009Keywords:SWATTillage management practice Conservation tillage Water balance Nutrient ModellingA B S T R A C TAlternative land management practices such as conservation or no-tillage,contour farming,terraces,and buffer strips are increasingly used to reduce nonpoint source and water pollution resulting from agricultural activities.Models are useful tools to investigate effects of such management practice alternatives on the watershed level.However,there is a lack of knowledge about the sensitivity of such models to parameters used to represent these conservation practices.Knowledge about the sensitivity to these parameters would help models better simulate the effects of land management.Hence,this paper presents in the first step a sensitivity analysis for conservation management parameters (specifically tillage depth,mechanical soil mixing efficiency,biological soil mixing efficiency,curve number,Manning’s roughness coefficient for overland flow,USLE support practice factor,and filter strip width)in the Soil and Water Assessment Tool (SWAT).With this analysis we aimed to improve model parameterisation and calibration efficiency.In contrast to less sensitive parameters such as tillage depth and mixing efficiency we parameterised sensitive parameters such as curve number values in detail.In the second step the analysis consisted of varying management practices (conventional tillage,conservation tillage,and no-tillage)for different crops (spring barley,winter barley,and sugar beet)and varying operation dates.Results showed that the model is very sensitive to applied crop rotations and in some cases even to small variations of management practices.But the different settings do not have the same sensitivity.Duration of vegetation period and soil cover over time was most sensitive followed by soil cover characteristics of applied crops.ß2009Elsevier B.V.All rights reserved.*Corresponding author.Tel.:+493454722602;fax:+493412351939.E-mail address:antje.ullrich@ (A.Ullrich).Contents lists available at ScienceDirectAgricultural Water Managementj o u r n a l h o m e p a g e :w w w.e l s e v i e r.c o m /l o c a t e /a g w a t0378-3774/$–see front matter ß2009Elsevier B.V.All rights reserved.doi:10.1016/j.agwat.2009.03.010quantity and quality.Gassman et al.(2007)point out that‘‘a key strength of SWAT is aflexible framework that allows the simulation of a wide variety of conservation practices and other BMP,such as fertiliser and manure application rate and timing, cover crops(perennial grasses),filter strips,conservation tillage, irrigation management,flood prevention structures,grassed waterways,and wetlands.The majority of conservation practices can be simulated in SWAT with straightforward parameter changes’’.Many studies have used SWAT(Saleh et al.,2000; Shanti et al.,2001;Vache et al.,2002;Shanti et al.,2003;Chaplot et al.,2004;Pandey et al.,2005;Tripathi et al.,2005;Arabi et al., 2006;Behera and Panda,2006;Rode et al.,2008;Volk et al.,2009) and EPIC(Sloot et al.,1994;King et al.,1996)to evaluate the effects of land use scenarios and management practices.Several studies have analysed the long-term effects of structural Best Management Practices(BMP)on water quality(e.g.Kirsch et al.,2002;Chaplot et al.,2004;Tripathi et al.,2005;Pandey et al.,2005or Behera and Panda,2006;Bracmort et al.,2006).Arabi et al.(2007)investigated the impact of modelling uncertainty on evaluation of management practices using a Monte Carlo-based probabilistic approach.The SWAT model was developed for application to large complex watersheds over long periods of time(Neitsch et al., 2002).Working on the watershed-scale means that required input data are often aggregated in terms of temporal scale(e.g.daily climate data).In contrast,land management parameters(tillage, fertilisation,crop rotation,etc.)can be included in high resolution and detail,due to its modular structure and its historical development based on the EPIC(Erosion Productivity Impact Calculator)model(Benson et al.,1988;Neitsch et al.,2002;Arnold and Fohrer,2005;Gassman et al.,2007).Furthermore,modelling evaluations of conservation management effects at the watershed-scale are limited by the lack of management operation data.Thus, knowledge is needed of the sensitivity of such models to conservation management parameters and practice to improve the efficiency of model parameterisation and the quality of model calibration.Furthermore,potential simulation uncertainties based on ranges of realistic parameter values and on influences of scale need to be understood because simulated effects often drive financial and political decisions(Onatski and Williams,2003).As a result,the main objective of this study is to analyse the sensitivity of the SWAT model to selected conservation manage-ment parameters and practices to improve model parameterisa-tion and calibration.To the best of our knowledge,a sensitivity analysis of the model to conservation management parameters and practices has not yet been conducted.But in our opinion this is essential for a more efficient use of models for the implementation of land management practices as tools to improve water quantity and quality.We used a so-called semi-virtual watershed for which we combined topography and climate information of an existing watershed(Parthe watershed,Saxony,Germany)but with homo-geneous land use and soil information.Homogeneous land use and soil information were utilised because the resulting data sets are concise and manageable and calculation time is reduced. Recommendations are given for the parameterisation of tillage operations under certain conditions.2.Materials and methods2.1.Model descriptionThe SWAT model is considered as one of the most suitable models for predicting long-term impacts of land management measures on water,sediment,and agricultural chemical yield (nutrient loss)in large complex watersheds with varying soils,land use,and management conditions(Arnold and Fohrer,2005;Behera and Panda,2006;Gassman et al.,2007).The model has been gained international acceptance as a robust interdisciplinary watershed modelling tool(Gassman et al.,2007).SWAT is a physically based, conceptual,continuous-time river basin model with spatial distributed parameters operating on a daily time step.It is not designed to simulate detailed,single-eventflood routing(Neitsch et al.,2002).The relationship between input and output variables is described by regression equations.The SWAT model integrates all relevant eco-hydrological processes including waterflow, nutrient transport and turn-over,vegetation growth,and land use and water management at the subbasin scale.Consequently, the watershed is subdivided into subbasins based on the number of tributaries.Size and number of subbasins is variable,depending on stream network and size of the entire watershed.Subbasins are further disaggregated into classes of Hydrological Response Units (HRU),whereby each unique combination of the underlying geographical maps(soils,land use,etc.)forms one class.HRU are the spatial unit where the verticalflows of water and nutrients are calculated,which are then aggregated and summed for each subbasin.Water and material from HRU in sub-watersheds are routed to the sub-watershed outlet.The HRU in SWAT are spatially implicit,their exact position in the landscape is unknown,and it might be that the same HRU covers different locations in a subbasin(Neitsch et al.,2002;Di Luzio et al.,2005).The water balance for each HRU is represented by the four storages snow,soil profile,shallow aquifer and deep aquifer.The soil profile can be subdivided in up to ten soil layers.Soil water processes include evaporation,surface runoff,infiltration,plant uptake,lateralflow and percolation to lower layers(Arnold and Allen,1996;Neitsch et al.,2002).The surface runoff from daily rainfall is estimated with a modification of the SCS curve number method from United States Department of Agriculture-Soil Conservation Service(USDA SCS) (Arnold and Allen,1996;Neitsch et al.,2002).Nitrogen movement and transformation are simulated as a function of the nitrogen cycle(Neitsch et al.,2002;Jha et al.,2004). The SWAT model monitorsfive different pools of nitrogen in the soils:two inorganic(ammonium(NH4+)and nitrate(NO3À))and three organic(fresh organic nitrogen(associated with crop residue and microbial biomass)and active and stable organic nitrogen (associated with the soil humus)).Nitrogen is added to the soil by fertiliser,manure or residue application,fixation by bacteria,and rain(Neitsch et al.,2002).Nitrogen losses occur by plant uptake, surface runoff in the solution and the eroded sediment(Neitsch et al.,2002;Jha et al.,2004).Background for the crop growth and the management practices is the EPIC crop growth model,which is a comprehensivefield scale model.EPIC was originally developed to simulate the impact of erosion on crop productivity and has now evolved into a comprehensive agricultural management,field scale,nonpoint source loading model(Benson et al.,1988;King et al.,1996; Neitsch et al.,2002).The management practices are defined by specific management operations(e.g.the beginning and end of growing season,timing of tillage operations as well as timing and amount of fertiliser,pesticide,and irrigation application).These management operations take place in every HRU.The operations in turn are defined by specific management parameters(e.g. tillage depth,biological soil mixing efficiency,etc.)(Neitsch et al., 2002).2.2.Input dataWe used a semi-virtual watershed.Therefore we combined topography and climate information of an existing watershed with virtual land use and soil information.The Parthe watershed was chosen as study area.It is located in the State of Saxony in Central Germany and drains an area of about315km2(Fig.1).It is aA.Ullrich,M.Volk/Agricultural Water Management96(2009)1207–1217 1208subbasin of the Weiße Elster catchment in the Elbe River system. The topography of the area isflat with altitudes between106and 230m above sea level.The mean annual precipitation is about 570mm.The model input data are shown in Table1.For the sensitivity analysis,we assumed‘‘arable land’’to be homogeneous land use without any further differentiation.A typical soil profile was used from a soil map(1:25,000)of the Parthe watershed.The use of homogeneous land use and soil(semi-virtual catchment)is advantageous because the resulting data sets are concise and manageable and calculation time is reduced.Daily precipitation data and other climate data are from one weather station in the watershed.This station is part of the environmental monitoring network of the Environmental Operation Agency of the Saxon State Agency for the Environment,Agriculture and Geology.2.3.Sensitivity analysisModel sensitivity analysis regarding selected management practices was donefirstly by varying the most important tillage and management parameters:tillage depth,mechanical mixing efficiency,biological mixing efficiency,curve number,and Man-ning’s roughness coefficient for overlandflow,USLE support practice factor,andfilter strip width.Secondly,management practices were parameterised and varied for different crops and dates of operation. Subsequently,the influence of varying these practices on water balance components and nutrients was evaluated.2.4.Management parametersThe applied tillage operation(plough,stubble cultivation, harrow,etc.)is defined by the parameters tillage depth(DEPTIL) and mechanical soil mixing efficiency(EFFMIX).These parameters also define the fraction of crop residue,nutrients,pesticides,and bacteria for each soil horizon,which are redistributed within the mixed soil depth(Neitsch et al.,2002).The biological soil mixing efficiency(BIOMIX)defines the activity of soil organisms,such as earthworms as representatives of macrofauna,which influence soil porosity and waterfluxes by their grubbing activity(Kladivoka, 2001;Neitsch et al.,2002).The biological soil mixing efficiency can be defined for each HRU.The SCS curve number(CN)defines soil permeability based on soil characteristics and land cover(land use).This parameter routes the process of infiltration and generation of surface runoff.The parameter CN can generally be defined on the HRU level and more detailed based on tillage operations data(Neitsch et al.,2002).The Manning’s roughness coefficient for overlandflow(OV_N)is a parameter toestimateFig.1.Location of the study area in Germany.Table1Input data.Topography Land use Soil WeatherDEM Homogeneous Homogeneous Daily values-Area:315km2-Arable land-Cambisol-Precipitation[mm]-Grid cell size:30m-Mean wind speed(recorded in2.5m height)[m/s]-Max.and min.air temperature[8C]-total solar radiation(calculated using global radiation)[MJ/m2]-Mean relative humidity(recorded in0.5and2m height)[%]A.Ullrich,M.Volk/Agricultural Water Management96(2009)1207–12171209overlandflow velocity,which depends on characteristics of the land surface.This parameter can be defined for each HRU(Neitsch et al.,2002).The management parameter USLE support practice factor(USLE_P)defines the ratio of soil loss with a specific support practice(such as contour tillage,strip cropping,and terraces)to the corresponding loss with up-and-down the cultivation.The parameter USLE_P can also be defined on the HRU level(Neitsch et al.,2002).The width of edge offieldfilter strip(FILTERW)defines filter strips with a specific width in meters.Thefilter strips are not differentiated any further.Sediment and nutrient loads in surface runoff and subsurfaceflow are reduced as it passes through the strip.Filter strips can be defined for each HRU(Neitsch et al.,2002).For each simulation only one parameter was varied within a realistic range(see Table2).The value ranges defined for each model parameter are based on literature studies(Neitsch et al., 2002).SWAT also supplies the user with default parameters values. For the basic settings we used these default values,as we are not working with real conditions where these values would have to be adjusted to.The advantage of this method is that the effect on model output is related to the variability of only the selected parameter,but it does not consider the dependency on settings chosen for the other parameters(Arabi et al.,2007).For sensitivity analysis a basic management scenario was used. This is a generalised Agricultural Land Close Grown(AGRC) scenario,which uses values for winter wheat.One fertiliser application(70kg N/ha)just after seeding,and one tillage operation(deep ploughing)just after harvesting,was implemen-ted.This basic scenario was not changed during sensitivity analysis of management parameters.The model output parameters investigated are surface runoff,baseflow,total water yield,total sediment loading,organic nitrogen,organic phosphorus,nitrate in surface runoff,nitrate,and phosphorus leached.The results(see Fig.2)indicate SCS curve number as a very sensitive parameter for water balance components and nutrient and sediment load.This observation is confirmed by Neitsch et al. (2002)as well as by other studies,such as Sloot et al.(1994), Heuvelmans et al.(2004),Bracmort et al.(2006),and Arabi et al. (2007).The CN is most sensitive for values above65.For example surface runoff increased from almost zero up to more than100mm between CN65to95.At the same time,corresponding surface runoff organic nitrogen,organic phosphate,nitrate in surface runoff and total sediment loading increased.In contrast,based on the decrease of baseflow,nitrate and phosphate leached decreased.Biological soil mixing efficiency and Manning’s roughness coefficient for overlandflow do only moderately affect water balance components.The values vary less than5mm for applied parameter ranges.For the value range of biological soil mixing efficiency(0–1)the results for organic nitrogen(simulated range between0.225kg/ha and0.55kg/ha),organic phosphate(0.034–0.069kg/ha),and total sediment loading(0.057–0.318t/ha)increased while phosphate leached(0.318–0.145kg/ha)decreased. For the watershed area(315km2)this represents load values for organic nitrogen between7.1t and17.3t,organic phosphate between1.1t and2.2t,phosphate leached between10t and4.6t, and total sediment loading between1795t and10,017t.Based on these results we assume biological mixing efficiency to be a sensitive parameter regarding the above described nutrient components.Manning’s roughness coefficient for overlandflow affected organic nitrogen(simulated range between0.248kg/ha and 0.135kg/ha;7.8–4.3t for watershed area)followed by sediment loading(0.088–0.048t/ha; 2.8–1.5t for watershed area)and organic phosphorus(0.038–0.02kg/ha; 1.2–0.6t for watershed area).Therefore,we assume this parameter to be sensitive with respect to the described nutrients and sediment load.Both the USLE support practice factor and the width of edge of fieldfilter strip do not influence water balance components.But USLE support practice factor is very sensitive to total sediment loading(simulated range between0.007t/ha and0.067t/ha;220–2110t for watershed area),organic nitrogen(0.019–0.187kg/ha, 0.6–5.9t for watershed area),and organic phosphorus(0.003–0.027kg/ha;0.09–0.9t for watershed area)while the width of edge offieldfilter strip affected organic nitrogen and decreased from 0.187kg/ha to0.076kg/ha(see Fig.3).This means that with an extension of thefilter strip width from0.5m to5m the organic nitrogen loss related to the watershed area decreased about50% (from5.9t to2.4t).Furthermore,with increasing width of edge of fieldfilter strip organic phosphate(simulated values:0.027kg/ha and0.011kg/ha;0.85t and0.35t),nitrate load in surface runoff (0.047–0.019kg/ha;1.5–0.6t)and total sediment loading0.067–0.027t/ha;2110–850t)decreased.In this study the variation of tillage depth and mechanical soil mixing efficiency did not influence neither water cycle components nor nutrient and sediment cycle components.2.5.Management practicesWith respect to the management parameters’sensitivity,the tillage operations subject to management practices(conventional (CVT),conservation(CST)and no-tillage(NOT))were parameterised exemplary(see Table3).Here,conventional tillage primarily is distinguished dependent on tillage practices applied after harvest-ing including deep ploughing,previous stubble cultivation and following harrow operation before seeding/planting.For conserva-tion management a multiplicity of measures can be taken.For tillage practice we chose altogether three variations:(a)deep ploughing operation is replaced by a less intensive operation(CST_A),(b)deep ploughing operation is left out and not replaced(CST_B)and(c) harrow operation is applied only(CST_C).Parameters were set as follows.Differentiated by applied tillage operation,we parameterised curve number(CN)values in detail. The curve number adjustment is strongly linked to the soil dependent basic curve number identified within calibration process,planted crop(grain and root crop),applied tillage operation,and residue coverage(defined by applied management practice).The allocation of the SCS curve number is based on the parameterisations suggested by Neitsch et al.(2002)and continuative on the comments of Rawls and Richardson(1983). Rawls and Richardson(1983)recommend lowering the SCS curve number by2%for soils with poor hydrological conditions when applying conservation tillage(compared to conventional tillage). Forfields with good hydrological conditions,the SCS curve number should be lowered by4%compared to conventional tillage.King et al.(1996)applied EPIC using curve number values of87and82 for conventional tillage and for no-tillage practices respectively representing the soil hydrological group D(clay soil).Sloot et al. (1994)used the initial curve numbers:A value of84forTable2Basic parameter settings and variation ranges.Parameter Basic setting Parameter rangeSCS curve number(CN)7535–95 Biological soil mixingefficiency(BIOMIX)0.20–1.0Manning’s roughnesscoefficient for overlandflow(OV_N)0.140.01–0.5Tillage depth(DEPTIL)[cm]300–95 Mechanical soil mixingefficiency(EFFMIX)0.50–1.0USLE support practicefactor(USLE_P)1.00.1–1.0Width of edge offieldfilter strip(FILTERW)[m]0.00–5.0A.Ullrich,M.Volk/Agricultural Water Management96(2009)1207–12171210conventional tillage,83for minimum tillage(conservation tillage) and82for no-tillage.Here,the initial CN representing the soil hydrological group A(for soils with good hydrological conditions) was used.Biological soil mixing efficiency is a sensitive parameter and was parameterised in detail depending on the intensity of the applied management practice.As a result,the biological mixing activity decreases with increasing tillage intensity.Theparameter Fig.2.Sensitivity of SWAT model to tillage parameters:CN,BIOMIX andOV_N.Fig.3.Sensitivity of SWAT model to management practice parameters USLE_P and FILTERW.A.Ullrich,M.Volk/Agricultural Water Management96(2009)1207–12171211values for biological soil mixing efficiency used in this study were discussed with local farmers.Manning’s roughness coefficient for overland flow was defined subject to management practise and changing residue cover (Sloot et al.,1994;Neitsch et al.,2002).The parameter increases with increasing soil coverage according to decreasing tillage intensity.We defined only one tillage depth and mixing efficiencies for one main tillage operation (as applied crop-dependent on the field in reality;Abraham et al.,2004).The timing of tillage operations affects soil coverage (residue decomposition).For example,fall tillage operation reduces residue over the winter and spring period.The timing of tillage and theTable 3Parameterisation of tillage operations within management practices.ScenarioTillage operationDEPTIL a (cm)EFFMIX bBIOMIX cOV_N dCN*e GrainsRow cropsConventional tillage (CVT)CVT Cultivation stubble120.450.10.0976Plough (bare soil)250.8577Harrow 70.3Plant 6367Harvest 74Conservation tillage (CST)CST_A Cultivation stubble120.450.20.1376Harrow 70.3Plant 6266Harvest74CST_B 0.30.19CST_C Harrow70.30.40.374Plant 6165Harvest 73No-tillage (NOT)Plant 0.40.36064Harvest73a Abraham et al.(2004)—based on practical experience.b Neitsch et al.(2002).c Discussed with local farmers.d Neitsch et al.(2002).eNeitsch et al.(2002)–CN is exemplarily used representatively for soil hydrological group A –soil with good hydrological conditions.Table 4Tillage scenarios based on tillage practices;(P)plough,(St)stubble cultivation,(H)harrow,(S)seed (dates by Abraham et al.,2004).Dates of operation Fall tillageSpring tillage Spring barley 03.August 10.October 01.March 05.March 10.March15.MarchWinter barley 12.August 20.August 01.September 05.September Sugar beet08.October 11.October 26.March 01.April 05.April 10.April Conventional tillage CVTSt P ––H S CVT_1St P –––S CVT_2–P ––H S CVT_3–P –––S CVT_4St ––P H S CVT_5St ––P –S CVT_6––St P H S CVT_7––St P –S Conservation tillage CST_A St St ––H S CST_A1St St –––S CST_A2St ––St H S CST_A3St ––St –S CST_A4––St St H S CST_A5––St St –S CST_B St –––H S CST_B1St ––––S CST_B2–St ––H S CST_B3–St –––S CST_B4–––St H S CST_B5–––St –S CST_B6––St –H S CST_B7––St ––S CST_C ––––H S No-tillage NOT–––––SA.Ullrich,M.Volk /Agricultural Water Management 96(2009)1207–12171212choice of tillage operation depend on the crop being planted and the chosen management practice (Kirsch et al.,2002).Therefore differences between spring and winter crops as well as between grains and root crops are expected.Hence we applied commonly planted crops:spring barley (Hordeum vulgare )—representative for grains planted in early spring;winter barley (Hordeum vulgare var.a genuinum )—representative for grains planted in early fall and sugar beet (Beta vulgaris )—representative for root crops planted in early spring.For each crop depending on management practice basic scenarios were defined (see Table 4).Conventional and conservation tillage are primarily distinguished by tillage practices applied directly after harvesting (deep ploughing,previous stubble cultivation).The harrow operation is applied for all scenarios just before seeding/planting.Following sub-scenarios for conventional and conservation tillage (CVT_1,CVT_2,etc.)we defined where,e.g.tillage operations,were applied at different dates (for springplanted crops spring tillage instead of autumn tillage)to identify the sensitivity of SWAT model to the timing of the tillage operations.Management practices related tillage operations are chronolo-gical (e.g.conventional tillage:stubble cultivation/deep ploughing/harrowing).Thus,the harrow operation is least intensive operation.In the following,varying tillage operation combinations were applied to find out if it is necessary to parameterise a less intensive operation which follows a more intensive operation (e.g.harrowing after ploughing).If the effect on model output parameters is only marginal the less intensive operation could be left out.Additionally,the conservation management practice contour-ing and implementation of filter strips was applied to the base tillage scenarios of conservation tillage CST_A and CST_B (e.g.CST_Aa)and no-tillage practise (see Table 5).Finally,a catch crop (red clover)scenario was implemented (CST_CC)for green manuring (only applied for conservation tillage basic scenario with sugar beet).3.Results and discussionGenerally,our results confirm the outcome of studies under-taken by Kirsch et al.(2002),Chaplot et al.(2004),Pandey et al.(2005),Tripathi et al.(2005),and Behera and Panda (2006)that conventional tillage practices need to be replaced by less intensiveTable 5Parameter settings for contouring and filter stripes.ScenarioParameter USLE_PFILTERW (m)_a 0.60_b 1.02_c0.62Fig.4.Percentage deviation of modelling results regarding to application of basic management scenarios with a)sugar beet,b)spring barley and c)winter barley on water balance components,nutrients and sediment loading.A.Ullrich,M.Volk /Agricultural Water Management 96(2009)1207–12171213。
双尺度WC-CoCr涂层的组织结构分析

双尺度WC-CoCr涂层的组织结构分析罗虞霞;高峰;王大锋【摘要】微纳米复合结构的碳化钨涂层的性能引人关注.以纳米碳化钨(≤200nm)、亚微米碳化钨(0.8μm)和微米碳化钨(2μm)为原料,制备了两种双尺度的微纳米复合结构碳化钨喷涂粉末,采用超音速火焰喷涂工艺制备了相应的涂层.利用扫描电镜、能量色散X射线光谱仪和透射电镜对涂层的物相结构进行了分析.结果表明,纳米微米复合粉涂层中的碳化钨保留率为96.7%;纳米亚微米复合粉末制备的涂层碳化钨保留率为92.5%.两种涂层中,W2C均分布在WC附近,大颗粒WC颗粒仍保持原来的尖角形,小尺度WC颗粒部分呈圆角形,纳米-亚微米涂层中Co3W3C相分散于WC与非晶相之间.【期刊名称】《热喷涂技术》【年(卷),期】2018(010)003【总页数】6页(P33-37,9)【关键词】碳化钨;微纳米复合结构;超音速火焰喷涂【作者】罗虞霞;高峰;王大锋【作者单位】北京矿冶科技集团有限公司,北京100160;北京市工业部件表面强化与修复工程技术研究中心,北京102206;特种涂层材料与技术北京市重点实验室,北京102206;北京矿冶科技集团有限公司,北京100160;北京市工业部件表面强化与修复工程技术研究中心,北京102206;特种涂层材料与技术北京市重点实验室,北京102206;中国兵器科学研究院宁波分院焊接与再制造技术研究室,浙江宁波315103;北京科技大学,北京100083【正文语种】中文【中图分类】TG174.40 引言热喷涂WC-CoCr涂层具有优异的耐磨耐蚀性能,广泛地应用于冶金、石油化工、航空航天等领域[1,2]。
WC-CoCr涂层的力学性能取决于涂层的物相结构、粒子间的结合情况等显微组织结构。
研究表明,在一定喷涂工艺范围内,碳化钨颗粒的尺寸是影响涂层性能的主要因素[3]。
不同研究者制备的纳米碳化钨性能差异较大[4-7]。
因此纳米碳化钨的使用并不广泛,而微纳米复合结构的碳化钨性能较优,并获得了较多的应用。
CAV2009-final13
Proceedings of the 7th International Symposium on CavitationCAV2009 – Paper No. 13August 17-22, 2009, Ann Arbor, Michigan, USA Quantification of Cavitation Impacts with Acoustic Emissions TechniquesMr Anne Boorsma Lloyd's Register ODS, UKPatrick Fitzsimmons Lloyd's Register ODS, UKABSTRACTCavitation erosion on propellers and rudders remains a problem in the marine industry. The consequences of failing to detect the risk of erosion damage during the design phase, and early in the service life of a vessel, include reducing the speed of the vessel, unscheduled dry-dockings and repairs or replacement of the propellers or rudders. The associated costs are borne by the builder and owner and may harm their reputations within the industry.Lloyd’s Register has developed and tested a unique measurement system, based on acoustic emission techniques, which is capable of detecting the onset of erosion damage on propellers and rudders. The system uses high frequency transducers to quantify the impulsive energy transmitted from imploding cavitation events through the material paths of rudder, propeller and shafting configurations. The acoustic emission signals from such events have been synchronised with visual observations using high speed video equipment and borescopes.INTRODUCTIONCavitation erosion on propellers and appendages, in particular rudders [1], remains a problem in the marine industry. Erosion damage requires increased maintenance including more frequent monitoring of the damage, dry-dockings and repairs and can limit the operational profile of a vessel. The associated additional costs are borne by the ship owner and ship builder.Erosion damage occurs as a result of failures to identify erosive cavitation characteristics during the project design phase. It is difficult to assess the erosive potential of cavitation from calculations and model tests, even when using the current, qualitative, paint and observational techniques [2].When a vessel enters service, (underwater) inspections may not identify erosion damage until after the incubation period, when the surfaces have started to break up. Therefore, damage may not be discovered until or after the guarantee dry-docking limiting palliative action by both builder and owner. Moreover, when erosion occurs it can be difficult to answer some of the questions that would help to create a better understanding of and allow better control of erosion. If the exact conditions and phenomena that lead to erosion were known, full scale observations and model tests could be interpreted to modify the design and avoid erosive cavitation. Alternatively, this information could be used to change the operating profile in order to minimize erosion damage. To this end Lloyd's Register has developed a condition monitoring capability for erosion damage from cavitation which is based on acoustic emission techniques.MEASUREMENT TECHNIQUELloyd's Register has been using and developing acoustic emission techniques over the past 12 years [3]. This technique relies on high frequency sensors that detect wide band stress waves travelling through a structure, referred to as acoustic emissions. Typical sources of acoustic emissions include crack growth and metal to metal contact, hence Lloyd’s Register has used this technique extensively to monitor crack growth in, mainly, metallic structures and for the condition monitoring of rotating machinery. However, it was found that cavitation impacts also give rise to such acoustic emissions which travel through physical connections to locations inside the ship. Acoustic emission sensors can easily be installed inside the ship and used to monitor and quantify such cavitation impacts. LICHTAROWICZ CELLThe feasibility of using acoustic emission techniques to detect cavitation erosion was first shown in tests in a Lichtarowicz cavitation cell in work carried out for the EROCA V project. In a Lichtarwicz cell, shown in Figure 1, a cavitating jet impinges on a specimen causing erosion. By varying jet and chamber pressures and the distance between nozzle and target, different impact intensities can be created.The Lichtarowicz cell was fitted with a primary acoustic emission sensor at the back of the target specimen, and a number of secondary sensors on the walls of the cylindrical tank. Acoustic emission energy was recorded at a number ofdifferent conditions and compared with mass loss rates measured by Momma [4].The results, inFigure 2, show there is a correlation between acoustic emission energy and mass loss rate and therefore acoustic emission techniques can be used to quantify the erosive potential of cavitation impacts. Furthermore, using the arrival times of acoustic bursts, it was possible to locate the impacts at the target surface giving confidence that recorded signals were a result from cavitation impacts.SIGNAL ATTENUATIONDuring in-service measurements it is seldom possible to install sensors directly at the impact location as in the Lichtarowicz cell. However, as the acoustic emission travels from its origin to the measurement location, its amplitude willreduce. This attenuation can be measured using a Hsu-Nielsen source which generates a signal of known magnitude at a known location. This distance amplitude correction was measured for typical structures subject to cavitation erosion such as rudders and propellers. A propeller test set up and the result of such a test are shown in Figure 3.Figure 1, Test set up in Lichtarowicz cavitation cellFigure 3, Test set up and measured attenuation curveFigure 2, Correlation of acoustic emission energy anderosion rate EROSION OF APPENDAGESThe erosion detection system was first used in-service on a number of rudder horns since these are easily accessible from inside a ship. Rudder horns are nearly always subject to impacts from vortex cavitation from the propeller tip and sometimes erosion occurs where this vortex meets the rudder horn leading edge.Figure 4 shows an acoustic emission measurement and observation test set up to quantify the erosive potential of the impact of propeller tip vortex cavitation (TVC). Acoustic emission sensors are installed on the rudder horn inside the ship and a borescope observation position is located several metres off the ship centre line to provide a good view of the passing tip vortex.The acoustic emission time series in Figure 5 exhibits aburst at every blade passage and is hence likely related to theinteraction of the passing, consecutive, tip vortices (TVC) andthe rudder leading edge. Simultaneous observations, alsoshown in Figure 5, suffered from a lack of light but still showthat the instant the tip vortex is expected to impinge on therudder horn (Image C) coincides with the acoustic emissionburst. Therefore the burst will be a result of cavitation impacton the leading edge of the rudder horn. Furthermore, byinstalling several sensors on the rudder horn and using thearrival times of the acoustic emission, it was possible to locatethe impact at the site where erosion damage was observed.These findings were consistent over tests carried out on anumber of ships.Figure 4, measurement and observation of tip vortex impactSHAFT-MOUNTED EROSION-DETECTION SYSTEMTo measure acoustic emissions from cavitation impact on apropeller a shaft-mounted erosion-detection system wasdeveloped. This system, consisting of an acoustic emissionsensor, a signal conditioning unit and a telemetry set, is shownin Figure 6 together with a schematic of the measurement setup.Figure 6, Shaft-mounted erosion-detection system Figure 5, Simultaneous video observations and acousticemission measurementsThe ship’s engine room, due to the associated acoustic emission sources other than cavitation impact, is a challenging place for acoustic emission measurements, further complicated by the significant attenuation caused by the large distance between emission source and sensor. To evaluate this, an attenuation test was performed with a specifically designed Hsu-Nielsen source, capable of creating an acoustic emission equivalent to one from cavitation impact. These tests were performed on a berthed containership where the propeller tips only were not immersed. The majority of the blade and hub were submerged to simulate the actual conditions at which measurements would be performed. These measurements indicated that cavitation impacts on the propeller tips could be detected on the shaft inside the ship and an attenuation curve, as shown in Figure 3, was determined for a propeller and shaft combination.ASSESSMENT OF PROPELLER EROSION RISKThe viability of the system to quantify cavitation impacts on a propeller was investigated on a tanker with known erosion problems. Erosion of the propeller occurred towards the “ear” of the blade on the suction side, as shown in Figure 7, and had grown to a depth of approximately 10mm in the first 12 months of service.A propeller erosion-detection system was mounted on the shaft of the tanker, as shown in Figures 6, and measurements were performed in ballast and loaded condition over a range of shaft speeds. Simultaneously, high speed video observationswere performed with two synchronized borescope systems from port and starboard.Two examples of acoustic emission time series, recorded at 62RPM and 74RPM in ballast condition, are shown in Figure 8. At both shaft speeds the signal was periodic with the blade passing frequency which suggests that cavitation impacts on the blade were the likely source of acoustic emission. Furthermore, the direction of travel of the acoustic emission, determined by two sensors located along the shaft line, was away from the propeller which also indicated the propeller as the origin of the emission.Figure 8, Recorded acoustic emissions from propeller cavitation impact TELESuction SideOrange P eelAreas of Major P ittingMissing P iece495 mmFigure 7, Erosion damage on a tanker propeller.At 62RPM the signal for every blade passage showed some repeatable features with the suggestion of a burst occurring twice per blade passage. In this low power condition the cavitation volumes are likely to be small and, possibly, more susceptible to temporal variations in the wakefield. This might suppress repeatable cavitation phenomena and lead to a less periodic acoustic emission signal. With increasing shaft speed the signal amplitude increased and at 74 RPM there were twodistinct bursts with every blade passage. The increasedamplitude is consistent with the increased energy supplied to the cavitation, although the cavitation collapse and the accompanying impact pressures will also depend on local cavitation dynamics.Images of the propeller were only obtained in the loaded condition since entrained air obscured the view in the ballast condition. Two high speed videos (up to 400fps) simultaneously recorded images of propeller cavitation from locations forward of the propeller, to port and starboard. A series of consecutive stills from these recordings is shown in Figure 9.Figure 9, Recorded acoustic emissions from propeller cavitation impactImages A show the blade in the 12 o’clock position where the sheet cavity extent is largest. A cavitating vortex emanates from the tip of the blade. As the blade rotates further a streak of cavitation develops as a series of cloud-like structures at the lower extent of the sheet cavity, as shown in Images B. The path of these clouds is consistent with the lower edge of the sheet cavity, Images C, and collapse occurs in a focused manner on the “ear” of the blade, which coincides with the area where erosion damage was observed in Figure 7. The EROCA V guidelines [2] suggest that such a separate development of cavitation contains a high risk of erosion because of its repeated and focused collapse. The cavitation moves off the blade via the blade trailing edge, Images D, as the blade leaves the wake peak.Approximately 5 blade passages of simultaneous recorded time series of acoustic emission are also shown in Figure 9. In a similar manner to the measurements on the rudder horn, Figure 5, the peak in the acoustic emission signal corresponds to the moment when cavitation impact on the blade is observed, Images C, which gives confidence that the acoustic emission signals are indeed the result of cavitation impact. The cavitation collapse of the third blade passage in Figure 9 gives rise to a significantly larger acoustic emission than other blade passages. Interestingly, in this sequence it was only during the third blade passage that the separate streak of cloud cavitation, thought to be responsible for erosion, was prominent. High acoustic emission amplitudes were accompanied by the separate cloud cavitation throughout the recorded data set.The measured acoustic emissions, resulting from cavitation impact, provide information to quantify the erosive potential of cavitation. Counting the maximum peak for each blade passage in the time series signals (Figures 8 and 9), results in amplitude histograms as shown in Figures 10 and 11. These amplitude histograms reflect the energy present in the cavitation impacts at a given condition, where energy is proportional to the sum of the number of impacts times their amplitudes.Figure 10 shows the amplitude histograms for signals recorded in the ballast condition at shaft speeds between 62RPM and 74RPM. Up to 70RPM there is a steady increase of energy, however, at shaft speeds over 70RPM the impact energy increases markedly. Relating this to the observations in Figure 9, one could postulate that, in the ballast condition, the separated streak of cloud cavitation that resulted in the potentially erosive cavitation impacts only develops at shaft speeds over 70RPM.histograms in Figure 11, are very similar at shaft speeds up to 70RPM. However, at shaft speeds in excess of 70RPM there are significantly more bursts with large amplitudes in the ballast condition. This suggests that the potentially erosive cavitation, as observed in Figure 8, occurs more frequently in the ballast condition thus making this the more erosive condition, a result which is consistent with a more dynamic cavitation due to the reduced static pressure at the propeller. This effect is not offset by a reduction in power since the ship’s staff indicated a similar power was absorbed by the propeller in ballast and loadedcondition.CONCLUSIONSA system to monitor cavitation erosion on rudders and propellers has been successfully developed by Lloyd's Register. The development process included feasibility studies in a Lichtarowicz cell, attenuation tests in dry-dock and afloat, together with in-service measurements on ships. In the case of a tanker, suffering from erosion, the acoustic emission system has determined the operating conditions which have produced high levels of erosive cavitation. Furthermore, the use of simultaneous high speed video recordings synchronised with acoustic emissions signals has determined with greater certainty the type of cavitation phenomena which has proved erosive.Figure 11, Impact energy in ballast and loaded draught.Thus far, Lloyd’s Register has performed work primarily on ship’s rudders and propellers. However, this technique can easily be applied to other industrial equipment suffering from cavitation erosion such as turbines, pumps and waterjets.As further full scale work is performed, and the techniques adapted for model scale testing, it is anticipated that better ship-model-CFD correlations will be obtained and improved design guidance delivered to propeller and rudder designers.REFERENCES[1] Friesch, J. 2006, Rudder Erosion Damages Caused byCavitation, CA V2006 symposium, Wageningen, The Netherlands.[2] Bark, G. Berchiche, N. Grekula, M. 2004, Application ofprinciples for observation and analysis of eroding cavitation . Chalmers University of Technology [3] Rogers, L.M. 2001, Structural and EngineeringMonitoring by Acoustic Emission Methods – Fundamentals and Applications. Lloyd’s Register Technical Association[4] Momma, T. 1991, Cavitation Loading and ErosionProduced by a Cavitating Jet ., PhD thesis to Nottingham University, UK。
Cheng Hao,2009,Lithos
Transitional time of oceanic to continental subduction in the Dabie orogen:Constraints from U –Pb,Lu –Hf,Sm –Nd and Ar –Ar multichronometric datingHao Cheng a ,b ,⁎,Robert L.King c ,Eizo Nakamura b ,Jeffrey D.Vervoort c ,Yong-Fei Zheng d ,Tsutomu Ota b ,Yuan-Bao Wu e ,Katsura Kobayashi b ,Zu-Yi Zhou aaState Key Laboratory of Marine Geology,Tongji University,Shanghai 200092,ChinabInstitute for Study of the Earth's Interior,Okayama University at Misasa,Tottori 682-0193,Japan cSchool of Earth and Environmental Sciences,Washington State University,Pullman,Washington 99164,USA dCAS Key Laboratory of Crust-Mantle Materials and Environments,School of Earth and Space Sciences,University of Science and Technology of China,Hefei 230026,China eState Key Laboratory of Geological Processes and Mineral Resources,Faculty of Earth Sciences,China University of Geosciences,Wuhan 430074,Chinaa b s t r a c ta r t i c l e i n f o Article history:Received 22August 2008Accepted 9January 2009Available online 8February 2009Keywords:Continental subduction Dabie EclogiteGeochronologyOceanic subduction Tectonic transitionWe investigated the oceanic-type Xiongdian high-pressure eclogites in the western part of the Dabie orogen with combined U –Pb,Lu –Hf,Sm –Nd and Ar –Ar geochronology.Three groups of weighted-mean 206Pb/238U ages at 315±5,373±4and 422±7Ma are largely consistent with previous dates.In contrast,Lu –Hf and Sm –Nd isochron dates yield identical ages of 268.9±6.9and 271.3±5.3Ma.Phengite and amphibole Ar –Ar total fusion analyses give Neoproterozoic apparent ages,which are geologically meaningless due to the presence of excess 40Ar.Plagioclase inclusions in zircon cores suggest that the Silurian ages likely represent protolith ages,whereas the Carboniferous ages correspond to prograde metamorphism,based on the compositions of garnet inclusions.Despite weakly-preserved prograde major-and trace element zoning in garnet,a combined textural and compositional study reveals that the consistent Lu –Hf and Sm –Nd ages of ca.270Ma record a later event of garnet growth and thus mark the termination of high-pressure eclogite –facies metamorphism.The new U –Pb,Lu –Hf and Sm –Nd ages suggest a model of continuous processes from oceanic to continental subduction,pointing to the onset of prograde metamorphism prior to ca.315Ma for the subduction of oceanic crust,while the peak eclogite –facies metamorphic episode is constrained to between ca.315and 270Ma.Thus,the initiation of continental subduction is not earlier than ca.270Ma.©2009Elsevier B.V.All rights reserved.1.IntroductionSubduction zones are essential to the dynamic evolution of the earth's surface due to plate tectonics.Subduction of oceanic and continental crust eventually leads to closure of backarc basins and arc-continent and continent-continent collisions (O'Brien,2001;Ernst,2005;Zheng et al.,2008),forming various types of high-pressure (HP)and ultrahigh-pressure (UHP)metamorphic rocks.Subduction of oceanic lithosphere causes a complex continuum of diagenetic and metamorphic reactions;many kilometres of oceanic lithosphere are ultimately consumed prior to the subsequent continental slab subduction and collision.Subducted continental slabs that detach from the oceanic lithosphere that was dragging them into the mantle are expected to rapidly rise to Moho depths because of their positive buoyancy.Thus,studying subducted oceanic crust in subduction zones can provide clues to the incorporation rate of supercrustal materialinto the mantle and can shed light on the initiation of successive continental subduction.Determining a geochronological framework for determining the sequence and duration of oceanic to continental subduction and HP and UHP metamorphism plays an essential role in this respect.Zircon has long been recognized as a promising geochronometer of the U –Pb decay system because of its refractory nature,commonly preserved growth zones and mineral inclusions within a single grain.Recent developments in analytical techniques allow us to unravel a wealth of information contained in zircons with respect to their growth history and thus the prograde and retrograde metamorphic evolution of the host rock (Gebauer,1996;Wu et al.,2006;Zheng et al.,2007).The Lu –Hf garnet technique has been applied to constrain the prograde and high-temperature histories of metamorphic belts (e.g.,Duchêne et al.,1997;Blichert-Toft and Frei,2001;Anczkiewicz et al.,2004,2007;Lagos et al.,2007;Kylander-Clark et al.,2007;Cheng et al.,2008a )because of its high closure temperature (Dodson,1973;Scherer et al.,2000)and the fact that garnet strongly partitions Lu over Hf,resulting in a high parent/daughter ratio (Otamendi et al.,2002).Combined with Sm –Nd age determination,the Lu –Hf garnet geochronometer can potentially be used to estimate the duration ofLithos 110(2009)327–342⁎Corresponding author.State Key Laboratory of Marine Geology,Tongji University,Shanghai 200092,China.Tel.:+862165982358;fax:+862165984906.E-mail address:chenghao@ (H.Cheng).0024-4937/$–see front matter ©2009Elsevier B.V.All rights reserved.doi:10.1016/j.lithos.2009.01.013Contents lists available at ScienceDirectLithosj ou r n a l h o m e pa g e :ww w.e l s ev i e r.c o m/l o c a t e /l i t h o sFig.1.Simpli fied geologic map of the Huwan mélange area (b)in southern Dabie orogen (a),modi fied after Ye et al.(1993)and Liu et al.(2004b),showing the sample localities for the Xiongdian eclogite.References:asterisk,this study;[1],Ratschbacher et al.(2006);[2],Jahn et al.(2005);[3],Liu et al.(2004a);[4],Eide et al.(1994);[5],Webb et al.(1999);[6],Xu et al.(2000);[7],Ye et al.(1993);[8],Sun et al.(2002);[9],Jian et al.(1997);[10],Jian et al.(2000);[11],Gao et al.(2002);[12],Li et al.(2001);[13],Wu et al.(2008).amp —amphibole;brs —barroisite;phen —phengite;zrn —zircon.328H.Cheng et al./Lithos 110(2009)327–342garnet growth,which either reflects early prograde metamorphism (Lapen et al.,2003),exhumation(Cheng et al.,2009)or a particular garnet growth stage(Skora et al.,2006).Dating the exhumation of high-pressure(HP)and ultra-high-pressure(UHP)metamorphic rocks by conventional step-heating Ar–Ar technique was largely hampered and discredited due to the presence of excess/inherited argon(Li et al.,1994;Kelley,2002).However,the Ar–Ar geochron-ometer remains irreplaceable in constraining the exhumation of HP/ UHP metamorphic rocks because of its intermediate closure tempera-ture.Nevertheless,timing must be integrated with textures and petrology in order to quantify the dynamics of geological processes, whichever geochronological method is used.During the past two decades,considerable progress has been made in constraining the prograde metamorphism and exhumation of HP/ UHP metamorphism of the Dabie–Sulu orogen by a variety of geochronological methods,indicating a Triassic collision between the South China and North China Blocks(e.g.,Eide et al.,1994;Ames et al., 1996;Rowley et al.,1997;Hacker et al.,1998;Li et al.,2000,2004; Zheng et al.,2004).The initiation of continental subduction is pinned to ca.245Ma(Hacker et al.,2006;Liu et al.,2006a;Wu et al.,2006; Cheng et al.,2008a),but the exact time is poorly constrained.On the other hand,thefingerprints of early continental subduction may not be preserved in continental-type metamorphic rocks due to the succes-sive high-temperature prograde and retrograde overprints.Alterna-tively,the timing of initiation of continental subduction subsequent to the termination of oceanic subduction may be registered in the HP/ UHP eclogites,whose protoliths are of oceanic origin.Currently,the only outcropping candidate is the Xiongdian HP eclogite in the western part of the Dabie orogen(Li et al.,2001;Fu et al.,2002).However,U–Pb zircon ages ranging from216±4to449±14Ma have been obtained for the Xiongdian eclogite(Jian et al.,1997;Sun et al.,2002;Gao et al., 2002);the geological significance of this age spread is controversial. Efforts to clarify the geochronological evolution of the Xiongdian eclogite were hampered by a much older Sm–Nd garnet-whole-rock isochron of533±13Ma(Ye et al.,1993)and the fact that further Sm–Nd and Rb–Sr analyses failed to produce mineral isochrons(Li et al., 2001;Jahn et al.,2005),although oxygen isotopic equilibrium was largely attained(Jahn et al.,2005).Here,we present a combined U–Pb,Lu–Hf,Sm–Nd,Ar–Ar and oxygen multi-isotopic and mineral chemical study of the Xiongdian eclogite.The differences in these systems,in conjunction with chemical profiles in garnet porphyroblasts and zircons,provide a window into the time-scales of the oceanic subduction and sub-sequent exhumation.2.Geochronological background and sample descriptionsThe Qinling–Dabie–Sulu orogen in east-central China marks the junction between the North and South China Blocks(Cong,1996; Zheng et al.,2005).The western part of the Dabie orogen,usually termed the West Dabie and sometimes the Hong'an terrane,is separated from the Tongbaishan in the west by the Dawu Fault and from the East Dabie by the Shangma fault in the east(Fig.1a).It contains a progressive sequence of metamorphic zones characterized by increasing metamorphic grade,from transitional blueschist–greenschist in the south,through epidote–amphibolite and quartz eclogite,to coesite eclogite in the north(e.g.,Zhou et al.,1993;Hacker et al.,1998;Liu et al.,2004b,2006b).The Xiongdian eclogites crop out in the northwestern corner of the West Dabie,in the Xiongdian mélange within the Huwan mélange after the definition of Ratschba-cher et al.(2006),in analogy to the terms of the Sujiahe mélange(Jian et al.,1997)and Huwan shear zone(Sun et al.,2002).The Huwan mélange consists of eclogite,gabbro,amphibolite,marble,and quartzite.The eclogitic metamorphic peak for the Xiongdian eclogite is estimated at600–730°C,1.4–1.9GPa(Fu et al.,2002),550–570°C,∼2.1GPa(Liu et al.,2004b)and540–600°C,∼2.0GPa(Ratschbacher et al.,2006),followed by retrogression at530–685°C and∼0.6GPa (Fu et al.,2002).Except for the Xiongdian eclogite,consistent Triassic metamorphic ages have been obtained for other eclogites across the West Dabie (Webb et al.,1999;Sun et al.,2002;Liu et al.,2004a;Wu et al.,2008). This indicates that West Dabie is largely a coherent part of an HP–UHP belt elsewhere in the Dabie–Sulu orogenic belt.Geochronological debate is limited to the Xiongdian eclogite(Fig.1b).U–Pb zircon ages ranging from ca.216to ca.449Ma have been obtained for the Xiongdian eclogite.Jian et al.(1997)reported ca.400,ca.373and 301±0.6Ma ages by ID–TIMS method.Weighted-mean SHRIMP ages range from335±2to424±5Ma(Jian et al.,2000).The Silurian U–Pb zircon ages were interpreted as the age of the protolith,while the Carboniferous ages mark high-pressure metamorphism(Jian et al., 1997,2000).Weighted-mean206Pb/238U SHRIMP U–Pb zircons ages of 433±9,367±10and398±5Ma were interpreted as the protolith age,while323±7and312±5Ma likely date the high-pressure metamorphism(Sun et al.,2002).A Triassic age of216±4Ma together with449±14and307±14Ma weighted-mean206Pb/238U SHRIMP U–Pb zircon ages appear to argue for the involvement of the Triassic subduction in the Xiongdian eclogite(Gao et al.,2002).A garnet-whole-rock Sm–Nd isochron of533±13Ma(Ye et al.,1993)was interpreted to reflect the high-pressure metamorphism age.Several Table1Chemical compositions of the Xiongdian eclogite from the western Dabie.Sample number DB17DB18(Major oxides in%)SiO254.5452.45 TiO20.370.43 Al2O314.6212.35 Fe2O38.7710.15 MnO0.150.16 MgO 6.669.91 CaO10.3510.26 Na2O 2.88 2.65 K2O0.600.28 P2O50.060.05 Cr2O3⁎6601118 NiO⁎137247 L.O.I0.87 1.28 Total99.95100.11 (Trace elements in ppm)Li27.627.0 Be0.560.47 Rb9.7813.8 Sr178130Y12.612.7 Cs0.89 3.67 Ba86552.4 La 2.21 1.77 Ce 5.97 5.12 Pr0.880.80 Nd 4.35 4.10 Sm 1.25 1.26 Eu0.470.39 Gd 1.53 1.52 Tb0.280.29 Dy 1.83 1.91 Ho0.410.42 Er 1.14 1.19 Tm0.190.19 Yb 1.31 1.34 Lu0.200.20 Pb 6.44 1.85 Th0.050.07 U0.110.06 Zr28.828.2 Nb 1.19 1.77 Hf0.870.88 Ta0.050.08⁎In ppm.329H.Cheng et al./Lithos110(2009)327–342Sm –Nd and Rb –Sr analyses failed to produces isochrons (Li et al.,2001;Jahn et al.,2005),which was believed to be due to unequilibrated isotopic systems despite the fact that oxygen isotopic equilibrium was largely attained (Jahn et al.,2005).Phengite 40Ar/39Ar ages of ca.430–350Ma have been explained as the retrograde metamorphic age (Xu et al.,2000).The 310±3Ma phengite 40Ar/39Ar age (Webb et al.,1999)is likely geologically meaningless due to the concave-upward age spectrum,indicating the presence of excess argon.Collectively,existing geochronology provides an apparently con flicting picture for the Xiongdian eclogites.The timing of the oceanic crust subduction and exhumation essentially remains to be resolved.The two eclogites examined in this study were selected based on their mineral assemblages,inclusion types and geological context (Fig.1).The one (DB17)from the east bank of the river to the east of Xiongdian village is a coarse-grained and strongly foliated banded eclogite,composed mainly of garnet,omphacite and phengite.A second (DB18)eclogite was sampled about 50m to the north of DB17and is strongly foliated with a similar mineralogy assemblage but smaller garnet grains.3.MethodsSample preparation,mineral separation and chemical procedures for isotope analysis,instrumentation and standard reference materials used to determine whole rock and bulk mineral compositions,in situ major and trace element analyses (Institute for Study of the Earth's Interior,Okayama University at Misasa,Japan),zircon U –Pb isotope and trace element analyses (China University of Geosciences in Wuhan),Lu –Hf and Sm –Nd isotope analyses (Washington State University),Ar –Ar isotope analyses (Guangzhou Institute of Geo-chemistry,Chinese Academy of Sciences)and oxygen isotope analyses (University of Science and Technology of China)are described in the Appendix .4.Results4.1.Bulk chemical compositionThe Xiongdian eclogites are mainly of basaltic composition,but they show a wide range of major and trace element abundances.Despite the high SiO 2(52–58%)and low TiO 2(0.32–0.43%)contents,Fig.2.Whole rock chemical analysis data.(a)Chondrite-normalized REE distribution patterns of the Xiongdian eclogites.(b)Primitive-mantle-normalized spidergrams of the Xiongdianeclogites.Fig.3.Backscattered-electron images and rim-to-rim major-element compositional zoning pro files of representative garnets in the matrix and as inclusions in zircon.Amp —amphibole;Ap —apatite;Cal —calcite;Cpx —clinopyroxene;Zo —zoisite;Phen —phengite;Omp —omphacite;Qtz —quartz;Zrn —zircon.330H.Cheng et al./Lithos 110(2009)327–342they have MgO=5.1–9.9%,Cr=430–1118ppm,Ni=88–247ppm (Table 1;Li et al.,2001;Fu et al.,2002;Jahn et al.,2005).In contrast to existing LREE-enriched chondritic REE patterns,our samples have rather flat REE patterns around ten times more chondritic abundances with small,both negative and positive Eu anomalies (Fig.2a).Rubidium is depleted and Sr displays enrichment with respect to Ce.Both negative and no Nb anomalies relative to La were observed (Fig.2b).The N-MORB-normalized value of Th is around 0.5,lower than previous reported values of up to 25(Li et al.,2001).4.2.Petrography and mineral compositionThe Xiongdian eclogites occur as thin layers intercalated with dolomite –plagioclase gneiss and phengite –quartz schist (Fu et al.,2002),mainly consisting of garnet,omphacite,epidote (clinozoisite),phengite and minor amphibole,quartz and kyanite (Fig.3).Zircons were observed both as inclusions in garnet porphyroblasts and in the matrix.The samples have similar mineral assemblages,but differ in modal compositions.Omphacite (X Jd =0.46–0.48)is unzoned.Phengite has 3.30–3.32Si apfu and ∼0.4wt.%TiO 2.Garnets range in size from 0.5to 5mm in diameter,either as porphyroblasts or as coalesced polycrystals,mostly with idioblastic shapes with inclusions of quartz,calcite,apatite and omphacite (Fig.3).Garnet is largely homogeneous (Prp 24–25Alm 49–50Grs 24–25Sps 1.5–1.9),but shows a slightly Mn-enriched core (Fig.3d;Table 2).HREEs in large garnet porphyroblasts,such as Yb and Lu,display weak but continuous decreases in concentration from core to rim (Fig.4a),mimicking the MnO zoning pattern,which could be explained by their high af finity for garnet and likely arises from an overall Rayleigh distillation process during early garnet growth (Hollister,1966;Otamendi et al.,2002).However,the limited variation in MREE concentrations,such as Sm and Nd,in garnet with respect to the weak zoning in HREE (Fig.4a)might be explained by growth in an environment where MREEs are not limited and continuously supplied by the breakdown of other phases.Hafnium has a fairly flat pro file (Table 3),re flecting its incompatible character in garnet and absence of Hf-competing reactions involved in garnet growth.Two distinct domains can be de fined in the large garnet porphyroblasts based on the chemical zoning and the abundance of inclusions.These zones are an inclusion-rich core with richer Mn and HREE and an inclusion-free rim with poorer Mn and HREE (Fig.3d).The inclusion-free rim for individual garnet has a rather similar width of 200–250μm (Fig.3).Although concentrations of Nd (0.22–0.41ppm)and Sm (0.33–0.48ppm)vary within single garnet grains,the Sm/Nd ratios (0.8–2.2)are consistentTable 2Representative major-element data of the garnets,omphacites,phengites,amphiboles and zoisites.(wt.%)Grt Omp RimCore Inclusions-in-zircon Rim Core SiO 238.6838.6438.6638.5338.6538.6637.8637.7555.9356.1256.1356.20TiO 20.050.060.050.050.050.050.050.080.120.110.110.11Al 2O 321.9221.9422.0721.9921.9921.8421.6821.8611.2611.2211.3311.26FeO ⁎22.9823.0523.0623.1623.0523.1124.4224.33 4.25 4.23 4.32 4.27MnO 0.680.720.790.880.750.680.990.930.030.020.030.02MgO 6.37 6.38 6.28 6.31 6.36 6.35 4.23 4.748.158.027.968.13CaO 9.108.949.028.929.038.9910.579.5013.2213.3613.3213.34Na 2O 0.030.030.030.030.030.030.020.01 6.65 6.41 6.39 6.42K 2O 0.000.000.000.000.000.000.000.000.000.000.000.00Total 99.8099.7799.9699.8799.9199.7199.8299.2199.6099.6099.7099.87O.N.12121212121212126666Si 2.986 2.984 2.981 2.975 2.980 2.988 2.958 2.962 1.996 2.010 2.010 2.007Al 1.994 1.997 2.006 2.001 1.999 1.990 1.997 2.0210.4740.4730.4780.474Ti 0.0030.0030.0030.0030.0030.0030.0030.0050.0030.0030.0030.003Fe 2+ 1.486 1.491 1.489 1.499 1.489 1.496 1.596 1.5990.1270.1270.1290.128Mn 0.0440.0470.0520.0580.0490.0440.0660.0620.0010.0010.0010.001Mg 0.7330.7350.7220.7260.7310.7320.4930.5540.4340.4280.4250.433Ca 0.7530.7400.7450.7380.7460.7440.8850.7980.5060.5130.5110.511Na 0.0040.0050.0050.0050.0050.0050.0030.0020.4600.4450.4430.445K0.0000.0000.0000.0000.0000.0000.0000.0000.0000.0000.0000.000Phn Amp Zo RimCore Rim Core Mantle Core SiO 248.8649.0949.3349.0147.0847.0746.7246.7539.0538.9239.0239.02TiO 20.400.410.410.400.220.220.220.220.130.130.130.12Al 2O 329.0328.6829.0129.1912.6612.8112.5812.6228.5528.2128.7328.62FeO ⁎ 1.99 1.99 2.00 1.9711.6011.4811.4611.36 6.01 6.01 6.03 6.07MnO 0.000.000.000.010.100.090.090.090.050.050.060.05MgO 2.79 2.77 2.78 2.8012.2012.4712.4412.300.070.060.070.07CaO 0.010.010.010.019.9710.0910.0710.1024.1023.8624.1324.14Na 2O 0.930.920.920.91 2.79 2.77 2.82 2.830.000.000.000.00K 2O 10.009.919.819.780.480.470.470.470.000.000.000.00Total 94.0293.7894.2894.0997.0997.4996.8896.7697.9697.2498.1698.09O.N.111111112323232312.512.512.512.5Si 3.302 3.323 3.318 3.304 6.831 6.800 6.799 6.809 3.008 3.019 3.000 3.003Al 2.313 2.288 2.300 2.319 2.164 2.182 2.158 2.167 2.592 2.579 2.603 2.596Ti 0.0200.0210.0210.0200.0240.0240.0240.0240.0070.0070.0070.007Fe 2+0.1120.1130.1130.111 1.407 1.387 1.394 1.3830.3870.3900.3880.390Mn 0.0000.0000.0000.0000.0120.0120.0120.0120.0040.0040.0040.004Mg 0.2820.2800.2790.282 2.639 2.686 2.699 2.6700.0070.0070.0070.008Ca 0.0010.0010.0010.001 1.550 1.562 1.570 1.577 1.989 1.983 1.988 1.990Na 0.1220.1210.1200.1190.7840.7770.7950.7980.0000.0000.0000.000K0.8620.8550.8420.8410.0890.0870.0880.0880.0000.0000.0000.000⁎Total iron;concentrations reported as wt.%.331H.Cheng et al./Lithos 110(2009)327–342with those obtained by ID-MC-ICPMS (1.9–2.4)within error (Fig.5a),indicating that the Nd isotopic analyses in this study are essentially unaffected by MREE-rich inclusions,likely due to ef ficient mineral picking and/or concentrated H 2SO 4pre-leaching.The consistent Hf concentrations of 0.10–0.13ppm within single grains with those (0.11–0.13ppm)by ID-MC-ICPMS indicates the Hf-rich phases were essentially removed during digestion (Fig.5b).The overall Lu concentration slightly skews towards the garnet rim because of the weak zoning pattern and the spherical geometry effect,i.e.,the outershells dominate the volume of Lu (Cheng et al.,2008a ).The 0.90–0.93ppm Lu contents by ID-MC-ICPMS apparently resemble those of the garnet rim,which could be readily explained by the spherical geometry effect.However,we interpret this with caution because individual garnet porphyroblasts could have different zoning patterns and the individual Lu pro file might not be representative of the population of garnet grains,although the chemical zoning center (nucleation site)coincides with the geometric center (Fig.3d),suggesting asymmetric garnet growth.In addition,biased mineral hand-picking should be considered (Cheng et al.,2008a,b ).Moreover,since the thin-section preparation method for this study cannot ensure that the real center of the garnet was exposed,the observed zoning here likely only represents a minimum zoning of particular garnet porphyroblasts.4.3.Estimation of P –T conditionsMetamorphic peak P –T conditions of 2.2GPa and 620°C for the DB17Xiongdian eclogite (Fig.6)are evaluated on the basis of recent cali-brations of the assemblage garnet+omphacite+phengite+kyanite+quartz,according to the dataset of Holland and Powell (1998).Higher P –T values of 2.4GPa and 650°C are calculated with the calibrations of Krogh Ravna and Terry (2004).While a temperature of 620±29°C is estimated by quartz –garnet O isotope thermometer (Zheng,1993),Ti-in-zircon thermometer (Watson et al.,2006;Ferry and Watson,2007)gives similar value of 695±22°C.Zr-in-rutile thermometer (Watson et al.,2006;Ferry and Watson,2007)yields a lower value of 634–652°C and a similar temperature of 683–701°C (Fig.6)when using the pressure-dependent calibration of Tomkins et al.(2007)at 2.2GPa.Calibration 1uses updated versions of the thermodynamic dataset and activity models in the programs THERMOCALC3.26and AX (Holland,Powell,1998;latest updated dataset;Powell et al.,1998)by using an avPT calculation in the simpli fied model system NCKFMASH with excess SiO 2and H 2O.Calibration 2uses thermobarometry based on the database of Holland and Powell (1998)and activity models for garnet (Ganguly et al.,1996),clinopyroxene (Holland and Powell,1990)and phengite (Holland and Powell,1998).Analyses of garnet,omphacite and phengite (Table 2)were processed according to the two calibrations.Calibration 3uses mineral O isotope compositions (Table 4)to estimate temperature based on the quartz –garnet O isotope thermometer (Zheng,1993).Calibrations 4and 5use Ti contents in zircon by LA-ICPMS and Zr concentration of rutile by SIMS (Table 5)to temperature estimations based on the Ti-in-zircon and Zr-in-rutile thermometers,respectively (Watson et al.,2006;Ferry and Watson,2007;Tomkins et al.,2007).The assemblage of garnet –omphacite –kyanite –phengite –quartz is representative of metamorphic peak conditions of theXiongdianFig.4.Chondrite-normalized REE patterns (Sun and McDonough,1989)of zircons,garnets and omphacite from Xiongdian eclogite (a)and REE distribution patterns between zircon and garnet (b).The equilibrium D REE(Zrn/Grt)values of Rubatto (2002),Whitehouse and Platt (2003)and Rubatto and Hermann (2007)are presented for comparison.Table 3SIMS Sm,Nd,Hf and Lu concentration pro files of the garnets in Figs.4and 5.(ppm)RimCore Cpx Li 0.93 1.140.880.840.890.980.750.520.990.580.690.870.670.7522.1Sr 0.100.130.120.120.100.100.100.120.110.120.130.100.110.1033.5Y 45.646.846.647.346.447.148.350.052.053.553.155.354.657.80.92Hf 0.110.130.120.120.110.110.120.120.120.100.110.100.100.100.41La 0.010.020.020.010.000.000.010.010.010.010.010.010.020.010.02Ce 0.040.050.050.060.050.040.040.040.050.030.040.040.050.030.12Pr 0.010.020.030.020.020.020.020.020.020.020.030.020.020.020.03Nd 0.390.330.280.380.350.270.220.280.340.310.270.410.280.260.36Sm 0.450.360.380.440.470.410.480.450.450.410.340.330.420.410.31Eu 0.270.270.270.280.300.240.280.280.250.300.290.240.250.220.22Gd 1.85 1.96 1.75 1.80 1.85 1.78 1.85 1.84 1.93 1.82 1.57 1.92 1.69 1.530.65Dy 5.68 5.86 5.58 6.18 5.87 5.84 5.79 6.19 6.46 6.40 5.50 6.91 6.09 6.400.26Er 3.74 4.13 4.04 4.25 4.23 4.16 3.76 4.15 4.65 4.99 4.53 4.98 4.63 5.200.06Yb 4.10 4.18 4.01 3.86 4.23 4.11 4.49 4.34 4.97 5.19 5.19 5.65 5.10 5.690.12Lu0.900.910.880.840.840.891.131.151.281.261.261.331.321.420.01332H.Cheng et al./Lithos 110(2009)327–342eclogite.A partly-calibrated thermobarometer is de fined by the three reactions of 3Celadonite +1Pyrope +2Grossular =3Muscovite +6Diopside,2Kyanite+3Diopside =1Pyrope +1Grossular +2Quartz,and 3Celadonite +4Kyanite=3Muscovite +1Pyrope +4Quartz.An intersection point of 2.2GPa and 620°C is de fined and therefore independent of commonly-used Fe –Mg exchange thermometers.This offers an advantage with regards to garnet –clinopyroxene,which is prone to retrograde reactions and problems stemming from ferric iron estimation of omphacite (Li et al.,2005).Results are plotted according to the calibrations mentioned above.The three reactions and intersection points are shown according to programs of calibrations 1–5in Fig.6.4.4.Oxygen isotopic dataThe O isotope compositions of minerals for the two eclogites are presented in Table 4.When paired with quartz for isotope geothermo-metry,garnet,omphacite,phengite,kyanite,zoisite and amphibole yield temperatures of 620±29,563±35,567±43,508±31,404±28and 685±39°C for eclogite DB17,respectively.Because these temperatures are concordant with rates of O diffusion and thus closure temperatures in the mineral assemblage garnet +omphacite +kyanite+phengite+quartz (Zheng and Fu,1998),representative of metamorphic peak conditions,a continuous resetting of O isotopes in the different mineral-pair systems is evident during cooling (Giletti,1986;Eiler et al.,1993;Chen et al.,2007).Quartz –garnet pairs from eclogite DB17give temperatures of 620±29°C,which are consistent with those calibrated by the THERMOCALCmethod,indicating that O isotope equilibrium was achieved and preserved during eclogite –facies recrystallization (Fig.7a).This is also evidenced by the apparent equilibrium fractionation between garnet and omphacite (Fig.7b).In contrast,equilibrium fractionation was not attained between garnets and omphacites in eclogite DB18.The calculated quartz –amphibole pair temperature of 685±39°C is distinctly higher than the 508±31°C from the quartz –zoisite pair.Because oxygen diffusion in amphibole is faster than in zoisite and kyanite (Zheng and Fu,1998),amphibole exchanges oxygen isotopes with water faster than zoisite during retrogression.Consequently,the O isotope temperature increases for the quartz –amphibole pair,whereas the quartz –zoisite temperature decreases relative to the formation temperature.In this regard,the retrograde metamorphism of amphibolite –facies should take place at a temperature between ∼685and ∼508°C.On the other hand,the low quartz –kyanite pair temperature (404±28°C)could be interpreted as a result of in fluence by retrogressive metamorphism without a clear geologicalmeaning.Fig.5.Sm/Nd versus Nd and Lu/Hf versus Hf plots for garnet and whole rock.ID:data obtained by the isotope dilution method using MC-ICPMS.IMS:data obtained by ion microprobe.bombWR —whole rock by bomb-digestion,savWR —whole rock by Savillex-digestion.Error bars for both IMS and ID methods are signi ficantly smaller than thesymbols.Fig.6.Peak P –T estimates of the Xiongdian eclogite.Reactions of py +2gr +3cel =6di +3mu;3di+2ky =py+gr +2q;and 3cel +4ky =py +3mu +4q and intersection points are plotted according to the calibrations of Holland and Powell (1998,latest updated dataset)in solid lines and Krogh Ravna and Terry (2004)in dashed lines.Coesite quartz equilibrium is also shown (Holland and Powell,1998).Abbreviations:alm —almandine,gr —grossular,py —pyrope,cel —celadonite,mu —muscovite,di —diopside,jd —jadeite,coe —coesite.Temperatures estimated by quartz –garnet oxygen isotope thermometry (Zheng,1993),Ti-in-zircon and Zr-in-rutile thermometries (Watson et al.,2006;Tomkins et al.,2007)are also shown.Table 4Oxygen isotope data of minerals for the Xiongdian eclogite.Sample number Mineral δ18O (‰)Pair Δ18O (‰)T 1(°C)T 2(°C)DB17Quartz 12.86,12.66Phengite 10.26,10.14Qtz –Phn 2.57567±43Garnet 8.83,8.85Qtz –Grt 3.93620±29605±22Omphacite 9.64,9.56Qtz –Omp 3.17563±35574±28Zoisite 9.31,9.43Qtz –Zo 3.40508±31494±21Amphibole 9.83,9.60Qtz –Amp 3.06685±39Kyanite 9.36,–Qtz –Ky3.41404±28WR 9.85,9.91DB18Garnet 9.74,9.59Omphacite 8.58,8.48Omp –Grt −1.14WR10.15,9.99T 1and T 2were calculated based on the theoretical calibrations of Zheng (1993)and Matthews (1994),respectively,with omphacite (Jd 45Di 55).Uncertainty on the temperature is derived from error propagation of the average reproducibility of ±15‰for δ18O (‰)values in the fractionation equations.333H.Cheng et al./Lithos 110(2009)327–342。
PhysRevD.80.073006

I. INTRODUCTION The fact that three active neutrinos possess nondegenerate but tiny masses is a striking signature of new physics beyond the standard model [1]. Perhaps the most popular approach towards understanding the small neutrino mass scale ( < 1 eV) is the seesaw mechanism [2], which contains three right-handed neutrinos and retains SUð2ÞL Â Uð1ÞY gauge symmetry. Although this mechanism can naturally work at a superhigh-energy scale ( $ 1014 GeV) to generate tiny Majorana neutrino masses, it loses direct testability on the experimental side and causes a hierarchy problem on the theoretical side [3]. A straightforward way out is to lower the seesaw scale down to the TeV scale, an energy frontier to soon be explored by the LHC. But such a TeV-scale seesaw scenario inevitably suffers from a terrible fine-tuning of cancellations between the Yukawa coupling texture and the heavy Majorana mass matrix [4]. To resolve this unnaturalness problem built in the canonical (type-I) seesaw mechanism at low energies, there has been some new interest in a relatively old idea— the inverse seesaw mechanism [5]. The inverse seesaw mechanism, which can be regarded as the simplest multiple seesaw picture [6], is an extension of the canonical seesaw mechanism by introducing three additional gauge-singlet neutrinos together with one gauge-singlet scalar. Its typical result for the effective mass matrix of three active neutrinos is M ¼ T À1 T Þ M ðMR ÞÀ1 MD in the leading-order approximaMD ðMR tion, where the scales of three mass matrices may naturally satisfy MR ) MD ) M . The smallness of M can be attributed to both the smallness of M and the smallness of MD =MR at the TeV scale [i.e., MR $ Oð1Þ TeV]. It is
Radioss_general_002a

25 HWU 50 HWU 100 HWU
- 4 cores - 32 cores - 128 + cores
( 76 HWU at MNAL) ( 630 HWU at MESL )
Linear
Statics, Dynamics, Buckling, Thermal, Plasticity, Quasi-static, Contact
2008 EuroNcap ratings: TOP 5
Super Mini Car Category · Nº 1 : FORD Fiesta Nº 2 : Citroen C4 Large Family Car Category · · Nº 1 : Honda Accord Nº 1 : Citroen C6 Small Family Car Category
Crashworthiness Simulation with RADIOSS
Ραδιος [radios] : ancient Greek for easy (to use) Superior results Quality for “5-star worthy” crash simulation Unique multi-core Scalability for faster solution times Unmatched Repeatability for always accurate analysis
Copyright © 2009 Altair Engineering, Inc. Proprietary and Confidential. All rights reserved.
Shanghai 21-25 November 2011
Measurement_of_the_corrosion_rate_of_magnesium_alloys_using_Tafel_extrapolation
Measurement of the corrosion rate of magnesium alloys using Tafel extrapolationZhiming Shi,Ming Liu,Andrej Atrens *The University of Queensland,Division of Materials,Brisbane,Qld 4072,Australiaa r t i c l e i n f o Article history:Received 13July 2009Accepted 9October 2009Available online 6November 2009Keywords:A.Magnesium corrosionB.Weight lossB.Tafel extrapolation B.Hydrogen evolutiona b s t r a c tThe hypothesis that the corrosion of Mg alloys can be adequately estimated using Tafel extrapolation of the polarisation curve is termed herein the electrochemical measurement hypothesis for Mg.In principle,such a hypothesis can be disproved by a single valid counter example.The critical review of Mg corrosion by Song and Atrens in 2003indicated that,for Mg alloys,Tafel extrapolation had not estimated the cor-rosion rate reliably.This paper examines the recent literature to further examine the electrochemical measurement hypothesis for Mg.The literature shows that,for Mg alloys,corrosion rates evaluated by Tafel extrapolation from polarisation curves have not agreed with corrosion rates evaluated from weight loss and hydrogen evolution.Typical deviations have been $50–90%.These were much larger than the precision of the measurement methods and indicate a need for careful examination of the use of Tafel extrapolation for Mg.For research that nevertheless does intend to use Tafel extrapolation to elucidate corrosion of Mg associated with service,it is strongly recommended that these measurements be com-plemented by the use of at least two of the three other simple measurement methods:(i)weight loss rate,(ii)hydrogen evolution rate,and (iii)rate of Mg 2+leaving the metal surface.There is much better insight for little additional effort.Ó2009Elsevier Ltd.All rights reserved.1.IntroductionMagnesium (Mg)alloys are used in transport applications,such as in auto construction,because of their low density,adequate strength–weight ratio and excellent castability.However,an issue is their corrosion properties [1–5].As a consequence,there is much current research to understand Mg corrosion for such ser-vice applications.Some of this research relies on the measurement of the corrosion rate using Tafel extrapolation from polarisation curves.Such research relies on what is herein termed the electro-chemical measurement hypothesis for Mg,namely,that the corro-sion rate of Mg alloys can be adequately estimated using Tafel extrapolation of the polarisation curve.In principle,such a hypoth-esis can be disproved by a single valid counter example.The critical review of Mg corrosion by Song and Atrens [2]indicated that,for Mg alloys,Tafel extrapolation had not estimated the corrosion rate reliably.The scope of this paper is to examine the recent literature to further examine the electrochemical measure-ment hypothesis for Mg.A subsidiary aim is to facilitate research directed at Mg alloy development and at understanding corrosion of Mg in service applications to ensure such research is as effective as possible.2.Corrosion rate measurementThe simplest and most fundamental measurement of the corro-sion rate is the metal weight loss rate,D W (mg/cm 2/d).This can be converted to an average corrosion rate (mm/y)using [6–9]P W ¼3:65D W =qð1Þwhere q is the metal density (g/cm 3).For Mg alloys,q is 1.74g/cm 3,and Eq.(1)becomes:P W ¼2:10D W ð2ÞIn the overall corrosion reaction of pure Mg,one molecule of hydro-gen is evolved for each atom of corroded Mg.One mol (i.e.24.31g)of Mg metal corrodes for each mol (i.e.22.4L)of hydrogen gas pro-duced.Therefore,the hydrogen evolution rate,V H (ml/cm 2/d),is re-lated to the metallic weight loss rate,D W m (mg/cm 2/d),using [2,10–14]D W ¼1:085V H ð3ÞThe corresponding corrosion rate,P H ,is evaluated by substituting Eq.(3)into Eq.(2)to giveP H ¼2:279V Hð4ÞFor Mg corrosion,there is excellent agreement [2,10,13,15]between the corrosion rate measured by the weight loss rate and that eval-uated from the hydrogenevolution rate.Fig.1presents a cross plot0010-938X/$-see front matter Ó2009Elsevier Ltd.All rights reserved.doi:10.1016/j.corsci.2009.10.016*Corresponding author.Address:The University of Queensland,Division of Materials,St.Lucia,Brisbane,Qld 4072,Australia.Tel.:+61733653748;fax:+61733653888.E-mail address:andrejs.atrens@.au (A.Atrens).Corrosion Science 52(2010)579–588Contents lists available at ScienceDirectCorrosion Sciencej o ur na l h om e pa ge :w w w.e lse v ie r.c om /lo c at e /c or s c iof the independent measurements of the weight loss rate and the hydrogen evolution rate,for48h and96h immersion tests of castAZ91in1M NaCl solution[13].The line,in Fig.1,is a goodfit through the data.However,the line is not drawn as a line of best fit through the data.The line is actually the plot of the theoretical expectation of Eq.(3).This data shows that the corrosion rate eval-uated from weight loss agrees within an error of$±10%with the corrosion rate independently measured from hydrogen evolution, as also indicated by the review of Song and Atrens[2].In the Tafel extrapolation method for measuring the Mg corro-sion rate,the corrosion current density,i corr(mA/cm2)is estimated by Tafel extrapolation of the cathodic branch of the polarisation curve,and i corr is related to the average corrosion rate using [6–9,11,14]P i¼22:85i corrð5ÞReasons were given by Song and Atrens[2]why this electrochemi-cal technique might not give reliable values for Mg corrosion.Nev-ertheless the electrochemical technique of Tafel extrapolation is widely used for the evaluation of the corrosion of Mg alloys,at least partly,because it is a quick and easy technique.Therefore it is use-ful to review the literature on this technique for Mg alloys.It is useful to have quantitative measures of the quality of the corrosion rate evaluated by the Tafel extrapolation.One measure is to evaluate the relative deviation between the measured corro-sion rate and a standard corrosion rate.The corrosion rate evalu-ated from weight loss,P W,and the corrosion rate,P H,evaluated from the hydrogen evolution data,can each be used as a standard against which to compare the corrosion rate evaluated by Tafel extrapolation.Experimentally it has been shown that there is good agreement between measurements of P W and P H.The relative devi-ation for the corrosion rate determined from Tafel extrapolation was evaluated usinge i¼P iÀP WðÞ=P WðÞj jÂ100ð6Þore i¼P iÀP HðÞ=P HðÞj jÂ100ð7ÞAn alternative measure of quality is the ratio P W/P i.This ratio would be equal to unity if P i were a good estimate of P W.Mg corrosion has a strange phenomenon that anodic polarisation increases both the amount of Mg2+ions produced AND the amount of hydrogen evolved[1–3].This is summarised in the Section5.The most likely explanation is that part of the corrosion reaction is chemical rather than electrochemical.The consequence is that the ratio P W/P i would be expected to have a value between1and2,if P W is a good measure of the rate of the total corrosion reaction and if P i were a good measure of the rate of the electrochemical part of the total corrosion reaction.3.Corrosion rate measurements from Tafel extrapolation3.1.Pure Mg,AZ91and ZE41in1M NaClTable1[15]relates to the corrosion of pure Mg,AZ91and ZE41 in1M NaCl.All three alloys were as cast and all were high purity in that the concentration of the impurity was lower than the impurity tolerance limits[16].AZ91and ZE41are both two-phase alloys;in each case,the second phase was not continuous so there was no tendency for the second phase to provide a barrier effect [2,13,17].Samples were encapsulated in resin and only one surface was exposed to the solution.This approach facilitated the exami-nation of the corrosion morphology.The specimen surface was mechanically ground to1200grit on SiC paper,washed with dis-tilled water and dried.The hydrogen evolution was measured overa period of48h using duplicate specimens exposed horizontally to1.5L of1M NaCl.For ZE41the corrosion initiated as localized cor-rosion at some sites on the surface and subsequently expanded over the whole surface.The hydrogen evolution,after an initiation time of several hours,increased linearly with exposure time.The advance of the corrosion over the surface of AZ91was slower, although the corrosion also initiated as localized corrosion;there was corrosion on only part of the surface at the end of the48h per-iod.The hydrogen evolution,after an initiation time of several hours,increased with exposure time;the hydrogen evolution rate increased slightly with time.Nevertheless,the hydrogen evolution volume for AZ91was significantly lower than for ZE41.The corro-sion of the pure Mg was uniform over a macroscale in that there were no preferential sites for corrosion.At the end of the48h exposure,the corrosion was essentially uniform over the whole exposed surface area.The hydrogen evolution,after an initiation time of several hours,increased linearly with exposure time.The hydrogen evolution volume for pure Mg was significantly lower than for the two alloys,consistent with the general observation that the lowest corrosion rate is produced by pure Mg[1,2]and that the higher corrosion rates of the two alloys was in each case due to micro-galvanic acceleration of the corrosion by the second phase.The average hydrogen evolution rate over the exposure period is reported in Table1[15].At the end of the exposure per-iod,the corrosion products were removed by the standard cleaning solution,and the weight loss evaluated.The weight loss rate is also contained in Table1.There was good agreement between the corrosion rate evaluated from the hydrogen evolution rate and that evaluated from the weight loss rate,as expected from Fig.1and from the review of Song and Atrens[2].The polarisation curves were measured in a standard three-electrode glass cell with a standard scan rate of0.2mV/s.The reference electrode was a saturated calomel electrode(SCE).The specimen configuration was the same as that used in the immer-sion experiments,which measured the hydrogen evolution and the weight loss.Duplicate polarisation curves were essentially identical.In each case the cathodic branch provided an extensive linear Tafel region,the evaluated i corr value is included in Table1 as is the corresponding corrosion rate.The corrosion rate values derived from Tafel extrapolation were quite different to those derived from the hydrogen evolution rate and from the weight loss data.The lower derived corrosion rates for ZE41and AZ91might be attributed to the incubation of corrosion as shown by the lower hydrogen evolution rates at the beginning of the immersion tests.Fig. 1.Cross plot of the independent measurements of weight loss rate andhydrogen evolution rate,for48h and96h immersion tests of cast AZ91in1M NaClsolution.The line is a plot of the theoretical expectation;it is not simply a linethrough the experimental data points.580Z.Shi et al./Corrosion Science52(2010)579–588The corrosion rate for pure Mg from the Tafel extrapolation was about three times that measured by weight loss or hydrogen evolution.This might be associated with the transformation of an air formedfilm to the steady statefilm for Mg exposed to water [18].However,the hydrogen evolution data did not show any analogous feature,the hydrogen evolution was low and,as far as could be discerned,the hydrogen evolution was linear with time.The data of Table1relates to the corrosion rate,P W and P H,mea-sured over48h and P i measured soon after specimen immersion in the solution.For all three Mg alloys,there was a large relative deviation for the corrosion rate determined from Tafel extrapola-tion compared with the weight loss rate.The relative deviation for the corrosion rate determined from Tafel extrapolation was calculated using Eq.(6).This large relative deviation is in agree-ment with the observations of the review of Song and Atrens[2].3.2.Heat Treated Mg–10Gd–3Y–0.4Zr in5%NaClTable2relates to the study of Peng et al.[19];they studied the corrosion of Mg alloy Mg–10Gd–3Y–0.4Zr,in the as cast(F),solu-tion treated(T4)and aged(T6)conditions,in5%NaCl solution, by immersion tests and potentiodynamic polarisation curves.The corrosion rate was measured using three or four replicate speci-mens,for each microstructure condition,immersed for3days at 25±2°C in5wt.%NaCl aqueous solution,prepared with AR grade NaCl and distilled water.Each specimen was polished successively on320grit waterproof abrasive paper and three grit metallo-graphic paper,washed with distilled water,dried in warmflowing air and weighed to determine the original weight.During thefirst few hours of immersion,the solution pH increased from neutral to pH$11due to the precipitation of Mg(OH)2because of its low solubility.Thereafter the pH remained constant at$11.Because the time of the initial increase in pH was short(a few hours)com-pared with the test duration(3days)the corrosion rates measured were essentially the same as measured in a solution saturated with Mg(OH)2.After the immersion test,each specimen was washed with distilled water and dried.One sample was used for the corro-sion product analysis.The other samples were used to determine the corrosion rate by means of the metal weight loss.The corrosion products were removed by sample immersion in a solution of 200g LÀ1CrO3+10g LÀ1AgNO3at ambient temperature for 7min.Separate experiments demonstrated that this treatment re-moves all the corrosion products without removing any Mg metal. Each specimen was then washed with distilled water,dried in the warmflowing air and weighed to determine the weight after cor-rosion.The corrosion rate,P W(mm/y),is presented in Table2[19].Potentiodynamic polarisation curves were measured with metallographic polished specimens in5%NaCl saturated with Mg(OH)2that gave a stable pH of$11,using a three-electrode elec-trochemical cell and a scanning rate of1mV sÀ1.After immersion for1h,the polarisation was started from a potential ofÀ250mV SCE (cathodic)relative to the open circuit potential and was stopped at an anodic potential where the anodic current increased dramati-cally.At least two tests were conducted for each microstructure condition;these confirmed the reproducibility of the polarisation curves.The polarisation curves were used to evaluate the corrosion density,i corr,by Tafel extrapolation of the cathodic branch to the corrosion potential,E corr.The corresponding corrosion rate,P i,is included in Table2.Table2presents i corr,P i,E corr and b c values for GWK103in the as cast(F),solution treated(T4)and aged(T6)conditions,evaluated from polarisation curves measured in5%NaCl saturated with Mg(OH)2.Also listed for comparison are P W,P W/P i,and the relative deviation calculated using Eq.(6).The cathodic Tafel slope,b c,was similar for all conditions,indicating similar electrochemical reac-tions for hydrogen evolution;however,the values did have signif-icant variation larger than experimental scatter,which could indicate that there was more than one hydrogen evolution reac-tion.The values of i corr,and the corresponding corrosion rate,P i, for the different microstructure conditions correlated with the corrosion rates measured from weight loss,P W,but did not agree in magnitude.Moreover the ratio P W/P i was not constant,and the relative deviations were large,indicating that the electrochemical method based on Tafel extrapolation of the cathodic polarisation curve did not provide a good measurement of the corrosion rate, in agreement with Song and Atrens[2].The data of Table2relates to the corrosion rate,P W,measured over3days and P i measured soon after specimen immersion(1h)in the solution.3.3.AZ91in3.5%NaClTable3relates to the study by Candan et al.[20]of the corrosion of AZ91alloys,containing0–1wt%Pb,in3.5%NaCl.The corrosion rate was measured by weight loss for72h immersion in3.5%NaCl, P W,and the corrosion rate,P i,evaluated by Tafel extrapolation from polarisation curves measured with a scan rate of1mV SCE/s after 1h immersion in3.5%NaCl.Specimens were polished to1l m diamond,washed with alcohol and washed with distilled water. There were large differences between the two measures of corro-sion rate.The values of the corrosion rate measured by weight loss,P W, given in Table3,are larger than expect for AZ91in3.5%NaCl asTable2i corr,P i,E corr and b c values for GWK103(Mg–10Gd–3Y–0.4Zr)in the F,T4and T6 conditions,evaluated from polarisation curves measured in5%NaCl saturated with Mg(OH)2after solution equilibration for1h.Also presented are values for P W,P W/P i and e i.P W is the corrosion rate measured from the weight loss for immersion in5% NaCl solution for3days.e i was evaluated using Eq.(6).Material i corr(l A cmÀ2)P i(mm/y)E corr(V SCE)b c(V SCE)P W(mm/y)P W/P ie i(%)GWK103–F50 1.1À1.6700.230 3.0 2.763 GWK103–T4240.54À1.7100.1700.390.7138 GWK103–T6–16h310.71À1.6900.200 2.0 2.865GWK103–T6–500h 300.67À1.6800.190 1.7 2.661Table3Corrosion rates(mm/y)for AZ91base alloys containing0–1%Pb,measured by weightloss,P W,for72h immersion in3.5%NaCl;and P i,evaluated by Tafel extrapolationfrom polarisation curves measured after1h immersion in3.5%NaCl.Alloy P W P i P W/P iAZ91160 3.545AZ91+0.2%Pb110 2.055AZ91+0.5%Pb900.20450AZ91+1.0%Pb800.071140Table1Measurements related to corrosion rate in1M NaCl at room temperature.Hydrogen evolution rate,V H,and weight loss rate,D W,was measured using48h immersion. Tafel extrapolation evaluated i corr from polarisation curves measured using as-polished specimens soon after solution immersion.Also given is the relative deviation for the corrosion rate determined from Tafel extrapolation,e i,compared with the weight loss rate,calculated using Eq.(6).Alloy V H(ml/cm2/d)P H(mm/y)D W(mg/cm2/d)P W(mm/y)i corr(mA/cm2)P i(mm/y)e i(%)P W/P iZE41 5.914 5.7120.09 2.183 5.7 AZ91D 3.17.1 3.0 6.20.040.9185 6.8PureMg 0.44 1.00.430.900.12 2.72000.33Z.Shi et al./Corrosion Science52(2010)579–588581is evident by a comparison of the data of Table 3and those in Tables 1,4and 8.However,the higher values of corrosion rate are plausible because a small amount of Fe (above the tolerance limit)would cause these higher corrosion rates and such Fe contents could easily arise in their alloy production using raw material ingots from a commercial company.It is plausible that the corrosion rate mea-sured over 72h in the immersion tests becomes manifest during the 72h of the test,whereas a significantly lower corrosion rate was present during the first hour of immersion and measured by the corrosion rate,P i ,evaluated by Tafel extrapolation.Table 4relates to the study of Zhou et al.[21]of the corrosion of AZ91alloys,containing Ca,Sb and Bi Pb,in 3.5%NaCl.The corro-sion rate,P W ,was measured by weight loss for 6days immersion in 3.5%NaCl;and the corrosion rate,P i ,evaluated by Tafel extrap-olation from polarisation curves measured with a scan rate of 1mV SCE /s in 3.5%NaCl.Specimens were polished to 6l m diamond,washed with acetone and washed with distilled water.There were large differences between the two measures of corrosion rate.The relative deviations ranged from 30%to 97%.3.4.AZ91in 0.1M NaClTable 5presents corrosion rates [22,23]for AZ91in 0.1M NaCl measured using weight loss for 100h solution immersion in 0.1M NaCl,P W (mm/y);and corrosion rates,P i -10h ,P i -30h and P i -100h ,cal-culated using Eq.(5)in the present work from the values presented in [22,23]of i corr-10h ,i corr-30h and i corr-100h ,estimated in [22,23]by Tafel extrapolation,from polarisation curves measured after solu-tion exposure of 10h,30h and 100h.The authors indicated that ‘‘there appears to be a direct correlation between the weight loss data and the data collected using electrochemical techniques”,although they did not report the actual numerical values of the cor-rosion rates associated with their electrochemical measurements in their papers [22,23].The samples were ground to 1200grit,cleaned,weighted and introduced into the solution.Potentiody-namic polarisation curves were measured at a relatively rapid scan rate of 4mV SHE /s.The agreement between P W and P i -10h ,P i -30h and P i -100h was not good.This is further explored in Table 6,which pre-sents the ratios P W /P i -10h ,P W /P i -30h and P W /P i -100h ;these ratios should be equal to unity for good agreement.There was not good agreement.The experimental description for the weight loss determination [22,23]indicates that there might have been some corrosion prod-ucts on the specimen surface.That might explain the low reported corrosion rates from weight loss,P W .The values for P W for as cast AZ91in Table 5are significantly lower than the values of P W or P H in Tables 1,3and 8and for P W for comparable alloys in Table 4.The authors [22,23]attributed the low corrosion rates,P W ,to the fact that the tests were carried out in a relatively mild solution.The authors recognized that the corrosion rates measured by Tafel extrapolation were typically much greater than the corrosion rates measured by weight loss,P W .They [22,23]attributed the difference between the two techniques to the fact that the corrosion was local-ized.This issue is dealt with in Section 5.2of the discussion.3.5.Secondary AZ91alloysScharfe et al.[24]carried out a large number of corrosion tests on AZ91base alloys with the addition of extra alloying.For the al-loy designated as ‘‘25”(consisting of AZ91+0.5%Cu),they carried out electrochemical tests and hydrogen evolution measurements under nearly similar conditions so that a comparison is possible.Samples were ground to 1200grit and cleaned with ethanol.Polar-isation curves were measured 0.5h after immersion in 5%NaCl,with starting pH 11.The corrosion rate,calculated from the polar-isation curve was reported as 2.19mm/y [24].The corrosion rate was evaluated to be 5.28mm/y from hydrogen evolution data for this alloy in a nearly similar solution (3.5%NaCl,pH 10)between 70and 90h [24].They attributed the difference in corrosion rate to the possibility that the polarisation curve gave a measurement related to the early stages of corrosion whereas the hydrogen evo-lution data related to long-term steady state corrosion.3.6.Mg–6Zn–Mn–(0.5–2)Si–(0–0.2)CaFig.2relates to the study by Lisitsyn et al.[25]on the corrosion of Mg–6Zn–Mn–(0.5–2)Si–(0–0.2)Ca alloys in 3.5%NaCl saturated with Mg(OH)2.The immersion tests were carried out for 72h and the weight loss was converted to a corrosion rate,P W .Also mea-sured was the corrosion rate from polarisation curves at 1h and 4h (labelled as PD test t =1,and PD test 4h).There was some agreement between P W and the corrosion rate measured from the polarisation curves at 4h (PD test 4h)for some alloys,but poor agreement for the other cases.In general,the corrosion rate mea-sured from the immersion tests,P W gave lower values which may be due to the film tendencies of this testing solution.Table 4Corrosion rates (mm/y)for AZ91base alloys,measured by weight loss,P W ,for 6days immersion in 3.5%NaCl;and P i ,evaluated by Tafel extrapolation from polarisation curves measured in 3.5%NaCl.e i was evaluated using Eq.(6).AlloyP W i corr (mA/cm 2)P i e i (%)P W /P i Mg–9Al–0.6Zn–0.2Mn8.60.0110.259734Mg–9Al–0.8Zn–0.2Mn–0.14Ca 8.80.271 6.230 1.4Mg–9Al–0.8Zn–0.2Mn–0.4Sb 19.90.207 4.776 4.2Mg–9Al–0.8Zn–0.2Mn–0.4Sb–1Bi38.00.76217.4552.1Table 5Corrosion rates (mm/y)for AZ91in 0.1M NaCl measured by weight loss over 100h solution immersion,P W ,and,P i -10h ,P i -30h and P i -100h ,evaluated using Eq.(5)from i corr-10h ,i corr-30h and i corr-100h ,estimated by Tafel extrapolation,from polarisation curves measured after solution exposure of 10h,30h and 100h.Alloy100h 10h30h100hP W (mm/y)i corr-10h (mA/cm 2)P i -10h (mm/y)i corr-30h (mA/cm 2)P i -30h (mm/y)i corr-100h (mA/cm 2)P i -100h (mm/y)As cast 0.350.73170.9321 1.0424T40.290.15 3.40.44100.9021T6–10h 0.310.48110.6415 1.0624T6–16h 0.440.08 1.80.8419 2.2351T6–19h0.620.173.90.77184.43101Table 6Ratios P W /P i -10h ,P W /P i -30h and P W /P i -100h from the data of Table 5.Alloy P W /P i -10h P W /P i -30h P W /P i -100h As cast 0.0210.0170.015T40.850.0290.014T6–10h 0.0280.0210.013T6–16h 0.240.0230.0086T6–19h0.160.0340.0061582Z.Shi et al./Corrosion Science 52(2010)579–5883.7.ZE41in 0–1M NaCl,pH 3–11Table 7relates to the work of Zhao etal.[12];they used the same ZE41and the same procedures as in the research summarised in Section 3.1[15].The hydrogen evolution volume was measured as a function of immersion time,for ZE41immersed in 0M,0.1M and 1M NaCl solutions with pH 3,7and 11.The solutions desig-nated as 0M NaCl consisted of distilled water plus zero added NaCl,adjusted to the desired pH value with HCl and NaOH.The evolved hydrogen volume was essentially zero for the 48h immer-sion in 0M NaCl solutions with pH 7and pH 11,which indicated that there was a low corrosion rate for ZE41in neutral or alkaline solutions without chloride ions.For all other solutions,after an incubation period during which there was a low hydrogen evolu-tion rate,there was an increase in hydrogen evolution volume with increasing immersion time.The incubation period and rate of hydrogen evolution depended on the solution.The incubation per-iod decreased and the hydrogen evolution rate increased with increasing chloride ion concentration at each pH and with decreas-ing pH for each chloride ion concentration.The average corrosion rate,P H (mm/y),evaluated over 48h from the average hydrogen evolution rate for cast ZE41immersed in the various NaCl solutions is presented in Table 7.Potentiodynamic polarisation curves were measured for freshly prepared ZE41samples immediately after immersion in 0M,0.1M and 1M NaCl solutions with pH 3,7and 11.The polarisation curves were used to estimate the corrosion current density ,i corr ,at E corr ,by Tafel extrapolation of the cathodic branch and the cor-responding corrosion rates,P io (mm/y),are presented in Table 7.A comparison of these values from Tafel extrapolation with those calculated from the hydrogen evolution data indicated that (i)the corrosion rates were much higher when estimated from the hydrogen evolution rate and (ii)the corrosion rate estimated from the Tafel extrapolation showed the same trends in influence of pH and chloride ion concentration.The reason for the difference may be that different types of corrosion were measured.The corrosion rate from the Tafel extrapolation may relate to the onset of corro-sion,whereas the corrosion rate from the hydrogen evolution mea-surements relates to corrosion averaged over a considerable time period and includes corrosion some considerable time after corro-sion onset,when the corrosion is well established.Polarisation curves were also measured after 48h immersion in some of the solutions.There were large differences compared with the curves measured immediately after solution immersion for each solution.Tafel extrapolation was used to evaluate i corr and the corresponding corrosion rates have been designated,P i-ss ,to indicate that steady state corrosion conditions had been estab-lished.The corrosion rate,P i-ss ,was always greater than the corro-sion rate,P io ,but the difference was small for the 0.1M NaCl solutions whereas the difference was larger in the 1M NaCl solu-tion.The trends for the corrosion rate,P i-ss (related to pH and chlo-ride concentration)were similar to those for the corrosion rate,P H ;but any similarity of the numerical value of P i-ss and P H appears fortuitous.Table 7showed that the corrosion rate determined from the current at the free corrosion potential,did not agree with direct measurements evaluated from the evolved hydrogen.Of most con-cern may be that there did not appear to be any relation between P i-ss and P H .Any similarity of the numerical value of P i-ss and P H ap-pears fortuitous;the ratio P H /P i-ss varied seemingly randomly be-tween 5.0and 1.2.In most cases the relative deviation was large.3.8.Mg alloys in 1M NaClTable 8relates to the work of Zhao et al.[14].The corrosion rates of common Mg alloys (pure Mg,AZ31,AZ91,AM30,AM60,ZE41)immersed in 3wt.%NaCl for 12days were evaluated by mea-suring the hydrogen evolution.The corrosion rate was also esti-mated using Tafel extrapolation of the cathodic branch of the polarisation curve measured soon after specimen immersion in the solution,after 1day and after 7days immersion in the solution.The pure Mg,AZ91,AM60and ZE41were from cast ingot whereas AZ31and AM30were from extrusions.These alloys were high pur-ity and so were suitable for the study of the influences on corrosion other than the effect of the impurity elements.The hydrogen evolution was measured for two samples each of each Mg alloy immersed in 3%NaCl.For pure Mg and the Mg alloys (with the exception of AZ31),there was initially an incubation per-iod during which there was a small rate of hydrogen evolution.The incubation period was quiet long for pure Mg,there was essentially no incubation period for ZE41.Thereafter there was an increase in hydrogen evolution with increasing immersion time.For most al-loys,the rate of hydrogen evolution initially increased with increasing exposure time,which is attributed to corrosion occur-ring over increasing fractions of the surface as was observed in our prior work [12,15].Nevertheless,it should also be noted that the increase in hydrogen evolution could also be associated with the increased actual surface area;the actual surface area of a corroded surface is larger than the original surface area due to anTable 7The corrosion rate (mm/y),P i-ss (estimated from i corr from polarisation curves measured for ZE41after reaching steady state corrosion conditions,i.e.after 48h immersion)compared with the corrosion rate,P io (estimated from i corr measured from polarisation curves for freshly prepared cast ZE41)and the corrosion rate,P H (evaluated over 48h from the average hydrogen evolution rate)for cast ZE41immersed in various NaCl solutions.The units for the corrosion rate were mm/y.(The relative deviation,calculated using Eq.(7)is given in the brackets in each case,%.)NM indicates not measured.pH0.1M NaCl 1M NaCl P HP ioP i-ss P H P ioP i-ss39.7 3.7(62%) 4.5(54%)20 5.0(75%)17.0(4%)7 2.30.63(73%)NM14 1.6(89%) 3.2(77%)111.50.22(85%)0.3(80%)8.00.6(93%)NMFig.2.Corrosion rate data from the study by Lisitsyn et al.[25]on the corrosion of Mg–6Zn–Mn–(0.5–2)Si–(0–0.2)Ca alloys in 3.5%NaCl saturated with Mg(OH)2.The immersion tests were carried out for 72h and the weight loss was converted to a penetration rate,P W .Also measured was the corrosion rate from polarisation curves at 1h and 4h (labelled as PD test t =1,and PD test 4h).There was some agreement between P W and the corrosion rate measured from the polarisation curves at 4h (PD test 4h)for some alloys,but poor agreement for the other cases.In general,the corrosion rate measured from the immersion tests,P W gave lower values which may be due to the film tendencies of this testing solution.Z.Shi et al./Corrosion Science 52(2010)579–588583。
NASA_MOON_PROBE-fixed-20fps-256k-wtag

Scientists with the Lunar Crater Observing and Sensing Satellite mission, or LCROSS, said the payloads hit their target - the dark and frigid side of a crater near the south pole. The mission however did not live up to expectations that the payloads would create a cloud of debris visible to telescopes on Earth.
By Brian Wagner
Miami
09 October 2009
Lnsing Satellite, or LCROSS, and its rocket's upper stage
The U.S. space agency has smashed a pair of heavy space craft into the moon's surface in the hopes of finding evidence of frozen water or other potential resources. It may take weeks of analyzing data before NASA scientists announce their findings.
The LCROSS mission launched in June along with a separate mission to study the moon's surface. The Lunar Reconnaissance Orbiter is surveying possible landing areas and other conditions for the possible return of astronauts to the moon.
NACECORROSION2009

会议报道Conference ReportNACE CORROSION 2009本刊编辑部2009年的美国防腐蚀工程师协会(NACE)年度会议和展览(CORROSION 2009)于3月22~26日在美国佐治亚州亚特兰大市召开,活动继续延续了技术研讨会和产品展示的传统形式。
其中,3月23~26日举办的技术研讨活动共有38个场次、240多个现场主题报告以及1 000多篇论文发表,而同期举办的展览则吸引了近4 500名专业观众和320多家展商。
由于这项活动已成为全球防腐蚀行业的年度盛会,因此,本刊决定继2008年之后再次对这项活动中部分与涂料相关的技术交流内容进行跟踪报道。
韩国现代工业公司的Chung Seo Park等人介绍了对用于船舶及海洋平台的环氧/聚氨酯涂料体系过早失效现象的研究。
由于同时具有优秀的耐紫外线曝晒性能和防腐蚀性能,环氧/聚氨酯涂料体系已被广泛应用于船舶及海洋平台表面耐候性部位,但是,最近许多环氧/环氧涂料体系或环氧/聚氨酯涂料体系出现了涂层过早失效的情况,如涂层间的附着力失效导致的剥离或起泡,这种现象在冬季和春季尤为严重。
Chung Seo Park等人研究了典型的环氧/聚氨酯涂料体系在恶劣环境下(如低温、高湿)的应用情况,调查了导致涂层提前失效的主要原因,并且提出了在冬季和春季施工时保障涂层性能的一些改进性建议。
挪威SINTEF集团(挪威皇家科学院)的Ole Øystein Knudsen等人介绍了对在锈蚀钢铁表面施工修补涂料性能的研究。
研究首先对生锈的钢板分别采用高压水、喷砂及其他机械工具预处理,然后对修补涂料的性能进行分析评价。
出乎意料的是,采用旋转钢刷进行表面处理的钢板显示出了最好的涂层保护效果,而一般认为,旋转钢刷对铁锈和盐污的清除效果不如喷砂和高压水冲洗,因此涂层性能应该会较差。
研究继而对不同的机械打磨工具进行了对比,分别采用3M砂轮和旋转钢刷进行表面处理,再对修补涂料进行老化测试,结果显示旋转钢刷处理的样板耐腐蚀性能好于3M砂轮处理的样板——尽管旋转钢刷处理的样板表面还残留着部分连续的铁锈层。
Ecosystem services and valuation of urban forests in China
Ecosystem services and valuation of urban forests in ChinaC.Y.Jim *,Wendy Y.ChenDepartment of Geography,The University of Hong Kong,Pokfulam Road,Hong Konga r t i c l e i n f o Article history:Received 21October 2008Received in revised form 4March 2009Accepted 23March 2009Available online 17May 2009Keywords:Urban forestEcosystem service Economic valueContingent valuation Hedonic pricing Recreation value Amenity value Chinaa b s t r a c tUrban forests are integral components of urban ecosystems,which could generate significant ecosystem services,such as offsetting carbon emission,removing air pollutants,regulating the microclimate,and recreation.These ecosystem services contribute to improving environmental quality,quality of life,and sustainable urban development.Despite a long history of inserting vegetation in human settlements in China,modern scientific study of this natural-cum-cultural resource did not start until the 1990s.Spe-cifically,the identification and valuation of ecosystem services provided by urban forests are relatively new but fast growing research fields.This paper reviews studies on the major ecosystem services pro-vided by urban forests in China,including microclimatic amelioration (mainly evapotranspiration-cool-ing effects),carbon dioxide sequestration,oxygen generation,removal of gaseous and particulate pollutants,recreational and amenity.Various valuation techniques have been applied,most of which are still at the embryonic stage.There are rooms to improve the research scope and methods.Some per-tinent research gaps and implications on current and future development of urban forestry in China were distilled from the research findings.Ó2009Elsevier Ltd.All rights reserved.IntroductionUrban greening in China,like in other places,has developed in tandem with the evolution of civilization and society.The innate desire to re-establish the severed links with nature in settlements,as expounded by the biophilia concept (Wilson,1984),has been earnestly expressed.There is no unequivocal historical record on how and when landscape vegetation was first planted in Chinese settlements.It is believed that notable urban greening was initi-ated in royal gardens (Du et al.,1986)to symbolize the extension of imperial power on its subjects,and an attempt to find harmony between people and nature (Fan and Li,2005).Throughout the feu-dal period,gardens were widely built by royal and aristocratic fam-ilies as the integral components of private residences and palaces.Of all the royal gardens built in several millennia of Chinese his-tory,the most prominent exemplar is the Summer Palace of the Qing Dynasty (1885–1894).Meanwhile,amenity plants were also commonly cultivated in temple grounds to satisfy religious objectives.However,the development of urban forests for public use was a recent phenomenon in Chinese cities.With the influence of wes-tern urban greening concept during the semi-feudal and semi-colonial period (1840–1949),several big cities managed to convert old royal or private gardens to public use,such as the Zhongshan Park in Beijing (Zhao,2000).After the establishment of the socialistgovernment in 1949in China,Mao’s policy of ‘‘afforesting the motherland”laid the foundation of urban greening in nd-scaping offices were established at the municipal level to plant and manage urban greenery and green spaces.Adoption of the reform and open policy in 1978has brought a host of new institutions and regulations to reinforce the planning,installation,manage-ment and conservation of urban green spaces (Jim and Liu,2000).In the recent years,urban greening has attracted increasing atten-tion and resources at different administrative levels.In conjunction with rapid urbanization and development of new cities and dis-tricts,new green areas have been created or preserved (Yu and Padua,2007).The greening of compact Chinese cities demands special efforts and techniques that deviate from cities in western countries (Jim,2004).Despite the long history of urban greening in China,the modern study of urban forests was introduced into China after the 1990s (Wang,1995;Li et al.,2005).Rapid urbanization since the imple-mentation of opening-up and reform policy has generated massive urban sprawl into the surrounding countryside,infilling of intra-urban and peri-urban green fields,and a rapid increase in urban population.The associated environmental deterioration,ecosys-tem disturbance,and congested living condition have imposed pressures and constraints on the urban environment.The aggravat-ing blights in cities have generated demands for urban greenery to abate the environmental problems and to improve the quality of urban life (Cai et al.,2004;Chen and Jim,2008a,b ).The strong de-sire to develop liveable and sustainable cities has set the stage for comprehensive study of urban forest in the country.In general,the0264-2751/$-see front matter Ó2009Elsevier Ltd.All rights reserved.doi:10.1016/j.cities.2009.03.003*Corresponding author.Tel.:+852********;fax:+852********.E-mail address:hragjcy@hkucc.hku.hk (C.Y.Jim).Cities 26(2009)187–194Contents lists available at ScienceDirectCitiesjournal homepage:www.else v i e r.c o m /l o c a t e /c i t i esstudy of urban forests in China includes three key themes:analysis of urban forest structure,assessment of their ecosystem services, and their planning and management.Urban forest structure pro-vides basic information for further evaluation of functions,benefits and management(Kong and Nakagoshi,2006).The ultimate pur-pose of urban forest study is to inform comprehensive planning and scientific management(Zhang and Yu,2007).Urban forests could generate significant ecosystem services, such as offsetting carbon emission(Jo,2002),removing air pollu-tants,reducing noise,regulating the microclimate(Bolund and Hunhammar,1999),recreation and amenity(Jim and Chen, 2006a).Collectively,they contribute to improving environmental quality,quality of life,and sustainable urban development(Miller, 1997;Jensen et al.,2000;Li and Wang,2003;Chen and Jim, 2008a,b).The quantification and valuation of ecosystem services could permit direct comparison between alternative land use op-tions,and facilitate cost-benefit analysis of related policies(McPh-erson et al.,1997;Tyrväinen and Miettinen,2000).This paper reviews studies on the multiple ecosystem services and economic values of urban forests in China.Thus far,there has been no clear delineation of the scope of ecosystem services provided by urban forests and no standardized methodology for evaluating their ecosystem services in China.We attempted to cat-egorize various ecosystem services according to the system of the Millennium Ecosystem Assessment(Hassan et al.,2005).Publica-tions in both international and Chinese journals related to urban forest research in China were consulted.Hong Kong and Macau, being special administrative regions of China with a different mod-ern history,were not included in this review.The locations of the large Chinese cities in different regions included in this review are shown in Fig.1.The Chinese currency Renminbi(RMB)has an official exchange rate of US$1=RMB7.6in May2008.Regulating servicesAir quality regulationUrban forests can make significant contributions to urban air quality.The removal of air pollutants,such as sulphur dioxide, nitrogen oxides,ozone,carbon monoxide and particulates,signifies an important ecosystem service.This function is particularly cru-cial in Chinese cities,where air quality is deteriorating at a fast pace due to rapid urbanization and industrialization(Chen, 2006).The quantification and valuation of this ecosystem service have attracted much attention in China.The removal of sulphur dioxide and particulates by urban for-ests has been extensively studied.Consistently,they have been identified in urban air quality monitoring as the principal pollu-tants,mainly due to the use of fuels with high sulphur content (Wang et al.,2006).In the recent years,nitrogen oxides have emerged as an additional major air pollutant in many cities due to a rapid increase of private cars and inadequate road systems (Zhuang,2003).Empirical studies in western countries(e.g.McPherson et al., 1997)considered dry deposition as the main air pollutant removal mechanism.The pollutantflux was calculated as the product of deposition velocity and pollutant concentration.Most Chinese studies adopted a different approach.The capability of plants to re-move air pollutants was estimated by measuring sulphur in differ-ent plant parts(e.g.Chen et al.,1998b;Fang,2006).To quantifythe Fig.1.The Chinese cities that have been subject to studies on ecosystem services and monetary values of urban forests.188 C.Y.Jim,W.Y.Chen/Cities26(2009)187–194monetary value of air pollutant removal by urban forests,two methods have been adopted in Chinese studies.Thefirst is the marginal cost,which estimates the additional cost of producing a unit of air pollutant.The second is the replacement cost,which estimates the approximate cost of reducing pollutant emission using extant control techniques in industries,such as desulphuri-zation and particulate precipitation(Chen,2006).Several studies have been attempted to valuate air pollutant re-moval by urban forests in China.They yielded varied results due to the adoption of different quantification and valuation approaches (Table1).A Lanzhou(capital of Gansu province,in western arid and continental part of China)study found sulphur dioxide and particulate removal rates at,respectively,0.171and10.9t/ha/year (Zhang et al.,2006b).The removal capacity for the whole city was calculated by multiplying the area of urban forests(2789ha)by these estimates.The monetary value of pollutant removal was RMB0.28Â106/year for sulphur dioxide(based on replacement cost of RMB600/t),and RMB0.91Â106/year for particulates(based on marginal cost of RMB30/t).The replacement cost is based on the fees levied on pollutant emission from industrial sources in Gansu province(Zhang et al.,2006b).In a study of Beijing’s urban forest,the removal capacity for sul-phur dioxide was estimated by measuring sulphur accumulation in different plants,amounting to2192.41t/year(Leng et al.,2004). Applying the local marginal cost of RMB1200/t for sulphur dioxide (1999price),the removal value was RMB2.5Â106/year.For partic-ulate removal,field data were collected on the deposition of partic-ulates on plant leaves by Chen et al.(1998a).On average,1.518t/ ha/year of particulates could be removed by urban forests in Bei-jing.By applying a marginal cost of RMB560/t,the monetary value of particulate removal was RMB17.1Â106/year(Leng et al.,2004). The marginal cost is based on the fee levied on pollutant emission from industrial sources in Beijing.Yang et al.(2005)conducted a more detailed study in Beijing, focusing on air pollution reduction by urban forests.They applied the urban forest effects model(UFORE)developed by the USDA For-est Service Northeastern Research Station(Nowak and Crane, 2000).Using localfield data,trees could capture from the atmo-sphere1261.4t/year of total air pollutants(including772.0t of PM10,256.4t of O3,132.3t of NO2,and100.7t of SO2).In the same study,the air pollutant avoidance due to reduction in cooling en-ergy consumption(evapotranspiration-effect)was20,054.1t/year, with CO2taking the largest share.A similar model was adopted to evaluate air quality improvement(CITYgreen software developed by American Forests,2004).The value of air pollutant removal by urban forests in Shenyang(capital of Liaoning province in northeast China)with19,944trees reached US$16,318.21/year,including 1385.58kg/year and US$9417.16/year for O3;430.27kg/year and US$715.79/year for SO2;794.41kg/year and US$599.50/year for NO2;159.07kg/year and US$152.89/year for CO;and1197.39kg/ year and US$5432.87/year for PM10(He et al.,2003).Uncertainties in the quantification methodology have been acknowledged,such as the application of models based on western urban forest studies without appropriate modifications to suit local conditions.For example,the replacement cost of air pollutant re-moval in China would be different from the US,because different technologies would be employed and labour and material costs are usually lower in China.Moreover,dry deposition velocity of each air pollutant on vegetation at the local scale is a crucial factor in quantifying air pollutant removal in a city.The direct adoption of the relevant parameters given in western models,which explicitly demands the acquisition of local data,would indicate possible inaccuracies of thefindings.In a recent study,Jim and Chen(2008)assessed the ecosystem service of air pollutant removal by urban trees in Guangzhou (capital of Guandong province in south subtropical area of China).The dry deposition process and the average dry deposition veloci-ties based on the empirical studies were adopted.Trees in the built-up area of Guangzhou could remove312.03t/year of air pol-lutants,including30.25t/year of SO2,47.98t/year of NO2,and 233.79t/year of total suspended particulates.The total benefits were valued at RMB90,000/year based on the marginal costs of air pollutants.Recreational open spaces contributed the most to air pollutant removal due to high tree cover.The results suggested that this ecosystem service could be maximized by planting more trees,diversifying tree species choice,and providing sound urban forest management.The estimated air pollutant removal by urban forests varied amongst Chinese cities(Table1),which might be attributed to: (1)different quantification methods and(2)different vegetation species which have different removal capabilities.In addition,the removed quantities in Chinese studies were much higher than overseasfindings,which were estimated to range between9.7 and19.4kg/ha land area,including all air pollutants considered such as CO,NO2,SO2,PM10and O3(Nowak,1994;Scott et al., 1998).Higher pollutant concentrations in Chinese cities could raise deposition rates(Scott et al.,1998)and contribute to greater rem-ovals.Moreover,western studies used dry deposition as the main removal mechanism by urban forests(Lovett,1994;Nowak, 1994;Scott et al.,1998).Most Chinese studies adopted the pollu-tant accumulation in plant tissues(or the empirical results based on similar methods)to assess vegetation’s capability to remove air pollutants.For instance,the amount of sulphur in a plant hints about the amount of SO2absorbed from the ambient atmosphere. The amount could be overestimated because air pollutants may not be the only source of materials accumulated in plants.Further-more,the average removal capabilities given in western studies were calculated by dividing total removal amounts by total land area,whereas in Chinese studies the total urban forest areas were adopted.Microclimate regulationThe influence of urban forests on local microclimate is multi-dimensional and complex,including modification of solar radia-tion,wind speed,air temperature,relative humidity,and terrestrial re-radiation(Grimmond et al.,1994;McPherson et al.,1997; Miller,1997).Studies in western countries mainly focused on tree effects on cooling and heating energy saving at the local scale in low-density residential neighbourhoods,with an emphasis on shading provided by trees(e.g.Simpson,1998).However,tree-shading effect in residential areas is negligible in Chinese cities,be-cause almost all residences live in multi-storey buildings.The sheer bulk of high-rise and tightly packed buildings,many times of trees,would overwhelm tree-shading and related cooling ef-fects.Thus the studies of urban forest impacts on microclimate in Chinese cities usually focused on the evapotranspiration effect at the city level(Table2).Evapotranspiration incurs the absorption of latent heat of vaporization from the ambient atmosphere to vaporize the water. The natural air-conditioning process would significantly decrease the ambient air temperature(Chen et al.,1998b;Cai et al.,2002; Ding,2007;Wang et al.,2007).Meanwhile,the transfer of water to the atmosphere would raise the relative humidity in the vicinity of trees.Overall,urban forests could produce an‘‘oasis effect”to render the urban environment,specifically its bioclimatic condi-tions,more comfortable.In China,evapotranspiration from urban forests is usually esti-mated by measuring the latent heat consumption based on Yang’s (1996)equations.The value of air temperature regulation can be calculated as cooling energy savings(Leng et al.,2004).Chen et al.(1998a)have quantified the evapotranspiration effects ofC.Y.Jim,W.Y.Chen/Cities26(2009)187–194189urban forests covering16,577ha in Beijing.They found that 3.42Â106t/day of water could be transpired into the ambient atmosphere to consume84.1Â106kJ/day of heat energy.Of the different growth forms(tree,shrub,and herb),trees contributed the most to the thermal ing these data,Leng et al. (2004)estimated the value of urban forest in Beijing for microcli-mate regulation at RMB934,579.2/day and RMB93.5Â106/year. The calculation was based on the assumption that electrical power had to be consumed to achieve the same cooling effect in100sum-mer days per annum.Case studies were conducted to assess the varied effects of evapotranspiration and associated monetary value.For instance, in the warm-temperate part of China,the Wuhan Iron and Steel Company occupies a sprawling ground of312.38ha,about 20.20%of which is covered by an urban forest.The main tree spe-cies are Cinnamomum camphora,Magnolia grandiflora,and Sabina chinensis.The vegetation could absorb about1.8Â1012kJ/year of heat energy through evapotranspiration.This cooling effect could be transformed into a monetary value of RMB163.3Â106/year (Chen et al.,2006).In a study of Guangzhou’s urban forests (7360ha)in the humid subtropics,summer cooling effect of the urban forests was valued at RMB573.5Â106/year,and contributed to an average saving of RMB12.5/year per home(Chen,2006).Local meteorological conditions,inherent characteristics of urban forests (such as area,species composition,and biomass structure),and city surface albedo,might jointly regulate the cooling effect and hence monetary value in different Chinese cities.Based on the empirical data from western case studies,Zhang et al.(2006b)estimated the summer cooling value of2789ha of urban forests in Lanzhou at RMB6.8Â106/year.The same study discussed the contribution to improving air temperature during winter,but the effect was not computed.In several studies,the evapotranspiration-cooling evaluation fo-cused on some common species.For example,in the urban forests of Harbin(Heilongjiang province in northeast cold temperate zone of China),the descending sequence of evapotranspiration rate was Acer saccharum,Betula platyphylla,Forsythia suspensa,Lonicera japonica,Prunus maackii,Prunus triloba,Syringa oblate,and Ulmus pumila.In addition,its urban forests contributed significantly to cooling in the peak summer months of July and August(Cai et al.,2002).Another recent study of urban forests in Nanyang city (Henan province in cool-temperate central China),assessed the heat consumed during evapotranspiration-cooling by several com-mon species(Ding,2007).The large tree Platanus x hispanica would absorb an average of7008.53kJ/m2/day during summer(June to August)and lower air temperature by0.47°C.For the small tree Prunus triloba,heat consumption and air cooling would be,respec-tively,6559.52kJ/m2/day and0.44°C.For the grass Poa pratensis (Kentucky Bluegrass)8010.07kJ/m2/day and0.53°C were achieved.However,the study did not include economic valuation of the benefits.Uncertainties exist in quantifying and valuating the ecosystem service of microclimate regulation.Firstly,at the micro level,dif-ferent species and vegetation structures could affect evapotranspi-ration capacity(Yang,1996;Chen,1998;Cai et al.,2002;Ding, 2007)with impacts on microclimate.Currently,the evapotranspi-ration rates of only some common species have been measured, and data of most urban forest species are not available.Secondly, these case studies only include the summer cooling effect of evapo-transpiration.Urban forests could also regulate microclimate by modifying incoming solar radiation and outgoing terrestrial radia-tion,shading,humidity,and wind direction and velocity.Few stud-ies have been attempted in China on the processes and quantified benefits of these effects.Thirdly,local meteorological and aerody-namic conditions could regulate the contributions of urban forests to local microclimate(Oke,1989).The area and shape of an urban forest and its hydrometeorological conditions could jointly influ-ence the temperature below the green canopy and the surrounding built-up areas(Wang et al.,2006).Lastly,the monetary values did not consider real-world power demand for cooling,which could vary amongst individuals and different land uses.More specific and in-depth studies could minimize the uncertainty of quantifica-tion and valuation of this ecosystem service.Western studies have documented the diverse results of energy savings due to urban forests.The potential annual savings(four shade trees per house,with simulation of the shading and evapo-transpiration effects)could reach US$6.3million in Baton Rouge, LA,US$12.8million in Sacramento,CA,and US$1.5million in Salt Lake City,UT(Konopacki and Akbari,2000).Taha et al.(1997) found that urban trees could cool the city on the average by about 0.3–1.0°C,and total annual energy savings(shading and evapo-transpiration)could attain US$10–35/100m2of roof area of resi-dential and commercial buildings.Akbari(2002)suggested that in Los Angeles,urban trees could potentially save about US$93mil-lion of energy use per year and could reduce peak power demand by0.9GW.Local meteorological condition,the characteristics of urban forests(such as species composition,plant age,location to buildings),the albedo of city surface,and quantification methodTable1The value of air quality regulation by urban forests in China.City Urban forest area ortree count Air quality regulation and value Source SO2Particulates NO2O3Lanzhou2789ha Amount0.171t/ha/year(empiricalresult)10.9t/ha/year(empirical result)NA NA Zhang et al.(2006b)Value RMB0.28Â106/year(replacement cost)RMB0.91Â106/year(marginal cost)NA NABeijing16,577ha Amount2,192.41t/year(sulphuraccumulation in tissues)1.518t/ha/year(particulatedeposition on plant leaves)NA NA Leng et al.(2004)Value RMB2.5Â106/year(marginalcost)RMB17.1Â106/year(marginal cost)NA NABeijing2,383,000trees Amount100.7t/year(dry deposition)772.0t/year(dry deposition)123.3t/year(dry deposition)256.4t/year(drydeposition)Yang et al.(2005)Value NA NA NA NAGuangzhou7360ha Amount42.62t/year(dry deposition)166.68t/year(dry deposition)40.93t/year(dry deposition)NA Jim and Chen(2008)Value RMB25,570/year(marginal cost)RMB30,840/year(marginal cost)RMB24,560(marginal cost)NA190 C.Y.Jim,W.Y.Chen/Cities26(2009)187–194(shading,evapotranspiration,or both),might contribute to the dis-crepancies in microclimate regulation value provided by urban for-ests between Chinese and overseas studies.Water regulationOnly a couple of studies examined the ecosystem service of water regulation provided by urban forests in Chinese cities.In these studies,the CITYgreen software has been applied,in which an empirical model(Stormwater Runoff Program developed by the USDA Natural Resources Conservation Service)estimated run-off volume as well as percent changes at peakflow.For example,an assessment of an urban greenbelt,including agricultural land,was conducted in Hangzhou city(capital of Zhejiang province).In 10years(1994–2004),the total value of its ecosystem services in-creased by RMB168Â106,including runoff reduction,air pollutant removal,carbon sequestration and storage.Specifically,the value of water regulation of retaining4.38Â106m3storm water was estimated at RMB0.47Â109in2004.The ecosystem services were enhanced despite20.4%reduction in urban forest area(from 32,889.9ha in1994to26,176.9ha in2004)(Zhang et al.,2006a). The value improvement was attributed to the conversion of agri-cultural land to urban vegetated land,which was endowed with a complex vegetation structure of high leaf area(average leaf area index was1.3for agricultural land and8.9for urban forests).How-ever,the opportunity costs of this land use conversion were over-looked in this study,and its valuation results would denote rather crude estimates.A recent Nanjing(capital of Jiangsu province)study offered some refinements in research methods.Local precipitation and land cover data were used to build the database to compute the value of runoff reduction using CITYgreen software(Peng et al., 2007).The cost of reservoir construction in China was employed in the calculation,at RMB1.00/m3of water storage capacity.The value of runoff reduction was estimated at RMB3.44Â106/year. Due to variations in vegetation coverage,the ecosystem service of water regulation changed with land use in a descending sequence:green areas>public facilities>residential>transporta-tion>industrial>municipal infrastructure.Several assessments of water regulation valuation(mainly rain-water retention)could be found on the website of American For-ests().For example,a CITYgreen analysis in Metropolitan Washington,DC,found that the existing 46%tree canopy cover could reduce the need for retention struc-tures by949million ft3(26.88million m3),valued at$4.7billion per20-year construction cycle(based on a US$5/ft3construction cost).Using a numerical interception model that calculated rain-water intercepted by trees,McPherson et al.(1999)estimated that street and park trees of Modesto,CA,could reduce annual runoff by around292million m3with an implied value of US$0.61million (according to the cost of retention and detention basins at US$2.07/m3).In China,the ecosystem service of water regulation has been largely overlooked.The application of western models has generated rough estimates that demand tailor-made intercep-tion models that encompass the hydrological conditions of Chinese urban catchments,and the refinement of parameters in western models tofit the Chinese urban context.Cultural servicesUrban forests could provide various cultural services,such as recreation,aesthetic value,educational value,sense of place,reli-gious value,cultural heritage value(Dwyer et al.,1991).Only sev-eral recent studies investigated the recreation and amenity values of urban forests in China.The residents of Guangzhou city were found to be highly active in using urban forests for recreation and amenity purposes(Jim and Chen,2006a).Over half of the respondents to a questionnaire survey stated visiting the urban forests more often than two to three times per week.Relaxation, quietude,nature appreciation,physical exercise,and aesthetic enjoyment were ranked as important reasons for using urban for-ests.Applying the contingent valuation method(in a questionnaire survey respondents were asked directly about their willingness-to-pay for the provision of recreation opportunities and amenities by urban forests in Guangzhou),the value of recreational opportuni-ties and amenities attained RMB547.09Â106/year.Only income level had a significant positive influence on their willingness-to-pay for this ecosystem service(Jim and Chen,2006b).A survey of urban park visitors in Mianyang city(Sichuan province)indicated that urban forests served to relieve mental stress and fatigue and improve social interactions,but the value was not quantified (Tan and Zhao,2007).In addition to contingent valuation,the hedonic pricing method (estimating the value of ecosystem services by analyzing the re-sponse of housing price to amenity characteristics)was applied to assess the value of the intangible ecosystem service of recreation and amenity.The transaction data of residential properties in the emerging housing market in Chinese cities were gleaned to con-duct the computations(Jim and Chen,2008).In the old town centre of Guangzhou,the housing price would decrease by6.6%with dou-bling in distance to the nearest urban park.A view of urban forests would increase housing price by8.6%in urban areas(Jim and Chen, 2007).Residents were willing to pay a premium for homes with pleasant views of and easy access to nature.In a Jinan study(capital of Shandong province),GIS and land-scape metrics were used to determine the hedonic pricing model variables(Kong et al.,2007).The results confirmed that proximity to urban forests would exert a positive amenity effect on housing price.The value was influenced by urban forest size,distance to sce-nic sites,and proportion of urban forest area in a neighbourhood.In Athens,GA,Anderson and Cordell(1988)found that a large front yard tree could improve the selling price of a house by US$ing this data,it was estimated that the annual value of aesthetics and other benefits(not specified,but reflected by the increment of property values)provided by street and park trees in Modesto,CA,was US$1.45million,95%of which was attributed to street trees(McPherson et al.,1999).Another case study as-sessed the amenity value of urban forests in Joensuu,Finland,usingTable2The value of climate regulation by urban forests in China.City Urban forest area or treecountQuantification Value SourceLanzhou2789ha81.8MJ/ha/year(empirical estimate)RMB85.8Â106/year(replacementcost)Zhang et al.(2006a,b)Beijing16,577ha84.1Â106kJ/day(evapotranspiration rate)RMB93.5Â106/year(replacementcost)Chen et al.(1998b),Leng et al. (2004)Guangzhou7360ha1024.1Â106kWh/year(evapotranspirationrate)RMB573.5Â106/year Chen(2006)C.Y.Jim,W.Y.Chen/Cities26(2009)187–194191。
Annonce April 2009
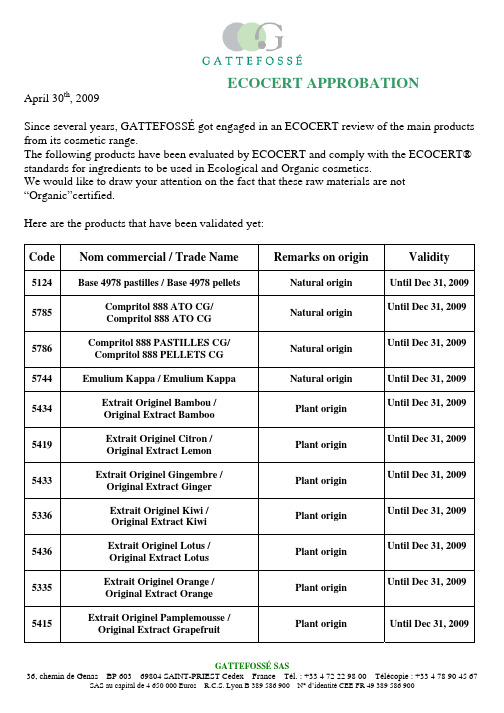
ECOCERT APPROBATIONApril 30th, 2009Since several years, GATTEFOSSÉ got engaged in an ECOCERT review of the main products from its cosmetic range.The following products have been evaluated by ECOCERT and comply with the ECOCERT® standards for ingredients to be used in Ecological and Organic cosmetics.We would like to draw your attention on the fact that these raw materials are not “Organic”certified.Here are the products that have been validated yet:Code Nom commercial / Trade Name Remarks on origin Validity 5124 Base 4978 pastilles / Base 4978 pellets Natural origin Until Dec 31, 20095785 Compritol 888 ATO CG/Compritol 888 ATO CGNatural originUntil Dec 31, 20095786 Compritol 888 PASTILLES CG/Compritol 888 PELLETS CGNatural originUntil Dec 31, 20095744 Emulium Kappa / Emulium Kappa Natural origin Until Dec 31, 20095434 Extrait Originel Bambou /Original Extract BambooPlant originUntil Dec 31, 20095419 Extrait Originel Citron /Original Extract LemonPlant originUntil Dec 31, 20095433 Extrait Originel Gingembre /Original Extract GingerPlant originUntil Dec 31, 20095336 Extrait Originel Kiwi /Original Extract KiwiPlant originUntil Dec 31, 20095436 Extrait Originel Lotus /Original Extract LotusPlant originUntil Dec 31, 20095335 Extrait Originel Orange /Original Extract OrangePlant originUntil Dec 31, 20095415 Extrait Originel Pamplemousse /Original Extract GrapefruitPlant origin Until Dec 31, 2009Code Nom commercial / Trade Name Remarks on origin Validity5426 Secrets d’Acérola / Acerola Secrets 35% plant ingredient 65%natural originUntil Dec 31, 20095327 Secrets d’Orange (Orange 50° Brix) /Orange Secrets (Orange 50° Brix)Plant IngredientUntil Dec 31, 20095429 Secrets de Citron (Citron 40° Brix) /Lemon Secrets (Lemon 40° Brix)Plant IngredientUntil Dec 31, 20095428 Secrets de Papaye / Papaya Secrets 35% plant ingredient 65%natural originUntil Dec 31, 20095427 Secrets de Pomme / Apple Secrets Plant Ingredient Until Dec 31, 2009 5445 V-Tonic / V-Tonic Plant Ingredient Until Dec 31, 20095396 Végétol Calendula ME 209 Huileux /Vegetol Calendula ME 209 OilyPlant ingredientUntil Dec 31, 2009Here are the products that have already been rejected:Code Nom commercial /Trade NameRejection reason5770 Cellules Fraîches Carottes PF / Fresh Cells CarrotPFContains phenoxyethanol5766 Cellules Fraîches Fraises PF / Fresh CellsStrawberry PFContains phenoxyethanol5752 Cellules Fraîches Kiwi PF / Fresh Cells Kiwi PF Contains phenoxyethanol5753 Cellules Fraîches Mangues PF / Fresh Cells MangoPFContains phenoxyethanol5771 Cellules Fraîches Potiron PF / Fresh Cells PumpkinPFContains phenoxyethanol5240 Emulcire 61 WL 2659 / Emulcire 61 WL 2659 Ethoxylated productCode Nom commercial /Trade NameRejection reason5257 Gatuline A / Gatuline A Solvent used to extract thesaponins5767 Gatuline Age Defense 2 / Gatuline Age Defense 2 Contains Sodium Metabisulfite5252 Gatuline RC / Gatuline RC Contains phenoxyethanol 5437 Gatuline RP / Gatuline RP Contains phenoxyethanol 5758 Hema’Tîte / Hema’Tîte Contains phenoxyethanol 5765 Néoskin G / Neoskin G Contains phenoxyethanol5406 Optivégétol Busserole P65 Hydro /Optivegetol Bearberry P65 HydroContains synthetic ascorbicacid5422 Optivégétol Vin P150 Hydro /Optivegetol Wine P150 HydroContains Chlorophenesin andPotassium Metabisulfite5287 Pancogène marin / Pancogene marin Fish extract5769 Phylderm Végétal C2 /Phylderm Vegetal C2Contains phenoxyethanol5768 Rhodo’Lîte 2 / Rhodo’Lîte 2 Contains phenoxyethanol5726 Sève essentielle de Clémentine / Essential NectarMandarin OrangeContains a solubilizing agentnot accepted5711 Seve Essentielle de Pêche /Essential Nectar PeachContains Phenonip®5504 Tenseur Végétal / Vegetal Tensor Contains Phenonip® 5569 Vedacalm / Vedacalm Contains BHA / BHTWishing you a successful promotion of these products.Cosmetic Marketing Team.。
抗气蚀聚氨酯涂层的研究进展
第52卷第6期表面技术2023年6月SURFACE TECHNOLOGY·153·抗气蚀聚氨酯涂层的研究进展王天聪1,2,侯国梁1,苏琼2,崔海霞1,陈磊1,周惠娣1,陈建敏1(1.中国科学院兰州化学物理研究所 中科院材料磨损与防护重点实验室,兰州 730000;2.西北民族大学 化工学院,兰州 730030)摘要:随着水轮机和螺旋桨等过流件的尺寸和转速不断提高,气蚀损坏问题更加突出,因此易施工涂覆且便于设计调控的聚氨酯涂层始终是耐气蚀领域的研究热点。
系统回顾了聚氨酯材料在气蚀防护领域的研究发展历程,深刻指出了这类材料作为耐气蚀涂层使用时存在的突出问题,例如耐水性、附着力、机械性能、耐磨性能和防污能力等较差,系统分析了这些因素导致涂层损坏失效的机理。
针对上述问题,重点根据聚氨酯独特的分子结构,分别从表面能、电负性、化学键合、接枝改性、添加功能填料等方面,提出了改善聚氨酯涂层在复杂工况下应用性的解决办法。
最后,鉴于我国对能够在海洋等苛刻环境中长期稳定服役的高性能气蚀防护涂层的急迫需求,对发展以自愈合聚氨酯为代表的集防污抗气蚀耐磨损自修复等功能于一体的新型聚氨酯材料进行了展望。
关键词:聚氨酯涂层;气蚀;损伤机理;改性;多功能中图分类号:TG172 文献标识码:A 文章编号:1001-3660(2023)06-0153-13DOI:10.16490/ki.issn.1001-3660.2023.06.014Research Progress of Anti-cavitation Erosion Polyurethane CoatingWANG Tian-cong1,2, HOU Guo-liang1, SU Qiong2, CUI Hai-xia1,CHEN Lei1, ZHOU Hui-di1, CHEN Jian-min1(1. Key Laboratory of Science and Technology on Wear and Protection of Materials CAS, Lanzhou Institute ofChemical Physics, Chinese Academy of Sciences, Lanzhou 730000, China;2. School of Chemical Industry, Northwest Minzu University, Lanzhou 730030, China)ABSTRACT: As a special form of material destruction, cavitation erosion causes huge economic losses and material losses to ships, water conservancy and hydropower industries every year, especially irreversible damage to key parts such as turbine and收稿日期:2022–01–17;修订日期:2022–06–17Received:2022-01-17;Revised:2022-06-17基金项目:中国科学院材料磨损与防护重点实验室青年基金(SYSQJ-2020-1);中国科学院青年创新促进会会员资助(2020416);陇原青年创新创业人才项目Fund:Supported by the Youth Foundation of Key Laboratory of Science and Technology on Wear and Protection of Materials, CAS (SYSQJ-2020-1); the Youth Innovation Promotion Association, CAS (2020416); the Longyuan Youth Innovation and Entrepreneurship Talent Project作者简介:王天聪(1997—),男,硕士研究生,主要研究方向为表面涂层技术。
Tyrosine kinases and their substrates in B lymphocytes
Tomohiro Kurosaki Masaki Hikida Tyrosine kinases and their substrates in B lymphocytesAuthors’addressesTomohiro Kurosaki1,2,Masaki Hikida2,31Laboratory of Lymphocyte Differentiation,WPI Immunology Frontier Research Center,Osaka University, Suita,Osaka,Japan.2Laboratory for Lymphocyte Differentiation,RIKEN Research Center for Allergy,Immunology,Tsurumi-ku,Yokohama, Kanagawa and Japan.3Center for Innovation in Immunoregulative Technology and Therapeutics,Graduate School of Medicine,Kyoto University,Yoshida Konoe-cho,Sakyo-ku,Kyoto,Japan.Correspondence to:Tomohiro KurosakiLaboratory of Lymphocyte DifferentiationWPI Immunology Frontier Research CenterOsaka University3-1Yamada-oka,SuitaOsaka565-0871JapanTel.:+81455037019Fax:+81455037018e-mail:kurosaki@rcai.riken.jpAcknowledgementsThe experiments from this laboratory were supported by grants from the Scientific Research from the Japanese Ministry of Education,Culture,Sports,Science and Technology,the Kanahara Foundation,Mochida Foundation, Naitoh Memorial Foundation,Ciba-Geigy Foundation (Japan),Sumitomo Foundation,Uehara Foundation,Toray Science Foundation,Takeda Foundation,Hoh-ansha Foundation,and Human Frontier Science Program.Immunological Reviews2009Vol.228:132–148Printed in Singapore.All rights reservedÓ2009The AuthorsJournal compilationÓ2009Blackwell Munksgaard0105-2896Summary:Gene-targeting experiments have highlighted the importance of the intracellular protein tyrosine kinases,Lyn,Syk,and Btk,in B-cell receptor-mediated phospholipase C c2and phosphoinositide3-kinase activation.In linking such tyrosine kinases with effector enzymes,an important role has emerged for adapter molecules.Adapter proteins nucleate formation of distinct signaling complexes in a specific location within the cell and facilitate the interaction between these signaling components in this particular subcellular compartment,which,in turn, contribute to the qualitative and quantitative control of B-cell signaling. Keywords:tyrosine kinases,B lymphocytes,B-cell receptorIntroductionThe tremendous diversity and plasticity of immune responses are exemplified well by the B-cell branch of the immune system.B-cell signaling through the B-cell receptor(BCR)leads to a wide range of biological outcomes,which depend on the developmental stage of the B cell and properties of the antigen.A simple‘on–off’mode of signal transduction would not allow for such a diversity of cellular responses.Rather,BCR signals must be precisely regulated in terms of their magnitude and duration.Transmembrane signaling through the BCR is further regulated orfine-tuned by an array of cytoplasmic signal transduction machineries that amplify or dampen signals during B-cell development and immune responses.Perhaps the most critical insights of the past two decades in the study of BCR,signal transduction have been the discovery of the immunoreceptor tyrosine-based activation motif (ITAM)within the Ig a and Ig b subunits of the BCR,and recognition of the activation of protein tyrosine kinases (PTKs).The activated PTKs phosphorylate a number of down-stream substrates,including adapter molecules,which,in turn,are critical for optimal activation of effector enzymes, e.g.phospholipase C c2(PLC c2)or phosphoinositide3-kinase (PI3K).Thus,how PTKs are regulated and how adapter molecules participate in modulating signal transduction haslong fascinated many researchers.In this review,we summa-rize the major advances in how PTKs and their substrates exert their functions during B-cell development and activation.Initial BCR signaling eventsThe earliest biochemical events of the BCR signal have been well characterized.However,these previous analyses have two main weak points.First,because this analysis requires a relatively large amount of B cells,the experiments have been usually done by using antigen stimulation.As discussed later in more detail,in addition to ligand-induced signaling,ligand-independent signaling also plays a critical role.For instance,cell surface expression of pre-BCR per se has been thought to be sufficient for inducing biological outcomes.Because of the difficulty in analyzing such cell surface expres-sion-dependent signaling,our understanding about biochemi-cal nature of ligand-independent signaling has been limited,thereby being speculated from studies of the ligand-induced events.Second,because the biochemical analysis relies on the examination of a population of cells,these studies cannot pro-vide quantitative data at the single cell level or on dynamic localization of membrane receptors and signaling molecules.Thus,to overcome the second point,the new technology using supported planar lipid bilayers (presumably mimicking recognition of membrane-tethered antigens on the surface of an antigen-presenting cell)combined with advanced imaging technologies such as total internal reflection fluorescence (TIRF)and Forster resonance energy transfer (FRET)has beenemployed,providing insights into the novel aspects of spatio-temporal dynamics of receptor signaling.Therefore,we begin a discussion of new ideas generated by such imaging studies.The ligand-inding subunit of the BCR complex consists of a transmembrane immunoglobulin heavy chain (IgH)and a covalently associated light chain (IgL).The signal transduction subunit is provided by a non-covalently associated heterodimer of Ig a ⁄Ig b .BCR oligomerization induced by antigen binding seems to be sufficient to start the signaling event (1,2).Then,the question arises about what structural changes,particularly in the cytoplasmic domains of the Ig a ⁄Ig b ,take place after BCR oligomerization.Pierce et al .(3)have addressed this question by monitoring FRET between individual BCR subunits.After oligomerization,the cytoplasmic domains of the BCR also clus-ter.Then,secondary rearrangements occur,resulting in transi-tion from a closed to an open conformation,which in turn slows down the FRET efficiency.The open conformation of the activated BCR is dependent on ITAM phosphorylation,most likely by the action of Lyn,as discussed below in more detail,one of Src-family PTKs.Supporting the involvement of Lyn in transition to this open conformation,the BCR is now turned out to selectively and transiently associate with Lyn after antigen engagement,being followed by inducing the open conformation (4)(Fig.1).B cells do respond to soluble antigen,but some portions of the antigens encountered in vivo are in a membrane-bound form.For instance,in the interaction between follicular dendritic cells (FDCs)and B cells,FDCs hold large amounts of intact antigens on their surfaces by virtue of FcandKurosaki &Hikida ÆTyrosine kinases and their substratescomplement receptors,whereby B cells recognize cognate antigens in a cell–cell contact manner (Fig.2A ).Batista et al .have tackled the question about the molecular events after this type of recognition by using TIRF microscopy and planar lipid bilayers containing intercellular adhesion molecule-1(ICAM-1)and antigens (5).During the early stages of membrane-bound antigen recog-nition,B cells spread out over the antigen-bearing membranes and then contract,thereby collecting bound-antigen into a central aggregate.This response is concomitant with the formation of the immunological synapse (IS),which is similar to that originally described for T cells (6,7).This structure is characterized by a central accumulation of BCR-antigen,termed as the central supramolecular activation cluster (cSMAC),surrounded by a ring of adhesion molecules,or peripheral SMAC (pSMAC).It was shown that intracellular signaling molecules,Syk,PLC c 2,and Vav1,are colocalized with the initial BCR microclusters (8).After the maximal spreading (about 3min),these BCR clusters started to translo-cate to form cSMACs.However,unlike the BCR,clusters including Syk (herein called microsignalsomes)did not move to the cSMACs and appeared to dissociate from the BCR clusters.Similarly,after recognition of membrane-bound antigens,CD19was transiently recruited to the BCR clusters,being important for amplifying BCR signaling (9).Taken together,the microsignalsomes,probably including CD19,Syk,PLC c 2,PI3K,and Vav,are a critical site for initiating BCR signal.Then,at a later time point (15min after stimulation),the microsignalsomes dissociate from the BCR clusters which reside in the cSMACs.Although not yet proven,the Ig a ⁄Ig b of the BCR inside the cSMACs seems to be dephosphorylated.Given the evidence that the non-phosphorylated form oftheKurosaki &Hikida ÆTyrosine kinases and their substratesIg a is preferentially accumulated in the internalization compartment(10),this non-phosphorylated BCR complex in the cSMACs might be prone to undergoing internalization and participating in subsequent antigen presentation on the cell surface(Fig.2B).Regulation of PTKsThe sequential activation of three different types of PTKs,Lyn, Syk,and Btk,is required to regulate downstream effectors in BCR signaling.In addition,proline-rich tyrosine kinase2 (Pyk2)is utilized by chemokine receptor signaling(11).LynKinetic experiments in B cells have shown that the increased activity of the Src PTKs,Lyn,Btk,and Fyn following BCR activation occurs before the increased activity of Syk and Btk, suggesting that it is the Src PTKs that are initially activated through BCR signaling(12).In vitro binding studies showed that Lyn and Fyn,but not Src,interact with the resting BCR (13).This differential association between Lyn⁄Fyn and Src might reflect binding to a membrane fraction through palmi-toylation rather than protein–protein interactions,as Lyn and Fyn,not Src,are palmitoylated at one or two Cys residues(position3or5from the N-terminus)in addition to being myristoylated at their N-termini.Indeed,the functional importance of palmitoylation,in the case of Lck,has been demonstrated in T-cell receptor(TCR)signaling(14).Lyn and Fyn have the following domains in common (Fig.3):N-terminal attachment sites for fatty acid(myristoyla-tion and palmitoylation)addition,a unique region,a Src-homology3(SH3)domain,and an SH2domain,a tyro-sine kinase domain,and a C-terminal negative regulatory domain.The kinase activities of Src PTKs are regulated by tyrosine phosphorylation;phosphorylation of Tyr416within the Src catalytic domain is stimulatory,and C-terminal phos-phorylation of Tyr527is inhibitory(15).Phosphorylation of Tyr527mediates an intramolecular association with the kinase’s own SH2domain,leading to a conformation that represses its kinase activity.Tyr416on Src PTK is thought to be autophosphorylated or phosphorylated by its neighboring Src PTK(16,17).By contrast,the phosphorylation of Tyr527 is trans-phosphorylated and dephosphorylated by Csk and phosphatase CD45,respectively(18–21)(Fig.3).Supporting this notion,the C-terminal tyrosine of Lyn is hyperphosph-orylated in CD45-deficient DT40B cells and CD45-negative J558plasmacytoma,while this tyrosine is hypophosphorylated in Csk-deficient DT40cells(18,19,22).In vivo significance of this type of regulation was further verified by the observations that the extent of receptor-induced tyrosine phosphorylation of cellular substrates was significantly increased and decreased in Csk-and CD45-deficient DT40cells,respectively(18,19). Thus,the strength of BCR signaling is regulated through the balance between Csk and CD45activities by determining the phosphorylation status of the C-terminal tyrosine of the Src PTKs.As discussed later in more detail,the relatively mild B-cell developmental anomaly in CD45)⁄)(23,24)or Csk)⁄) (25)mice could be explained by redundancy of closely related molecules(CD148and CHK in the case of CD45and Csk, respectively).Crystal structure analyses of Src PTKs reveal that the SH3 domain recognizes the linker region between the SH2domain and the kinase domain(26,27).Thus,two interactions, between the SH2domain and phosphorylated Tyr527and between the SH3domain and the SH2kinase linker region, are thought to be involved in keeping Src kinase in the inac-tive state.During Src PTK activation,the sequential dissocia-tion of the SH2and SH3domains from the intramolecular ligands would take place,thereby removing these inhibitory constraints.Thus,in addition to dephosphorylation of Tyr527,more potent exogenous ligands for the SH2or SH3 domain may compete for endogenous intramolecularbinding,Kurosaki&HikidaÆTyrosine kinases and their substratesthereby disrupting the inactive state.Indeed,as discussed later,CD19has been shown to function as such ligands.Another layer of regulation of Src PTKs occurs at the level of protein degradation.Loss of Csk was reported to lead to a reduction in Src and Fyn proteins,due to enhanced protein degradation,because inhibition of proteasome activity increased the level of Src protein in Csk-deficient cells (28).Moreover,Src was found to be ubiquitinated,and activation of Src increased the extent of polyubiquitination.Thus,it is reasonable to anticipate that once Lyn is hyperactivated,two mechanisms might operate to dampen its activity:phosphory-lation on its C-terminal tyrosine by Csk and polyubiquitina-tion-induced degradation presumably mediated by an as yet unidentified E3ligase(s).Although involvement of Cbl in Lyn-mediated degradation at a resting state was demonstrated (29),Cbl-deficient B cells still manifested BCR-mediated degradation of Lyn.As mentioned above,many studies indicate that CD45plays a positive role in BCR signaling,but negative effects of CD45were also observed.Analysis of CD45-deficient variants of WEHI-231B cells demonstrated that Lyn is constitutively active due to hyperphosphorylation of Tyr416,simply imply-ing that the stimulatory Tyr416,in addition to the inhibitory Tyr527,could be a target of CD45(30).Thus,it is likely that CD45has both positive and negative roles in BCR signalingand that the balance of these two opposite effects varies depending upon the distinct developmental stages of B cells and ⁄or distinct CD45isoforms and ⁄or level of expression of CD45.How CD45is regulated is only beginning to be understood.Forced dimerization of chimeric CD45phospha-tase molecules inhibits CD45function,resulting in blunted TCR signaling (31,32).This appears to be mediated by a juxtamembrane wedge-like structure that can interact with and block the catalytic site of the partner phosphatase during dimerization.B cells harboring this wedge mutant showed hyper-responsiveness (33).In this case,a negative role of CD45is thought to be dominantly manifested;this wedge mutant negatively regulates CD45phosphatase activity,thereby enabling maximal Lyn activation.SykWeiss and Littman (34)first proposed a sequential activation model,based on the cooperativity between Lck and Zap-70(f -associated protein of 70kDa)in T cells.Most of the obser-vations in B cells support that this mechanism also operates in B cells.According to this model,BCR engagement leads to phosphorylation of the Ig a ⁄Ig b ITAMs by Src PTKs.Then Syk is recruited to the doubly phosphorylated ITAMs and is activated by Src PTK-dependenttransphosphorylationKurosaki &Hikida ÆTyrosine kinases and their substrates(35–37)(Fig.4).Biochemical(38)and genetic data using DT40B cells(39)and Drosophila S2cells(40,41)have under-scored the existence of an additional activation mode of Syk, which is independent of Src PTKs.By contrast,Zap-70activa-tion appears to be strictly dependent on Src PTKs. Supporting the additional mechanism in the case of Syk,the BCR-mediated Syk activation persists even in the absence of Lyn,albeit less efficiently than wildtype DT40cells(39). Moreover,in S2cells,Syk was demonstrated to be able to phosphorylate both of the two tyrosines located in Ig a–Ig b ITAMs(41).Then,what is the underlying mechanism that explains the Src-PTK-independent activation mode of Syk? Association of Syk with BCR complex is observed before receptor stimulation,although the molecular details are still unclear(42).It is probable that tyrosine residues within Ig a–Ig b ITAMs are constitutively phosphorylated,albeit at a low level,whereby Syk SH2domains bind to the BCR com-plex before receptor ligation.Alternatively,this association might be phosphotyrosine–SH2independent.In any case, receptor aggregation could directly stimulate the activity of the pre-associated Syk,leading to tyrosine phosphorylation of Ig a–Ig b ITAMs(dp-ITAMs).This phosphorylation recruits additional Syk to the phosphorylated Ig a–Ig b.Binding dp-ITAMs to the tandem SH2domains of Syk induces two events:(i)as mentioned below in more detail,this binding can release the auto-inhibited state of Syk,thereby enhancing its enzymatic activity;(ii)newly recruited Syk is brought into close proximity with the previously pre-associated Syk, thereby being prone to be tyrosine-phosphorylated by this pre-associated Syk.As the Syk mutant(Tyr519to Phe)is not able to transmit downstream signals,Tyr519is probably autophosphorylated or transphosphorylated by the neighbor-ing Syk(35).In the case of Zap-70,phosphorylation of the homologous residue Tyr496can be catalyzed by Src PTKs but not by Zap-70itself(43).This differential requirement for Src PTKs between Zap-70and Syk might reflect the fact that recognition of free antigen by the BCR is sufficient to induce signaling,while TCR and CD4⁄CD8recognize peptide and class II⁄I,respectively,both of which are required for T-cell activation(44–46).As Lck is pre-associated with CD4⁄CD8, recognition of peptide-class II⁄I by TCR and CD4⁄CD8brings Lck into the close proximity with TCR f chain,whereby Lck phosphorylates ITAMs in the f chain and subsequently trans-phosphorylates Zap-70(34,47–49).According to this idea, strict regulation of Zap-70by Lck aims to prevent TCR from unintentionally transmitting the signal by recognition of the cognate peptide alone,without class II⁄I recognition.In support of this hypothesis,pre-TCR,not necessitating CD4⁄CD8for its activation,appears to utilize Syk,instead of Zap-70,for transmitting the signal(50).Although Syk is activated in the absence of Src PTKs,the positive effects of Src PTKs on Syk is clear.In fact,BCR-induced activation of Syk is dramatically inhibited by loss of Lyn in DT40B cells(39).Hence,under physiological condi-tions,BCR ligation activates Src PTKs as well as pre-associated Syk,leading to maximal phosphorylation of ITAMs in Ig a–Ig b and the subsequent recruitment of Syk.Then recruited Syk is activated by Src PTK-dependent transphosphorylation and by autophosphorylation.Assuming that Syk has a similar structural organization to Zap-70,recent crystallographic analyses of Zap-70provided a significant insight into how Syk maintains the auto-inhibited state and how this auto-inhibited state is broken down by the binding to dp-ITAMs to the tandem SH2domains of Syk(51). Two tyrosines residues(corresponding to Tyr342⁄Tyr346)in the SH2-kinase linker region of Syk are involved in aromatic–aromatic interactions that connect this linker to the kinase domain,thereby being involved in keeping Syk kinase in the inactive state.Binding of SH2domains of Syk to dp-ITAMs disrupts the aromatic–aromatic interactions,thereby removing this inhibitory constraint and subsequently activating Syk kinase activity by facilitating phosphorylation on Tyr519in the activation loop.The two linker tyrosine residues (Tyr342⁄Tyr346)are known to undergo phosphorylation after BCR stimulation(52,53).Because this phosphorylation has a potential to prevent reversion to the auto-inhibited con-formation of Syk even after ITAM disengagement,implicated from the crystallographic data,regulation on phosphorylation status of Tyr342⁄Tyr346could have a potential impact on how long and how strong Syk activity is maintained during and after BCR engagement.Indeed,the importance of phos-phorylation on these two tyrosines was demonstrated by introduction of the Syk mutant(Tyr342⁄Tyr346to Phe342⁄Phe346)into Syk-deficient DT40B cells(T.Adachi and T.Kurosaki,unpublished data).These structural studies support the following concepts previously proposed by biochemical and genetic analysis.First,dp-ITAMs of Ig a–Ig b overcome the inherent promiscuity of Syk SH2domains, making recruitment of Syk to the BCR complex highly specific.Second,this binding releases Syk from its auto-inhibited state,thereby facilitating activation of its kinase domain and probably restricting the activated state of Syk in the vicinity of the BCR(54)(Fig.4).How is Syk activity turned off?The Tyr130residue of Syk, located between the N-terminal and C-terminal Syk SH2 domains(interdomain A),is autophosphorylated by activatedKurosaki&HikidaÆTyrosine kinases and their substratesSyk,and this phosphorylation may contribute,in turn,to termination of Syk in BCR signaling.Indeed,in B cells expressing a Syk variant (Y130E,mimicking the phosphoryla-tion status),this variant Syk exhibited a reduced ability to associate with BCR,and BCR-mediated tyrosine phosphoryla-tion of cellular proteins was dampened,suggesting the possibility that this phosphorylation can change a high affinity state of Syk to dp-ITAMs to the low affinity state (55).This possibility has been well substantiated by structural analysis using nuclear magnetic resonance (NMR)heteronuclear relaxation experiments;introduction of a negative charge at Tyr130,mimicking phosphorylation,disrupts the interdo-main A structure and alters the orientation of the two SH2domains relative to each other,thereby increasing distance between dp-ITAMs and two SH2domains (55).Another type of downregulation of Syk activity has been also proposed;analysis of Cbl-b )⁄)mice demonstrated the possibility that Cbl-b might participate in BCR-mediated polyubiquitination of Syk and its subsequent degradation (56).In this regard,Tyr317in the SH2-kinase linker region of Syk was shown to be phosphorylated after BCR ligation,thereby providing a binding site for Cbl-b (57).Thus,a promising model hasemerged that proposes that Cbl-b,after binding to the phosphorylated Tyr317in Syk,induces degradation of Syk (58).BtkAmong Tec-family PTKs,Btk is dominantly expressed in B cells.The initial step in activation of Btk is its recruitment to the plasma membrane through interaction between the pleck-strin homology (PH)domain and phosphatidylinositol-3,4,5-trisphosphate (PIP3),a product of PI3K activity (59,60)(Fig.5).Indeed,in X-linked immunodeficient (xid)mice,Btk cannot be recruited to the plasma membrane because of a point mutation in the PH domain (61,62).However,as the PH mutation also affects the protein stability,in addition to a structural change,careful explanations will be needed.Indeed,the observation that Btk can still be activated in cells deficient in the PI3K regulatory subunit p85raises the possibility that another mode of Btk recruitment to the plasma membrane might exist (63).As discussed below in more detail,the adapter molecule B-cell linker protein (BLNK)actively partici-pates in recruitment of Btk and PLC c 2to theplasmaKurosaki &Hikida ÆTyrosine kinases and their substratesmembrane.Supporting this possibility,BLNK-deficient DT40 B cells exhibited insufficient Btk activation in BCR signaling context(64).Thus,we propose that two interrelated interac-tions,between the PH domain and PIP3and between the SH2 domain and phosphorylated BLNK,could coexist to recruit Btk to the plasma membrane(Fig.5).It was proposed that Btk is activated through phosphoryla-tion by Src PTKs.Indeed,infibroblasts and COS cells,Btk is activated through Src PTK-dependent transphosphorylation of Tyr551,which is located in the activation loop of the catalytic domain of Btk(65,66).This results in afive-to10-fold increase in Btk enzymatic activity,which is critical for activat-ing downstream signaling such as PLC c2activation(67).The phosphorylation of Tyr551,in turn,is followed by autophos-phorylation of a tyrosine residue within the SH3domain, resulting in a fully activated Btk(66).Autophosphorylation of the SH3site can also change the interaction of Btk with other partner proteins(68).The functional interaction between Src-PTKs and Btk was re-examined in BCR signaling context by employing DT40B cells(67).In Lyn-deficient DT40cells,the BCR-mediated tyrosine phosphorylation of Btk still took place,although being delayed in time kinetics,while the sustained Btk phosphorylation was clearly inhibited in Syk-deficient cells. Moreover,in Lyn⁄Syk double-deficient cells,the BCR-induced Btk phosphorylation was completely abrogated(69).A simple explanation of these results is the existence of two phases of tyrosine phosphorylation on Btk in BCR signaling context. The initial phase and the sustained phase are mediated by Lyn and Syk,respectively,and the concerted actions of Lyn and Syk are required for optimal activation of Btk.Thus,as discussed above,Syk is activated to some extent even in the absence of Lyn after BCR ligation,and this weak but signifi-cant activation of Syk likely causes phosphorylation on Tyr551 on Btk.Interactions of Btk with partner proteins are also important for its activation.As mentioned above,interaction of the SH2 domain of Btk with phosphorylated BLNK does contribute to recruitment of Btk to the plasma membrane.In addition,this interaction is able to enhance Btk enzymatic activity presum-ably by disrupting the intramolecular auto-inhibitory interac-tions(64).Consistent with the importance of the intact SH2 domain structure in its activation,in the case of Itk(one of the Tec family PTKs),cyclophilin A has been reported to regulate activation of Itk through isomerization of a proline residue in the SH2domain(70,71).Regulation of effector enzymes by adapter moleculesIn regard to how PTKs activate effector enzymes,an important notion has emerged that adapter proteins,after being tyrosine phosphorylated,bind to multiple effector molecules in a special location within the cell and facilitate the interaction between these multiple effectors in this particularsubcellular Kurosaki&HikidaÆTyrosine kinases and their substratescompartment,thereby ensuring the spatio-temporal precision of B-cell signal transduction events.This has been typically exemplified in how lipid-metabolizing enzymes are regulated in BCR signaling.PLC c 2The importance of translocation of PLC c 2to the plasma membrane on BCR engagement is clear.So,the question arises as to the molecular mechanisms of this translocation.Now,an adapter molecule,BLNK [also known as SH2domain-contain-ing leukocyte phosphoprotein of 65kDa (SLP-5)],which was isolated as one of the proteins that are tyrosine phosphorylated after BCR ligation,has been shown to be a key docking partner for PLC c 2SH2domains (72–75)(Fig.6).Of the two PLC c 2SH2domains,the N-terminal domain is more crucial for binding to phosphorylated BLNK (76).The functional importance of the interaction between BLNK and PLC c 2has been shown by experiments that used DT40B cells deficient in BLNK and PLC c 2.BLNK-deficient B cells failed to induce the translocation of PLC c 2to the plasma membrane and its subsequent activation (75).Moreover,a PLC c 2N-terminal SH2mutant was shown to be incapable of binding to phosphorylated BLNK or of being targeted to the plasma membrane (76).Hence,BLNK acts to bring PLC c 2to the plasma membrane,wherein PLC c 2becomes tyrosine phosphorylated and activated.Indeed,BLNK is targeted to the membrane on BCR engagement.So the next issue that must be addressed is the mechanism of targeting BLNK to the plasma membrane.In the case of T cells,stimulation of TCR drives SH2domain-containing leuko-cyte phosphoprotein of 76kDa (SLP-76),a homologue of BLNK,to the plasma membrane via another adapter molecule that is known as a linker for the activation of T cells (LAT),which is located constitutively in the membrane (77,78).However,expression of LAT is specific for T cells,although its expression was marginally observed at the pre-B cell stage (79,80).Thus,other mechanisms have been sought.Initially,it was proposed that binding of the BLNK SH2domain to phosphorylated Ig a could recruit BLNK to the BCR signaling complex.Indeed,Ig a undergoes phosphorylation of three tyrosine residues,two of which are located in Ig a ITAM,therefore being crucial for binding to the Syk SH2domains.The remaining tyrosine residue (Tyr204)participates in bind-ing to the BLNK SH2domain (81,82).Supporting the in vivo importance of this interaction,BCR-mediated tyrosine phos-phorylation of BLNK was inhibited in B cells harboring the mutation of this third tyrosine in Ig a (Tyr204to Phe)(82,83).The importance of a leucine zipper in the N-terminal region of BLNK was also demonstrated to be essential for its constitutive association to the plasma membrane,presumably by binding to the partner protein (84).Thus,it is likely that some portion of BLNK is constitutively associated with the plasma membrane by using its N-terminal region before BCR stimulation.Once BCR is engaged,BLNK residing intheKurosaki &Hikida ÆTyrosine kinases and their substrates。
护理管理
Towards a theory of quality nursing care for patients with cancer through hermeneutic phenomenologyAndreas Charalambous a ,*,(I)Rena Papadopoulos b ,Alan Beadsmoore caLecturer of Oncology Nursing,Department of Nursing,School of Health Sciences,Cyprus University of Technology,Palaios Dromos Lemesou,Strovolos,Nicosia,Cyprus bMiddlesex University,Research Centre for Transcultural Studies in Health,UK cSenior Lecturer,The Centre for Excellence in Professional Learning from the Workplace,University of Westminster,UKKeywords:Quality nursing care Cancer careHermeneutic phenomenology RicoeurAttributes of quality Descriptive theorya b s t r a c tAim:This paper is a report of a study to describe the attributes of quality nursing narrated by a sample of patients with cancer,their advocates and their nurses.Background:Quality nursing care is a multifaceted concept which is open to interpretation.Studies show that while nurses are striving to succeed in providing quality care for their patients and the patients are urging for better nursing care,the complexity in understanding the concept often causes confusion among patients and nurses.Method:The study was a phenomenological hermeneutical study based on the ideas of the French Philosopher Paul Ricoeur.Twenty-five patients with cancer,six advocates and twenty cancer nurses were recruited in Cyprus by a purposive method.The informants were encouraged to narrate their lived experiences of receiving and providing quality nursing care.A discussion follows whether the findings can be regarded as a theory of quality in cancer care.Findings:Based on the informants’narratives the following six attributes of quality nursing care mate-rialized:a)being valued,b)being respected c)being cared for by communicative and supportive nurses,d)being confirmed,e)being cared for religiously and spiritually and f)belonging.Conclusion:The six attributes can be proposed as a descriptive theory of quality nursing care within the tension between empirical data and pre-understanding.The theory emphasizes the existential needs such as communicated with,being respected,and being cared for which should be considered important when providing nursing care to patients with cancer.Ó2009Elsevier Ltd.All rights reserved.IntroductionThe purpose of this article is to present the evolution of a descriptive theory of the phenomenon of quality nursing care in the cancer care context.Theory is defined as a creative,rigorous structuring of ideas that projects a tentative,purposeful,systematic view of a phenomenon (Chinn and Kramer,1999).Growth and enrichment of theory are important as a foundation for nursing’s knowledge development and epistemic authority.Additionally,the language of theory can provide nurses with common ground for communication,and with symbols and representations of phenomena encompassing the universalities experienced in the particulars of individual lives.If nursing is defined as the study of caring in the human health experience,nurses must first understand what the reality of thatexperience is for those who live it.An integral part of under-standing the reality of the experiences of individuals is the construction of an organized,integrated description of a phenom-enon related to an area of concern.A clear theoretical under-standing and articulation of the phenomenon provides a common language and a point of relativity for nurses which have potential for universal application.Without this common understanding,ambiguity and confusion occur which not only impedes the development of theoretical constructs,but essentially disallows progression in the implementation of caring nursing practice.Theory development is a knowledge development strategy by which one constructs theory through a process of combining isolated pieces of information about a phenomenon that are not yet theoret-ically connected (Walker and Avant,1995).Through this process,a more sophisticated representation of a phenomenon is provided,demonstrating connections between concepts while simultaneously embracing and integrating more aspects of the phenomenon than concept or statement synthesis.The theorist aggregates information*Corresponding author.Tel.:þ35799693478.E-mail addresses: a.charalambous@ ,andreas.charalambous@cut.ac.cy (A.Charalambous).Contents lists available at ScienceDirectEuropean Journal of Oncology Nursingjournal homepage:/locate/ejon1462-3889/$–see front matter Ó2009Elsevier Ltd.All rights reserved.doi:10.1016/j.ejon.2009.04.011European Journal of Oncology Nursing 13(2009)350–360provided by various sources such asfield observations,available data banks,and published researchfindings.A primary purpose of theory development is the representation of a specific phenomenon through an interrelated set of concepts and statements.Health services around the world often refer to quality nursing care without a specific interpretation being proposed or used.The concept is used with an elusive context,open to various interpre-tations and understandings leading to an over conceptualisation of the concept and causing confusion.Quality has been termed as a‘‘nebulous concept’’(Van Maanen,1981)because it lacks constant definition in the literature(Redfern and Norman,l990)and because terms such as quality assurance,standards of care and quality control are often used interchangeably(Nielsen,1992).Therefore, analysing or interpreting a concept as this paper aims at,helps‘‘to clarify overused,vague,concepts.so that everyone who subse-quently uses the term will be speaking of the same thing’’(Walker and Avant,1983,p.27).By analysing a concept,it‘‘becomes useful and meaningful in the discipline.a critical step in the process of developing knowledge related to concepts of interest in nursing’’(Rodgers,2000,p.84).Any attempt to improve the quality of nursing care must begin with a definition of the term quality nursing care.However,there are probably almost as many definitions of quality nursing as there are nurses.Different definitions for quality nursing care have been introduced in the public sector,the private sector(Normand et al., 2002)and more recently by patients themselves(Radwin,2000). This view is strengthened by Gunther and Alligood(2002,p.354) who assert that‘‘the definition of quality from different perspec-tives varies:society judges utilitarian benefits,payers the economic outcomes,patients the personalised attention received,and providers the congruity with professional worldviews and stan-dards’’.They assert that two main distinct,although complemen-tary,frames of reference exist within the process of evaluating and defining the quality of nursing care which this paper addresses in its quest for interpreting the term:(a)that of the patient and(b) that of the nursing profession.According to today’sfigures,one in three people will be diag-nosed with cancer at some point in their lives,and one in four of the population will die from the disease(WHO,2008).Nurses are key professionals in the delivery of expert care to people with cancer. Therefore it is essential that the structure,training and education of the nursing workforce provide nurses with a sound knowledge and understanding of the care needs for cancer patients,their families, significant others and friends.These needs of patients with cancer, their families,significant others or friends need to be incorporated in a commonly structured concept of what constitutes quality nursing care.Summary statementWhat is already known about the topic?Quality nursing care is a concept that attracted the interest of nurse professionals around the world.Quality of nursing care is a multidimensional concept which is difficult to define or measure.Patients and nurses interpret quality nursing care differently. What this paper adds?The attributes of quality nursing care as been understood by patients,advocates and nurses are presented.The possibility of developing theory through Phenomenolog-ical Hermeneutics is discussed.These attributes are considered as the relating concepts ofa descriptive theory of quality nursing care.Quality nursing care is a context specific term.Implications for practice and/or policyBased on the proposed theory,the nursing care for patients with cancer can follow a structured framework on where to focus the nursing actions.The proposed theory can serve as the basis for developing a set of clinical guidelines.Cyprus health care contextCyprus has a mixed health care system,where the public maintains a high level of awareness about choice.Those who choose to pay privately for their treatment are becoming more aware of the value and quality of service they receive for their money.Public hospitals in Cyprus present major differences in relation to the private.Public hospitals are responsible for providing primary,secondary and tertiary care,whereas the private ones are confined to provide second level care,and in some cases, types of preventive care(i.e.diagnostic medicine).The public hospitals are struggling to meet the challenge of increasing demand for health care without an increase of resources.The private hospitals’operation is contingent on market incentives.Because private hospitals are not subsidised and depend on income from clients,it can be argued that they are more inclined than public hospitals to provide quality services and to be concerned about client satisfaction.By doing so,they are not only able to build satisfied and loyal clients who revisit the same facility for future needs,but the clients also serve as a source of referrals who recommend the private establishments to friends and family, thereby sustaining the long-term viability of private hospitals.In terms of the cancer care provided in Cyprus,this is mostly provided by public hospitals.Therefore,when it comes to the sophisticated care required by patients with cancer the majority of the people in Cyprus will turn to the public services.Further to the scarcity of such services in the private sector the high cost of the private cancer care services also posses as an inhibiting element for using these services.MethodDesignThis was a Phenomenological Hermeneutical study inspired by Paul Ricoeur(Ricoeur,1976,1981,1998;Nordam et al.,2003; Lindseth and Norberg,2004).The decision to apply this approach was led by the fact that the inquiry into the nature of the quality of nursing care constitutes both an ontological and epistemological venture;it is the study of the nature of nursing and of nursing knowledge.Hermeneutic phenomenology is conceived of as the philosophy of understanding(phenomenology)and the science of textual interpretation(hermeneutics),and thereby has a two-fold interest (Wiklund et al.,2002).One orientation as reflected in the works of Ricoeur et al.is towards the nature of understanding.In terms of this study the research interviews were in a way narratives about a particular phenomenon of interest,that of‘‘quality nursing care’’. Through the narratives the informants talked about the good or bad practices which can lead to the provision of quality nursing care. They were questioning what is good and bad nursing practice.The task was to gain an understanding of the practices(experiences)A.Charalambous et al./European Journal of Oncology Nursing13(2009)350–360351expressed in the narratives.It is not the texts that were the subject matter to be investigated,but the lived experiences expressed in them(understating).Another orientation focuses on the interpretation of texts.The text to be interpreted can be any written document and according to Ricoeur(1991)it is even possible to consider human actions as text.For the purpose of this study the lived experiences of the informants expressed through the narratives were transcribed verbatim,therefore producing texts that could be interpreted (interpretation).Wiklund et al.(2002,p.115)support the two-fold orientation of hermeneutic phenomenology asserting that:The narrative is a hermeneutic project in itself because it is by narration that we structure our interpretations of the world(i.e.narration is the core of understanding,which was thefirst interest of hermeneutics).By analysing the way the narratives of the world of the respondent are structured,the second interestd that of interpreting texts d can be accomplished.AimThe aim of this study was to describe the lived experiences of patients with cancer and their advocates in relation to the nursing care they receive in oncology departments.In the light of the patients’and advocates’experiences,the views of the nurses providing care to patients with cancer were also explored.ParticipantsThe study was undertaken in Cyprus during the period of2006–2007and the participating hospitals included the3major urban hospitals that provide in-patient cancer care(including surgical treatment).The empirical data derived through a series of subse-quent interviews with25patients with cancer,with20cancer nurses and6key advocates.The samples’size was decided based on the concept of‘‘saturation’’or the point at which no new infor-mation or themes are observed in the data.Patients were purpo-sively selected from the patients’ward list primarily based on their ability and their willingness to participate.Furthermore,certain selection criteria were set:participants were adult patients(ranged in age from21to68years)with cancer(intestine,prostate,lung, liver,breast,stomach)of both sexes and whose health had required hospitalized treatment(i.e.chemotherapy sessions,surgery for relieving symptoms).Patients that required treatment in protective isolation were excluded from the study so that their health was not endangered in any way.Furthermore,newly diagnosed and terminally ill patients were excluded from the sample due to high levels of psychological distress that the patients and their families were experiencing.Eligible nurse informants were from both sexes and all levels of nursing staff with at least one-year experience in cancer care departments.Finally,the patient’advocates were members of management committees and policy makers of the cancer associations with wide experience in issues related to policy making and managing regarding cancer nursing and palliative care. Data collectionThe data collection process included narratives and focus groups.The data were collected in a sequential order commencing with the narratives with the patients with cancer and followed by the focus groups with the patients.The collected data were ana-lysed to form probes for the focus group with the key advocates. Following the analysis from the key advocates the narratives with the nurses were performed.The logic of the sequence followed lies in the intention of the researchers to formulate probes based on the patients’and advocates’experiences,probes on which the nurses could respond to.Therefore a discourse between the informants’narratives evolved which provided the opportunity for conflicting interpretations to materialize.The narratives and focus groups took place at the participating hospitals.Private rooms were used for the patients and the advocates.The data form the nurses were collected in the wards’meeting room.These rooms were selected based on the provision of privacy and quietness during the collection of the data.The informants were encouraged to share their experiences in relation to the provision and receipt of nursing care respectively. They were invited with an initial question‘‘what have your experi-ences in relation to nursing care been like?’’The duration of the narratives varied from35to55min and was tape-recorded and transcribed verbatim by the researchers.Ethical considerationsAnonymity and confidentiality were guaranteed in the reporting of all results and informants were assured that the raw data would not be shared with anyone except the researchers.The informants reserved the right to withdraw their consent to participate at any time without repercussions.The study was reviewed and approved by the Middlesex University–Health Studies Ethics Sub-Committee(HSESC)and the Cyprus Ministry of Health.Data analysisThe interpretation of the text consists of dialectical movements between understanding the text as a whole and explaining the individual parts of the text,between an approach that brings the text close to the interpreter and an approach that distances the interpreter from the text and between what the text is saying and the understanding opened up by the text.Gradually,a compre-hensive understanding of what the text points to is achieved.The interpretation process was based on Ricoeur’s theory of interpre-tation and proceeds through three phases(Ricoeur,1976).This interpretation method provides the interpreter the ability to perform a dialectic movement between understanding and expla-nation.Thefirst phase is the naı¨ve reading/interpretation which is a preliminary interpretation of the whole followed by the structural analysis.In the structural analysis,which is the second phase of the interpretation,consisted of dividing the text into meaning units,i.e. sentences,part of sentences or paragraphs with related meaning content.In thefinal phase the text is again read as a whole,the naı¨ve understanding and the themes are reflected on in relation to the literature and a critical comprehensive understanding is formulated(Charalambous et al.,2008a).FindingsSix main themes emerged:a)being valued,b)being respected c) being cared for by communicative and supportive nurses,d)being confirmed,e)being cared for religiously and spiritually and f) belonging.Thefindings emphasised the influence of the cultural context on the conceptualisation of these themes and its’central place on the produced theory(Diagram1).The themes and sub-themes are presented in the text below.Selective citations are used to illuminate the results.Hermeneutic phenomenology poses a philosophical paradigm in which one can never claim that the interpretation is complete or that thefindings are the‘‘absolute’’truth of the topic under investigation.Ricoeur as cited by Thomp-son(1984,p.53)‘‘It is always possible to argue for or against an interpretation,to confront an interpretation to arbitrate between them and to seek agreement,even if this agreement remainsA.Charalambous et al./European Journal of Oncology Nursing13(2009)350–360 352beyond our immediate reach’’.Therefore,it can never be possible to reach to a commonly accepted‘‘conclusion’’in this kind of study.The results are formulated and presented in everyday language as close to the lived experiences expressed in the narratives as possible.Everyday language originates from essential lived expe-rience.In hermeneutic phenomenology,according to Lindseth and Norberg(2004,p.151)‘‘when we try to express the meaning of lived experience we therefore use everyday language rather than abstract well-defined scientific language.Verbs are better at revealing lived experience than nouns’’.Being valuedBeing valued when accessing the cancer care servicesOne understanding of the meaning of quality nursing care,as disclosed through the narratives,is that quality nursing care is related to being valued when accessing the health care facilities. Most of the informants expressed the fact that they often come up with various accessibility and availability issues when they need hospitalized care.A female patient,45,commented:It is not enough that we have cancer;the ministry does nothing to improve the conditions under which we are admitted to hospitals for treatment or even the hospitals that do actually offer this kind of care.On the same topic a male patient,65,expresses his concerns of having to travel everyday in order to get treated:I have reached my limits.I do not ask much,just some respecton what we are going through.if cancer does not kills us then these stressful conditions will.The same patient also raised the fact that these inequalities in the care they receive(or it is available)might have negative results for their families as well.He commented that:My daughter is forced to take many days off from work to take me to the centre to get treated..This is not only difficult for her work but also for her relationship as she has to be away from her children and husband for many hours during the day[.]. Being valued when receiving nursing careThrough the narratives the informants have expressed the need for‘‘being valuable’’when being cared for by a nurse.The need to care for the patient in a certain way that will promote his/her sense of‘‘being valuable’’was equally raised as a theme by patients and nurses.Patients feel that having cancer is a horrible experience which impacts all aspects of their lives.When hospitalized they expect the nurse to be understanding and supportive in their cancer journey.A female advocate,48,commented:We expect no special treatment for the patients from the nurses, just those necessary things that can make us feel a bit better, that we are still being valued[.]The nurses in the narratives expressed the belief that the patients with cancer are often cared for based on structured nursing plans and not based on their individual needs and concerns.Nurses assert that the way nursing is practice in Cyprus is not promoting indi-vidualized care.Nurses also commented on the fact that due to the lack of specialty(or additional training in relation to cancer care) they oftenfind themselves in difficult situations,especially when newly diagnosed patients or young patients suffering from cancer are involved.A female staff nurse,34,asserted the following:Diagram1.The proposed theory of quality nursing care.This diagram present a schematic presentation of the attributes of quality nursing care as these were expressed in the narratives of patients with cancer,their advocates and the cancer nurses.Thefindings present a formulation of what quality nursing care consists of based on a shared understating drawn between the patients,advocates and the nurses.Each theme appears to be interconnected with the others.Interconnections were presented as these were expressed by the informants in the narratives.Quality nursing care,as a3-dimensional concept(patient–advocate–nurse)can be achieved when the various themes are addressed.There are somewhat steps in the process of achieving quality nursing care.According to thefindings culture plays an important role in the way people perceive the experience of suffering from cancer,being treated for cancer and caring for a patient with cancer.A.Charalambous et al./European Journal of Oncology Nursing13(2009)350–360353I am not always fair to my patients.Not having the necessaryspecialised training in relation to cancer care,makes me feel unable to cope in certain difficult situations.Talking about death and dying is not something that I feel comfortable doing,but I think with the necessary training I could have been much better in dealing with these situations.Being valued when political decisions are takenThe patients and their advocates felt helpless in relation to the political decisions been made from the Ministry of Health.Their needs and concerns appear‘‘invisible’’to the policy makers and the politicians.It seems that regardless of the concept being predom-inately a nursing concept,the informants held a more general idea of the concept of quality which includes administrative issues such as access and availability of resources and services.[.]we have to wait for hours and sometimes even days just to get a bed in order to be treated?That most of us have to travel away from our cities to get treated?(female patient,38)Being respectedBeing respected when receiving informationWhile the informants related the provision of quality nursing care with adequate informing of the patient on his/her health related issues they asserted that generally they were deprived of such information during their hospitalization.The informants claimed that nurses’attitudes are driven by certain negative assumptions and beliefs about giving information to patients.In clinical practice they tend to avoid providing them with the infor-mation they need based on the belief that patients are not inter-ested or able to understand disease related information.A female patient,21,commented that:Some members of the staff do not take you into their confidence and hardly give you any meaningful information[.].On the same sub-theme,a female patient,58,asserted that: The nurses need to understand that I do not know everything about my illness[.]I was diagnosed in November and I am worried on what might happen to me[.]the nurses need to have patience and inform me based on what I need to know.Being respected when health related decisions are been made An issue which the informants identified in the narratives and which was seen as a barrier to the promotion of shared decision-making in clinical practice,derived from the cultural background of the rmants referred to the beliefs and values that people hold in relation to health professionals and especially physicians and nurses.‘‘The icon of the health care professionals as Gods’’.Nurses are perceived by the people as being something like ‘‘Gods’’,and the professionals themselves have an attitude which somewhat matches patients’beliefs.Based on these beliefs it is therefore acceptable for nurses to assume the control of the patients’care,without him/her being an active informant in the whole process and without his/her desires really been raised or being addressed.The majority of the patients and advocates agreed in what has been expressed by a male patient,46:Making decisions in relation to my care is not an issue,at least in my case.It is not whether to decide or not on something,but it is more about how to comply with decisions taken by the nurses and other health professionals.The response by a male patient,44,who said that‘‘If I had more information I would be able to be involved in the decision-making process,and feel that what I think is respected by those taking the decisions’’summarises their willingness to participate and the need for more information to enable them to do so.Being cared for by communicative and supportive nursesBeing communicativeThe patients referring to their communication with their nurses expressed the belief that it holds a central place in the way they experience illness,death,dying and the quality of the nursing care valuing therefore a therapeutic form of mu-nication is inherent in the Greek-Cypriot culture as an important mean that has the potential to positively or negatively influence their experiences.The role of culture in communication issues has been repeatedly stressed in the literature(Moore and Spiegel, 2007;Buken,2003;Schouwstra and Blink,2000).Therefore,they constantly seek to establish good communication with their carers whether these are nurses or other health care professionals.Simi-larly,nurses acknowledged in the narratives the importance of effective communication among health care professionals,patients, and family members in a health care system that fosters continuous healing relationships and care that is customized to meet patients’needs.A female patient,31,commented:It not possible for me to think of quality nursing care outside the context of communication.Being cared for outside this context is like being treated by mute nurses.A male patient who was also recently diagnosed,aged66, asserted thatIt is so stressful having something wrong with your health and know very little about it[.]I need reassurance and support and the nurses can offer these through their knowledge and practice Or it could be that:Religion is something that defines us Cypriots nursing care can never be complete without it(female advocate,47).The nurses while acknowledging the importance of communi-cation with the patient and the family at the same time they believe that in many occasionsfind it difficult to engage in discussions about cancer issues such as diagnosis(i.e.truth-telling)and prognosis.Perhaps the most difficult question that the patient asks me is‘‘Am I going to die?’’.What do you answer to this patient.It is emotionally devastating and sometimes frustrating because I feel unable to respond effectively(female staff nurse,32). Being supportiveThe lack of communication with the nurses was negatively reported by the patients and their advocates.They moved onto assert that without establishing a‘‘healthy’’communicationwith the nurses, the nurse becomes unable to emotionally support the patient.A ‘‘healthy’’communication was a popular expression used by the patients in order to describe a good communication with their nurses.Quality nursing care is about getting the support at every stage of the disease.The cancer journey is a life-time experience and the emotional support from the nurses is something we count onto cope with the disease(female patient,29).Being confirmedBeing in competent handsBeing in good hands when the diagnosis is informed to the patient as well as in the following weeks or months in the hands ofA.Charalambous et al./European Journal of Oncology Nursing13(2009)350–360 354。
英文文献
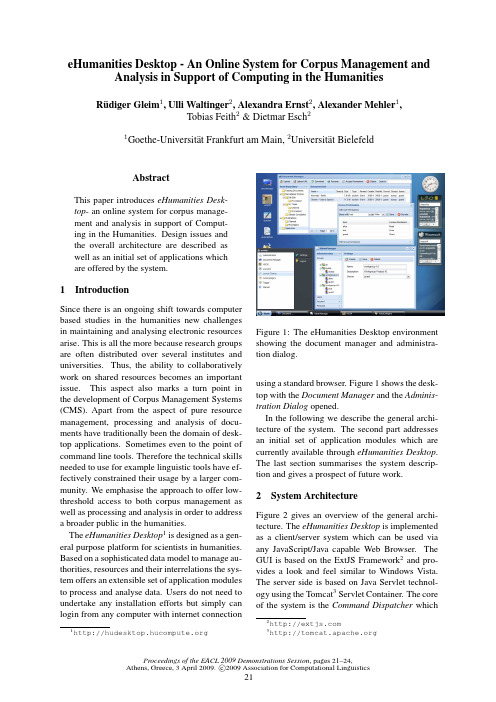
eHumanities Desktop-An Online System for Corpus Management and Analysis in Support of Computing in the Humanities R¨udiger Gleim1,Ulli Waltinger2,Alexandra Ernst2,Alexander Mehler1,Tobias Feith2&Dietmar Esch21Goethe-Universit¨a t Frankfurt am Main,2Universit¨a t BielefeldAbstractThis paper introduces eHumanities Desk-top-an online system for corpus manage-ment and analysis in support of Comput-ing in the Humanities.Design issues andthe overall architecture are described aswell as an initial set of applications whichare offered by the system.1IntroductionSince there is an ongoing shift towards computer based studies in the humanities new challenges in maintaining and analysing electronic resources arise.This is all the more because research groups are often distributed over several institutes and universities.Thus,the ability to collaboratively work on shared resources becomes an important issue.This aspect also marks a turn point in the development of Corpus Management Systems (CMS).Apart from the aspect of pure resource management,processing and analysis of docu-ments have traditionally been the domain of desk-top applications.Sometimes even to the point of command line tools.Therefore the technical skills needed to use for example linguistic tools have ef-fectively constrained their usage by a larger com-munity.We emphasise the approach to offer low-threshold access to both corpus management as well as processing and analysis in order to address a broader public in the humanities.The eHumanities Desktop1is designed as a gen-eral purpose platform for scientists in humanities. Based on a sophisticated data model to manage au-thorities,resources and their interrelations the sys-tem offers an extensible set of application modules to process and analyse ers do not need to undertake any installation efforts but simply can login from any computer with internet connection 1 Figure1:The eHumanities Desktop environment showing the document manager and administra-tion dialog.using a standard browser.Figure1shows the desk-top with the Document Manager and the Adminis-tration Dialog opened.In the following we describe the general archi-tecture of the system.The second part addresses an initial set of application modules which are currently available through eHumanities Desktop. The last section summarises the system descrip-tion and gives a prospect of future work.2System ArchitectureFigure2gives an overview of the general archi-tecture.The eHumanities Desktop is implemented as a client/server system which can be used via any JavaScript/Java capable Web Browser.The GUI is based on the ExtJS Framework2and pro-vides a look and feel similar to Windows Vista. The server side is based on Java Servlet technol-ogy using the Tomcat3Servlet Container.The core of the system is the Command Dispatcher which 23Proceedings of the EACL2009Demonstrations Session,pages21–24, Athens,Greece,3April2009.c 2009Association for Computational Linguisticsmanages the communication with the client and the execution of tasks like downloading a docu-ment for example.The Master Data include infor-mation about all objects managed by the system, for example users,groups,documents,resources and their interrelations.All this information is stored in a transactional Relational Database(us-ing MySQL4).The underlying data model is de-scribed later in more detail.Another important component is the Storage Handler:Based on an automatic mime type5detection it decides how to store and retrieve documents.For example videos and audio material are best stored asfiles whereas XML documents are better accessible via a XML Database Management System or spe-cialized DBMS(e.g.HyGraphDB(Gleim et al., 2007)).Which kind of Storage Backend is used to archive a given document is transparent to the user-and also to developers using the Storage Handler.The Document Indexer allows for struc-ture sensitive indexing of text documents.That way a full text search can be realised.However this feature is not fully integrated at the moment and thus subject of future work.Finally the Com-mand Dispatcher connects to an extensible set of application modules which allow to process and analyse stored documents.These are briefly intro-duced in the next section.To get a better idea of how the described com-ponents work together we give an example of how the task to perform PoS tagging on a text docu-ment is accomplished:The task to process a spe-cific document is sent from the client to the server. As afirst step the Command Dispatcher checks based on the Master Data if the requesting user is logged in correctly,authorized to perform PoS tagging and has permission to read the document to be tagged.The next step is to fetch the docu-ment from the Storage Handler as input to the PoS Tagger application module.The tagger creates a new document which is handed over to the Storage Handler which decides how to store the resource. Since the output of the tagger is a XML document it is stored as a XML Database.Finally the in-formation about the new document is stored in the Master Data including a reference to the original one in order to state from which document it has been derived.That way it is possible to track on which basis a given document has been created.45/assignments/media-types/Finally the Command Dispatcher signals the suc-cessful completion of the task back to the Client. Figure3shows the class diagram of the master data model.The design is woven around the gen-eral concept that authorities have access permis-sions on resources.Authorities are distinguished into users and ers can be members of one or more groups.Furthermore authorities can have permissions to use features of the system. That way it is possible to individually configure the spectrum of functions someone can effectively use.Resources are distinguished by documents and repositories.Repositories are containers,sim-ilar to directories known fromfile systems.An im-portant addition is that resources can be member of an arbitrary number of repositories.That way a document or a repository can be used in different contexts allowing for easy corpus compilation.A typical scenario which benefits from such a data model is a distributed research group consist-ing of several research teams:One team collects data fromfield research,a second processes and annotates the raw data and a third team performs statistical analysis.In this example every group has the need to share resources with others while keeping control over the data:The statistics team should be able to read the annotated data but must not be allowed to edit resources and soon. Figure2:Overview of the SystemArchitecture. Figure3:UML Class Diagram of the Master Data.Figure4:The eHumanities Desktop environment showing a chained document and the PoS Tagger dialog.3ApplicationsIn the following we outline the initial set of appli-cations which is currently available via eHuman-ities Desktop.Figure4gives an idea of the look and feel of the system.It shows the visualisation of a chained document and the PoS Tagger win-dow with an opened document selection dialog.3.1Document ManagerThe Document Manager is the core of the desktop. It allows to upload and download documents as well as sharing them with other users and groups. It follows the look and feel of the Windows Ex-plorer.Documents and repositories can be created and edited via context menus.They can be moved via drag and drop between different repositories. Both can be copied via drag and drop while press-ing the Ctrl-key.Note that repositories only con-tain references-so a copy is not a physical redupli-cation.Documents which are not assigned to any repository the current user can see are gathered in a special repository called Floating Documents.A double click on afile will open a document viewer which offers a rendered view of textual contents. The button’Access Permissions’opens a dialog which allows to edit the rights of other users and groups on the currently selected resources.Finally a search dialog at the top makes documents search-able.3.2PoS TaggingThe PoS-Tagging module enables users to pre-process their uploaded documents.Besides to-kenisation and sentence boundary detection,a tri-gram HMM-Tagger is implemented in the pre-processing system(Waltinger and Mehler,2009). The tagging module was trained and evaluated based on the German Negra Corpus(Uszkoreit et al.,2006)(F-measure of0.96)and the En-glish Penn Treebank(Marcus et al.,1994)(F-measure of0.956).Additionally a lemmatisation and stemming module is included for both lan-guages.As an unifying exchange format the com-ponent utilises TEI P5(Burnard,2007).3.3Lexical ChainingAs a further linguistic application module a lex-ical chainer(Mehler,2005;Mehler et al.,2007; Waltinger et al.,2008a;Waltinger et al.,2008b) has been included in the online desktop environ-ment.That is,semantically related tokens of a given text can be tracked and connected by means of a lexical reference system.The system cur-rently uses two different terminological ontolo-gies-WordNet(Fellbaum,1998)and GermaNet (Hamp and Feldweg,1997)-as chaining resources which have been mapped onto the database for-mat.However the list of resources for chaining can easily be extended.3.4Lexicon ExplorationWith regards to lexicon exploration,the system ag-gregates different lexical resources including En-glish,German and Latin.In this module,not only co-occurrence data,social and terminological on-tologies but also social tagging enhanced data are available for a given input token.3.5Text ClassificationAn easy to use text classifier(Waltinger et al., 2008a)has been implemented into the system.In this,an automatic mapping of an unknown text onto a social ontology is enabled.The system uses the category tree of the German and English Wikipedia-Project in order to assign category in-formation to textual data.3.6Historical Semantics CorpusManagementThe HSCM is developed by the research project Historical Semantics Corpus Management(Jussen et al.,2007).The system aims at a texttechno-logical representation and quantitative analysis of chronologically layered corpora.It is possible to query for single terms or entire phrases.The con-tents can be accessed as rendered HTML as well as TEI P56encoded.In its current state is supports to browse and analyse the Patrologia Latina7.4ConclusionThis paper introduced eHumanities Desktop-a web based corpus management system which offers an extensible set of application modules which allow online exploration,processing and analysis of resources in humanities.The use of the system was exemplified by describing the Document Manager,PoS Tagging,Lexical Chain-ing,Lexicon Exploration,Text Classification and Historical Semantics Corpus Management.Fu-ture work will includeflexible XML indexing and queries as well as full text search on documents. Furthermore the set of applications will be gradu-ally extended.ReferencesLou Burnard.2007.New tricks from an old dog: An overview of tei p5.In Lou Burnard,Milena 6/Guidelines/P57/Dobreva,Norbert Fuhr,and Anke L¨u deling,edi-tors,Digital Historical Corpora-Architecture,An-notation,and Retrieval,number06491in Dagstuhl Seminar Proceedings,Dagstuhl,Germany.Interna-tionales Begegnungs-und Forschungszentrum f¨u r Informatik(IBFI),Schloss Dagstuhl,Germany. Christiane Fellbaum,editor.1998.WordNet:An Elec-tronic Lexical Database.MIT Press,Cambridge. R¨u diger Gleim,Alexander Mehler,and Hans-J¨u rgen Eikmeyer.2007.Representing and maintaining large corpora.In Proceedings of the Corpus Lin-guistics2007Conference,Birmingham(UK). Birgit Hamp and Helmut Feldweg.1997.Germanet-a lexical-semantic net for german.In In Proceedings of ACL workshop Automatic Information Extraction and Building of Lexical Semantic Resources for NLP Applications,pages9–15.Bernhard Jussen,Alexander Mehler,and Alexandra Ernst.2007.A corpus management system for his-torical semantics.Appears in:Sprache und Daten-verarbeitung.Mitchell P.Marcus,Beatrice Santorini,and Mary A.Marcinkiewicz.1994.Building a large annotated corpus of english:The penn puta-tional Linguistics,19(2):313–330.Alexander Mehler,Ulli Waltinger,and Armin Weg-ner.2007.A formal text representation model based on lexical chaining.In Proceedings of the KI2007Workshop on Learning from Non-Vectorial Data(LNVD2007)September10,Osnabr¨u ck,pages 17–26,Osnabr¨u ck.Universit¨a t Osnabr¨u ck. Alexander Mehler.2005.Lexical chaining as a source of text chaining.In Jon Patrick and Christian Matthiessen,editors,Proceedings of the1st Compu-tational Systemic Functional Grammar Conference, University of Sydney,Australia,pages12–21. Hans Uszkoreit,Thorsten Brants,Sabine Brants,and Christine Foeldesi.2006.Negra corpus.Ulli Waltinger and Alexander Mehler.2009.Web as preprocessed corpus:Building large annotated cor-pora from heterogeneous web document data.In preparation.Ulli Waltinger,Alexander Mehler,and Gerhard Heyer.2008a.Towards automatic content tagging:En-hanced web services in digital libraries using lexi-cal chaining.In4th Int.Conf.on Web Information Systems and Technologies(WEBIST’08),4-7May, Funchal,Portugal.Barcelona.Ulli Waltinger,Alexander Mehler,and Maik St¨u hrenberg.2008b.An integrated model of lexical chaining:Application,resources and its format.In Angelika Storrer,Alexander Geyken, Alexander Siebert,and Kay-Michael W¨u rzner, editors,Proceedings of KONVENS2008—Erg¨a nzungsband Textressourcen und lexikalisches Wissen,pages59–70.。
- 1、下载文档前请自行甄别文档内容的完整性,平台不提供额外的编辑、内容补充、找答案等附加服务。
- 2、"仅部分预览"的文档,不可在线预览部分如存在完整性等问题,可反馈申请退款(可完整预览的文档不适用该条件!)。
- 3、如文档侵犯您的权益,请联系客服反馈,我们会尽快为您处理(人工客服工作时间:9:00-18:30)。
Wear267(2009)160–167Contents lists available at ScienceDirectWearj o u r n a l h o m e p a g e:w w w.e l s e v i e r.c o m/l o c a t e/w e arSlurry and cavitation erosion resistance of thermal spray coatingsJ.F.Santa∗,L.A.Espitia,J.A.Blanco,S.A.Romo,A.ToroTribology and Surfaces Group,National University of Colombia,Medellín,Colombiaa r t i c l e i n f oArticle history:Received9September2008Received in revised form9January2009 Accepted10January2009Keywords:Cavitation erosionSlurry erosionThermal spray coatingsWear mechanisms a b s t r a c tThe slurry and cavitation erosion resistance of six thermal spray coatings were studied in laboratory and compared to that of an uncoated martensitic stainless steel.Nickel,chromium oxide and tungsten carbide coatings were applied by oxy fuel powder(OFP)process and chromium and tungsten carbide coatings were obtained by high velocity oxy fuel(HVOF)process.The microstructure of the coatings was analyzed by light optical microscopy(LOM)and scanning electron microscopy(SEM),as well as by X-ray diffraction (XRD).The cavitation erosion resistance of the coatings was measured in a vibratory apparatus according to ASTM G32standard and the slurry erosion tests were carried out in a modified centrifugal pump in which the samples were conveniently placed to guarantee grazing incidence conditions,as well as in a high velocity jet erosion testing machine.The results showed that the slurry erosion resistance of the steel can be improved up to16times by the application of the thermally sprayed coatings.On the other hand,none of the coated specimens showed better cavitation resistance than the uncoated steel in the experiments.The main mass removal mechanisms observed in all the coatings submitted to slurry erosion were micro-cutting and micro-ploughing as well as detachment of hard particles.In cavitation erosion,OFP coatings showed brittle fracture and microcracking,and in nickel-based coatings some ductile deformation was also observed.In HVOF coatings,detachment of small particles led to coalescence of pores in WC/Co coatings while in CrC coatings the main wear mechanism was brittle fracture of particles.Published by Elsevier B.V.1.IntroductionMartensitic stainless steels are widely used in hydroelectric power plants due to their good properties such as corrosion resis-tance,weldability and moderate cavitation erosion and slurry erosion resistance[1].Slurry erosion problems are especially important during rainy seasons in hydroelectric power plants due to the increase in the number of solid particles impacting the surfaces,especially in sys-tems where the installation of an exhaustivefiltration process is not possible[2].Cavitation erosion problems are found in Pelton and Francis runners as well as in other parts of the turbine system as a result of rapid changes in pressure,which lead to the formation of small bubbles or cavities in the liquid.These bubbles collapse near the component’s surface at a high frequency in such a way that the elastic shock wave created is able to cause erosion of the material straight afterwards[3].It is desirable that reparation of the worn components can be accomplished without changing significantly the microstructure of∗Corresponding author.E-mail address:jfsanta@(J.F.Santa).the steel and the shape of the part,in addition to the expected pro-tective effect of the new surfaces against cavitation and erosion.A good way to improve the slurry and cavitation erosion resistance of the components is by the application of thermally sprayed coat-ings[4,5].The term thermal spray describes a family of processes that use chemical or electrical energy to melt(or soften)and accel-erate particles of a material which is then deposited on a surface [6].The quality of the coatings obtained by thermal spray tech-niques is related to the nature of the process and the processing parameters.In some countries hydroelectric power plants are the most important sources of energy and,in order to operate them effi-ciently,the parts in contact withfluids usually require special maintenance procedures including welding repairs and time-consuming heat treatments.On the other hand,thermal spray coatings are a good option to repair components and prevent excessive wear because during the deposition process no significant changes to the microstructure of substrates or excessive deformation are promoted.In this work,six thermal spray coatings were studied in labo-ratory in order to evaluate their resistance to cavitation and slurry erosion.The evaluation was done in order to decide if the coatings were a good option to repair worn parts of hydroelectric turbines0043-1648/$–see front matter.Published by Elsevier B.V. doi:10.1016/j.wear.2009.01.018J.F.Santa et al./Wear 267(2009)160–167161Table 1Processing parameters of coatings a .CoatingFeedstock materialsGas flow (10−4m 3s −1)(cfh)Air pressure (kPa)(psi)Coating rate (10−4kg s −1)(Lbs h −1)Standoff distance (10−3m)(in.)Travel velocity (10−2m s −1)(in.s −1)Density (kg m −3)Ni-1Ni (95%)Al (5%)particles O 2=3.7(35)CH 2=6.6(70)207(30)11(9)200(8)10(3.9)7.7Ni-2Cladded Ni,Cr,Mo,TiO 2=4.3(40)CH 2=5.8(60)241(35)7(10)200(8)13(5.1)7.7WC/Co–Ni WC/Co particles (46%)and Ni–Fe–Cr (54%)O 2=4.1(38)CH 2=5.8(60)207(30)6(13)75(3)10(3.9)13.2CrChromium oxide (100%)O 2=4.3(40)CH 2=5.8(60)76(11)4(10)200(8)8(3.1)5.6aEnglish units are shown along with SI units because all the indications in the equipment controls are given in English system.Fig.1.(a)Cavitation vibratory apparatus according to ASTM G32and (b)modified centrifugal pump for slurry erosion tests.which are submitted to cavitation and slurry erosion under grazing incidence.2.Experimental procedure 2.1.MaterialsThe coatings were applied onto ASTM A743grade CA6NM martensitic stainless steel (from now on,13-4steel),commonly used in turbine components,by OFP (Terodyn 2000gun)and HVOF processes.The deposition parameters chosen for OFP coatings are described in Table 1,while HVOF coatings were applied by a com-mercial manufacturer following proprietary deposition conditions.The 13-4steel was received in the as-cast condition and it was homogenized at 1050◦C for 1h and then air-cooled to room tem-perature.After that,the specimens were tempered at 620◦C for 1h and cooled down in air.The surfaces were prepared by sand blasting to a surface finish-ing of R a =5.4±0.5m.In some cases a nickel-rich bond coat was applied to improve the adhesive strength of the substrate-coating system.The coatings were applied on cylinders with 9.65mm in diameter and 9.65mm in height for slurry erosion testing (modi-fied centrifugal pump)and cylinders with 15.9mm in diameter and 6mm in height for cavitation erosion testing.The jet erosion tests were carried out using test samples with 45mm ×17mm ×5mm.The coated surfaces were machined in order to obtain samples with the same thickness in all cases.2.2.Microstructure and chemical characterizationThe microstructure of the coatings,feedstock materials and worn surfaces was analyzed in a thermoionic scanning electron microscope (SEM)and a light optical microscope (LOM).The char-acterization included measuring of volume fraction of pores and phases by digital image processing (DIP),localized chemical analy-sis with an EDS spectrometer coupled to the SEM,Vickers hardness and micro-hardness measurements and X-ray diffraction analysis(XRD)in a diffractometer with Cu K ␣radiation equipped with a 2D solid-state detector.The XRD patterns were used to identify the phases in the coatings and to understand the phase formation during coatings’build-up.2.3.Wear measurements2.3.1.Cavitation erosion testsCavitation erosion tests were performed using a vibratory appa-ratus according to ASTM G32shown in Fig.1a.Mass losses were measured every hour using a scale with 0.01mg resolution and each test had a duration of 6h.The results were converted to vol-ume losses in order to effectively compare the tested materials.The conditions of the test were as follows (Table 2).2.3.2.Slurry erosion testsThe slurry erosion tests were carried out in a modified centrifu-gal pump described elsewhere [7]in which the specimens were placed at the outlet of the device to ensure grazing incidence of the slurry (Fig.1b).The slurry was composed of distilled water and quartz particles with a mean diameter between 212and 300m (AFS 50/70)and the solids content was 10wt%.The mean impact velocity of the slurry was 10m s −1and the erosion resistance was determined from the mass loss results.Mass losses were measured every 30min by using a scale with 0.01mg resolution.The total duration of each test was 120min.Additional tests were performed in a jet erosion testing machine in which slurry composed of water and 0.4wt%of SiO 2particlesTable 2Testing parameters in cavitation erosion tests.Frequency 20±0.2kHz Amplitude 50±2.5m FluidDistilled water Temperature22±1◦CMass loss measurements Cleaning,drying and mass measurements every hour Total testing time6h162J.F.Santa et al./Wear 267(2009)160–167Fig.2.Schematic of jet erosion tests setup.(AFS 50/70)reached the surface of the samples with an impact velocity of 75m s −1at an incidence angle of 15◦(Fig.2).Only fresh slurry was used for each sample and the tests lasted 4min with measurement of mass losses every 1min.In both wear tests the coatings were tested under grazing incidence using the same abrasive particles at different impact velocities.The testing conditions are similar to those observed in some components of hydraulic turbines such as liners and runners.2.3.2.1.Analysis of worn surfaces.The worn surfaces were analyzed by LOM and SEM in order to identify the wear mechanisms and relate them to the mass loss results.3.Results and discussion3.1.Microstructure of coatings and substrateFig.3shows the microstructure of 13-4steel as well as of the coatings and feedstock materials.Fig.4shows the XRD patterns of the studied coatings,where all the crystalline phases were identified.The microstructure of the steel is composed of martensite (aver-age hardness 280HV 62,5)with 15%retained austenite and 4%delta ferrite (␦)[8].Fig.3.Microstructure of 13-4stainless steel,thermal spray coatings and feedstock materials.J.F.Santa et al./Wear267(2009)160–167163Fig.4.XRD patterns of the thermal spray coatings used in this work.Ni-1coating is composed of14.6±1.2%aluminum oxide particles(1533HV25gf,15s)and Ni splats(191HV300g,15s).DIP mea-surements reported2.9±1.2%porosity.XRD patterns revealed that the oxides do not have a crystalline system as a consequence of the high cooling rates during coatings build-up.[9].The average thickness of the as-sprayed coatings was650m.Ni-2coating is composed of Ni–Fe–Mo–W–Si particles(385 HV50gf,15s)and titanium oxide particles(701HV50gf,15s).DIP mea-surements reported4.4±1.5%porosity.As described for Ni-1,the oxides in the coatings do not have a crystalline system although the XRD pattern of feedstock powder revealed the presence of a crystalline titanium oxide(TiO2).The average thickness of the as-sprayed coatings was760m.WC/Co–Ni coating is composed of46±2%Ni–Fe–Cr(639 HV300g,15s)particles and54±3%of WC/Co and WC particles(1211 HV HV300g,15s)as reinforcement.The volume fraction of pores was estimated to13.7±3.8%by DIP of SEM images.The coating has partially crystalline Co4W2C carbides which were identified by a convex zone near40◦in XRD patterns(Fig.4).The average thickness of the as-sprayed coatings was820m.Cr coating is composed mainly of Chromium oxide Cr2O3(1853 HV300g,15s)with a porosity of30%.The as-sprayed surfaces had some cracks and the morphology of splats can be described asflower shaped[7].It is noteworthy that these splats reported very low values of cohesion among lamellas.The average thickness of the as-sprayed coatings was450m.The microstructure of WC/Co HVOF coating is composed offine tungsten carbides(WC)in a Co matrix with a porosity of2%,which is considerably lower than that measured in OFP ceramic coatings. The average thickness of the as-sprayed coatings was85m.CrC HVOF coatings showed a very heterogeneous thickness, which caused that in some areas the uncoated steel was actually exposed.The coatings microstructure is composed of Cr3C2and metallic Ni.Other peaks identified in the XRD pattern were related to the substrate as a consequence of X-ray penetration.The average thickness of the as-sprayed coatings was40m.Generally speaking,the microstructure of the OFP coatings is related to what is commonly expected for this deposition process as the particles impact the surfaces at low temperatures and low velocities,which cause defects such as pores,partially melted par-ticles and others.Regarding the HVOF coatings,porosity levels are significantly lower than those observed in OFP samples even with presence of elevated volume fractions of ceramic phases with high melting points.This is coherent with the nature of HVOF process, in which a high amount of kinetic energy is given to the particles to reach velocities up to800m s−1.3.2.Cavitation erosion testsFig.5shows the volume losses measured after cavitation erosion tests,as a function of testing time.It can be seen that the uncoated stainless steel(13-4)showed the best cavitation resistance of all the samples tested.Among the coatings,the best behavior was reported by CrC(HVOF)coating followed by WC/Co–Ni.Although none of the tested coatings showed incubation period(mass losses were mea-sured from the beginning of the tests),the Ni-2and CrC coatings had uniform wear rate during the entire test.In the specific case of the CrC HVOF coating,it is believed that its good behavior is the result of insufficient coating thickness as SEM observations revealed that the surface of the stainless steel was reached soon after the begin-ning of the tests.In all the other cases,SEM examination of worn surfaces confirmed that the substrate was not exposed.The volume losses reported by Cr coating(omitted in Fig.5)were extremely high and prevented any possibility for this coating to be considered a good option to protect against cavitation.How-ever,a reduction of porosity could probably result in an increase of164J.F.Santa et al./Wear267(2009)160–167Fig.5.Cumulative volume losses in cavitation erosion tests performed according to ASTM G32standard.the cavitation resistance of these coatings due to their high hard-ness.3.2.1.Analysis of worn surfaces and identification of wear mechanisms in cavitation erosionThe examination of worn surfaces in stereoscopic microscope revealed different features for each material(Fig.6).WC/Co–Ni coating showed detachment of large particles of WC/Co from the surface,which caused high volume losses and was related to pre-vious cracks formed during the growth of the coating as a result of high cooling rates and differences among the thermal expansion coefficients of the phases in the microstructure(Fig.7a).In Ni-rich coatings,on the other hand,the surfaces showed typical plas-tic deformation marks and no detachment effects were observed although SEM inspection of the as-sprayed surfaces showed that aluminum oxides were also cracked from the deposition process (Fig.7b).The main mass removal mechanism for13-4stainless steel was fatigue delamination due to accumulation of plastic deformation, which was revealed by the presence of deformation bands in highly deformed areas(Fig.8a).Ni-1and Ni-2coatings showed fracture of oxides and the formation of small cavities in Ni splats(Fig.8b and c).WC/Co particles of WC/Co–Ni coatings showed sharp surfaces as consequence of propagation of cracks(Fig.8d).In WC/Co HVOF coatings the removal mechanism was coales-cence of pores,which were created as a result of a process that began with the erosion of the Co binder followed by detachment of small particles of WC(Fig.8e).In CrC HVOF coatings,portions of the coating detached from substrate due to adhesion problems and the remaining areas showed ductile deformation of Ni particles and detachment of CrC(Fig.8f).3.3.Slurry and jet erosion testsFigs.9and10show the cumulative volume loss after slurry ero-sion tests carried out in modified centrifugal pump and jet erosion device,respectively.Generally speaking,no running-in period was observed probably as a consequence of the high severity of the tests.A significant improvement in the erosion resistance of the 13-4stainless steel was obtained by application of the OFPcoatings, Fig.6.Worn surface observed in stereoscopicmicroscope.Fig.7.Surfaces of as-sprayed coatings showing cracks formed during the deposition of the layers.J.F.Santa et al./Wear 267(2009)160–167165Fig.8.Worn surfaces of thermal spray coating tested in cavitation erosion.Ni coatings showed pits formation in splats.Hard phases in WC/Co and CrC coatings showed brittlebehavior.Fig.9.Cumulative volume losses in slurry erosion in modified centrifugal pump.Impact velocity 10m s −1.Solids content 10wt%SiO 2particles.Fig.10.Cumulative volume losses in jet erosion tests.Impact velocity 75m s −1.Solids content 0.4wt%SiO 2particles.being the WC/Co–Ni the best option in all cases.By considering the total volume loss measured at the end of the tests,under low veloc-ity impingement conditions (centrifugal pump)the improvement factor was 5:1while in the jet erosion tests it increased to 16:1.3.3.1.Analysis of worn surfaces and identification of wear mechanisms in slurry and jet erosion testsThe surface of the coated specimens tested in the modified cen-trifugal pump showed two distinct regions when observed in the stereoscopic microscope (Fig.11):the first one was typical of severe erosion conditions with deep and abundant grooves in metallic areas and microcracks in ceramic phases,although the erosive par-ticles did not reach the steel substrate in any case.In the second region mild wear was predominant since no significant changes were observed at the worn surfaces with respect to the as-sprayed condition.In both zones,the wear patterns were typical of erosion under grazing incidence (with micro-cutting and micro-ploughing marks)and also beach marks were evident (Fig.11a).In all cases,during the testing time the substrate was not reached by the erodent particles so the wear resistance of the coatings could be effectively compared.In some regions of the Cr coatings the lack of adhesion among lamellaes caused detachment of the coating (Fig.11c).This behavior is supposed to be a consequence of the low energy deliv-ered to the particles during coating formation and it is a limitation of the OFP technique.In jet erosion tests,on the other hand,the wear patterns observed in the stereoscopic microscope varied depending on the tested material (Fig.12).The worn surface of WC/Co–Ni coatings exhibited both severe wear (marked by the arrow in Fig.12a)and mild wear regions,while Ni-2coating and 13-4stainless steel (Fig.13d)showed homogeneous patterns along the entire worn area.The examination of the worn surfaces by SEM revealed details on the wear mechanisms and their relationship with the microstruc-ture for both erosion tests.Titanium oxide particles cracked and detached from Ni-2coating’s surface (Fig.13a and f)leaving the Ni matrix unprotected.As a consequence of detachment of hard phases,the erodent particles caused micro-cutting and micro-ploughing.Although this mechanism was similar in both erosion166J.F.Santa et al./Wear267(2009)160–167Fig.11.Wear mechanisms in slurry erosion tests(centrifugal pump).Fig.12.Wear mechanisms in jet erosion tests.Fig.13.Worn surfaces of thermal spray coatings tested in slurry and jet erosion.J.F.Santa et al./Wear267(2009)160–167167tests,the degree of plastic deformation of single splats was signifi-cantly higher in the jet erosion tests.Cr coatings showed high mass losses due to brittle fracture of lamellas as a result of intersection of cracks and delamination effects,with no evidence of plastic deformation or ploughing marks (Fig.13c).Very low values of adhesion/cohesion strength were found(4.9±0.6MPa)after measurements carried out according to ASTM C633standard,which verified the prejudicial effect of the brittle behavior of the microstructure.WC/Co coatings showed micro-cutting of Ni splats as well as brittle fracture of WC/Co lamellas(Fig.13b and e).Also,a number of small cavities,probably formed by a synergistic corrosion–erosion mechanism[10],were observed in WC/Co particles.However,since Ni particles are expected to be more sensitive to corrosion than WC/Co particles,this hypothesis needs to be studied in detail and verified with the aid of critical experiments.4.ConclusionsSlurry and cavitation erosion tests of six thermal spray coat-ings and a bare13-4stainless steel were performed in laboratory in order to determine their wear resistance and identify the main wear mechanisms acting on the surfaces.The main conclusions of this work are-The cavitation erosion resistance of the studied coatings was lower than that of uncoated stainless steel in all cases.This was attributed to high porosity,low cohesion between splats and pre-existent cracks in the coatings.To overcome these drawbacks a number of options are available,i.e.changing the application technique,optimizing some process parameters,among others. -The slurry erosion resistance of the13-4stainless steel was improved by deposition of thermally sprayed coatings with differ-ent microstructures and chemical compositions,being obtained the best results with a WC/Co–Ni coating.-The main mass removal mechanisms observed in thermal spray coatings after cavitation tests were brittle fracture of hard phases and fatigue of ductile areas.In slurry and jet erosion tests the dom-inant wear mechanisms were micro-cutting and micro-ploughing of softer phases and,in some cases,detachment of hard particles.AcknowledgmentsThe authors thank the Empresas Públicas de Medellín E.S.P for their technical support.Financial support provided by Colciencias-EPM-UNAL project no.20201005975is also acknowledged. References[1]H.J.Niederau,in:K.H.Miska(Ed.),State of Development of Soft MartensiticStainless Chromium Nickel Steels,Climax Molybdenum Company,1997.[2]T.Kachele,Recent research results on predicting and preventing silt erosion,in:Proceedings of the First International Conference on Silting Problems in Hydropower Plants,October1999,India,1999.[3]S.C.Li,Cavitation of Hydraulic Machinery,Imperial College Press,2000.[4]K.Sugiyama,et al.,Slurry wear and cavitation erosion of thermal-sprayed cer-mets,Wear Volume258(2005)768–775.[5]J.S.Boy,et al.Cavitation-and Erosion-Resistant Thermal Spray Coatings USAC-ERL Technical Report97/118,July1997.[6]L.Pawlowski,The Science and Engineering of Thermal Spray Coatings,JohnWiley&Sons Ltd.,London,1995.[7]J.F.Santa,J.C.Baena,A.Toro,Slurry erosion of thermal spray coatings and stain-less steels for hydraulic machinery,Wear263(2007)258–264.[8]H.Pacheco,Phase Transformation Caused by a Post Weld Heat Treatment inASTM A743CA6NM Stainless Steel,National University of Colombia,2008. [9]F.Longo,Coating operations,in:Handbook of Thermal Spray Technology,ASMInternational,2004,pp.120–127.[10]M.M.Stack,T.M.Abd El-Badia,Some comments on mapping the combinedeffects of slurry concentration,impact velocity and electrochemical potential on the erosion–corrosion of WC/Co–Cr coatings,Wear264(2008)826–837.。