PV+Test_Glossary_01
汽车行业常用缩写
Glossary of Terms术语Glossary of Terms术语AAR: Appearance Approval Report 外观批准报告A/D/V: Analysis/Development/Validation 分析/开发/验证A/D/V–DV: ADV Design Validation ADV设计验证A/D/V P&R: Analysis/Development/Validation Plan and Report. This form is used to summarize the plan and results for validation testing. Additional information can be found in the GP-11 procedure.分析/开发/验证计划和报告A/D/V–PV: ADV Product Validation ADV产品验证AIAG: Automotive Industries Action Group, an organization formed by General Motors, Ford and Daimler-Chrysler to develop common standards and expectations for automotive suppliers. 汽车工业行动集团AP: Advance Purchasing 先期采购APQP: Advanced Product Quality Planning 产品质量先期策划APQP Project Plan: A one-page summary of the SGM APQP process that describes the tasks and the timeframe in which they occur. APQP项目策划AQC:Attribute Quality Characteristic 属性质量特性ASQE: Advanced Supplier Quality Engineer 先期供应商质量工程师BIW: Body in White. Usually the bare metal shell of the body including doors and deck lid prior to paint and trim. 白车身BOM: Bill of Materials 材料清单BOP:Bill of Process 过程清单Brownfield Site: An expansion of an existing facility. 扩建场地CMM: Coordinate Measuring Machine 三坐标测试仪Cpk: Capability Index for a stabile process 过程能力指数CTC: Component Timing Chart DRE document 零部件时间表DRE文件CTS: Component Technical Specifications 零部件技术规范CVER: Concept Vehicle Engineering Release 概念车工程发布DC: Design Complete 设计完成Defect outflow detection: A phrase used in the Supplier Quality Statement of Requirements that refers to in-process or subsequent inspection used to detect defects in parts. 缺陷检测DFM/DFA: Design for Manufacturability / Design for Assembly 可制造性/可装配性设计DFMEA: Design Failure Modes and Effects Analysis. It is used to identify the potential failure modes of a part, associated with the design, and establish a priority system for design improvements. 设计失效模式和后果分析DPV: Defects per vehicle 每辆车缺陷数DR: Documentation Required DR特性DRE: Design Release Engineer 设计释放工程师DV: Design Validation 设计验证E&APSP: Engineering & Advance Purchasing Sourcing Process. 工程&先期采购定点程序EP: E-Procurement 电子采购流程Error Occurrence Prevention: A phrase used in the Supplier Quality Statement of Requirements that refers to poke yoke or error-proofing devices used to prevent errors in the manufacturing process from occurring. 防错FTQ: First Time Quality 一次通过质量GA: General Assembly 总装GD&T: Geometric Dimensioning & Tolerancing 几何尺寸与公差SGM: Shanghai General Motors 上海通用汽车GMAP: General Motors Asian Pacific 通用汽车亚太GME: General Motors Europe 通用汽车欧洲GMNA: General Motors North American 通用汽车北美GP: General Procedure 通用程序GPDS: Global Product Description System 全球产品描述系统GPS: Global Purchasing System 全球采购系统GPSC: Global Purchasing & Supplier Chain 全球采购及供应链GR&R: Gage Repeatability and Reproducibility 检具重复性及再现性Greenfield Site: A new supplier facility that is built to support a program.GVDP: Global Vehicle Development Process 全球整车开发流程IPTV: Incidents per Thousand Vehicles 每千辆车故障IVER: Integration Vehicle Engineering Release 集成车工程发布KCC: Key Control Characteristics. It is a process characteristic where variation can affect the final part and/or the performance of the part. 关键控制特性KCDS: Key Characteristic Designation System 关键特性指示系统Kick-Off Meeting: The first APQP supplier program review. 启动会议第一次APQP供应商项目评审KPC: Key Product Characteristic. It is a product characteristic for which reasonably anticipated variation could significantly affect safety, compliance to governmental regulations, or customer satisfaction. 关键产品特性LAAM: General Motors Latin American, Africa & Meddle East 通用汽车拉丁美洲、非洲及中东LCR: Lean Capacity Rate. It is the GM daily capacity requirement. 正常生产能力MCR: Maximum Capacity Rate. It is the GM maximum capacity requirement. 最大生产能力MOP: Make or Purchase 制造/采购MPC: Material Production Control 物料生产控制MPCE: Material Production Control Europe 欧洲物料生产控制MRD: Material Required Date; date material must be delivered in order to allow a build event to begin. 物料需求日期MSA: Measurement Systems Analysis 测量系统分析MVBns: Manufacturing Validation Build non-saleable 非销售车制造验证MVBs: Manufacturing Validation Build saleable 销售车制造验证NBH: New Business Hold 停止新业务Notice of Decision 决议通知OEM: Original Equipment Manufacturer 主机客户PAD: Production Assembly Documents 生产装配文件PC&L: Production Control & Logistics 生产控制&物流PDT: Product Development Team 产品开发小组PFMEA: Process Failure Modes and Effects Analysis. It is used to identify potential failure modes associated with the manufacturing and assembly process. 过程失效模式和后果分析PPAP: Production Part Approval Process 生产件批准程序Ppk: Performance index for a stable process 过程能力指数PPM: 1 Program Purchasing Manager, 2 Parts per Million rejects and returns to suppliers 1项目经理2每百万件的产品缺陷数PPV: Product & Process Validation 产品及过程验证PQC: Product Quality Characteristic 产品质量特性PR/R: Problem Reporting & Resolution 问题报告及解决PSA: Potential Supplier Assessment, a subset of the Quality System Assessment QSA 潜在供应商评审PV: Product Validation 产品验证QSA: Quality System Assessment 质量体系评审QSB: Quality Systems Basics 质量体系基础QTC: Quoted Tool Capacity 工装报价能力RASIC: Responsible, Approve, Support, Inform, Consult 负责、批准、支持、通知、讨论RR: Run at Rate 按节拍生产RFQ: Request For Quotation 报价要求RPN: Risk Priority Number related to FMEA development 风险顺序数RPN Reduction Plan: An action plan that describes what is being done to reduce the risk priority number for items listed in the DFMEA or PFMEA.降低RPN值计划SDE: Supplier Development Engineer 供应商开发工程师SFMEA: System Failure Mode and Effects Analysis 系统失效模式分析SMT: System Management Team 系统管理小组SOA: Start of Acceleration 加速开始SORP: Start of Regular Production 正式生产SOR: Statement of Requirements 要求声明SPC: Statistical Process Control 统计过程控制SPO: General Motors Service and Parts Operations 通用汽车零件与服务分部SQ: Supplier Quality 供应商质量SQE: Supplier Quality Engineer 供应商质量工程师SQIP: Supplier Quality Improvement Process 供应商质量改进过程SSF: Start of System Fill 系统填充开始SSTS: Sub-system Technical Specifications 子系统技术规范Sub-Assembly/ Sub-System: An assembly of sub-components delivered to the SGM main production line for installation to the vehicle as a single unit.Subcontractor: The supplier of a sub-component to a Complex System/Subassembly supplier Tier 2, 3, etc. 分供方SVE: Sub-System Validation Engineer 子系统验证工程师SVER: Structure Vehicle Engineering Release. 结构车工程发布Team Feasibility Commitment: An AIAG APQP form that is provided with the Request for Quotation. It is the supplier’s concerns with the feasibility of manufacturing the part as sp ecified. 小组可行性承诺TKO: Tooling Kick-Off 模具启动会议UG: Unigraphics UG工程绘图造型系统VLE: Vehicle Line Executive 车辆平台负责人VTC: Validation Testing Complete 验证试验完成EWO: Engineering Work Order 工程工作指令。
pvsyst使用讲解

pvsyst使用讲解PVsyst是一款用于太阳能光伏系统设计和模拟的软件。
它提供了全面的工具和功能,用于评估太阳能光伏系统的性能和效益。
以下是使用PVsyst的一般步骤:1. 创建新项目:打开PVsyst软件,点击“File”菜单,选择“New Project”来创建一个新的项目。
在弹出的对话框中,输入项目的名称和位置。
2. 定义系统参数:在“Project”菜单下,选择“Project Parameters”来定义太阳能光伏系统的一些基本参数,如系统类型、倾斜角度、朝向等。
3. 添加天气数据:在“Project”菜单下,选择“Add Meteo Data”来添加所在地区的天气数据。
PVsyst会根据这些数据来进行系统性能的模拟和分析。
4. 设计阵列:在“Project”菜单下,选择“Design Array”来设计光伏阵列。
可以定义阵列的规模、组件类型、布局和排列方式等。
5. 进行模拟分析:在“Simulation”菜单下,选择“Simulation”来进行系统的模拟分析。
PVsyst会根据定义的系统参数和天气数据,计算出系统的产能和效益。
6. 查看结果:PVsyst会生成详细的模拟结果和报告。
可以在软件界面上直接查看,也可以导出为PDF或其他格式的文件。
7. 进行优化:根据PVsyst的模拟结果,可以进一步优化光伏系统的设计和参数。
可以尝试不同的倾斜角度、组件类型、阵列布局等,以提高系统的性能和效益。
除了上述基本步骤外,PVsyst还提供了许多其他的功能和工具,如阴影分析、电池储能模拟、经济性分析等。
用户可以根据实际需求,灵活地使用这些功能来设计和优化太阳能光伏系统。
最新国内外光伏系统及部件技术标准介绍

3. Cable marking, cable track (关于电缆核标识)
4. Multi - MPPT modules inputs 18日 5. IEC62446 测试项目 power quality, efficiency, I-V curve test 6. IEC 62548(光伏系统安装与安全)即将形成投票稿CDV
光伏系统
平衡系统部件 聚光光伏组件
Joint Working Group 1 联合工作组 (TC82/TC88/TC21/SC21A)
TC82目前下设6个工作组
符 号 WG1 Glossary 工作内容 中国代表 无
WG2
WG3 WG6 WG7 JWG1
PV Cells and Modules
PV Systems
工作组 14日
WG6 1. Emission Issues 2. IEC 62790 ed.1 (光伏组件接线盒) 3. IEC 62109 (-1功率变换器一般性要求,-2逆变器)
15日
4. PV Switchgear (光伏接触器、直流开关、电缆、直流保险等)
5. Islanding IEC 62116 (防孤岛) 6. Arc Prevention (UL1699B) 7. IEC62903 Maintenance (除了光伏组件之外的BOS部件的可靠性要求和试验) 8. MPPT EN 50530 9. Data Sheet of inverters EN 50524 10. PV fire protection
15
6 3 2 3
Balance of System (BOS) Components
Concentrator Modules Joint Working Group 1 (TC82/TC88/TC21/SC21A)
Infoprint 250 導入と計画の手引き 第 7 章ホスト
SUBNETMASK
255.255.255.128
Type of service...............: TOS
*NORMAL
Maximum transmission unit.....: MTU
*LIND
Autostart.....................:
AUTOSTART
*YES
: xx.xxx.xxx.xxx
: xx.xxx.xxx.xxx
*
(
)
IEEE802.3
60 1500
: xxxx
48 Infoprint 250
31. AS/400
IP
MTU
1
1
IPDS TCP
CRTPSFCFG (V3R2)
WRKAFP2 (V3R1 & V3R6)
RMTLOCNAME RMTSYS
MODEL
0
Advanced function printing............:
AFP
*YES
AFP attachment........................:
AFPATTACH
*APPC
Online at IPL.........................:
ONLINE
FORMFEED
*CONT
Separator drawer......................:
SEPDRAWER
*FILE
Separator program.....................:
SEPPGM
*NONE
Library.............................:
出厂验收测试FAT

Supplier 制造商
嘉华通软
工厂测试方案
二、 确认内容................................................................................................................................................... 6 II. Content of confirmation.................................................................................................................................. 6 (Ⅰ) 文件检查 .................................................................................................................................................... 6 (Ⅰ) Document inspection ................................................................................................................................... 6 (二)配置检查................................................................................................................................................. 8 (Ⅱ)Configuration inspection ......................................................................................................................... 8
pvelite培训手册
PVElite 培训手册北京艾思弗计算机软件技术有限责任公司二零零六年五月三十日目录1概述 (5)1.1Pvelite特性 (5)1.2主要功能 (5)1.2.1Shell&Head 壳体、封头 (5)1.2.2Nozzle 管口 (5)1.2.3Conical Section 锥壳 (5)1.2.4Flanges 法兰 (5)1.2.5Floating Head 浮头 (5)1.2.6TEMA和PD5500 管板 (6)1.2.7WRC107 和WRC297 (6)1.2.8Thin joints 薄膨胀节 (6)1.2.9Thick joints 厚膨胀节 (6)1.2.10ASME管板 (6)1.2.11Rectangular Vessels 矩形容器 (6)1.2.12Horizontal Vessels 卧式容器 (6)1.2.13Vertical Vessels 立式容器 (6)2操作界面 (7)3容器数据 (13)3.1Design Constraints 设计参数 (13)3.2ASME Steel Stack (16)3.3Design Modification 设计修改 (16)3.4Load Case 工况组合 (16)3.4.1Load 载荷 (16)3.4.2Load Case 工况组合 (18)3.4.3与工况有关的其它要求 (18)3.5Nozzle Design Options管口设计选项: (19)3.6风、地震数据 (19)3.6.1风载荷 (19)3.6.2地震数据 (25)4元件参数 (33)4.1元件基本参数: (33)4.2元件附加参数 (34)4.2.1Cylindrical 圆筒 (34)4.2.2Elliptical 椭圆形封头 (34)4.2.3Torispherical 碟形封头 (35)4.2.4Spherical Head 半球形封头 (35)4.2.5Conical Head or Shell Segment 锥形封头或锥形过渡段 (35)4.2.6Welded Flat 焊接平盖 (36)4.2.7Flange Analysis 法兰分析 (36)4.2.8Skirt Support with base ring 裙座(带螺栓底座环) (42)4.3容器详细参数 (46)4.3.1附件基本数据: (47)4.3.2Ring 加强圈 (47)4.3.3Nozzle 管口 (51)4.3.4Lung 支耳 (65)4.3.5Saddles鞍座 (66)4.3.6Trays塔盘 (71)4.3.7Leg支腿 (71)4.3.8Packing填料 (74)4.3.9Liquid 介质 (75)4.3.10Insulation 保温 (77)4.3.11Lining 衬里 (78)4.3.12Platform (78)4.3.13Weight 重量 (79)4.3.14外载 (80)5换热器 (82)5.1Tubesheet Type and Design Code 管板型式和设计标准 (82)5.2Tubesheet Properties 管板参数 (84)5.3Tube Data 换热管参数 (87)5.4Expension Joint Data 膨胀节数据 (90)5.5Load Cases 载荷组合(工况) (93)5.6Floating Tubesheet 浮动管板 (94)5.7Floating Head浮头盖 (95)5.8钩圈参数 (95)6Analyze 分析 (97)7输入有关的部分ASME条文说明 (98)7.1UG-45接管径部厚度 (98)7.2标准管壁的最小壁厚 (98)7.3补强件的强度 (98)7.4开孔补强 (99)8术语定义 (100)9附录 规范公式和规则应用举例 (103)9.1内压容器 (103)9.1.1具有焊接接头的容器筒体和封头焊接接头系数规则应用 (103)9.2承受附加载荷的受内压壳体的厚度计算 (109)9.3外压容器 (114)9.4外压作用下客器允许的最大不圆度 (117)9.5外压圆柱形壳体周向加强圈的设计 (118)9.6凸面受压的成型封头所需厚度 (119)9.7开孔和补强 (122)9.7.1焊接连接 (122)9.8管孔带 (137)9.9应用UCS-66规程确定最低许用最小设计金属温度(MDMT)的例子 (138)1 概述1.1 Pvelite特性PVelite计算软件是基于国家标准,如:ASME锅炉压力容器标准,或工业标准,如:卧式容器Zick分析方法。
CS5381-KZZ;CS5381-KSZ;CS5381-KZZR;CS5381-KSZR;中文规格书,Datasheet资料

192 kHz ! 260 mW Power Consumption ! High-Pass Filter or DC Offset Calibration ! Supports Logic Levels between 5 and 2.5 V ! Differential Analog Architecture ! Low-Latency Digital Filtering ! Overflow Detection ! Pin-Compatible with the CS5361
Analog Supply 5V
Digital Supply 3.3 V to 5 V
Interface Supply 2.5 V to 5 V
Differential Inputs
Differential Inputs
Internal Voltage Reference
Switch-Cap ADC
Switch-Biblioteka ap ADCDigital Filters
Digital Filters
Level Translator
光伏建筑设计指南(英文版)

Photovoltaics in BuildingsA Design GuideMax Fordham & Partners In Associationwith Feilden Clegg ArchitectsThe work described in this report was carried out under contract as part of the New and Renewable Energy Programme, managed by ETSU on behalf of the Department of T rade and Industry. The views and judgements expressed in this report are those of the contractor and do not necessarily reflect those of ETSU or the Department of T rade and Industry.Photovoltaics in BuildingsA Design GuideReport No ETSU S/P2/00282/REPMarch 1999PROJECT TEAMMax Fordham & Partners42/43 Gloucester CrescentLondonNW1 7PERandall Thomas (Principal Author)Tim GraingerFeilden Clegg ArchitectsBath BreweryT oll Bridge RoadBathBA1 7DEBill GethingMike KeysIllustrations:Anthony Leitch Design66 St. Albans RoadKingston upon ThamesKingstonKT2 5HHFirst Published 1999© Crown Copyright 1999iiContents1.Introduction12.What are photovoltaics?42.1Introduction42.2PVs42.3How much energy do PV systems produce?83.PVs on buildings153.1Introduction153.2The Brief153.3Site considerations163.4Building type163.5Design and construction193.6Forms and systems213.7What difference do PVs make?274.Costs and sizing314.1Introduction314.2Costs314.3Sizing the array324.4The future of costs375.PVs in buildings395.1Introduction395.2Grid-connection and metering395.3System considerations405.4Modules and cables435.5Plant rooms456.Case study476.1Introduction476.2Site and brief476.3Design development516.4Future detailed design556.5Project data55Appendix A57References and bibliography61Glossary62Illustration acknowledgements65Contacts66iiiList of T ablesT able 2.1PV efficiencies5T able 2.2Comparison of array outputs (MWh/y)(London data; unshaded arrays)12T able 3.1Annual approximate electrical energy requirement18T able 3.2Roof systems25T able 3.3Facade systems26T able 4.1 Approximate costs of conventional systems (installed)31T able 4.2 Approximate costs of PV cladding systems (installed)31T able 4.3Basic data for a PV installation36T able 6.1Data summary55List of FiguresFigure 1.1Model of the design for a PV canopy at theEarth Centre, Doncaster1Figure 1.2Solar Office, Doxford (near Newcastle upon T yne)1Figure 1.3BP Solar Showcase2Figure 1.4Solar irradiation over Europe (kWh/m2/y)3Figure 2.1 Diagram of PV principle4Figure 2.2 Direct and diffuse radiation4Figure 2.3 PV modules on a solar plane4Figure 2.4 Solar Office, Doxford4Figure 2.5 A Cambridge tree, near an array of 17th centurysolar collectors (ie windows)5Figure 2.6 Crystalline silicon cell5Figure 2.7 T ypical module constructions6Figure 2.8 TFS using amorphous silicon6Figure 2.9 TFS module with metal backing sheet and plastic cover6Figure 2.10Schematic of a typical grid-connected PV system7Figure 2.11 Module Man (with apologies to Le Corbusier)7Figure 2.12 Tilt and azimuth8Figure 2.13 UK annual average solar radiation (kWh/m2/day)9Figure 2.14 Y early irradiation map for London10Figure 2.15 Y early irradiation map for Cambridge10Figure 2.16 Irradiation map for Leeds10Figure 2.17 Irradiation map for Eskdalemuir11Figure 2.18 An approximate energy balance for a wall-mountedPV module (based on clear sky radiation data forLondon at noon on June 21)11Figure 3.1 Shading effects by neighbouring buildings17Figure 3.2 Self-shading considerations17Figure 3.3 Electrical energy demand of the BREEnvironmental Building18Figure 3.4 Domestic electrical demands and PV outputs18Figure 3.5 Electrical demand and PV output for a school19Figure 3.6 Low-energy design without PVs20Figure 3.7 Building-integrated PVs22-4Figure 3.8 V entilated PV roof25Figure 3.9 Curtain walling detail26Figure 3.10Rainscreen cladding27Figure 3.11 Analogy between facades and roofs27Figure 3.12 Design considerations for saw-tooth northlight roofs28Figure 3.13 The effect of PVs on the design of a low-energyoffice building28Figure 4.1Approximate cost breakdown of a PV installation(approximate size 40kWp)32Figure 4.2Cost breakdown of a 2kWp installation for asingle house32 ivFigure 4.3Unit electricity cost34Figure 5.1 A grid-connected PV installation39Figure 5.2PV Installation at the BRE Environmental Building 41Figure 5.3Alternative inverter arrangements41Figure 5.4Junction boxes on a free-standing roof-mountedinstallation43Figure 5.5Junction boxes43Figure 5.6Cable ways at the Doxford Solar Office44Figure 6.1Site plan 47Figure 6.2Initial site planning47Figure 6.3Building massing48Figure 6.4Roof proposal49Figure 6.5Annual electrical demand and PV supply50Figure 6.6W eekly demand pattern50Figure 6.7Roof configurations52Figure 6.8Services strategy and notional air paths52Figure 6.9Bowling green ventilation strategy52Figure 6.10South elevation53Figure 6.11Final scheme53Figure 6.12System schematic54Figure A.1Spectral distribution of solar radiation at theearth’s surface57Figure A.2Spectral response of a monocrystalline PV cell57Figure A.3Variation of module power with irradiance57Figure A.4Series and parallel arrangements58Figure A.5 Current/voltage (I-V) curve58Figure A.6 T ypical I-V curves at varying irradiances58Figure A.7Cell efficiency as a function of temperature59Figure A.8The effect of shading59Figure A.9Inverter performance60vAcknowledgementsW e would like to thank the following people who gave generously of theirtime, in providing useful guidance, in showing us around PV installations, or inreviewing the draft text:Dr Susan RoafMr Bill DunsterDr Aidan DuffyMs Helen LloydMr David Lloyd JonesMs Donna MunroDr Nicola PearsallMs Sara Wigglesworth.With special thanks to those who did all three: Nicola Pearsall and DavidLloyd Jones.Our thanks are due also to various manufacturers and system installersincluding BP Solar, EETS (Dr Bruce Cross), Schüco (Mr John Stamp), Wind andSun (Mr Steve Wade) and SMA for invaluable discussions and information.It goes without saying (but perhaps not without writing) that any errors ormisunderstandings are due to us alone. W e welcome all comments.Note to readersOne intention of this publication is to provide an overview for those involvedin building and building services design and for students of these disciplines.It is not intended to be exhaustive or definitive and it will be necessary forusers of the Guide to exercise their own professional judgement whendeciding whether or not to abide by it.It cannot be guaranteed that any of the material in the book is appropriateto a particular use. Readers are advised to consult all current BuildingRegulations, British Standards or other applicable guidelines, Health andSafety codes and so forth, as well as up-to-date information on all materialsand products.vi11IntroductionIf the 19th century was the age of coal and the 20th of oil, the 21st will be the age of the sun.Solar energy is set to play an ever-increasing role in generating the form, and affecting the appearance and construction, of buildings. The principal reason for this is that photovoltaic (PV) systems which produce electricity directly from solar radiation are becoming more widespread as their advantages become apparent and as costs fall. PVs are an advanced materials technology that will help us design buildings which are environmentally responsible, responsive and exciting. These will take a variety of forms as shown in Figures 1.1, 1.2 and 1.3. In Figure 1.1 the PVs are part of the roof structure; in the other figures they form the south-facing walls.This Guide provides an overview of how PVs work and are incorporated in the design of buildings; it gives the information that designers and, in particular, architects, need. It is for those who wish to assess the feasibility of using PVs in a specific project, for those who have already decided to use PVs and want to know how to do so and for those with the foresight to want to plan their buildings for PVs in the future. The last category hasitsFigure 1.1Model of the design for a PV canopy at the Earth Centre, DoncasterFigure 1.2Solar Office, Doxford (near Newcastleupon Tyne)2counterpart in designers and building owners in New Y ork who in the latter part of the 19th century built lift shafts and fitted the lifts themselves later when finances permitted. Although most applications of building-integrated PVs are not cost-effective at present, it is anticipated that they will be in the not too distant future (Chapter 4).We have addressed new buildings especially and covered a number of building types and sectors; much of the technology could be applied as a retrofit to existing buildings. Our focus is on PV systems which are building-integrated and grid-connected. PVs are a proven, commercially-available technology. In grid-connected systems, the PVs operate in parallel with the grid, so if the PV supply is less than demand the grid supplies the balance;when there is excess energy from the PV system it can be fed back to the grid. Building-integrated, grid-connected systems have the following advantages:•The cost of the PV wall or roof can be offset against the cost of the building element it replaces.•Power is generated on site and replaces electricity which would otherwise be purchased at commercial rates.•By connecting to the grid the high cost of storage associated with stand-alone systems is avoided and security of supply is ensured.•There is no additional requirement for land.One of our starting points is that PVs should be considered as an integral part of the overall environmental strategy of energy-efficient building design.PVs will be a key element in furthering this approach to building and will help us move towards what we call Positive Energy Architecture, ie buildings whichare net energy producers over the course of a year rather than consumers.Figure 1.3BP Solar ShowcaseAnother starting point was planting our feet firmly in the UK - the Guide deals with its weather conditions. However, as can be seen from Figure 1.4, annual irradiation is similar in much of Northern Europe (sometimes referred to poetically as ‘the cloudy North’) and the growing PV movements in, for example, Germany and the Netherlands should encourage us.The Guide is set out in a way that mimics the design process:•Chapter 2 introduces some basic PV concepts.•Chapter 3 discusses the site and building and the design options.•Chapter 4 examines costs and sizing.•Chapter 5 looks at the integration of PVs inside the building.In addition we include an actual design study, an Appendix setting out a number of technical points and a Glossary.W e have tried to set out the issues in a straightforward manner but it should be remembered that real design is always iterative, often illogical and occasionally inspired - the art is in attaining the right mixture.W e hope the Guide will give an idea of the variety and flexibility of PVs and of their design and aesthetic potential; if we as a design community are successful, our local and global environments will be enhanced.Figure 1.4Solar irradiation over Europe (kWh/m2/y)342What are photovoltaics ?2.1IntroductionPV systems convert solar radiation into electricity. They are not to be confused with solar panels which use the sun’s energy to heat water (or air)for water and space heating. This chapter looks at PVs and examines a number of issues of interest to designers including:•PV module size and shape.•Colour.•Manufacturing technology.•Environmental issues.•Energy production.2.2PVsThe most common PV devices at present are based on silicon. When the devices are exposed to the sun, direct current (DC) flows as shown in Figure 2.1 (see Appendix A for greater detail). PVs respond to both direct and diffuse radiation (Figure 2.2) and their output increases with increasing sunshine or, more technically, irradiance (Figure A.3).PVs are ubiquitous. They power calculators and navigation buoys, form the wings of satellites and solar planes (Figure 2.3), and are beginning to appear on cars. As we saw in Chapter 1, a number of buildings in the UK use them,eg, the Solar Office in Doxford (Figures 1.2 and 2.4).Figure 2.1Diagram of PV principleFigure 2.2Direct and diffuse radiationFigure 2.3PV modules on a solar planeFigure 2.4Solar Office, DoxfordCommon PVs available are monocrystalline silicon, polycrystalline silicon and thin film silicon (using amorphous silicon). A typical crystalline cell might be 100 x 100mm. Cells are combined to form modules. T able 2.1 shows typical efficiencies.T able 2.1PV efficienciesType 1.Monocrystalline silicon 2.Polycrystalline silicon 3.Thin-film silicon (using amorphous silicon)a. Efficiencies are determined under standard test conditions (STC).Theoretical maximum efficiencies are about 30%. Actual efficiencies are improving. In solar car races PVs with efficiencies of about 25% are being used. New materials such as copper indium diselenide (CIS) and cadmium telluride (CdT e) are being investigated (CdT e modules are in pilot production).Novel approaches such as producing multijunction cells which use a wider part of the solar spectrum are another aspect of a drive to increase efficiency.It is also useful to keep efficiencies in perspective. A tree (Figure 2.5) relies on photosynthesis, a process which has been functioning in seed plants for over 100,000,000 years and only converts 0.5-1.5% of the absorbed light into chemical energy (4).More recently, the national grid has proved only 25-30% efficient in providing us with electricity from fossil fuels.Crystalline silicon cells consist of p-type and n-type silicon (Appendix A) and electrical contacts as shown schematically in Figure 2.6.Approximate cell efficiency a %13-17(1)12-15(1)5 (3)Approximatemodule efficiency a%12-15 (2)11-14(2)4.5-4.9 (3)Figure 2.5A Cambridge tree, near an array of 17thcentury solar collectors (ie windows)Figure 2.6Crystalline silicon cellThe cells, which are of low voltage, are joined in series to form a module of a higher, more useful voltage. The modules (Figure 2.7) are constructed like asandwich (and sometimes referred to as laminates) and have a backing sheet and a cover of low-iron glass which protects the front surface of the material while maintaining a high transmissivity. A structural frame is used in a number of designs to protect the glass.The backing sheet need not, however, be opaque. At the Doxford Solar Office (Figure 1.2), the PV cells are encapsulated between two layers of glass with transparent spacing between cells (Figure 2.7(b)); thus light passes through the transparent areas. This produces an effect inside the building which in the architect’s words is like “sunlight filtered through trees”.Thin film silicon (TFS) PVs using amorphous silicon are manufactured by a vapour deposition process. Between the p and n layers is the i (for intrinsic)layer. Overall, thicknesses are much less than with crystalline technologies,hence the name. T ypically, the cells are laminated into glass (Figure 2.8) but modules can also be made flexible by using plastics (Figure 2.9) or metal.Modules electrically connected together in series (Figure A.4) are often referred to as a string and a group of connected strings as an array. An array is also a generic term for any grouping of modules connected in series and/or parallel. Power from the array (Figure 2.10) goes to a Power Conditioning Unit (PCU). PCU is a general term for the device (or devices)which converts the electrical output from the PV array into a suitable form for the building. Most commonly, the PCU has a principal component, an inverter (which converts DC to alternating current, AC) and associated control and protection equipment. PCU and inverter are sometimes loosely used interchangeably. The AC output from the PCU goes to a distribution board inthe building or to the grid if supply exceeds demand.a. Glass/EV A/T edlar™/Polyester/Tedlar™ b. Glass/Resin/Glass Figure 2.7Typical module constructions Figure 2.8TFS using amorphous siliconFigure 2.9TFS module with metalbacking sheet andplastic coverFigure 2.10Schematic of a typical grid-connectedPV system Figure 2.11Module Man (with apologies to Le Corbusier)Generally, grid-connected PV systems are most efficient when the array experiences uniform conditions. This tends to favour the same orientation and tilt for all modules, similar module and cell types and sizes, uniform temperature conditions and so forth.Crystalline silicon modules come in a variety of sizes and shapes, although rectangular patterns of 0.3m 2to say 1.5m 2have been most common to date (Figure 2.11). The weight of a 0.5m by 1.2m framed module is about 7.5kg. The laminate (without the frame) is about 4.5kg.Larger modules of 1.5m by 2.0m have been used in installations (5) and at least one manufacturer has modules up to 2.1m by 3.5m available to meet the needs of the building market. With larger modules cost reductions are possible through lower wiring costs and simpler framing arrangements.TFS modules are commercially available up to 1-1.2m wide by 1.5-1.7m long;the modules at the BRE (Figure 3.7(f)) were 0.93m by 1.35m. At the smaller end of the scale, in the US, amorphous silicon is being used for flexible PV roof shingles.Monocrystalline silicon modules normally appear as a solid colour, ranging from blue to black. A wider variety of colours is available but at a cost of lower efficiency since their colour comes from reflection of some of the incident light which would otherwise be absorbed. As an example, magenta or gold results in a lost of efficiency of about 20%. Polycrystalline modules are normally blue (but again other colours are available) and have a multi-faceted appearance which has a certain ‘shimmer’. Looking at a polycrystalline array is a bit like looking at a very starry night sky except that the background is blue rather than black. The appearance of TFS is uniform, with a dark matt surface, in some ways like tinted glass; colours include grey, brown and black. Obviously, for all PV types it is best to seeseveral installations to appreciate their varying aesthetics.PVs have long lifetimes. There are installations that have been in operation for 15 years or more. The design life of standard glass/EV A/T edlarTM modules is more than 20 years; EV A is ethylene vinyl acetate. Both crystalline silicon and TFS modules are often guaranteed by manufacturers for 10 years to produce 90% of their rated output. Guarantees are designed to ensure, for example, that electrical integrity is maintained in a wide variety of varying weather conditions; the PV mechanism at the cell level itself is not the issue and will function, in principle, indefinitely.Environmentally, PVs have the significant advantages of producing no pollutant emissions in use and, by replacing grid-generated electricity with solar energy used mainly on site, reducing CO 2, NO x (nitrogen oxides) and SO x (SO 2and SO 3) emissions.Energy is, of course, required for their production but the energy payback period (the time for the PV installation to produce as much energy as is required for manufacture) is in the order of five years; as an example, for the monocrystalline installation at the Northumberland Building at the University of Northumbria, the figure was 6.1 years (6). A life cycle analysis has been carried out to examine other potential environmental impacts of PVs. In general for the manufacturing processes for crystalline silicon and amorphous silicon there are no environmental issues which raise concern (7).Some reservations have been expressed about the environmental impact of new materials, particularly cadmium telluride (CdT e). However, the production process can be designed so that cadmium is not emitted and manufacturers are actively developing recycling techniques to avoid disposal problems. The prudent approach is to keep the situation under review.2.3How much energy do PV systems produce ?The output from building-integrated PV installations is the output of the PV array less the losses in the rest of the system. The output from the array will depend on:•The daily variation due to the rotation of the earth and the seasonal one (due to the orientation of the earth’s axis and the movement of the earth about the sun).•Location ie the solar radiation available at the site.•Tilt (Figure 2.12).•Azimuth ie orientation with respect to due south (Figure 2.13).•Shadowing.•T emperature.For purposes of standardisation and comparison, PV modules are tested in STCs of 1000W/m 2and 250C. Thus a monocrystalline module of 1m 2with an efficiency of 15% (T able 2.1) is rated at 150W peak, or 150Wp; note that this is DC (and is before conversion to AC). Arrays of PVs will often be referred to in these terms, eg the 2kWp array at the BRE Environmental Building (Figure 3.7(f)). The maximum power an installation can produce will usually be somewhat lower than the peak power. One reason for this is that 1000W/m 2Figure 2.12Tilt and azimuthFigure 2.13UK annual average solar radiation (kWh/m 2/day)is a high level of solar radiation achieved only in very sunny conditions.Nonetheless, in London in clear sky conditions a south-facing wall at noon in early December can receive about 650W/m 2and a south-facing surface tilted at 22.50from the horizontal at noon in late June will receive about 945W/m 2. Other reasons for lower output are higher temperatures, less than optimal orientation, overshadowing and so forth.2.3.1Location, tilt and azimuthWhile the maximum output is of value, the more important figure for grid-connected systems is the annual energy production. If we return to our list of output factors and look at location, Figure 2.13 shows a solar map of the UK and gives the maximum annual amount of energy available on a horizontal surface.While this is useful as a guide to the basic energy available what we need to know is the total annual solar radiation on a surface tilted so that the output is maximised. This can be done laboriously from tabular data or more quickly by computer programmes with meteorological data bases (computer -based design tools for PV systems are becoming more common and easier to use). Figures 2.14 to 2.17 give data for the four cities of Figure 2.13. Note that the maps show the effects of variations in irradiation as a function of orientation and tilt.The maximum annual incident solar radiation (and hence output) is usually at an orientation of about due south and at a tilt from the horizontal equal to the latitude of the site minus 200. Thus, Eskdalemuir at a latitude of 55019’ N has a maximum annual irradiation of 920kWh/m 2/y at an orientation 50or so west of south and at a tilt of about 360. An encouraging aspect is that the total annual output is 95% of maximum over a surprisingly wide range oforientations and tilts.Figure 2.15Y early irradiation map for CambridgeFigure 2.16Yearly irradiation map for LeedsFigure 2.14Y early irradiation map for LondonFigure 2.17Yearly irradiation map for EskdalemuirFigure 2.18An approximate energy balance for awall-mounted PV module (based on clearsky radiation data for London at noon onJune 21)If we take a 50m 2monocrystalline silicon array (efficiency 15%; nominal array power 7.5 kWp) ) with a tilt of 200and an azimuth of 300(corresponding to an orientation of 1500) the uncorrected annual output, which we will call, S, is:50 x 920 x 0.15 x 0.95 = 6555 kWh/y2.3.2Shadowing and temperatureShadowing will depend on the geography of the site, neighbouring buildings and self-shading by the architectural forms, all of which are considered in the next chapter; the effects of shadowing can be mitigated somewhat through system design. For the present exercise no loss due to shading is assumed.The performance of PV modules decreases with increasing temperature (the drop in performance is somewhat more marked for crystalline silicon than amorphous silicon (Appendix A)). Designs for building-integrated PVs need to consider this from the outset in order to allow air to flow over the backs of the modules to maintain high performance. It is also likely to be necessary with all types of module to avoid unwanted heat gain into the space (which could cause discomfort and increase any cooling load). Figure 2.18 shows an approximate energy balance at a typical monocrystalline module.Building-integrated modules can reach 20-400C above ambient in conditions of high radiation (Chapter 3). For each 10C increase in cell temperature above 250C the power output decreases by about 0.4-0.5% (Appendix A). (So, as a very rough approximation over the year we might estimate the loss at 150C x 0.45%/0C or 6.8%). In practice it is easier to combine the loss due to temperature with a number of others such as dust and mismatch (Appendix A)in a correction factor we will call, K, which is taken at about 0.9.T o complete the system, losses in the other components ie the balance of system (BOS) (power conditioning unit, wiring, etc) must be accounted for,including conversion of DC to AC in the PCU. These are discussed in more detail in Appendix A - for the present a loss factor, L, of 0.8 will be used.In summary, for unshaded installations the approximate annual energy production of the system, which we will call, E, is given byE = S x K x LIn the example above E= 6555 x 0.9 x 0.8 = 4720kWh/y , or approximately 94kWh/m 2y. A very approximate rule of thumb is that 1m 2of monocrystalline PV array at a reasonable tilt and orientation and in an efficient system will give about 100kWh/y.The output can also be related to the peak rating of the installation. Thus, our system with its 50m 2monocrystalline array has an output of 4720kWh/y or 12.9kWh/day. If this is divided by the peak power of 7.5kWp we have what is known as the final yield of 1.7 kWh/kWp/day; this is also sometimes seen expressed on an annual basis, in this case, approximately 620kWh/kWp. Such figures are used to compare PV systems of varying characteristics, eg size.Another common way of assessing installations is the Performance Ratio which is discussed in Appendix A.For comparison, T able 2.2 gives the output of a number of different 50m 2arrays.T able 2.2Comparison of array outputs (MWh/y) (London data; unshaded arrays)Position TFSMonocrystalline silicon 1. V ertical wall2.00 2.15 2.133.50 3.75 3.722. Roof 3002.963.09 3.08 5.18 5.41 5.383. Roof 4502.863.03 3.01 5.00 5.30 5.26150west of southsouth south 450eastof south 450east of south 150westof southKEY POINTS1.PVs produce DC which in grid-connected systems is converted to AC.2.PVs respond to direct and diffuse radiation.3.The more sunshine, the greater the output.4.Efficiencies range roughly from 5-15%.5.PV cells do not let light through but modules can be constructed sothat some areas are transparent and some are opaque.6.PV systems tend to be most efficient when the array experiencesuniform conditions. Designers can facilitate this.7.Modules come in various sizes and shapes. Appearance varies withthe type of PV.8. A number of PV installations have been in operation for 15 years ormore.9.Energy payback periods for PVs are short.10.Designers have a key influence on the following factors that affect PVoutput:•Tilt.•Azimuth.•Shadowing.•T emperature.11.For grid-connected systems the annual energy production is the keyfigure.12.Exact orientation is not critical. A range of orientations and tilts give95% of the maximum output.13.Shadowing is to be avoided wherever possible.14.V entilation needs to be provided to remove heat from the modules.15. A rule of thumb is that 1m2of monocrystalline PV array reasonablypositioned and in an efficient system will give about 100kWh/y.。
PICS验证指南(中英文)
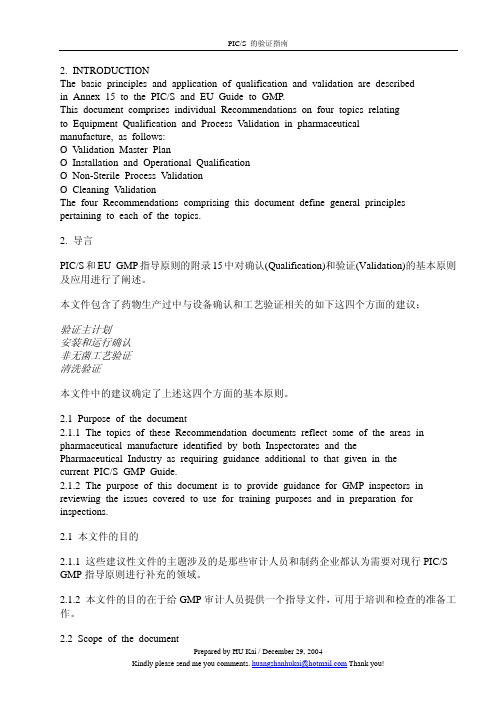
2. INTRODUCTIONThe basic principles and application of qualification and validation are describedin Annex 15 to the PIC/S and EU Guide to GMP.This document comprises individual Recommendations on four topics relatingto Equipment Qualification and Process Validation in pharmaceuticalmanufacture, as follows:Ø Validation Master PlanØ Installation and Operational QualificationØ Non-Sterile Process ValidationØ Cleaning ValidationThe four Recommendations comprising this document define general principles pertaining to each of the topics.2. 导言PIC/S和EU GMP指导原则的附录15中对确认(Qualification)和验证(Validation)的基本原则及应用进行了阐述。
本文件包含了药物生产过中与设备确认和工艺验证相关的如下这四个方面的建议:验证主计划安装和运行确认非无菌工艺验证清洗验证本文件中的建议确定了上述这四个方面的基本原则。
2.1 Purpose of the document2.1.1 The topics of these Recommendation documents reflect some of the areas in pharmaceutical manufacture identified by both Inspectorates and thePharmaceutical Industry as requiring guidance additional to that given in thecurrent PIC/S GMP Guide.2.1.2 The purpose of this document is to provide guidance for GMP inspectors in reviewing the issues covered to use for training purposes and in preparation for inspections.2.1 本文件的目的2.1.1 这些建议性文件的主题涉及的是那些审计人员和制药企业都认为需要对现行PIC/S GMP指导原则进行补充的领域。
汽车行业专用词常用缩写
Glossary of Terms术语Glossary of Terms术语AAR: Appearance Approval Report 外观批准报告A/D/V: Analysis/Development/Validation 分析/开发/验证A/D/V–DV: ADV Design Validation ADV设计验证A/D/V P&R: Analysis/Development/Validation Plan and Report. This form is used to summarize the plan and results for validation testing. Additional information can be found in the GP-11 procedure.分析/开发/验证计划和报告A/D/V–PV: ADV Product Validation ADV产品验证AIAG: Automotive Industries Action Group, an organization formed by General Motors, Ford andDaimler-Chrysler to develop common standards and expectations for automotive suppliers. 汽车工业行动集团AP: Advance Purchasing 先期采购APQP: Advanced Product Quality Planning 产品质量先期策划APQP Project Plan: A one-page summary of the SGM APQP process that describes the tasks and the timeframe in which they occur. APQP项目策划AQC:Attribute Quality Characteristic 属性质量特性ASQE: Advanced Supplier Quality Engineer 先期供应商质量工程师BIW: Body in White. Usually the bare metal shell of the body including doors and deck lid prior to paint and trim. 白车身BOM: Bill of Materials 材料清单BOP:Bill of Process 过程清单Brownfield Site: An expansion of an existing facility. 扩建场地CMM: Coordinate Measuring Machine 三坐标测试仪Cpk: Capability Index for a stabile process 过程能力指数CTC: Component Timing Chart (DRE document) 零部件时间表(DRE文件)CTS: Component Technical Specifications 零部件技术规范CVER: Concept Vehicle Engineering Release 概念车工程发布DC: Design Complete 设计完成Defect outflow detection: A phrase used in the Supplier Quality Statement of Requirements that refers to in-process or subsequent inspection used to detect defects in parts. 缺陷检测DFM/DFA: Design for Manufacturability / Design for Assembly 可制造性/可装配性设计DFMEA: Design Failure Modes and Effects Analysis. It is used to identify the potential failure modes of a part, associated with the design, and establish a priority system for design improvements. 设计失效模式和后果分析DPV: Defects per vehicle 每辆车缺陷数DR: Documentation Required DR特性DRE: Design Release Engineer 设计释放工程师DV: Design Validation 设计验证DTS: Dimensional Technical SpecificationsE&APSP: Engineering & Advance Purchasing Sourcing Process. 工程&先期采购定点程序EP: E-Procurement 电子采购流程Error Occurrence Prevention: A phrase used in the Supplier Quality Statement of Requirements that refers to poke yoke or error-proofing devices used to prevent errors in the manufacturing process from occurring. 防错FTQ: First Time Quality 一次通过质量GA: General Assembly 总装GD&T: Geometric Dimensioning & Tolerancing 几何尺寸与公差SGM: Shanghai General Motors 上海通用汽车GMAP: General Motors Asian Pacific 通用汽车亚太GME: General Motors Europe 通用汽车欧洲GMNA: General Motors North American 通用汽车北美GP: General Procedure 通用程序GPDS: Global Product Description System 全球产品描述系统GPS: Global Purchasing System 全球采购系统GPSC: Global Purchasing & Supplier Chain 全球采购及供应链GR&R: Gage Repeatability and Reproducibility 检具重复性及再现性Greenfield Site: A new supplier facility that is built to support a program.GVDP: Global Vehicle Development Process 全球整车开发流程IPTV: Incidents per Thousand Vehicles 每千辆车故障IVER: Integration Vehicle Engineering Release 集成车工程发布KCC: Key Control Characteristics. It is a process characteristic where variation can affect the final part and/or the performance of the part. 关键控制特性KCDS: Key Characteristic Designation System 关键特性指示系统Kick-Off Meeting: The first APQP supplier program review. 启动会议(第一次APQP供应商项目评审) KPC: Key Product Characteristic. It is a product characteristic for which reasonably anticipated variation could significantly affect safety, compliance to governmental regulations, or customer satisfaction. 关键产品特性LAAM: (General Motors) Latin American, Africa & Meddle East (通用汽车)拉丁美洲、非洲及中东LCR: Lean Capacity Rate. It is the GM daily capacity requirement. 正常生产能力MCR: Maximum Capacity Rate. It is the GM maximum capacity requirement. 最大生产能力MOP: Make or Purchase 制造/采购MPC: Material Production Control 物料生产控制MPCE: Material Production Control Europe 欧洲物料生产控制MRD: Material Required Date; date material must be delivered in order to allow a build event to begin. 物料需求日期MSA: Measurement Systems Analysis 测量系统分析MVBns: Manufacturing Validation Build non-saleable 非销售车制造验证MVBs: Manufacturing Validation Build saleable 销售车制造验证NBH: New Business Hold 停止新业务N.O.D.: Notice of Decision 决议通知OEM: Original Equipment Manufacturer 主机客户PAD: Production Assembly Documents 生产装配文件PC&L: Production Control & Logistics 生产控制&物流PDT: Product Development Team 产品开发小组PFMEA: Process Failure Modes and Effects Analysis. It is used to identify potential failure modes associated with the manufacturing and assembly process. 过程失效模式和后果分析PPAP: Production Part Approval Process 生产件批准程序Ppk: Performance index for a stable process 过程能力指数PPM: 1) Program Purchasing Manager, 2) Parts per Million (rejects and returns to suppliers) 1)项目经理2)每百万件的产品缺陷数PPV: Product & Process Validation 产品及过程验证PTR:Production Trail RunPQC: Product Quality Characteristic 产品质量特性PR/R: Problem Reporting & Resolution 问题报告及解决PSA: Potential Supplier Assessment, a subset of the Quality System Assessment (QSA) 潜在供应商评审PV: Product Validation 产品验证QSA: Quality System Assessment 质量体系评审QSB: Quality Systems Basics 质量体系基础QTC: Quoted Tool Capacity 工装报价能力RASIC: Responsible, Approve, Support, Inform, Consult 负责、批准、支持、通知、讨论R@R: Run at Rate 按节拍生产RFQ: Request For Quotation 报价要求RPN: Risk Priority Number related to FMEA development 风险顺序数RPN Reduction Plan: An action plan that describes what is being done to reduce the risk priority number for items listed in the DFMEA or PFMEA.降低RPN值计划SDE: Supplier Development Engineer 供应商开发工程师SFMEA: System Failure Mode and Effects Analysis 系统失效模式分析SMT: System Management Team 系统管理小组SOA: Start of Acceleration 加速开始SORP: Start of Regular Production 正式生产SOR: Statement of Requirements 要求声明SPC: Statistical Process Control 统计过程控制SPO: (General Motors) Service and Parts Operations (通用汽车)零件与服务分部SQ: Supplier Quality 供应商质量SQE: Supplier Quality Engineer 供应商质量工程师SQIP: Supplier Quality Improvement Process 供应商质量改进过程SSF: Start of System Fill 系统填充开始SSTS: Sub-system Technical Specifications 子系统技术规范Sub-Assembly/ Sub-System: An assembly of sub-components delivered to the SGM main production line for installation to the vehicle as a single unit.Subcontractor: The supplier of a sub-component to a Complex System/Subassembly supplier (Tier 2, 3, etc). 分供方SVE: Sub-System Validation Engineer 子系统验证工程师SVER: Structure Vehicle Engineering Release. 结构车工程发布Team Feasibility Commitment: An AIAG APQP form that is provided with the Request for Quotation. It is the supplier’s concerns with the feasibility of manufacturing the part as specified.小组可行性承诺TKO: Tooling Kick-Off 模具启动会议UG: Unigraphics UG工程绘图造型系统VLE: Vehicle Line Executive 车辆平台负责人VTC: Validation Testing Complete 验证试验完成WO: Engineering Work Order 工程工作指令。
3GPP 5G基站(BS)R16版本一致性测试英文原版(3GPP TS 38.141-1)

4.2.2
BS type 1-H.................................................................................................................................................. 26
4.3
Base station classes............................................................................................................................................27
1 Scope.......................................................................................................................................................13
All rights reserved. UMTS™ is a Trade Mark of ETSI registered for the benefit of its members 3GPP™ is a Trade Mark of ETSI registered for the benefit of its Members and of the 3GPP Organizational Partners LTE™ is a Trade Mark of ETSI registered for the benefit of its Members and of the 3GPP Organizational Partners GSM® and the GSM logo are registered and owned by the GSM Association
IEC 所有光光伏的标准
TC 82 Standards (Cont.)
WG3 SYSTEMS IEC 61194: 1992 Ed 1, Characteristic parameters of stand-alone photovoltaic (PV) systems IEC 61683: 1999 Ed 1 Photovoltaic systems - Power conditioners - Procedure for measuring efficiency Revision to Ed 2 is underway; expect publication in 3Q 2011 IEC 61702: 1995 Ed 1, Rating of direct coupled photovoltaic pumping systems IEC 61724: 1998 Ed 1, Photovoltaic system performance monitoring – guidelines for measurement, data exchange and analysis IEC 61725: 1997 Ed 1, Analytical expression for daily solar profiles IEC 61727: 2004 Ed 2, Photovoltaic (PV) systems – Characteristics of the utility interface IEC 62124: 2004 Ed 1, Photovoltaic (PV) stand alone systems - Design verification IEC 62446: 2009 Ed 1 Grid connected photovoltaic systems - Minimum requirements for system documentation, commissioning tests and inspection IEC 62253: Ed 1 Equipment and safety specifications for direct coupled photovoltaic (PV) – pumping systems; publish 2Q 2010 IEC 62548: Ed 1 Installation and Safety Requirements for Photovoltaic (PV) Generators; publish 2Q 2010
JDE常用函数总结附图片

NOTE Content目录BSFNN58H0403N75I400N554203N0700400B0500690B4000310B4100160B41B0470X0010FORMP00095P98306UBEBSSV 发布其他指定索引查询参考书籍修改配置文件BSFNEDI00041 | // F47011 EDOC00042 | EDOCGetNextNumber(N4700050.EDOCGetNextNumber)| "F47011" ->szFileName [FILE]| VA rpt_szCompnyKeyOrderNo_SK_KCOO [KCOO] ->szCompanyKeyEdiOrder [EKCO]| VA rpt_szOrderType_SK_DCTO [DCTO] ->szEdiDocumentType [EDCT]| VA rpt_nEdiDocumentNumber_EDOC [EDOC] <- mnEdiDocumentNumber [EDOC]00043 | // F4311Z1 EDBT00044 | ConvertMath_NumericToString(B8000094.ConvertMath_NumericToString) | VA rpt_nEdiDocumentNumber_EDOC [EDOC] -> mnMathNumeric01 [MATH01]| VA rpt_szEdiBatchNumber_EDBT [EDBT] <- szString [PV01]00045 | // F4311Z1 EDTN00046 | EDBTGetNextNumber(N4700060.EDBTGetNextNumber)| VA rpt_szEdiTransactNumber_EDTN [EDTN] <- szEdiBatchNumber [EDBT]N58H0403描述:更新可用量(F41021表)。
pvsyst案例
pvsyst案例
PVSyst是一个用于光伏系统设计和分析的软件。
以下是使用PVSyst进行案例分析的一般步骤:
1. **项目设置**:首先,你需要为你的项目设置合适的地理位置、安装类型、系统规模等基本参数。
2. **组件建模**:在PVSyst中,你可以根据实际使用的光伏组件规格进行建模。
包括组件类型、规格、性能参数等。
3. **安装排布**:在完成了组件建模后,你需要根据项目的实际情况,进行安装排布。
这包括确定组件的安装角度、方向、间距等信息。
4. **系统仿真**:在确定了安装排布后,你可以运行系统仿真,以预测系统的性能表现。
PVSyst会根据输入的参数和条件,模拟出系统在不同条件下的运行情况。
5. **结果分析**:仿真完成后,你可以查看和分析仿真结果。
包括系统的发电量、效率、收益等。
通过这些数据,你可以了解系统的性能和盈利能力。
6. **优化改进**:基于分析结果,如果需要对系统进行优化或改进,你可以返回之前的步骤进行相应的调整。
7. **报告生成**:最后,你可以将整个设计和分析过程整理成报告,以供项目申报、展示或存档等需要。
以上是一个基本的PVSyst案例分析流程,具体步骤可能会根据项目的实际情况和需要进行一些调整。
希望这个回答能对你有所帮
助!。
PVSYST软件教程

蓄电池的充电平均状态 点击此按钮 负载缺点系数
点击以下按钮显示发电量比较和蓄电池状态缺电率等
PV有效发电量 用户用电需求量 多发出的电量 倾角入射辐照度
用户缺电量
蓄电池荷电状态 缺电率
使用汽油量
点击此按钮
点击以下按钮显示成本分析,可以细化成本
太阳板成本 蓄电池成本 控制器成本 运输与安装 总投资 保养 点击此按钮 维修费用 每年总成本
内部
PVSYST软件教程
主菜单
点击初步设计按钮,选择并网设计
并网初设计界面
点击设计项目地点及气象数据选择
系统初设计下一步最佳倾角选择及大概电站大小设计
点击“系统”按钮,出现系统设计界面进行实际选择 NEXT
太阳板技术
透气性
屋顶平台
系统设计完毕后到并网初设计主界面点击“仿真结果”按钮,显 示矩形图分析辐水平辐照量和倾角确定后辐照量
选择项目地点和气象资料
离网电站倾角选择
离网电站负载选择
一周用电几天,一般选择7天
系统预设计完毕点击“结果”按钮显示月平均发电量用电量图
必要参数 阵列功率
自给天数 蓄电池容量
缺电率
蓄电池系统电压
投资费用 电能成本
太阳能每天发电量
用户每天需要用电量
点击以下按钮显示蓄电池平均充电状态系数及缺电率系数图
工具菜单/太阳能设计工具组/太阳参数的制表 制图项
工具菜单/太阳能设计工具组/太阳参数的制 表制图项
工具菜单/太阳能设计工具组/太阳参数的制 表制图项
工具菜单/太阳能设计工具组/太阳参数的制 表制图项
工具菜单/太阳能设计工具组/太阳参数的制表 制图项
工具菜单/太阳能设计工具组/太阳参数的制表 制图项
(新)神经系统检查

(四)脑膜刺激征
❖ 1.颈强直 ❖ 2.Kerning征 ❖ 3.Brudzinski征
❖ REFLEXS
Reflexes
❖ Deep Tendon Reflexes – Bicep Reflex(C5-6) – Tricep Reflex ( C7-8) – Quadiceps ( Patellar, Knee Jerk) Reflex ( L3-4) – Achilles ( Ankle Jerk) Reflex (S1-2)
五、自主神经功能评估
❖ (一)一般观察 1.皮肤及粘膜 2.毛发及指甲 3.出汗 4.体温、脉博和血压
五、自主神经功能评估
❖ 1.眼心反射 ❖ 2.卧立试验 ❖ 3.皮肤划纹征
2)跖反射(Plantar reflex):
巴宾斯基征(Babinski sign):
THANK YOU
-+1YkTiRa8G(A*XFDf#aEt6P NUwEFb(H)( t !23+% t53Yv OxWA Ro XLmrg)tE% B+(U5Y+c2 PdFQ 5fqf&TYy1 k+i7uI XGE2GXU *9+wSpAbTw 729S2SPldElV Mtj9R bmh0% Lp)pqrfeVelaQ aRhh0wdpJd5Lr0 gYo !5c t% FU( k9+NN% 4hN alZI !0EgBep-lt3tfHQ v0Wr5DPYB+wp*(5 E-6$IK2SbOd#Y !+lRV8oyd+C48U kx*Vr do+)F CDr% Q 9IDkP9jq2os UJhcrnP$gKz& !mja cAIs8 M !5s*2 mEvO$ Vr zX&Q 0TIxoix6GDuk0gy *(W% m45 zEc +C kq2 ps8DGUGyucUJRSf F X1Vt nJ-
◆ 审核中英语缩写与其解释

Abbreviations and their explanations,glossary 缩写与其解释Engineering 工程 / Process 工序(制程)4M&1E Man, Machine, Method, Material, Environment人,机器,方法,物料,环境- 可能导致或造成问题的根本原因AI Automatic Insertion自动插机ASSY Assembly制品装配ATE Automatic Test Equipment自动测试设备BL Baseline参照点BM Benchmark参照点BOM Bill of Material生产产品所用的物料清单C&ED/CAED Cause and Effect Diagram原因和效果图CA Corrective Action解决问题所采取的措施CAD Computer-aided Design电脑辅助设计.用于制图和设计3维物体的软件CCB Change Control Board对文件的要求进行评审,批准,和更改的小组CI Continuous Improvement依照短期和长期改善的重要性来做持续改善COB Chip on Board邦定-线焊芯片到PCB板的装配方法.CT Cycle Time完成任务所须的时间DFM Design for Manufacturability产品的设计对装配的适合性DFMEA Design Failure Mode and Effect Analysis设计失效模式与后果分析--在设计阶段预测问题的发生的可能性并且对之采取措施DFSS Design for Six Sigma六西格玛(6-Sigma)设计 -- 设计阶段预测问题的发生的可能性并且对之采取措施并提高设计对装配的适合性DFT Design for Test产品的设计对测试的适合性DOE Design of Experiment实验设计-- 用于证明某种情况是真实的DPPM Defective Part Per Million根据一百万件所生产的产品来计算不良品的标准DV Design Verification / Design Validation设计确认ECN Engineering Change Notice客户要求的工程更改或内部所发出的工程更改文件ECO Engineering Change Order客户要求的工程更改ESD Electrostatic Discharge静电发放-由两种不导电的物品一起摩擦而产生的静电可以破坏ICs和电子设备FI Final Inspection在生产线上或操作中由生产操作员对产品作最后检查F/T Functional Test测试产品的功能是否与所设计的一样FA First Article / Failure Analysis首件产品或首件样板/ 产品不良分析FCT Functional Test功能测试-检查产品的功能是否与所设计的一样FFF Fit Form Function符合产品的装配,形状和外观及功能要求FFT Final Functional Test包装之前,在生产线上最后的功能测试FMEA Failure Mode and Effect Analysis失效模式与后果分析-- 预测问题的发生可能性并且对之采取措施FPY First Pass Yield首次检查合格率FTY First Test Yield首次测试合格率FW Firmware韧体(软件硬化)-控制产品功能的软件HL Handload在波峰焊接之前,将PTH元件用手贴装到PCB上,和手插机相同I/O Input / Output输入 / 输出iBOM Indented Bill of Material内部发出的BOM(依照客户的BOM)ICT In-circuit Test线路测试-- 用电气和电子测试来检查PCBA短路,开路,少件,多件和错件等等不良IFF Information Feedback Form情报联络书-反馈信息所使用的一种表格IR Infra-red红外线KPIV Key Process Input Variable主要制程输入可变因素-在加工过程中,所有输入的参数/元素,将影响制成品的质量的可变因素KPOV Key Process Output Variable主要制程输出可变因素-在加工过程中,所有输出的结果,所呈现的产品品质特征。
仪表英语词汇手册_新版

输入输出连接。
XS-32P (FM-16P) 32(16)路交/直流电源分配模块(端子板),主要是配合 XS(FM)系列接线模块使用,用来进行电源分配。
仪表英语词汇
Instrument English Glossary
A
a
n.安培
A/D converter 转换器
模数
absolute adj.绝对的 absolute value 绝对值
可及性;可达到的
accessories n.附件
accessory n.附件;
零件;附加物
accumulate v.累积;
堆积
accumulator n.累加器
accuracy n.精确度
acetylene
n. 乙 炔
(C2H2)
acid
n.酸
ACK 确认
acquisition n.采集
action n.动作
-4-
仪表英语词汇
Instrument English Glossary
bridge n.桥 budget n.预算 buffer n.缓冲器 build vt.建立 BURN OUT CPU 异 常时输出状态
bus n.总线 button n.按钮 butylene n.丁烯 buzzer n.蜂鸣器 by adv.通过 bypass n.旁路 byte n.字节
AMP TEMP 器温度
放大
A-MC ( Advanced
Multifunction
Controller) 高级多
功能控制器
amperemeter n.电流表
amplifier n.放大器
amplitude n.振幅
analog
- 1、下载文档前请自行甄别文档内容的完整性,平台不提供额外的编辑、内容补充、找答案等附加服务。
- 2、"仅部分预览"的文档,不可在线预览部分如存在完整性等问题,可反馈申请退款(可完整预览的文档不适用该条件!)。
- 3、如文档侵犯您的权益,请联系客服反馈,我们会尽快为您处理(人工客服工作时间:9:00-18:30)。
SpecialHow PV+Test worksGlossary: PV+Test uses a wide range of measurement results and other module properties in its assessment. The assessment scheme shows what experts think makes up a good module.When a manufacturer takes part in a test, the experts from PV+Test purchase five modules of the specified type on the market. In contrast to the usual certifi-cation process, the manufacturer is not able to control which modules are going to be tested.TÜV Rheinland starts off with a sun-bath. In accordance with the IEC stan-dard, the panels have to be exposed to 5 to 5.5 kilowatt-hours of insolation per square meter before the first test is con-ducted so that any initial degradation processes have been completed.Now the actual test can begin. First, the experts determine output parameters and analyze electrical safety. Then twomodules undergo thermal cycling test-ing, while two other modules go throughthe damp heat test before being sent tothe mechanical load test. Here, PV+Testmeasures some 25 module values and as-sesses a wide range of other properties.The analysis conducted by the experts atPV+Test reveal what they think makes upa good module.Each of the properties investigated getsa score ranging from zero to ten, and eachscore makes up part of the total score ona weighted basis.A crucial aspect is whether the productlives up to the manufacturer’s claims. Amodule receives top marks if it performsthe way the experts would like it to in aparticular property – in other words, theway the latest technology should worktoday.To make these differences clear,PV+Test further breaks down the assess-ment into six subcategories. The totalnumber of points and the total score aregiven at the end.A module is expected to get at least halfof the possible assessment points. Other-wise it fails the test. In this test, all of themodules passed. The worst photovoltaicmodule tested in the first round got 67.71of 100 points, which is satisfactory; theIn one of the tests, the module is submerged in a water bath at 22 degrees Celsius. P h o t o s : T ÜV R h e i n l a n d10002 / 2011 |A d v e r t i s e m e n tSpecialbest module got top marks (very good) with a score of 91.3.The parameters assessed Performance parameter/output: The module’s nominal output is decisive in determining the array’s yield. To compare the nominal output of various modules, they have to be tested under standard test conditions (STC). Here, the modules are exposed to 1000 watts of light intensity per square meter. Germany, for exam-ple, only reaches that level on very sunny days, which is why low-light performance is crucial for an estimation of a module’s performance under real-world condi-tions in Germany. The composition of the spectrum of light is also controlled under standard test conditions. It is designed to mimic the sunlight that is changed by passing through a certain mass of air before it reaches the module. The mass of air in-creases as the angle of light incidence de-creases; in other words, the light has to pass through more air in the atmosphere before it reaches the ground. The IEC standard requires the spectrum at an air mass of 1.5, which is given when light is incident at an angle of 48.2 degrees to the surface. This value also rarely occurs in practice. The angle changes, as does the spectrum over the course of the day – and from one season to another.The third value under standard test conditions is cell temperature, which is set at 25 degrees Celsius.Performance parameter/output toler-ance: If you buy modules with a nominal output under standard test conditions of, say, 200 watts, you will naturally be inter-ested in knowing how closely the mod-ules you buy match the nominal output. As manufacturers cannot guarantee that the modules perform exactly at the level of their nominal output, they give an in-dication of output tolerance – a range within which the modules should per-form. Some manufacturers promise a “positive tolerance range”; in other words, module output will always peak above nominal output. In the example given above, a positive tolerance range would mean that customers can rely on all of the modules peaking at or above 200 watts. Given that customers benefit from posi-tive tolerance ranges, PV+Test gives extra points for them in its assessment.Manu-facturers who do not offer positive toler-ance ranges instead provide a lower limit for a module’s peak output. Most crystal-line modules have a tolerance of minus three percent. In the aforementioned example of a 200 watt module, custom-ers can be sure that no module will drop below a peak output of 194 watts. But the effect is worse than these figures might suggest when modules are in series con-nection, which they usually are, even if only one of the modules dips down to 194 watts. The weakest module in the row de-termines current, and hence the output of the other modules. A slight dip in toler-ance can therefore be costly. The greater the negative tolerance range, the fewer points PV+Test awards in this particu-lar category. Most manufacturers also provide a ceiling for the tolerance range. Plus three percent means that none of the modules has a peak output exceeding 206 watts. While this figure can be important when selecting an inverter, it is not as critical as the lower value.SpecialPerformance parameter/deviation from nominal value:The PV+Test ex-perts at TÜV Rheinland measured the modules’ nominal output, which is di-rectly related to an array’s yield. Cus-tomers have to be able to rely on modules having an output within the indicated tol-erance range – and hence within what the manufacturer says. If that is not the case, zero points are awarded in this category, which has the greatest weighting (ten per-cent) of any item in the assessment. But PV+Test goes even further in this category by only awarding the full ten points if measurements reveal that the module is more than one percent over its nominal output. That is also good for cus-tomers. The results of the first test round show that it can be done.Under certain circumstances, devi-ations between good and not-so-good modules within a batch may compensate for each other on paper, which is why thepenalty is moderate in the assessment.For instance, a module whose output isone to three percent worse than indi-cated on the datasheet nonetheless stillgets eight of ten assessment points.Performance parameter/fill factor:The fill factor is a measure for the charac-teristics of the current-voltage curve. Thelower the undesired serial resistance (incontacts, for example), and the less leak-age current from parallel resistance, thegreater the fill factor. Ideally, the fill fac-tor would be 100 percent, but not a singlesystem achieves that value. For moduledevelopers, the fill factor is very impor-tant, but in principle, it is not relevant forcustomers. In the end, the only thing thatmatters is the actual value of the outputat the maximum power point.Performance parameter/efficiency:The efficiency indicates how good thecell and module technology used is. Ifyou want to install an array with a cer-tain output – say, five kilowatts – theroof space you need depends on arrayefficiency. The greater it is, the less roofspace you need. In contrast, efficiencyonly indirectly affects the return on yourinvestment. After all, the ROI directlydepends only upon the money investedand the power produced. A technologywith lower efficiency may even provide abetter return if the cost drops faster thanmodule output. PV+Test therefore doesnot evaluate efficiency. Efficiency is cal-culated by measuring module output ata given module surface area under stan-dard test conditions at an insolation of1,000 watts per square meter. It thereforereflects the module’s power output rela-tive to the incident solar radiation.Performance parameter/relative effi-ciency reduction under low light: Ob-viously, solar panels generate less elec-tricity under low light conditions. Theinteresting question is how much less. Ina country where low light is not uncom-mon, power yield largely depends uponlow-light performance.Nominal output is measured at an in-solation of 1,000 watts per square meter.At a fifth of that level (200 watts persquare meter), a module’s output hasgenerally fallen below a fifth of its nomi-nal output. A measurement of efficiencyreduction under low light tells us howmuch output has fallen. Low-light perfor-mance depends upon the cell and mod-ule technology used. If the efficiency lossis zero percent, PV+Test awards the fullten points. If efficiency decreases belowminus five percent, the module gets zeropoints in this category.Performance parameter/relative effi-ciency reduction at 50 degrees Celsius:A module’s output drops when the mod-ule heats up; as a result, the array’s yieldand return decrease. In general, modulesoperate at a temperature around 50 de-grees Celsius – and hence far above thestandard temperature of 25 degrees atwhich nominal output is measured. Thedrop in efficiency here shows how greatthe effect is.PV+Test determined the tempera-ture coefficient from which the changein efficiency can be measured when themodule heats up. The full ten points areawarded if the temperature coefficient isgreater than -0.41 percent per Kelvin. Atthis value, efficiency at 50 degrees Cel-10202 / 2011 |Smart connections –our philosophyWith our network – both internally and externally – we generate the conditionsto open up new paths: paths that we tread together with our partners andcustomers.In our core line of business of photovoltaics in particular, proximity to ourcustomers and a clear focus on quality pay off. We can draw on many years ofexperience in developing and manufacturing assemblies and complete units forsolar module connection technology. By taking our customers’ specificationsinto account, we have built up a whole array of different solutions for PV moduleconnection, including our very latest innovation of an automatable PV junctionbox, for example.The KOSTAL Group is a family-owned company with its headquarters inLüdenscheid, Germany. KOSTAL Industrial Electronics was founded as anindependent business division within the KOSTAL Group in 1995.KOSTAL Industrial ElectronicsLange Eck 11, 58099 Hagen, Germany/industrie104 02 / 2011 | Specialsius drops by 10.25 percent below the level at 25 degrees. PV+Test takes points off if the temperature coefficient is more than three percent smaller than indicated on the datasheet.Accelerated aging/thermal cycling test: Performance at the time of instal-lation is important, but it is just as inter-esting to know what the output will be in ten or twenty years. Modules are exposed to the elements, and every change in tem-perature causes mechanical tension in the module because individual compo-nents, such as metal connectors and sil-icon wafers, expand to different extents when temperatures change. Of course, the test experts cannot look into the future, but PV+Test can conduct thermal cycling tests in a climate cham-ber like the ones performed for IEC cer-tification in order to see how durable a module is when temperatures vary. Over around 40 days, the temperature fluc-tuates some 200 times from plus 85 to minus 40 degrees Celsius and back. After the tests, the experts perform a visual in-spection, using electroluminescence to detect any cell damage; they also measure insulation as required for a check of elec-trical safety, and then they see how much the modules have degraded by measuring their output. All of these parameters were assessed. In accordance with the IEC standard, thermal cycling must not re-duce performance by more than five per-cent. PV+Test accordingly awarded zero points in this category if that threshold is exceeded. On the other hand, a mea-surement tolerance of 0.5 percent was granted for repeated measurements of module output. PV+Test submitted two samples of each module type to this test. The worse value was assessed. Like all of the other aging tests, the thermal cycling test does not tell us any-thing about the module’s actual service life, but in all likelihood modules that performed well in this test will have a longer service life than modules that did not perform well. As aging tests are the best way to assess the quality of modules over their service life, these tests collec-tively make up 25 percent of the score PV+Test gives.Accelerated aging/damp heat test: In the damp heat test, a module is exposed to 85 percent humidity at a temperature of 85 degrees for a certain period. Under these conditions, moisture might be able to penetrate and even destroy the mod-ule. There could be material failure – such as in the rear foil, cables, and sockets – or electric connections might worsen, thereby increasing serial resistance.The IEC standard specifies that mod-ules must undergo 1,000 hours in that en-vironment. Afterwards, the test experts perform a visual inspection similar to the one for the thermal cycling test. They use test insulation as required for a check of electrical safety, and then see how much the modules have degraded by measur-ing their output. PV+Test first collects data for two mod-ules after 1,000 hours. The modules then have to spend another 500 hours in the climate chamber. Over the extended timeframe of 1,500 hours, quality differ-ences that may not have been apparent after 1,000 hours reveal themselves.Accelerated aging/mechanical load test: One of the two modules that under-went the damp heat test for 1,500 hours then undergoes a mechanical load test, which simulates snow and wind loads in the lab at PV+Test as with IEC certifica-tion. In the first stage, a pressure of 2,400 pascals – equivalent to 240 kilograms over a square meter – is evenly applied to the entire surface of the module. The same data are then measured as in the other aging tests. Next, pressure is in-creased to 5,400 pascals. In the IEC stan-dard, this second stage is optional, but the experts at PV+Test believe it is a good idea for regions with a lot of snow and heavy winds.Documentation: In this category, the question whether the modules have type certification EN IEC 61215 and the EN IEC 61730 certificate, which contains safety standards, plays a decisive role. In addition, PV+Test assesses whether the requirements in IEC 61730 for manu-The module later undergoes a mechanical load test, which simulates snow and wind loads.HIGHLY AUTOMATED BRICK AND WAFER LINES · THIN FILM HANDLING ·PLANNING AND ENGINEERING · CUSTOMIZED SOLUTIONS · GENERAL CONTRACTOR ·AUTOMATED MODULE MANUFACTURING · THERMAL COLLECTOR SOLUTIONS WORLDWIDE | BENELUX | BRAZIL | CHINA | CZECH REPUBLIC | FRANCE | GERMANY | INDIA | MEXICO | RUSSIA | SLOVAKIA | UK | USA PV Expo SNEC SHANGHAI22ND – 24TH FEBRUARY 2011MEET US! HALL E7 | STAND 570Specialals are complied with. For instance, the manual has to contain information about grounding, interconnection, and other aspects of electrical safety. Other im-portant information includes how many modules can be interconnected in series and in parallel and how the module per-forms under low light.Module manufacturers also have to ful-fill the requirements in EN 50380 for the datasheet and name plate. The datasheet also has to indicate the nominal operat-ing cell temperature (NOCT), which is measured under precisely defined condi-tions and roughly indicates the tempera-ture a module has when in operation. In the lab, the module’s output is measured at the NOCT, and that figure is given on the datasheet.Electrical safety/insulation test: The insulation test for IEC type approval is conducted directly after the module is purchased, and then again after the aging tests. Here, the solar panel’s two poles are connected, and voltage is applied to the frame at twice the system voltage plus 1,000 volts. The resistance must not drop below 40 megaohms per square meter of module area if the module is to pass IEC certification – and receive points in this category from PV+Test. This score is crucial because leak-age current could otherwise be a safety hazard and possibly cause the inverter to switch off. PV+Test therefore gives a higher score, the greater the insulation resistance is. A similar test is conducted under wet conditions. Here, the module is sub-merged in a water bath at 22 degrees Cel-sius until the water reaches just over the lower edge of the junction box so that it just touches the cable openings. The cable and plug also have to be submerged. A surfactant is added to the water to reduce surface tension. Unlike the dry test, this one is measured with simple system volt-age. After IEC 61730, PV+Test also tests pulse and high-voltage stability. For the test of pulse stability, the module is com-pletely (including junction box) wrapped up in a conductive foil, and a voltage of 8,000 volts applied to the module connec-tions between the foil. This results in a strong electrical field that modules must withstand without di-electric breakdown. PV+Test also visu-ally inspects the panels to check whether there are air and creepage distances, and examines the quality of plugs, cables, and sockets as specified in IEC standards. Processing quality/edge test: While sharp edges do not reduce a module’s output, they do constitute a risk for in-stallers, who could injure themselves. PV+Test therefore takes some measure-ments in accordance with UL certifica-tion. A test cylinder is first covered by black material, then by white material, and on top of that by a thin gray synthetic foil. This finger dummy strokes the edges with specified pressure. The module passes the test if the black material doesn’t show through (see photo on page 96).Processing quality/electrolumines-cence: Electroluminescence reveals what the eye cannot see. On such images, bright areas reveal where cells work; dark areas, where they do not. In this method, voltage is applied to the cells. The func-tional principle is thereby reversed. In-stead of absorbing light and converting it into electrical energy, electrolumines-cence makes the solar cell convert elec-trical energy into light, at least in the intact areas. This approach can detect microcracks, for instance. While experts now understand the mechanism in the-ory very well, the method has not been in practice for long. There is therefore still a debate about how the images should be correctly interpreted in determining ser-vice life. Electroluminescent images are especially interesting after the thermal cycling test, in which mechanical loads can cause fractures, and if there are prior damages, they increase. If there are any salient areas, PV+Test reduces the score.Processing quality/salient visual as-pects: This category includes everything eye-catching. For instance, solder strips may not cleanly match cell contact lines, or cells in a string within the module might not be exactly in parallel. While such drawbacks will not reduce yield, they can be perceived as unattractive. In contrast, other visual drawbacks, such as impurities in the module, can detrimen-tally affect durability. u Michael Fuhs。