Microelectric phys 3
微型台式电子自旋共振波谱仪Micro-ESR操作规程

微型台式电子自旋共振波谱仪(Micro-ESR)操作规程微型台式电子自旋共振波谱仪(Micro-ESR)简介:电子自旋共振➢微型台式ESR是世界上最小的电子自旋共振(ESR)光谱仪。
此系统可以用于检测各种化学物质的不成对电子。
基于自由基的频谱信号的位置和强度的测定,可以识别并定量自由基。
➢微型台式ESR的应用包括抗氧化剂,润滑剂,原油,催化剂,生物柴油稳定性,植物油,啤酒和葡萄酒的保质期和其它涉及自由基的测定的分析。
微型台式ESR➢Micro-ESR采用专利技术,轻巧便捷,数据精准。
仪器配有全自动型温度控制器、windows系统、USB接口以及Ethernet接口,用于输出数据或和其它仪器连接。
操作➢使用Micro-ESR,使用者首先需要准备样品,并装入样品管放入检测腔。
然后在仪器上定义各种参数,如扫描范围,调制功率和采样时间。
然后,台式微型ESR会在指定范围进行扫描并输出频谱。
微型台式电子自旋共振波谱仪(Micro-ESR)操作步骤:电气连接➢Micro-ESR内置计算机系统,使用110v—220v电源。
➢打开仪器背面开关,启动Micro-ESR,进入计算机系统。
➢仪器可以通过USB口,外接鼠标键盘及U盘。
启动软件1.双击屏幕中的μESR Control Software图标,打开操作软件。
2.当软件状态窗口显示“Ready”时,可以进行下一步操作。
装样1.实验样品需装载在直径5.8mm的样品管中。
2.样品管中装样高度必须大于3cm,以保证样品完全覆盖检测区域。
3.用O型圈固定样品管的高度,小心放入仪器顶部的检测腔中检测。
4.在软件界面选择“Tuning”菜单界面,点击“Auto Tune”进行自动调谐,自动调谐成功后可进行下一步。
如果未成功则需要调整样品位置、装填量,再多次重复此步骤。
扫描1.选择菜单栏中“Spectrometer Control”界面。
2.输入样品名称、样品描述(如果需要)。
具有氧缺陷的SrTiO3的电子结构和光学性质的第一性原理研究
Modern Physics 现代物理, 2014, 4, 113-121Published Online September 2014 in Hans. /journal/mp/10.12677/mp.2014.45014Electronic Structures and Optical Properties of the Oxygen-Deficient SrTiO3 fromFirst-Principles CalculationQingyuan Chen, Yao He*Department of Physics, Yunnan University, KunmingEmail: *yhe@Received: Sep. 1st, 2014; revised: Sep. 8th, 2014; accepted: Sep. 15th, 2014Copyright © 2014 by authors and Hans Publishers Inc.This work is licensed under the Creative Commons Attribution International License (CC BY)./licenses/by/4.0/AbstractIn recent years, perovskite oxides attracted widely attention due to its unique structure and the chemical and physical properties. SrTiO3(hereinafter referred to STO) is a kind of typical pe-rovskite oxides. It has the characteristics of typical perovskite structure, and its high dielectric constant, low dielectric loss and good thermal stability made it easier to attract more attentions.In this paper, we investigate the electronic and optical properties of STO using LDA + U method.We found that this method predicts more accurate band gap for STO. The oxygen vacancy induced local defect state and new absorption band, which enhanced the efficiency of absorption in the visible region.KeywordsFirst-Principles Calculation, SrTiO3, Defect, Electronic Structure, Optical Properties具有氧缺陷的SrTiO3的电子结构和光学性质的第一性原理研究陈清源,何垚*云南大学物理科学技术学院,昆明*通讯作者。
准一维超导体K2Mo3As3中超导电性的再现
Reemergence of superconductivityin pressurized quasi-one-dimensional superconductor K2Mo3As3Cheng Huang1,2*, Jing Guo1,4*, Kang Zhao1,2*, Fan Cui1,2, Shengshan Qin1,2, Qingge Mu1, Yazhou Zhou1, Shu Cai1,2, Chongli Yang1, Sijin Long1,2, Ke Yang3, Aiguo Li3,Qi Wu1, Zhian Ren1,2, Jiangping Hu1,2 and Liling Sun1,2,4†1Institute of Physics and Beijing National Laboratory for Condensed Matter Physics,Chinese Academy ofSciences, Beijing 100190, China2University of Chinese Academy of Sciences, Beijing 100190, China3Shanghai Synchrotron Radiation Facilities, Shanghai Institute of Applied Physics, Chinese Academy of Sciences,Shanghai 201204, China4Songshan Lake Materials Laboratory, Dongguan, Guangdong 523808, China Here we report a pressure-induced reemergence of superconductivity in recently discovered superconductor K2Mo3As3, which is the first experimental case observed in quasi-one-dimensional superconductors. We find that, after full suppression of the ambient-pressure superconducting (SC-I) state at 8.7 GPa, an intermediary non-superconducting state sets in and prevails to the pressure up to 18.2 GPa, however, above this pressure a new superconducting (SC-II) state appears unexpectedly. High pressure x-ray diffraction measurements demonstrate that the pressure-induced dramatic change of the lattice parameter c contributes mainly to the emergence of the SC-II state. Combined with the theioretical calculations on band strcture, our results suggest that the reemergemce of superconductivity is associated with the change of the complicated interplay among different orbital electrons, driven by the pressure-induced unisotropic change of the lattice.The discoveries of the copper oxide and iron-based high-T c unconventional superconductors have generated considerable interest over the past 30 years due to their unusal superconducting mechanism and great potential for application. A common feature of these superconductors is that they contain d orbital electrons in their quasi-two-dimentional lattice that results in intriguing superconductivity and other exotic properties [1-6]. Recently, a family of CrAs-based superconductors with superconducting transition temperatures (T c) of 2.2 - 8.6 K were found in X2Cr3As3 (X=Na, K, Rb, Cs) compounds, which possess the features of containing d orbital electrons in a quasi-one-dimensional lattice [7-10] and many unconventional properties [11]. Soon after, a new family of quasi-one-dimmensional MoAs-based superconductors Y2Mo3As3(Y= K, Rb, Cs) with T c s from 10.4 K to 11.5 K was discovered [12-14]. The properties of the upper critical field and specific-heat coefficient of the Y2Mo3As3 superconductors are similar to those of X2Cr3As3.The crystal structure of the Y2Mo3As3 superconductors is same as that of X2Cr3As3, crystallized in a hegxagonal unit cell without an inversion symmetry [12]. The alkali metallic atoms serve as the charge reservoir and the Mo-As chains are responsible for their superconductivity [12]. Since these superconductors host non-centrosymmetric structure that usually connects to the unconventional pairings and exotic physics, they have received considerable attentions in the field of superconductivity researches [15-19].Pressure tuning is a clean way to provide significant information on evolution among superconductivity, electronic state, and crystal structure without changing the chemical composition, and eventually benefits for a deeper understanding of the underlying physics of the puzzling state emerged from ambient-pressure materials[2,20-24]. Earlier high pressure studies on X2Cr3As3(X=K and Rb) below ~4 GPa found that its superconductivity can be dramatically suppressed by external pressure [25,26], however, high pressure studies on the K2Mo3As3 superconductor is still lacking. In this study, we performed the in-situ high pressure transport measurements on the K2Mo3As3 sample up to 50 GPa to know what is new for this compound under high pressure.The polycrystalline (wire-like) samples, as shown in the inset of Fig. 1a, were synthesized using a conventional solid-state reaction method, as described in Ref. [12]. High pressure was generated by a diamond anvil cell made from a Be-Cu alloy with two opposing anvils. Diamond anvils with 300 culets (flat area of the diamond anvil) were used for the experiments. In the resistance measurements, we used platinum foil as electrodes, rhenium plate as gasket and cubic boron nitride as insulating material. The four-probe method was employed to determined pressure dependence of superconducting transition temperature. In the high-pressure ac susceptibility measurements, the sample was surrounded by a secondary coil (pickup coil), above which a field-generating primary coil was wounded [21, 27]. High-pressure angle dispersive x-ray diffraction (XRD) measurements were carried out at beamline 15U at the Shanghai Synchrotron Radiation Facility. A monochromatic x-ray beam with a wavelength of 0.6199 Å was adopted. The pressure was determined by ruby fluorescence method [28]. Given that the sample reacts with the pressure transmitting mediums under pressure, no pressure medium was adopted in all high-pressure measurements.Figure1a shows the temperature dependence of the electrical resistance of the ambient-pressure sample with an onset T c of about 10.4 K, in good agreement with the previous report [12]. Figure 1b-1d show the high pressure results. It is seen that theresistance at 1.2 GPa shows a remarkable drop starting at ~9.2 K and reaches zero at ~ 4.5 K (inset of Fig. 1b), indicating that the applied pressure decreases the onset T c from 10.4 K to 9.2 K. Upon further increasing pressure to 1.5 GPa, the sample loses its zero resistance and its T c shifts to lower temperature, reflecting that the superconductivity of this polycrystalline sample is highly sensitive to the applied pressure. Then, T c decreases continuously with a rate of d T c/d P= -1.19 K/GPa until cannot be detected at 8.7 GPa down to 1.6 K (Fig. 1b). The non-superconducting state persists to the pressure of 18.2 GPa, at which unexpectedly another remarkable resistance drop is found at ~ 4.6 K (Fig. 1c). This drop becomes more pronounced with further compression (Fig. 1d), and plunges about 92% at 47.4 GPa. Moreover, we find that the onset temperature of the new resistance drop shifts to high temperature with increasing pressure initially (the inset of Fig. 1d), reaches a maximum (~8.1 K) at ~ 30 GPa and saturats up to ~38 GPa. By applying higher pressure to 47.4 GPa, the temperature of the drop displays a slow decline (inset of Fig. 1d).To confirm whether the new resistance drop observed in K2Mo3As3 is related to a superconducting transition, we applied magnetic field to the sample subjected to 19.6 GPa and 41.8 GPa, respectively (Fig. 2a and 2b). It can be seen that this new resistance drop shifts to lower temperature with increasing magnetic field and almost suppressed under the magnetic field of 3.5 T and 4.0 T for the compressed sample at 19.6 GPa and 41.8 GPa, respectively. These results indicate that the new resistance drop should be resulted from a superconducting transition. The alternating-current (ac) susceptibility measurements were also performed for the sample subjected to 20 GPa - 44 GPa down to 1.5 K, the lowest temperature of our instrument, but the diamagnetism is not detected. By our analysis, the failure of the measurements on the diamagnetism may be related to the low volume fraction of the pressure-induced superconducting phase.We extract the field (H) dependence of T c for K2Mo3As3 at 19.6 GPa and 41.8 GPa (Fig. 2a and 2b) and plot the H(T c) in Fig. 2c. The experimental data is fitted by using Ginzburg-Landau (GL) formula, which allows us to estimate the values of the upper critical magnetic field (H C2) at zero temperature: 4.0 T at 19.6 GPa and 4.8 T at 41.8 GPa (Fig. 2c). Note that the upper critical fields obtained at 19.6 GPa and 41.8GPa are lower than their corresponding Pauli paramagnetic limits (10.3 T and 14.8T, respectively), suggesting that the nature of the pressure-induced superconducting state may differ from that of the initial superconducting state.To investigate whether the observed reemergence of superconductivity in pressurized K2Mo3As3 is associated with the pressure-induced crystal structure phase transition, we performed in-situ high pressure XRD measurements. The XRD patterns collected at different pressures are shown in Fig. 3. No structure phase transition is observed under pressure up to 51.6 GPa. And all peaks shift to higher angle due to the shrinkage of the lattice, except for the (002) peak. It is found that the (002) peak, which is realted to the parameter c, shifts toward to the lower angle starting at 8.8 GPa. Upon further compression, it becomes more pronounced. We propose that the left shift of the (002) peak may be a consequence of the pressure-induced elongation of the polycrystalline wire-like samples (the direction of the wire length is the c-axis of the K2Mo3As3 crystal lattice) due to their preferred orientation under pressure (see the right panel of Fig. 3). At higher pressure, the wire-like samples aline themselves perpendicular to the pressure direction applied.We summarise our results in Fig. 4a.The pressure-T c phase diagram clearly reveals three distinct superconducting regions: the initial superconducting state (SC-I), intermediary non-superconducting state (NSC) and the pressure-induced superconducting state (SC-II). In the SC-I region between 1 bar and 8.7 GPa, T c issuppressed with applied pressure, and not detectable above 8.7 GPa. In the SC-II region, T c increases with pressure and reaches the maximum (8.1 K) at 30 GPa. Upon further compression, T c shows slow a slight decline. This is the first observation of reemerging superconductivity in one-dimensional superconductors, to the best of our knowledge.We extract the lattice parameters and volume as a function of pressure, and summarise these results in Fig. 4b. It is found that the lattice constant a displays a decrease monotonously with pressure, while the lattice constant c shows a complicated relation with pressure applied. In the SC-I region, the parameter c shrinks upon increasing pressure, but it unusually expands in the NSC region. At the pressure of 18.2 GPa, the superconductivity reemerges and the lattice constant a and c decrease simultaneously with pressure again as what is seen in the SC-I region, implying that the pressure-induced elongation effect on the wire-like sample is satuated. The pressure dependence of the volume for K2Mo3As3 is shown in the inset of the Fig. 4b, displaying that the sample volume remains almost unchanged due to the increase of parameter c and the decrease of parameter a concurrently with elevating pressure in the NSC region. The strong correlation between the lattice parameters and the superconductivity in pressurized K2Mo3As3 suggests that the remarkable change of parameter c may paly an important role for the development of the SC-II state.To understand the underlying correlation between T c and the electronic state in K2Mo3As3 further, we performed the first-principles calculations on its electronic structure, based on our XRD results, by using the projector-augmented wave (PAW) method (see the Supplemental Material [29]). We find that the percentage of the density of states (P-DOS) at Fermi level for K2Mo3As3 is dominated by the electrons from the d xy and d x2-y2 orbitals in the pressure range investigated, with a secondary contribution from the d z2,p x and p y orbitals, and the P-DOSs of the p z, d xz, d yz and sorbitals are relatively small (see the Supplemental Material [29]). We note that, in the NSC and SC-II regions, the P-DOSs of the d xy, and d x2-y2orbitals decrease continuously with elevating pressure over the experimental range investigated, however, the change trend of the P-DOSs contributed by the d z2 and the p x as well as the p y orbitals displays differently. In the NSC region, the P-DOS of the d z2 orbital exibits a remarkable increase, while that of the p orbitals shows a slow decline (Fig. 4c). As the P-DOSs of the d z2 orbital and p orbitals reach a maximum and minimum respectively, SC-II state appears. Note that the T c value of the SC-II state increases upon compression in the pressure range of 18.2 GPa – 27 GPa, just where the P-DOS of the d z2 orbital displays a decrease again. Meanwhile, the P-DOSs of the p x and p y orbitals appear an increase in the same pressure range. Further compression from 27 GPa to 40 GPa, T c of the SC-II state stays almost constant, and the corresponding P-DOSs of the d z2 and p orbitals show a small change (Fig. 4c). These results suggest that the emergence of the SC-II state in K2Mo3As3 and its T c change with pressure are the consequence of the interplay among the different orbital electrons.In conclusion, the pressure-induced reemergence of the superconductivity is observed for the first time in the qausi-one-demensional superconductor K2Mo3As3. An intimate correlation between T c’s of the ambient-pressure and high-pressure superconducting states, lattice parameters and the density of state contributed by d z2, p x and p y orbitals have been revealed. We find that the initial superconducting state (SC-I) is suppressed by pressure at 8.7 GPa, and then an intermediary non-superconducting (NSC) state sets in and stabilizes up to 18 GPa. Subsequently, a new superconduting state (SC-II) emerges and prevails up to 47.4 GPa. Our synchrotron x-ray diffraction results indicats that the reemergence of superconductivity is not associated with anycrystal structure phase transition. In combination of theoretical calculations on the band strcture, our results suggest that the appearance of the SC-II state found in this material is a consenquence of the dramatic interplay among different orbital electrons due to the pressure-induced lattice change. We hope that the results found in this study will shed new light on understanding the correlation among superconductivity, electronic and lattice structures in unconventional quasi-one dimentional superconductors.AcknowledgementsWe thank Prof. V. A. Sidorov for useful discussions. The work was supported by the National Key Research and Development Program of China (Grant No. 2017YFA0302900, 2016YFA0300300 and 2017YFA0303103), the NSF of China (Grants No. U2032214, 12004419 and 12074414) and the Strategic Priority Research Program (B) of the Chinese Academy of Sciences (Grant No. XDB25000000). J. G. is grateful for support from the Youth Innovation Promotion Association of the CAS (2019008).*contributed equally to this work.†To whom correspondence may be addressed. Email: llsun@Reference[1].J. G. Bednorz and K. A. Müller, Possible high T c superconductivity in the Ba-La-Cu-O system, Z. Phys. B 64, 189 (1986).[2].M. K. Wu, J. R. Ashburn, C. J. Torng, P. H. Hor, R. L. Meng, L. Gao, Z. J. Huang,Y. Q. Wang, and C. W. Chu, Superconductivity at 93 K in a new mixed-phase Y-Ba-Cu-O compound system at ambient pressure. Phys. Rev. Lett. 58, 908 (1987).[3]. A. Schilling, M. Cantoni, J. D. Guo, and H. R. Ott, Superconductivity above 130K in the Hg–Ba–Ca–Cu–O system.Nature 363, 56 (1993).[4].H. Maeda, Y. Tanaka, M. Fukutomi, and T. Asano, A new high-T c oxidesuperconductor without a rare-earth element, Jpn. J. of Appl. Phys.27, L209 (1988).[5].Y. Kamihara, T. Watanabe, M. Hirano, H. Hosono, Iron-Based LayeredSuperconductor LaO1-x F x FeAs (x=0.05-0.12) with T c=26 K, J. Am. Chem. Soc.130, 3296 (2008).[6]. F. C. Hsu, J. Y. Luo, K. W. Yeh, T. K. Chen, T. W. Huang, M. P. Wu, Y. C. Lee, Y.L. Huang, Y. Y. Chu, D. C. Yan, M. K. Wu, Superconductivity in the PbO-type structure α-FeSe. Proc. Natl. Acad. Sci. U.S.A.105, 14262 (2008).[7].J. K. Bao, J. Y. Liu, C. W. Ma, Z. H. Meng, Z. T. Tang, Y. L. Sun, H. F. Zhai, H.Jiang, H. Bai, C. M. Feng, Z. A. Xu, and G. H. Cao, Superconductivity in Quasi-One-Dimensional K2Cr3As3 with Significant Electron Correlations, Phys. Rev. X 5, 011013 (2015).[8].Z. T. Tang, J. K. Bao, Y. Liu, Y. L. Sun, A. Ablimit, H. F. Zhai, H. Jiang, C. M.Feng, Z. A. Xu, and G. H. Cao, Unconventional superconductivity in quasi-one-dimensional Rb2Cr3As3, Phys. Rev. B 91, 020506 (R) (2015).[9].Z. T. Tang, J. K. Bao, Z. Wang, H. Bai, H. Jiang, Y. Liu, H. F. Zhai, C. M. Feng,Z. A. Xu, and G. H. Cao, Superconductivity in quasi-one-dimensional Cs2Cr3As3 with large interchain distance, Sci China Mater 58, 16 (2015).[10].Q. G. Mu, B. B. Ruan, B. J. Pan, T. Liu, J. Yu, K. Zhao, G. F. Chen, and Z. A. Ren,Ion-exchange synthesis and superconductivity at 8.6 K of Na2Cr3As3 with quasi-one-dimensional crystal structure, Phys. Rev. Materials 2, 034803 (2018).[11].H. Z. Zhi, T. Imai, F. L. Ning, J. K. Bao, and G. H. Cao, NMR Investigation of theQuasi-One-Dimensional Superconductor K2Cr3As3, Phys. Rev. Lett. 114, 147004 (2015).[12].Q. G. Mu, B. B. Ruan, K. Zhao, B. J. Pan, T. Liu, L. Shan, G. F. Chen, and Z. A.Ren, Superconductivity at 10.4 K in a novel quasi-one-dimensional ternary molybdenum pnictide K2Mo3As3, Science Bulletin 63, 952 (2018).[13].K. Zhao, Q. G. Mu, B. B. Ruan, M. H. Zhou, Q. S. Yang, T. Liu, B. J. Pan, S.Zhang, G. F. Chen, and Z. A. Ren, A New Quasi-One-Dimensional Ternary Molybdenum Pnictide Rb2Mo3As3 with Superconducting Transition at 10.5 K, Chin. Phys. Lett. 37, 097401 (2020).[14].K. Zhao, Q. G. Mu, B. B. Ruan, T. Liu, B. J. Pan, M. H. Zhou, S. Zhang, G. F.Chen, and Z. A. Ren, Synthesis and superconductivity of a novel quasi-one-dimensional ternary molybdenum pnictide Cs2Mo3As3, APL Mater. 8, 031103 (2020).[15].X. X. Wu, F. Yang, C. C. Le, H. Fan, and J. P. Hu, Triplet p z-wave pairing in quasi-one-dimensional A2Cr3As3superconductors (A = K, Rb, Cs), Phys. Rev. B 92, 104511 (2015).[16].H. Jiang, G. H. Cao, and C. Cao, Electronic structure of quasi-one-dimensionalsuperconductor K2Cr3As3 from first-principles calculations, Scientific Reports 5, 16054 (2015).[17].X. X. Wu, C. C. Le, J. Yuan, H. Fan, and J. P. Hu, Magnetism in quasi-one-dimensional A2Cr3As3 (A = K, Rb) superconductors, Chin. Phys. Lett. 32, 057401 (2015).[18].Y. Zhou, C. Cao, F. C. Zhang, Theory for superconductivity in alkali chromiumarsenides A2Cr3As3 (A = K, Rb, Cs), Science Bulletin 62, 208 (2017).[19].H. T. Zhong, X. Y. Feng, H. Chen, and J. H. Dai, Formation of molecular-orbitalbands in a twisted hubbard tube: implications for unconventional superconductivity in K2Cr3As3, Phys. Rev. Lett. 115, 227001 (2015).[20].J. H. Eggert, J. Z. Hu, H. K. Mao, L. Beauvais, R. L. Meng, and C. W. Chu,Compressibility of the HgBa2Ca n−1Cu n O2n+2+δ(n=1,2,3) high-temperature superconductors, Phys. Rev. B 49, 15299 (1994).[21].X. J. Chen, V. V. Struzhkin, Y. Yu, A. F. Goncharov, C. T. Lin, H. K. Mao, and R.J. Hemley, Enhancement of superconductivity by pressure-driven competition in electronic order, Nature (London) 466, 950 (2010).[22].H. Takahashi, K. Igawa, K. Arii, Y. Kamihara, M. Hirano, and H. Hosono,Superconductivity at 43 K in an iron-based layered compound LaO1-x F x FeAs, Nature (London) 453, 376 (2008).[23].L. L. Sun, X. J. Chen, J. Guo, P. W. Gao, Q. Z. Huang, H. D. Wang, M. H. Fang,X. L. Chen, G. F. Chen, Q. Wu, C. Zhang, D. C. Gu, X. L. Dong, L. Wang, K.Yang, A. G. Li, X. Dai, H. K. Mao, and Z. X. Zhao, Re-emerging superconductivity at 48 kelvin in iron cha lcogenides, Nature (London) 483, 67 (2012).[24].L. Z. Deng, Y. P. Zheng, Z. Wu, S. Y. Huyan, H. C. Wu, Y. F. Nie, K. J. Cho, andC. W. Chu, Higher superconducting transition temperature by breaking theuniversal pressure relation, Proc. Natl. Acad. Sci. USA 116, 2004 (2019). [25].T. Kong, S. L. Bud’ko, and P. C. Canfield, Anisotropic H c2, thermodynamic andtransport measurements, and pressure dependence of T c in K2Cr3As3 single crystals, Phys. Rev. B 91, 020507 (R) (2015).[26].Z. Wang, W. Yi, Q. Wu, V. A. Sidorov, J. K. Bao, Z. T. Tang, J. Guo, Y. Z. Zhou,S. Zhang, H. Li, Y. G. Shi, X. X. Wu, L. Zhang, K. Yang, A. G. Li, G. H. Cao, J.P. Hu, L. L. Sun, and Z. X. Zhao, Correlation between superconductivity and bondangle of CrAs chain in noncentrosymmetric compounds A2Cr3As3 (A = K, Rb), Scientific Reports 6, 37878 (2016).[27].Y. A. Timofeev, V. V. Struzhkin, R. J. Hemley, H. K. Mao, and E. A. Gregoryanz,Improved techniques for measurement of superconductivity in diamond anvil cells by magnetic susceptibility, Rev. Sci. Instru. 73, 371 (2002).[28].H. K. Mao, J. Xu, and P. M. Bell, Calibration of the Ruby Pressure Gauge to 800kbar Under Quasi-Hydrostatic Conditions, J. Geophys. Res. 91,4673 (1986). [29].See the supplementary material for electronic structure calculations; also see Refs.[30-36][30].P. E. Blöchl, Phys. Rev. B 50, 17953 (1994).[31].G. Kresse and D. Joubert, Phys. Rev. B 59, 1758 (1999).[32].G. Kresse and J. Hafner, Phys. Rev. B 47, 558 (1993).[33].G. Kresse and J. Furthmüller, Comput. Mater. Sci. 6, 15 (1996).[34].G. Kresse and J. Furthmüller, Phys. Rev. B 54, 11169 (1996).[35].J. P. Perdew, K. Burke, and M. Ernzerhof, Phys. Rev. Lett. 77, 3865 (1996).[36].H. J. Monkhorst and J. Pack, Phys. Rev. B 13, 5188 (1976).Fig. 1 (a) Resistance as a function of temperature for quausi-one-dimensional superconductor K2Mo3As3 at ambient pressure and its polycrystallined-sample’s image taken by a scanning electron microscope (inset). (b)-(d) Temperature dependence of the resistance in the pressure range of 1.2 GPa -8.7 GPa, 8.7-18.2 GPa, and 18.2-47.4 GPa, respectively. The insets of figure (b) and (d) display enlarged views of the the resistance in the low temperature regime.Fig. 2 Temperature dependence of resistance under different magnetic fields for K2Mo3As3measured at 19.6 GPa (a) and 41.8 GPa (b), respectively. (c) Plot of superconducting transition temperature T c versus critical field (H C2) for K2Mo3As3 at 19.6 GPa and 41.8 GPa, respectively. The dished lines represent the Ginzburg-Landau (GL) fits to the data of H C2.Fig. 3 X-ray diffraction patterns collected in the pressure range of 3.8 – 51.6 GPa for K2Mo3As3. The right panel schematically shows the evolution of the preferred orientation of the wire-like samples under pressures. SC-I and SC-II stand for the ambient-pressure superconducting state and the reemergence supercnducting states, respectively. NSC represents non-superconducting state.Fig 4 Superconductivity, crystal and electronic structure information for the qausi-one-dementional superconductor K2Mo3As3. (a) Pressure-Temperature phase diagram. (b) Pressure dependence of lattice parameters and volume (see inset). (c) Plots ofpercentage of the density of state (P-DOS) contrinuted by the d z2, p x and p y orbitals versus pressure.。
微空心阴极放电的3维数值模拟

微空心阴极放电的3维数值模拟
以《微空心阴极放电的3维数值模拟》为标题,本文将介绍微空心阴极放电(microhollow cathode discharge,MHD)的三维数值模拟方法。
首先,MHD是一种流体动力学通量控制的电放电现象,它可以通过分析电离气体动力学和电磁学的特性来解释。
MHD的性能评估分析依赖于准确的电流和动能流量计算,而由于MHD的复杂性,传统的实验法和理论分析方法无法有效地提供准确的数据,因此近年来数值模拟被广泛应用于MHD的性能评估分析。
其次,为了有效地实现MHD的三维数值模拟,需要建立数学模型来描述MHD的特性,具体过程如下:1.构建具有电离气体和电磁学特性的偏微分方程系统,该系统包括三维电荷守恒方程、温度方程、电流和动能方程等;2.基于有限元方法,对方程进行数值求解,获得电离气体的电流、电位场和温度场等参量的定性和定量的结果;3.通过数据的可视化,可以清晰地描绘出MHD的形态和动态性质。
在实际应用中,MHD的三维数值模拟可以用于研究器件间力学耦合关系,并且可以用于预测周围电磁场对器件的影响,以及电流和动能交换等问题。
同时,它还可以用来提高微空心阴极的节能性能,改善其功率利用率。
最后,微空心阴极放电的3维数值模拟是一种重要的工具,可以有效地评估MHD的性能,获得准确的参数以及研究MHD的动态性质,并可应用于提高微空心阴极的节能性能和功率利用率。
综上所述,本文研究了微空心阴极放电的三维数值模拟,介绍了建立模型的过程,以及实际应用中的准确性、可视化等特性。
未来仍需解决微空心阴极放电数值模拟中的一些具体问题,以确保微空心阴极的效率性和可靠性。
物理类期刊分区

PROGRESS IN PARTICLE AND NUCLEAR PHYSICS 物理 2 SPECTROCHIMICA ACTA PART B-ATOMIC SPECTROSCOPY 物理 2 SUPERCONDUCTOR SCIENCE & TECHNOLOGY 物理 2 ACTA CRYSTALLOGRAPHICA SECTION A 物理 3 ANNALEN DER PHYSIK 物理 3 APPLIED OPTICS 物理 3 APPLIED PHYSICS A-MATERIALS SCIENCE & PROCESSING 物理 3 ARCHIVE FOR RATIONAL MECHANICS AND ANALYSIS 物理 3 ATOMIC SPECTROSCOPY 物理 3 CHAOS 物理 3 CHINESE PHYSICS 物理 3 COMMUNICATIONS IN MATHEMATICAL PHYSICS 物理 3 COMPUTER PHYSICS COMMUNICATIONS 物理 3 COMPUTERS & FLUIDS 物理 3 EUROPEAN PHYSICAL JOURNAL A 物理 3 EUROPEAN PHYSICAL JOURNAL B 物理 3 EUROPEAN PHYSICAL JOURNAL D 物理 3 FEW-BODY SYSTEMS 物理 3 INTERNATIONAL APPLIED MECHANICS 物理 3 INTERNATIONAL JOURNAL OF HEAT AND MASS TRANSFER 物理 3 INTERNATIONAL JOURNAL OF MODERN PHYSICS A 物理 3 INTERNATIONAL JOURNAL OF MULTIPHASE FLOW 物理 3 INTERNATIONAL JOURNAL OF SOLIDS AND STRUCTURES 物理 3 JAPANESE JOURNAL OF APPLIED PHYSICS PART 1-REGULAR PAPERS SHORT 3NOTES & REV 物理 JETP LETTERS 物理 3 JOURNAL OF COMPUTATIONAL PHYSICS 物理 3 JOURNAL OF CRYSTAL GROWTH 物理 3 JOURNAL OF ELECTRON SPECTROSCOPY AND RELATED PHENOMENA 物理 3 JOURNAL OF EXPERIMENTAL AND THEORETICAL PHYSICS 物理 3 JOURNAL OF FLUID MECHANICS 物理 3 JOURNAL OF LUMINESCENCE 物理 3 JOURNAL OF MAGNETISM AND MAGNETIC MATERIALS 物理 3 JOURNAL OF MATHEMATICAL PHYSICS 物理 3 JOURNAL OF MODERN OPTICS 物理 3 JOURNAL OF MOLECULAR SPECTROSCOPY 物理 3 JOURNAL OF NEAR INFRARED SPECTROSCOPY 物理 3 JOURNAL OF NONLINEAR SCIENCE 物理 3 JOURNAL OF NON-NEWTONIAN FLUID MECHANICS 物理 3 JOURNAL OF OPTICS A-PURE AND APPLIED OPTICS 物理 3 JOURNAL OF OPTICS B-QUANTUM AND SEMICLASSICAL OPTICS 物理 3 JOURNAL OF PHYSICS A-MATHEMATICAL AND GENERAL 物理 3 JOURNAL OF PHYSICS B-ATOMIC MOLECULAR AND OPTICAL PHYSICS 物理 3 JOURNAL OF PHYSICS D-APPLIED PHYSICS 物理 3 JOURNAL OF PHYSICS G-NUCLEAR AND PARTICLE PHYSICS 物理 3 JOURNAL OF PHYSICS-CONDENSED MATTER 物理 3 JOURNAL OF POLYMER SCIENCE PART B-POLYMER PHYSICS 物理 3 JOURNAL OF QUANTITATIVE SPECTROSCOPY & RADIATIVE TRANSFER 物理 3 JOURNAL OF RAMAN SPECTROSCOPY 物理 3 JOURNAL OF STATISTICAL PHYSICS 物理 3 JOURNAL OF SYNCHROTRON RADIATION 物理 3 JOURNAL OF THE ACOUSTICAL SOCIETY OF AMERICA 物理 3 JOURNAL OF THE OPTICAL SOCIETY OF AMERICA A-OPTICS IMAGE SCIENCE AND VISION 物理 3 JOURNAL OF THE PHYSICAL SOCIETY OF JAPAN 物理 3 JOURNAL OF TURBULENCE 物理 3 JOURNAL OF VACUUM SCIENCE & TECHNOLOGY B 物理 3 LIQUID CRYSTALS 物理 3
里德堡原子微波电场测量

doi:10.11823/j.issn.1674-5795.2021.01.01里德堡原子微波电场测量白金海,胡栋,贡昊,王宇(航空工业北京长城计量测试技术研究所,北京100095)摘要:里德堡原子是处于高激发态的原子,其主量子数大、寿命高,具有极化率高、电偶极矩大等特点,对外电场十分敏感。
基于热蒸气室中里德堡原子的量子干涉原理(电磁感应透明和Autler-Towns分裂效应)的微波电场精密测量不仅具有远高于传统偶极天线的灵敏度,且具有自校准、对外电场干扰少、测量频率范围大等优点,是下一代电场测量标准。
本文综述了里德堡原子的微波电场测量研究,详细介绍了其基本原理和当前研究进展,并讨论了未来发展方向。
关键词:量子精密测量;里德堡原子;微波电场;电磁感应透明中图分类号:TB97文献标识码:A文章编号:1674-5795(2021)01-0001-09Rydberg Atoms Based Microwave Electric Field SensingBAIJinhai,HU Dong,GONG Hao$WANG Yu(Changcheng Institute of Metrology&Measurement,Beijing100095,China)Abstract:Rydberg atoms are the atoms in highly excited states with lar-e principaO quantum numbers n,and long lifetimes.The lar-e Ryd-ber-atom polarizabilitu and strong dipole transitions between enereetically nearby states are highly sensitive to electris fielOs.The new developed scheme for microwave electric field precision measurement is based on quantum interference effects(electromaaneticclly induced transparency and Autler-Townes splitting)in Rydbere atoms contained in a dielectric vapoe cell.The mininium measured strengths of microwave electric fieies of the new scheme are far below the standard values obtained by traditional antenna methods.And it has several advantages,such as self-calibration,non-perturbation to the measured field,a broadband measurement frequency range,etc,is the next-generation electric field standard.In this review,we describe work on the new method for measuring microwave electric field based on Rydberg atoms.We introducc the basic theory and experimental techniques of the new method,and discuss the future development direction.Key words:quantum precision measurement;Rydberg atoms;microwave electric fielO;electromagnetically induced transparency0引言原子是一种典型的量子体系,具有可复现、性能稳定、能级精确等优点。
Sukeun Yoon 菜花状WO3的导电表面改性及其作为锂离子电池的电化学性能
Conductive surface modification of cauliflower-like WO 3and its electrochemical properties for lithium-ionbatteriesSukeun Yoon a ,⇑,Sang-Gil Woo b ,Kyu-Nam Jung c ,Huesup Song a ,⇑aDivision of Advanced Materials Engineering,Kongju National University,Chungnam 330-717,Republic of Korea bAdvanced Batteries Research Center,Korea Electronics Technology Institute,Gyeonggi 463-816,Republic of Korea cEnergy Efficiency and Materials Research Division,Korea Institute of Energy Research,Daejeon 305-343,Republic of Koreaa r t i c l e i n f o Article history:Received 25March 2014Received in revised form 29May 2014Accepted 2June 2014Available online 14June 2014Keywords:Lithium-ion batteries AnodeTungsten oxideHydrothermal reactiona b s t r a c tCauliflower-like WO 3was synthesized by a hydrothermal reaction without a surfactant,followed by firing,and was investigated as an anode material for lithium-ion battery applications.The scanning electron microscope (SEM)and transmission electron microscope (TEM)characterization indicated that WO 3nanorods had an aggregation framework and built a cauliflower morphology.With the objective of understanding the charge–discharge process within a voltage range of 0–3V vs.Li +/Li,in situ X-ray diffraction was used and a complex reaction of intercalation and conversion of WO 3was revealed for the first time.The cauliflower-like WO 3after being decorated with carbon provides a high gravimetric capacity of >635mA h/g (Li 5.5WO 3)with good cycling and a high rate capability when used as an anode in lithium-ion batteries.Based on our studies,we attribute the high electrochemical performance to the nanoscopic WO 3particles and a conductive carbon layer,which makes them a potential candidate for lithium-ion batteries.Ó2014Elsevier B.V.All rights reserved.1.IntroductionMetal oxides have been considered and investigated as alternative anodes for use in lithium ion batteries [1].The research focus is on three different mechanism groups:intercalation–deintercalation reaction,alloying-dealloying reaction,and conversion (redox)reaction [2,3].The intercalation–deintercalation mechanism (ex.TiO 2,Li 4Ti 5O 12,Nb 2O 5,KNb 5O 13,MoO 3,etc.)is that transition metal oxides and other compounds with a multi-dimensional layer structure can reversibly intercalate lithium ions into the lattice without destroying their crystal structure.Unfortu-nately,only a small number of lithium ions can be reversibly inserted into intercalation-type materials so that the specific capacity is limited [4–8].The alloying-dealloying mechanism (ex.SnO 2,Sb 2O 3,ZnO 2,etc.)involving MO x +Li ?Li y M +Li 2O is that metal (M)can form an alloy with lithium.The lithium alloying–dealloying reaction normally occurs at low potentials (below 1.0V vs.Li +/Li)and delivers high capacity values but fades extensively during the charge–discharge process [9,10].The conversion mecha-nism (ex.NiO,CuO,Fe 2O 3,Fe 3O 4,Co 3O 4,etc.)usually produces metallic nanoparticles embedded in an insulating Li 2O matrix.Although the materials have generally much higher theoretical capacity than that of already-commercialized graphite,poor electri-cal conductivity and structural instability are the drawback [11–14].Among the transition metal oxides,tungsten oxides (WO 2,WO 3,and WO 3Áx H 2O)as one of the important metal oxides with respect to physicochemical properties,have been extensively investigated for such applications as gas sensors,photocatalysis,electrochromic devices,electronic devices,dye-sensitized solar cells,supercapaci-tors,and lithium ion batteries [15,16].The kinetics of the insertion reaction in metal oxides is often limited by the solid-state diffusion of the ions.The time constant in the process is determined by the chemical diffusion coefficient associated with the chemical structure and the pass length for ion transport connected with microstructure [17].Interestingly,the tungsten oxides have better electronic conductivity (10–10À6S cm À1)than some of the other oxides;in addition,they also rely on designing a nanostructured particle with a small radius and right crystalline phase for fast lith-ium-ion insertion and superior electrochemical performance [18,19].From this point of view,a wide variety of approaches have been pursued over the years for the synthesis of tungsten oxides,such as nanoparticles,nanowires,nanorods,and nanoflowers using various approaches which include a hydrothermal reaction,combustion process,sol–gel process,solution-phase reaction,template directed method,mechanochemical activation,and hot-wire chemical vapor deposition (HWCVD)method [15,16,18,20–26].However,most of/10.1016/j.jallcom.2014.06.0100925-8388/Ó2014Elsevier B.V.All rights reserved.⇑Corresponding authors.Tel.:+82415219378;fax:+82415685776.E-mail addresses:skyoon@kongju.ac.kr (S.Yoon),hssong@kongju.ac.kr (H.Song).the previous approaches led to thehexagonal WO 3,and WO 3Áx H 2O very few studies on Here we report a facile liflower-like carbon-coated WO 3and good cycling performance cauliflower-like carbon-coated diffraction (XRD),(TGA/DTA),scanning electron transmission electron microscopy measurement.The motivation in possibility of using m-WO 3as an batteries and to elucidate its during the charge–discharge 2.ExperimentalThe synthesis procedure is illustrated in of sodium tungstate dihydrate (Na 2WO 4Á100ml deionized (DI)water with mild was added dropwise into the solution until acid was precipitated thoroughly.Then the 250mL DI water,and 13g of potassium the system.The prepared solution was heated at 180°C for 24h with a slurry was then filtered and washed with oven.The powder was finally heated at WO 3(1g)as synthesized above was for a few minutes,followed by the Aldrich).The reaction mixtures were then and subjected to hydrothermal treatment was then filtered and washed with DI The resulting material was isolated by Ar flow at 450°C for 3h.The phase analysis of the D8-Bruker X-ray diffractometer with Cu K a changes that may have occurred during was performed using a lab-made in situ and differential thermal analysis (DTA)SDT 2960in air at a heating/cooling rate of ture,and composition of the synthesized S-4000scanning electron microscope (SEM)sion electron microscope (FE-TEM).The electrodes for the electrochemical wt.%active material powder,15wt.%carbon and 15wt.%polyvinylidene fluoride (PVDF)as a binder to form a slurry,followed by at 120°C for 2h in a vacuum.The CR2032coin cells were assembled using polypro-pylene as a separator,lithium foil as the counter electrode,and 1M LiPF 6in ethylene carbonate (EC)/diethyl carbonate (DEC)(1:1v/v)as the electrolyte.The charge–discharge experiments were performed galvanostatically at a constant current den-sity of 50mA/g of active material within the voltage range of 0–3V vs.Li +/Li.The electrochemical impedance spectroscopic analysis (EIS)was carried out with a Zahner zennium instrument by applying a 10mV amplitude signal in a frequency range of 10kHz to 0.01Hz.For the EIS measurements,an active material content the reflections of samples before and after carbon coating could be indexed based on the m-WO 3phase (JCPD No.43-1035).No peaks corresponding to carbon in the cauliflower-like carbon-coated WO 3are seen due to its amorphous nature.The carbon coating on the surface brought about a little weakening of the intensities of the XRD peaks.It also indicates that the carbon coat-process did not destroy the structure of tungsten oxide.obtain a better characterization of the carbon present in the cauli-flower-like carbon-coated WO 3,a thermogravimetric-derivative thermal analysis (TGA/DTA)was performed as a function temperature (Fig.2(b)).Thermal studies were performed in atmosphere at a heating rate of 5°C/min.The as-prepared sample showed two exothermic DTA peaks below 500°C,corresponding Fig.1.Schematic illustration of the synthetic procedure for cauliflower-like carbon-coated WO 3.2.(a)XRD patterns of cauliflower-like WO 3and cauliflower-like carbon-coated and (b)TGA/DTA plots of cauliflower-like carbon-coated WO3.188the removal of carbon from the sample as CO2,indicating that the sample evolved13wt.%carbon.The absence of exothermic DTA peaks from500to800°C indicates that no further thermal events occurred.The cauliflower-like carbon-coated WO3was further investigated by Raman spectroscopic analysis as shown in Fig.2(c).The modes at1582and1357cmÀ1correspond to,respec-tively,the G(ordered)and D(disordered)bands.The integrated intensity ratio I D/I G is an indication of the degree of graphitization.A high intensity ratio of0.85as compared to0.09in ordered syn-thetic graphite indicates a higher degree of disorder for the carbon present in the carbon-coated WO3[27].Fig.3shows SEM images of the WO3(Fig.3(a–c))and the carbon-coated WO3(Fig.3(d–f)).The WO3had a cauliflower-likeWe investigated the potential use of WO3as an anode material for lithium-ion batteries.The charge–discharge profiles of the cau-liflower-like WO3and cauliflower-like carbon-coated WO3at a constant current of50mA/g are shown in Fig.5.The cauliflower-like WO3showed a plateau between2.7and2.4V on the discharge curve(During discharge process,it is Li+inserted into WO3).It cor-responds to the phase transition from monoclinic(x<0.01in Li x WO3)to tetragonal(0.08<x<0.12in Li x WO3)and further to cubic(0.37<x<0.5Li x WO3)during lithium intercalation[28].In both samples,a feature characteristic of voltage plateau$0.7V vs.Li+/Li was observed and then decreased slowly to0.01V,during thefirst discharge process,which is a common phenomenon of a conversion reaction[24].According to the literature,the thermo-images of(a,b,c)WO3(i.e.,cauliflower-like WO3)and(d,e,f)carbon-coated WO3(i.e.,cauliflower-like carbon-coatedS.Yoon et al./Journal of Alloys and Compounds613(2014)187–192189conductivity of the metal oxide caused by carbon,deeper lithium insertion in WO3,or an undesirable side reaction with the electrolyte related with SEI reduced by the carbon[24,30].differential capacity plots(DCPs)at thefirst cycle for cauli-flower-like WO3and cauliflower-like carbon-coated WO3are reported in Fig.6(a).As mentioned above,the DCPs of the cauli-flower-like WO3display features characteristic of voltage the discharge process at2.7and2.4V corresponding intercalation into WO3.In addition,the peaks at$0.8V and associated with the conversion reaction of WO3(reductive of W6+–W0).The main anodic peaks at$1.23 during the charge process are meanwhile ascribed oxidation reaction.On the other hand,the DCP of theflower-like carbon-coated WO3exhibit voltage plateausconstant excluding the main cathodic peaks atV.However,the cathodic peaks were slightly shifted reaction with the electrolyte related with SEI reducedWith an objective to fully understand the charge–discharge process,in situ XRD analyses of the cauliflower-like WO3were per-formed.Fig.6(b)shows the in situ XRD patterns in the voltage range of3.0–0.00V vs.Li+/Li during the charge–discharge process. In the initial state(at OCV),the phase of WO3is a monoclinic phase (P21/n)and peaks of(200),(020),and(002)near23°all appear at a different scattering angle.As the potential approaches2.31V,the triplet peak at23°becomes a doublet,such as(001)and(110).It was able to be indexed based on the tetragonal phase(P4/nmm,Li x-WO3,x=0.12).Upon further lithium ion insertion from2.0to0.7V, the doublet peak near23°in the tetragonal phase is now seen to be a single peak of(100)corresponding to the cubic phase(Pm3m,Li x-WO3,x=0.5).This structural variation is in good agreement with the results reported by Zhong et al.[32].However,the peak inten-sity of the cubic phase is reduced after0.83V,indicating that the phase reacts partially with lithium due to conversion reaction,as mentioned previously.Furthermore,after the cell has been fully discharged,the electrode in the cell had an amorphous structure, i.e.,the reflections corresponding Li x WO3had disappeared,which implied the decomposition of the Li x WO3phase at0.0V.Although no conversion reaction was observed in the in situ XRD patterns, no reflections corresponding to tungsten metal and Li2O could be seen in the XRD pattern due to their nanosizes smaller than the X-ray coherence length or high background caused by the Be win-dow.While the cell was charged back to3.0V,neither the mono-clinic nor the cubic structure appeared again.Fig.4.(a)TEM image,(b)HRTEM image,and(c)fast Fourier transform(FFT)images over selected regions of cauliflower-like carbon-coated WO3.Thefirst charge–discharge profiles of cauliflower-like WO3and cauliflower-carbon-coated WO3.6.(a)DCP plots of cauliflower-like WO3and cauliflower-like carbon-coated3at thefirst cycle and(b)in situ XRD patterns of cauliflower-like WO3atfirst cycle.Comparison of(a)cycling performances,(b)rate capabilities,and(c)chemical impedance spectra(EIS)after20cycles of cauliflower-like WO3and cauliflower-carbon-coated WO3.In(a)and(b),open and closed symbols refer,respectively,discharge and charge capacity values.The inset in(c)shows an equivalent circuit.cauliflower-like electrode.This implies that the coated samplelower polarization inside the electrode.In order to gaininsight into electrochemical performances,the samples diffraction patterns(SADP)of cauliflower-like WO3(a)after thefirst discharge(Li-insertion)and(b)after thefirst charge(Li-extraction).analyzed by electrochemical impedance spectroscopy(EIS)at20 cycles.Before the EIS measurements,all the samples were dis-charged to a50%depth of discharge(DOD)to reach an identical status.The EIS spectra of the cauliflower-like WO3and cauli-flower-like carbon-coated WO3samples are compared in Fig.8(c).All EIS spectra consist of two semicircles and a line.The small diameter of thefirst semicircle(at the high frequency region) is a measure of the surface layer resistance,which is ascribed to the formation of a complex passivationfilm on the particle surface and lithium-ion diffusion through the surface layer.The diameter of the second semicircle(at the medium–low frequency region)is a measure of the charge transfer resistance,which is related to the contact between the particles or between the electrode and the electrolyte[34].The sloping line is related to lithium-ion diffusion in the bulk of the active material.The cauliflower-like WO3shows surface resistances of17X and a charge transfer resistance of53 X.The EIS spectra of the cauliflower-like carbon-coated WO3,on the other hand,reveals a surface resistance and a charge transfer resistance of6X and16X,respectively.The diameters of both the surface resistance and charge transfer resistance semicircles are smaller than those of the cauliflower-like WO3due to the car-bon material,which has high electrical conductivity.4.ConclusionsWe successfully fabricated the cauliflower-like carbon-coated WO3by a hydrothermal reaction without a surfactant.We then investigated the WO3as an anode material for lithium-ion battery applications.Characterization data collected with SEM and TEM showed an aggregation framework of WO3and built a cauliflower morphology.The electrochemical reaction mechanism of WO3 with lithium was investigated by in situ XRD and the WO3revealed a complex reaction of intercalation and conversion of WO3.The cauliflower-like carbon-coated WO3had advantageous characteris-tics for high performance lithium-ion batteries,including facile electron transport through carbon matrix from each active WO3 to a current collector and effective alleviation of mechanical strain from lithium ion insertion/extraction for a prolonged number of cycles.The high electrochemical performance makes it promising anode material for future lithium-ion batteries.AcknowledgementThis work was conducted under the framework of the Research and Development Program of the Korea Institute of Energy Research(KIER)(B3-2415-03).References[1]P.Poizot,ruelle,S.Grugeon,L.Dupont,J.M.Tarascon,Nature407(2000)496–499.[2]J.Cabana,L.Monconduit,rcher,M.R.Palacín,Adv.Mater.22(2010)E170–E192.[3]M.V.Reddy,G.V.Subba Rao,B.V.R.Chowdari,Chem.Rev.113(2013)5364–5457.[4]J.T.Han,D.Q.Liu,S.H.Song,Y.Kim,J.B.Goodenough,Chem.Mater.21(2009)4753–4755.[5]A.L.Viet,M.V.Reddy,R.Jose,B.V.R.Chowdari,S.Ramakrishna,J.Phys.Chem.C114(2010)664–671.[6]W.Luo,X.Hu,Y.Sun,Y.Huang,J.Mater.Chem.22(2012)4910–4915.[7]M.R.Jo,Y.S.Jung,Y.M.Kang,Nanoscale4(2012)6870–6875.[8]U.K.Sen,S.Mitra,RSC Adv.2(2012)11123–11131.[9]H.Bryngelsson,J.Eskhult,L.Nyholm,M.Herranen,O.Alm,K.Edström,Chem.Mater.19(2007)1170–1180.[10]W.S.Kim,H.Yoon,J.H.Jeun,H.J.Sohn,S.H.Hong,J.Power Sources225(2013)108–112.[11]H.Liu,G.Wang,J.Liu,S.Qiao,H.Ahn,J.Mater.Chem.21(2011)3046–3052.[12]H.Huang,W.Zhu,X.Tao,Y.Xia,Z.Yu,J.Fang,Y.Gan,W.Zhang,ACS Appl.Mater.Inter.4(2012)5974–5980.[13]R.Sahay,P.S.Kumar,V.Aravindan,J.Sundaramurthy,W.C.Ling,S.G.Mhaisalkar,S.Ramakrishna,S.Madhavi,J.Phys.Chem.C116(2012)18087–18092.[14]L.Yu,Z.Wang,L.Zhang,H.B.Wu,X.W.Lou,J.Mater.Chem.A1(2013)122–127.[15]Z.Gua,H.Li,T.Zhai,W.Yang,Y.Xia,Y.Ma,J.Yao,J.Solid State Chem.180(2007)98–105.[16]J.Yang,L.Jiao,Q.Zhao,Q.Wang,H.Gao,Q.Huan,W.Zheng,Y.Wang,H.Yuan,J.Mater.Chem.22(2012)3699–3701.[17]S.H.Lee,H.M.Cheong,C.E.Tracy,A.Mascarenhaus,J.R.Pitts,G.Jorgensen,S.K.Deb,Appl.Phys.Lett.76(2000)3908–3910.[18]A.C.Dillon,A.H.Mahan,R.Deshpande,P.A.Parilla,K.M.Jones,S.H.Lee,ThinSolid Films516(2008)794–797.[19]H.Zheng,J.Z.Ou,M.S.Strano,R.B.Kaner,A.Mitchell,K.Kalantar-zadeh,Adv.Funct.Mater.21(2011)2175–2196.[20]G.Gu,B.Zheng,W.Q.Han,S.Roth,J.Liu,Nano Lett.2(2002)849–851.[21]K.Lee,W.S.Seo,J.T.Park,J.Am.Chem.Soc.125(2003)3408–3409.[22]K.Q.Hong,W.C.Yiu,H.S.Wu,J.Gao,M.H.A.Xie,Nanotechnology16(2005)1608–1611.[23]J.Zhou,Y.Ding,S.Z.Deng,L.Gong,N.S.Xu,Z.L.Wang,Adv.Mater.17(2005)2107–2110.[24]W.J.Li,Z.W.Fu,Appl.Surf.Sci.256(2010)2447–2452.[25]S.Yoon,C.Jo,S.Y.Noh,C.W.Lee,J.H.Song,J.Lee,Phys.Chem.Chem.Phys.13(2011)11060–11061.[26]K.Huang,Q.Zhang,Nano Energy1(2012)172–175.[27]J.Nanda,J.T.Remillard,A.O’Neill,D.Bernardi,T.Ro,K.Nietering,ler,Adv.Funct.Mater.21(2011)3282–3290.[28]Q.Zhong,J.R.Dahn,K.Colbow,J.Electrochem.Soc.139(1992)2406–2409.[29]Q.Wang,Z.Wen,Y.Jeong,J.Choi,K.Lee,J.Li,Nanotechnology17(2006)3116–3120.[30]Y.Qiu,G.L.Xu,Q.Kuang,S.G.Sun,S.Yang,Nano Res.5(2012)826–832.[31]W.R.Liu,J.H.Wang,H.C.Wu,D.T.Shieh,M.H.Yang,N.L.Wu,J.Electrochem.Soc.152(2005)A1719–A1725.[32]Q.Zhong,J.R.Dahn,K.Colbow,Phys.Rev.B46(1992).2554-2260.[33]M.H.Ryu,K.N.Jung,K.H.Shin,K.S.Han,S.Yoon,J.Phys.Chem.C117(2013)8092–8098.[34]H.C.Shin,W.Cho,H.Jang,Electrochim.Acta52(2006)1472–1476.192S.Yoon et al./Journal of Alloys and Compounds613(2014)187–192。
物理学专业英语

华中师范大学物理学院物理学专业英语仅供内部学习参考!2014一、课程的任务和教学目的通过学习《物理学专业英语》,学生将掌握物理学领域使用频率较高的专业词汇和表达方法,进而具备基本的阅读理解物理学专业文献的能力。
通过分析《物理学专业英语》课程教材中的范文,学生还将从英语角度理解物理学中个学科的研究内容和主要思想,提高学生的专业英语能力和了解物理学研究前沿的能力。
培养专业英语阅读能力,了解科技英语的特点,提高专业外语的阅读质量和阅读速度;掌握一定量的本专业英文词汇,基本达到能够独立完成一般性本专业外文资料的阅读;达到一定的笔译水平。
要求译文通顺、准确和专业化。
要求译文通顺、准确和专业化。
二、课程内容课程内容包括以下章节:物理学、经典力学、热力学、电磁学、光学、原子物理、统计力学、量子力学和狭义相对论三、基本要求1.充分利用课内时间保证充足的阅读量(约1200~1500词/学时),要求正确理解原文。
2.泛读适量课外相关英文读物,要求基本理解原文主要内容。
3.掌握基本专业词汇(不少于200词)。
4.应具有流利阅读、翻译及赏析专业英语文献,并能简单地进行写作的能力。
四、参考书目录1 Physics 物理学 (1)Introduction to physics (1)Classical and modern physics (2)Research fields (4)V ocabulary (7)2 Classical mechanics 经典力学 (10)Introduction (10)Description of classical mechanics (10)Momentum and collisions (14)Angular momentum (15)V ocabulary (16)3 Thermodynamics 热力学 (18)Introduction (18)Laws of thermodynamics (21)System models (22)Thermodynamic processes (27)Scope of thermodynamics (29)V ocabulary (30)4 Electromagnetism 电磁学 (33)Introduction (33)Electrostatics (33)Magnetostatics (35)Electromagnetic induction (40)V ocabulary (43)5 Optics 光学 (45)Introduction (45)Geometrical optics (45)Physical optics (47)Polarization (50)V ocabulary (51)6 Atomic physics 原子物理 (52)Introduction (52)Electronic configuration (52)Excitation and ionization (56)V ocabulary (59)7 Statistical mechanics 统计力学 (60)Overview (60)Fundamentals (60)Statistical ensembles (63)V ocabulary (65)8 Quantum mechanics 量子力学 (67)Introduction (67)Mathematical formulations (68)Quantization (71)Wave-particle duality (72)Quantum entanglement (75)V ocabulary (77)9 Special relativity 狭义相对论 (79)Introduction (79)Relativity of simultaneity (80)Lorentz transformations (80)Time dilation and length contraction (81)Mass-energy equivalence (82)Relativistic energy-momentum relation (86)V ocabulary (89)正文标记说明:蓝色Arial字体(例如energy):已知的专业词汇蓝色Arial字体加下划线(例如electromagnetism):新学的专业词汇黑色Times New Roman字体加下划线(例如postulate):新学的普通词汇1 Physics 物理学1 Physics 物理学Introduction to physicsPhysics is a part of natural philosophy and a natural science that involves the study of matter and its motion through space and time, along with related concepts such as energy and force. More broadly, it is the general analysis of nature, conducted in order to understand how the universe behaves.Physics is one of the oldest academic disciplines, perhaps the oldest through its inclusion of astronomy. Over the last two millennia, physics was a part of natural philosophy along with chemistry, certain branches of mathematics, and biology, but during the Scientific Revolution in the 17th century, the natural sciences emerged as unique research programs in their own right. Physics intersects with many interdisciplinary areas of research, such as biophysics and quantum chemistry,and the boundaries of physics are not rigidly defined. New ideas in physics often explain the fundamental mechanisms of other sciences, while opening new avenues of research in areas such as mathematics and philosophy.Physics also makes significant contributions through advances in new technologies that arise from theoretical breakthroughs. For example, advances in the understanding of electromagnetism or nuclear physics led directly to the development of new products which have dramatically transformed modern-day society, such as television, computers, domestic appliances, and nuclear weapons; advances in thermodynamics led to the development of industrialization; and advances in mechanics inspired the development of calculus.Core theoriesThough physics deals with a wide variety of systems, certain theories are used by all physicists. Each of these theories were experimentally tested numerous times and found correct as an approximation of nature (within a certain domain of validity).For instance, the theory of classical mechanics accurately describes the motion of objects, provided they are much larger than atoms and moving at much less than the speed of light. These theories continue to be areas of active research, and a remarkable aspect of classical mechanics known as chaos was discovered in the 20th century, three centuries after the original formulation of classical mechanics by Isaac Newton (1642–1727) 【艾萨克·牛顿】.University PhysicsThese central theories are important tools for research into more specialized topics, and any physicist, regardless of his or her specialization, is expected to be literate in them. These include classical mechanics, quantum mechanics, thermodynamics and statistical mechanics, electromagnetism, and special relativity.Classical and modern physicsClassical mechanicsClassical physics includes the traditional branches and topics that were recognized and well-developed before the beginning of the 20th century—classical mechanics, acoustics, optics, thermodynamics, and electromagnetism.Classical mechanics is concerned with bodies acted on by forces and bodies in motion and may be divided into statics (study of the forces on a body or bodies at rest), kinematics (study of motion without regard to its causes), and dynamics (study of motion and the forces that affect it); mechanics may also be divided into solid mechanics and fluid mechanics (known together as continuum mechanics), the latter including such branches as hydrostatics, hydrodynamics, aerodynamics, and pneumatics.Acoustics is the study of how sound is produced, controlled, transmitted and received. Important modern branches of acoustics include ultrasonics, the study of sound waves of very high frequency beyond the range of human hearing; bioacoustics the physics of animal calls and hearing, and electroacoustics, the manipulation of audible sound waves using electronics.Optics, the study of light, is concerned not only with visible light but also with infrared and ultraviolet radiation, which exhibit all of the phenomena of visible light except visibility, e.g., reflection, refraction, interference, diffraction, dispersion, and polarization of light.Heat is a form of energy, the internal energy possessed by the particles of which a substance is composed; thermodynamics deals with the relationships between heat and other forms of energy.Electricity and magnetism have been studied as a single branch of physics since the intimate connection between them was discovered in the early 19th century; an electric current gives rise to a magnetic field and a changing magnetic field induces an electric current. Electrostatics deals with electric charges at rest, electrodynamics with moving charges, and magnetostatics with magnetic poles at rest.Modern PhysicsClassical physics is generally concerned with matter and energy on the normal scale of1 Physics 物理学observation, while much of modern physics is concerned with the behavior of matter and energy under extreme conditions or on the very large or very small scale.For example, atomic and nuclear physics studies matter on the smallest scale at which chemical elements can be identified.The physics of elementary particles is on an even smaller scale, as it is concerned with the most basic units of matter; this branch of physics is also known as high-energy physics because of the extremely high energies necessary to produce many types of particles in large particle accelerators. On this scale, ordinary, commonsense notions of space, time, matter, and energy are no longer valid.The two chief theories of modern physics present a different picture of the concepts of space, time, and matter from that presented by classical physics.Quantum theory is concerned with the discrete, rather than continuous, nature of many phenomena at the atomic and subatomic level, and with the complementary aspects of particles and waves in the description of such phenomena.The theory of relativity is concerned with the description of phenomena that take place in a frame of reference that is in motion with respect to an observer; the special theory of relativity is concerned with relative uniform motion in a straight line and the general theory of relativity with accelerated motion and its connection with gravitation.Both quantum theory and the theory of relativity find applications in all areas of modern physics.Difference between classical and modern physicsWhile physics aims to discover universal laws, its theories lie in explicit domains of applicability. Loosely speaking, the laws of classical physics accurately describe systems whose important length scales are greater than the atomic scale and whose motions are much slower than the speed of light. Outside of this domain, observations do not match their predictions.Albert Einstein【阿尔伯特·爱因斯坦】contributed the framework of special relativity, which replaced notions of absolute time and space with space-time and allowed an accurate description of systems whose components have speeds approaching the speed of light.Max Planck【普朗克】, Erwin Schrödinger【薛定谔】, and others introduced quantum mechanics, a probabilistic notion of particles and interactions that allowed an accurate description of atomic and subatomic scales.Later, quantum field theory unified quantum mechanics and special relativity.General relativity allowed for a dynamical, curved space-time, with which highly massiveUniversity Physicssystems and the large-scale structure of the universe can be well-described. General relativity has not yet been unified with the other fundamental descriptions; several candidate theories of quantum gravity are being developed.Research fieldsContemporary research in physics can be broadly divided into condensed matter physics; atomic, molecular, and optical physics; particle physics; astrophysics; geophysics and biophysics. Some physics departments also support research in Physics education.Since the 20th century, the individual fields of physics have become increasingly specialized, and today most physicists work in a single field for their entire careers. "Universalists" such as Albert Einstein (1879–1955) and Lev Landau (1908–1968)【列夫·朗道】, who worked in multiple fields of physics, are now very rare.Condensed matter physicsCondensed matter physics is the field of physics that deals with the macroscopic physical properties of matter. In particular, it is concerned with the "condensed" phases that appear whenever the number of particles in a system is extremely large and the interactions between them are strong.The most familiar examples of condensed phases are solids and liquids, which arise from the bonding by way of the electromagnetic force between atoms. More exotic condensed phases include the super-fluid and the Bose–Einstein condensate found in certain atomic systems at very low temperature, the superconducting phase exhibited by conduction electrons in certain materials,and the ferromagnetic and antiferromagnetic phases of spins on atomic lattices.Condensed matter physics is by far the largest field of contemporary physics.Historically, condensed matter physics grew out of solid-state physics, which is now considered one of its main subfields. The term condensed matter physics was apparently coined by Philip Anderson when he renamed his research group—previously solid-state theory—in 1967. In 1978, the Division of Solid State Physics of the American Physical Society was renamed as the Division of Condensed Matter Physics.Condensed matter physics has a large overlap with chemistry, materials science, nanotechnology and engineering.Atomic, molecular and optical physicsAtomic, molecular, and optical physics (AMO) is the study of matter–matter and light–matter interactions on the scale of single atoms and molecules.1 Physics 物理学The three areas are grouped together because of their interrelationships, the similarity of methods used, and the commonality of the energy scales that are relevant. All three areas include both classical, semi-classical and quantum treatments; they can treat their subject from a microscopic view (in contrast to a macroscopic view).Atomic physics studies the electron shells of atoms. Current research focuses on activities in quantum control, cooling and trapping of atoms and ions, low-temperature collision dynamics and the effects of electron correlation on structure and dynamics. Atomic physics is influenced by the nucleus (see, e.g., hyperfine splitting), but intra-nuclear phenomena such as fission and fusion are considered part of high-energy physics.Molecular physics focuses on multi-atomic structures and their internal and external interactions with matter and light.Optical physics is distinct from optics in that it tends to focus not on the control of classical light fields by macroscopic objects, but on the fundamental properties of optical fields and their interactions with matter in the microscopic realm.High-energy physics (particle physics) and nuclear physicsParticle physics is the study of the elementary constituents of matter and energy, and the interactions between them.In addition, particle physicists design and develop the high energy accelerators,detectors, and computer programs necessary for this research. The field is also called "high-energy physics" because many elementary particles do not occur naturally, but are created only during high-energy collisions of other particles.Currently, the interactions of elementary particles and fields are described by the Standard Model.●The model accounts for the 12 known particles of matter (quarks and leptons) thatinteract via the strong, weak, and electromagnetic fundamental forces.●Dynamics are described in terms of matter particles exchanging gauge bosons (gluons,W and Z bosons, and photons, respectively).●The Standard Model also predicts a particle known as the Higgs boson. In July 2012CERN, the European laboratory for particle physics, announced the detection of a particle consistent with the Higgs boson.Nuclear Physics is the field of physics that studies the constituents and interactions of atomic nuclei. The most commonly known applications of nuclear physics are nuclear power generation and nuclear weapons technology, but the research has provided application in many fields, including those in nuclear medicine and magnetic resonance imaging, ion implantation in materials engineering, and radiocarbon dating in geology and archaeology.University PhysicsAstrophysics and Physical CosmologyAstrophysics and astronomy are the application of the theories and methods of physics to the study of stellar structure, stellar evolution, the origin of the solar system, and related problems of cosmology. Because astrophysics is a broad subject, astrophysicists typically apply many disciplines of physics, including mechanics, electromagnetism, statistical mechanics, thermodynamics, quantum mechanics, relativity, nuclear and particle physics, and atomic and molecular physics.The discovery by Karl Jansky in 1931 that radio signals were emitted by celestial bodies initiated the science of radio astronomy. Most recently, the frontiers of astronomy have been expanded by space exploration. Perturbations and interference from the earth's atmosphere make space-based observations necessary for infrared, ultraviolet, gamma-ray, and X-ray astronomy.Physical cosmology is the study of the formation and evolution of the universe on its largest scales. Albert Einstein's theory of relativity plays a central role in all modern cosmological theories. In the early 20th century, Hubble's discovery that the universe was expanding, as shown by the Hubble diagram, prompted rival explanations known as the steady state universe and the Big Bang.The Big Bang was confirmed by the success of Big Bang nucleo-synthesis and the discovery of the cosmic microwave background in 1964. The Big Bang model rests on two theoretical pillars: Albert Einstein's general relativity and the cosmological principle (On a sufficiently large scale, the properties of the Universe are the same for all observers). Cosmologists have recently established the ΛCDM model (the standard model of Big Bang cosmology) of the evolution of the universe, which includes cosmic inflation, dark energy and dark matter.Current research frontiersIn condensed matter physics, an important unsolved theoretical problem is that of high-temperature superconductivity. Many condensed matter experiments are aiming to fabricate workable spintronics and quantum computers.In particle physics, the first pieces of experimental evidence for physics beyond the Standard Model have begun to appear. Foremost among these are indications that neutrinos have non-zero mass. These experimental results appear to have solved the long-standing solar neutrino problem, and the physics of massive neutrinos remains an area of active theoretical and experimental research. Particle accelerators have begun probing energy scales in the TeV range, in which experimentalists are hoping to find evidence for the super-symmetric particles, after discovery of the Higgs boson.Theoretical attempts to unify quantum mechanics and general relativity into a single theory1 Physics 物理学of quantum gravity, a program ongoing for over half a century, have not yet been decisively resolved. The current leading candidates are M-theory, superstring theory and loop quantum gravity.Many astronomical and cosmological phenomena have yet to be satisfactorily explained, including the existence of ultra-high energy cosmic rays, the baryon asymmetry, the acceleration of the universe and the anomalous rotation rates of galaxies.Although much progress has been made in high-energy, quantum, and astronomical physics, many everyday phenomena involving complexity, chaos, or turbulence are still poorly understood. Complex problems that seem like they could be solved by a clever application of dynamics and mechanics remain unsolved; examples include the formation of sand-piles, nodes in trickling water, the shape of water droplets, mechanisms of surface tension catastrophes, and self-sorting in shaken heterogeneous collections.These complex phenomena have received growing attention since the 1970s for several reasons, including the availability of modern mathematical methods and computers, which enabled complex systems to be modeled in new ways. Complex physics has become part of increasingly interdisciplinary research, as exemplified by the study of turbulence in aerodynamics and the observation of pattern formation in biological systems.Vocabulary★natural science 自然科学academic disciplines 学科astronomy 天文学in their own right 凭他们本身的实力intersects相交,交叉interdisciplinary交叉学科的,跨学科的★quantum 量子的theoretical breakthroughs 理论突破★electromagnetism 电磁学dramatically显著地★thermodynamics热力学★calculus微积分validity★classical mechanics 经典力学chaos 混沌literate 学者★quantum mechanics量子力学★thermodynamics and statistical mechanics热力学与统计物理★special relativity狭义相对论is concerned with 关注,讨论,考虑acoustics 声学★optics 光学statics静力学at rest 静息kinematics运动学★dynamics动力学ultrasonics超声学manipulation 操作,处理,使用University Physicsinfrared红外ultraviolet紫外radiation辐射reflection 反射refraction 折射★interference 干涉★diffraction 衍射dispersion散射★polarization 极化,偏振internal energy 内能Electricity电性Magnetism 磁性intimate 亲密的induces 诱导,感应scale尺度★elementary particles基本粒子★high-energy physics 高能物理particle accelerators 粒子加速器valid 有效的,正当的★discrete离散的continuous 连续的complementary 互补的★frame of reference 参照系★the special theory of relativity 狭义相对论★general theory of relativity 广义相对论gravitation 重力,万有引力explicit 详细的,清楚的★quantum field theory 量子场论★condensed matter physics凝聚态物理astrophysics天体物理geophysics地球物理Universalist博学多才者★Macroscopic宏观Exotic奇异的★Superconducting 超导Ferromagnetic铁磁质Antiferromagnetic 反铁磁质★Spin自旋Lattice 晶格,点阵,网格★Society社会,学会★microscopic微观的hyperfine splitting超精细分裂fission分裂,裂变fusion熔合,聚变constituents成分,组分accelerators加速器detectors 检测器★quarks夸克lepton 轻子gauge bosons规范玻色子gluons胶子★Higgs boson希格斯玻色子CERN欧洲核子研究中心★Magnetic Resonance Imaging磁共振成像,核磁共振ion implantation 离子注入radiocarbon dating放射性碳年代测定法geology地质学archaeology考古学stellar 恒星cosmology宇宙论celestial bodies 天体Hubble diagram 哈勃图Rival竞争的★Big Bang大爆炸nucleo-synthesis核聚合,核合成pillar支柱cosmological principle宇宙学原理ΛCDM modelΛ-冷暗物质模型cosmic inflation宇宙膨胀1 Physics 物理学fabricate制造,建造spintronics自旋电子元件,自旋电子学★neutrinos 中微子superstring 超弦baryon重子turbulence湍流,扰动,骚动catastrophes突变,灾变,灾难heterogeneous collections异质性集合pattern formation模式形成University Physics2 Classical mechanics 经典力学IntroductionIn physics, classical mechanics is one of the two major sub-fields of mechanics, which is concerned with the set of physical laws describing the motion of bodies under the action of a system of forces. The study of the motion of bodies is an ancient one, making classical mechanics one of the oldest and largest subjects in science, engineering and technology.Classical mechanics describes the motion of macroscopic objects, from projectiles to parts of machinery, as well as astronomical objects, such as spacecraft, planets, stars, and galaxies. Besides this, many specializations within the subject deal with gases, liquids, solids, and other specific sub-topics.Classical mechanics provides extremely accurate results as long as the domain of study is restricted to large objects and the speeds involved do not approach the speed of light. When the objects being dealt with become sufficiently small, it becomes necessary to introduce the other major sub-field of mechanics, quantum mechanics, which reconciles the macroscopic laws of physics with the atomic nature of matter and handles the wave–particle duality of atoms and molecules. In the case of high velocity objects approaching the speed of light, classical mechanics is enhanced by special relativity. General relativity unifies special relativity with Newton's law of universal gravitation, allowing physicists to handle gravitation at a deeper level.The initial stage in the development of classical mechanics is often referred to as Newtonian mechanics, and is associated with the physical concepts employed by and the mathematical methods invented by Newton himself, in parallel with Leibniz【莱布尼兹】, and others.Later, more abstract and general methods were developed, leading to reformulations of classical mechanics known as Lagrangian mechanics and Hamiltonian mechanics. These advances were largely made in the 18th and 19th centuries, and they extend substantially beyond Newton's work, particularly through their use of analytical mechanics. Ultimately, the mathematics developed for these were central to the creation of quantum mechanics.Description of classical mechanicsThe following introduces the basic concepts of classical mechanics. For simplicity, it often2 Classical mechanics 经典力学models real-world objects as point particles, objects with negligible size. The motion of a point particle is characterized by a small number of parameters: its position, mass, and the forces applied to it.In reality, the kind of objects that classical mechanics can describe always have a non-zero size. (The physics of very small particles, such as the electron, is more accurately described by quantum mechanics). Objects with non-zero size have more complicated behavior than hypothetical point particles, because of the additional degrees of freedom—for example, a baseball can spin while it is moving. However, the results for point particles can be used to study such objects by treating them as composite objects, made up of a large number of interacting point particles. The center of mass of a composite object behaves like a point particle.Classical mechanics uses common-sense notions of how matter and forces exist and interact. It assumes that matter and energy have definite, knowable attributes such as where an object is in space and its speed. It also assumes that objects may be directly influenced only by their immediate surroundings, known as the principle of locality.In quantum mechanics objects may have unknowable position or velocity, or instantaneously interact with other objects at a distance.Position and its derivativesThe position of a point particle is defined with respect to an arbitrary fixed reference point, O, in space, usually accompanied by a coordinate system, with the reference point located at the origin of the coordinate system. It is defined as the vector r from O to the particle.In general, the point particle need not be stationary relative to O, so r is a function of t, the time elapsed since an arbitrary initial time.In pre-Einstein relativity (known as Galilean relativity), time is considered an absolute, i.e., the time interval between any given pair of events is the same for all observers. In addition to relying on absolute time, classical mechanics assumes Euclidean geometry for the structure of space.Velocity and speedThe velocity, or the rate of change of position with time, is defined as the derivative of the position with respect to time. In classical mechanics, velocities are directly additive and subtractive as vector quantities; they must be dealt with using vector analysis.When both objects are moving in the same direction, the difference can be given in terms of speed only by ignoring direction.University PhysicsAccelerationThe acceleration , or rate of change of velocity, is the derivative of the velocity with respect to time (the second derivative of the position with respect to time).Acceleration can arise from a change with time of the magnitude of the velocity or of the direction of the velocity or both . If only the magnitude v of the velocity decreases, this is sometimes referred to as deceleration , but generally any change in the velocity with time, including deceleration, is simply referred to as acceleration.Inertial frames of referenceWhile the position and velocity and acceleration of a particle can be referred to any observer in any state of motion, classical mechanics assumes the existence of a special family of reference frames in terms of which the mechanical laws of nature take a comparatively simple form. These special reference frames are called inertial frames .An inertial frame is such that when an object without any force interactions (an idealized situation) is viewed from it, it appears either to be at rest or in a state of uniform motion in a straight line. This is the fundamental definition of an inertial frame. They are characterized by the requirement that all forces entering the observer's physical laws originate in identifiable sources (charges, gravitational bodies, and so forth).A non-inertial reference frame is one accelerating with respect to an inertial one, and in such a non-inertial frame a particle is subject to acceleration by fictitious forces that enter the equations of motion solely as a result of its accelerated motion, and do not originate in identifiable sources. These fictitious forces are in addition to the real forces recognized in an inertial frame.A key concept of inertial frames is the method for identifying them. For practical purposes, reference frames that are un-accelerated with respect to the distant stars are regarded as good approximations to inertial frames.Forces; Newton's second lawNewton was the first to mathematically express the relationship between force and momentum . Some physicists interpret Newton's second law of motion as a definition of force and mass, while others consider it a fundamental postulate, a law of nature. Either interpretation has the same mathematical consequences, historically known as "Newton's Second Law":a m t v m t p F ===d )(d d dThe quantity m v is called the (canonical ) momentum . The net force on a particle is thus equal to rate of change of momentum of the particle with time.So long as the force acting on a particle is known, Newton's second law is sufficient to。
神经科学核心辞汇翻译

精要速览系列(影印版)Instant Notes Neuroscience神经科学……………核心词汇翻译参考手册……………………按章节顺序:Section A Brain cellsA1 Neuron structureNeuron 神经细胞,神经元Subcellular organelles 亚细胞器Nissl body 尼氏体神经元中的粗面内质网形成的聚合物。
Neurite 神经突Axon 轴突Dendrite 树突Mitochondria 线粒体dendritic spines 树突脊树突在神经元上分化成几百个微小投射。
axon hillock 轴丘myelin sheath 髓鞘axon collalterals 轴突分枝terminals 突触末稍varicosities 曲张体microtubules 微管cytoskeleton 细胞骨架A2 Classes and numbers of neuronsMorphology 形态学Neurotranmitters 神经递质Unipolar 单极神经元仅有一个树突的神经元。
Bipolar 双极神经元Multipolar 多极神经元Pseudounipolar 假单极神经元生长出两个神经突,但随后融合Pyramidal cell 锥体细胞Purkinje cell 浦肯野氏细胞Projection neuron 投射神经元拥有长轴突的神经元Interneurons 中间神经元拥有短的轴突的神经元Afferent 传入Efferent 传出Sensory neuron 感觉神经元Motor neuron 运动神经元A3 Morphology of chemical synapseselectrical synapse 电突触chemical synapse 化学突触synaptic cleft 突触间隙axodendritic synapse 轴树突触轴突与树突之间的突触axosomatic synapse 轴体突触axoaxonal synapse 轴轴突触small clear synaptic vesicles(SSVs) 小清楚突触囊泡在突触前神经元存在的贮存递质的囊泡dense projections 致密突起active zone 活性区域postsynaptic density 突触致密物质large dense-core vesicles 庞大致密度中心囊泡A4 glial cells and myelinationGlial cells 胶质细胞是神经细胞的辅助细胞Astrocytes 星状细胞Oligodendrocytes 寡突细胞Schwann cells 许旺氏细胞围绕在神经细胞外的一种胶质细胞,形成髓鞘。
纳米CoSb3单晶拉伸力学性能的分子动力学模拟

纳米CoSb 3单晶拉伸力学性能的分子动力学模拟柯龙燕1,刘立胜11武汉理工大学工程力学系,武汉 (430070)E-mail :klywhut@摘 要:本文采用分子动力学方法模拟了在绝对零度下方钴矿热电材料CoSb 3在拉伸荷载作用下的力学性能。
计算结果发现:CoSb 3单晶发生了颈缩现象,表现出了较好的塑性和良好的延性,晶体的断裂出发生在晶界处,而且在拉伸过程中,Co 原子发生了团聚。
关键词:分子动力学,CoSb 3单晶,拉伸性能中图分类号:O341.引言目前,随着全球能源危机的日益严重,以及近年来人们环保意识的增强,太阳能发电技术越来越受到世界各国政府和人民的重视。
在太阳能热电发电系统中,由于太阳光的光照强度因日夜交替而周期变化,同时由于气候变化原因导致每天同一时间段的太阳光强实时变化,导致热电材料或器件受循环载荷的作用,在这种循环荷载作用下,热电材料的力学性能将发生明显的变化,并有损伤产生和发展,最终引起材料失效。
方钴矿CoSb 3是一种常用的中高温热电材料。
因此为了改进热电材料的性能,我们必须深入探索CoSb 3的力学行为,而分子动力学则成为一个有效的方法。
分子动力学(molecular dynamics )根据粒子间相互作用势,计算多体系统的结构和动力学方程,并可以计算物质的结构和性质。
分子动力学的基本原理是建立一个粒子系统来模拟研究的系统,系统中各粒子在相空间的运动规律和轨迹,然后按统计物理原理得出该系统相应的宏观物理特性。
国内外在晶体力学行为的分子动力学模拟方面开展了许多工作。
Zhou [1]等采用并行分子动力学模拟了零温下晶体铜中位错相互交截的过程。
Wen [2]等模拟了纳米多晶铜晶粒尺寸对晶粒、晶界微观结构的影响。
利用分子动力学方法,我们可以有效地模拟晶体的力学性能。
本文采用分子动力学方法以及大型分子动力学并行模拟器LAMMPS ,模拟热电材料CoSb 3单晶承受拉伸荷载作用的过程,并分析了晶体的力学性能。
三线圈无线电能传输系统传输特性的研究

三线圈无线电能传输系统传输特性的研究作者:张淑美李媛程泽来源:《湖南大学学报·自然科学版》2021年第08期摘要:针对三线圈无线电能传输系统中继线圈的位置对系统的输出功率和传输效率等传输特性的影响问题展开研究,设计一种采用DC-DC转换电路的传输策略,使得整个系统能在中继线圈的摆放位置不发生改变的情况下,通过调整负载的等效阻抗,将传输效率维持在一个较高的水平. 实验结果表明,该传输策略不仅适用于中继线圈固定、负载阻值改变的情况,在负载保持不变而中继线圈位置产生变化时依旧能保持较高的传输效率.关键词:无线电能传输;线圈分析;磁耦合諧振;DC-DC转换中图分类号:TM55 文献标志码:AResearch on Transmission Characteristics ofThree-coil Wireless Power Transmission SystemZHANG Shumei,LI Yuan,CHENG Ze(School of Electrical and Information Engineering,Tianjin University,Tianjin 300072,China)Abstract:This work analyzed the influence of the position of relay coil on the output power and transmission efficiency in the three-coil wireless power transmission system. A transmission strategy using a DC-DC conversion circuit was designed to maintain the transmission efficiency at a high level by adjusting equivalent impedance of load without changing the placement of the relay coil. The experiments show that the proposed transmission strategy is not only suitable for the situation where the relay coil is fixed and load resistance is changed,but also can maintain high transmission efficiency when the load remains the same but the position of the relay coil changes.Key words:wireless power transfer;coil analysis;magnetic coupling resonance;DC-DC converter无线电能传输技术[1-2],经过长期发展,衍生出了多种多样的电能传输形式[3-7]. 在传统无线电能传输系统的基础上,有学者提出增加一个谐振线圈的新型三线圈结构可以延长无线电能的传输距离[8],但未对增加线圈后系统的效率影响进行讨论. 在此基础上,Kim等[9]对三线圈系统进行了效率分析,发现适当使用中继线圈可以提高系统效率. 为了进一步提高效率,有学者提出将磁芯放置在中继线圈与接收线圈之间的解决方案,通过仿真分析发现在三线圈结构中加入平板磁芯对增加传输距离与提高传输效率有明显效果[10]. 文献[11]发现,通过对三线圈结构参数的设计,可以使系统在更大的负荷范围内获得更高的效率,然而该研究忽略了线圈间的耦合效应和工作频率变化的情况. 还有研究聚焦于对三线圈结构系统的耦合情况,总结出临界耦合条件及最大功率传输条件,提出了一种改变谐振频率的三线圈系统设计方法[12]. 然而上述文献仅集中在通过引入中继线圈来改善无线电能传输系统的性能,对于中继线圈的具体摆放位置及其对系统的传输功率、传输效率的影响却鲜有分析[13-17]. 截至目前,大多数的三线圈结构默认将中继线圈放在发射线圈和接收线圈的正对位置,使整个系统的耦合达到一个较优值[18-22]. 但是,对于:1)是否正中间就是中继线圈的最佳位置;2)中继线圈对于系统的传输特性影响是否一致;3)系统的功率与效率是否只与中继线圈的位置有关等问题,并未得到系统的分析和理论验证.本文基于三线圈结构的无线电能传输系统展开研究,首先对系统进行了数学建模,得到中继线圈位置的改变对于系统传输特性的影响,并从数值仿真、磁场仿真、实验证明三个方面进行分析讨论,总结出中继线圈处于不同位置时系统传输特性的变化情况,并在考虑实际的基础上设计了一种改进的三线圈谐振系统,使其能在负载发生变化时,保持较高的传输功率和传输效率.1 三线圈结构的无线电能传输系统如图1所示,三线圈结构的无线电能传输系统的组成部分包括:发射线圈、中继线圈、接收线圈、逆变模块以及整流模块等. 该系统可将直流电逆变后变为高频交流电,然后通过发射线圈将电能以谐振耦合的方式传送到中继线圈,再通过中继线圈转送到接收线圈,进而为负载提供电能. 其中,发射线圈与中继线圈之间的距离记作d1,中继线圈与接收线圈之间的距离记作d2,而发射线圈与接收线圈之间的距离则记为d3.设三个回路中的总阻抗分别记为Z1,Z2,Z3,电源的工作角频率为ω,则它们的值可以用以下等式表示:假设三个线圈的结构都相同,即认为三个线圈各自的电感值相等,线圈自身携带的电阻相等,完全谐振匹配时所需的补偿电容值相等,L1 = L2 = L3 = L,R1 = R2 = R3 = R,C1 = C2 = C3 = C. 当ω = 1/时,三个回路均处于完全谐振状态,负载阻抗虚部为0,则式(1)可化简为:Z1 = Rs + RZ2 = RZ3 = RL + R (2)根据基尔霍夫电压定律,可从图2得到以下电路方程.Rs + R jωM1,2 jωM1,3jωM1,2 R jωM2,3jωM1,3 jωM2,3 RL + Ri1i2i3 = Us 0 0 (3)各个回路中的电流分别为:当发射线圈与接收线圈距离较远时,二者耦合较弱,互感M1,3可以忽略,因此负载的输出功率PL与系统传输效率η可以近似地表示为:2 三线圈系统的数值仿真本章利用 Matlab 对三线圈结构系统进行了数值仿真. 通过数值仿真结果进一步了解三线圈系统的优越性,详细分析了中继线圈的不同位置变化所导致的系统输出功率和传输效率的变化情况.由式(5)(6)可以看出,该系统的传输效率是与负载阻值RL和互感M1,2、M2,3有关的函数. 然而,当发射线圈与接收线圈的距离d3固定时,中继线圈具体的位置变化会同时导致M1,2、M2,3发生变化. 两个线圈之间的互感与二者间的距离有关,三个线圈之间的距离满足d1 + d2 = d3,因此M1,2、M2,3都可以表示成发射线圈与中继线圈距离d1的函数. 同轴放置的两个平面螺旋线圈之间的互感可以近似表示为:式中:μ0表示真空磁导率;N1、N2分别表示两个线圈的匝数;r1、r2则表示两个线圈的半径;d1指代线圈之间的距离.由于线圈结构完全相等,因此,可令线圈匝数为N,半径为r,则M1,2、M2,3可以表示为:2.1 中继线圈位置对系统输出功率的影响将式(8)代入式(5),进行数值仿真,得到输出功率PL关于发射线圈与中继线圈间距d1的曲线,如图3所示. 其中,线圈的仿真参数见表1.从图3可以看出,中继线圈与发射线圈的间距d1对于输出功率的最佳位置有且仅有一个最优值,且该最优值的变化随着负载阻值的变化而发生变化. 当RL = RS时,最大输出功率所对应的位置接近发射线圈与接收线圈的正中间;当RL > RS时,最大输出功率所对应的中继线圈的最佳位置靠近接收线圈一侧;当RL < RS时,最佳位置靠近发射线圈一侧. 输出功率PL对负载阻值RL进行求导,令ΔPL /ΔRL = 0,得到输出功率最大时的最佳阻抗RL,opt1的表达式为:从式(9)可以看出,最佳阻抗RL,opt1的变化趋势是随互感M1,2的增大而减小,随互感M2,3的增大而增大. 当中继线圈位于正中间时,中继线圈与左右两线圈的互感相等,即M1,2 = M2,3,若此时的线圈自身的阻抗R远小于电源内阻,则此时的最佳阻抗RL,opt1 ≈ RS,接近于电源内阻,与图3的仿真结果一致.2.2 中继线圈位置对系统传输效率的影响在参数不变的情况下,对于系统的传输效率η进行数值仿真,得到传输效率对于中继线圈位置变化的曲线,如图4所示.由图4可知,关于系统效率的中继线圈的最佳位置同样仅有一个最优值. 与输出效率不同的是,当负载的阻值发生变化时,系统效率的最佳位置一直处于靠近发射线圈的一侧,只是在该侧略微移动. 负载的最佳阻值与电源内阻并无联系,当阻值慢慢增大时,最佳位置逐渐远离发射线圈. 而当中继线圈的位置越过中间位置靠近接收线圈时,系统的效率开始急剧下降,逐渐趋于0.同理,通过系统效率η对负载电阻RL进行求导,并令Δη/ΔRL = 0,则系统效率的最佳阻抗RL,opt2的表达式为:从式(10)可以看出,与RL,opt1类似,系统效率的最佳阻抗RL,opt2也是随M1,2的增大而减小,随M2,3的增大而增大. 但是值得注意的是,RL,opt2的值始终大于ω与M2,3的乘积,其中ω = 2πf,f为电源频率,决定了线圈处的磁场强度,通常取10 k ~ 100 MHz. 因此当M2,3增加时,RL,opt2会急剧增加. 运用相同的参数进行仿真,得出系统效率和输出功率的最佳负载关于线圈位置的特性曲线如图5所示.从图5可以看出,系统效率的最佳阻抗值RL,opt2總是大于输出功率的最佳阻抗RL,opt1. 此外,当中继线圈越过中间位置时,RL,opt2的值已经达到500以上并仍在急剧上升,这是一般负载所不能达到的,而在靠近发射线圈一侧二者的差距并不明显. 因此,由最佳阻抗关于线圈位置的数值仿真结果可知,中继线圈靠近接收线圈时的三线圈系统更适合大负载的情况. 当系统负载远超过电源内阻时,中继线圈的位置应该靠近接收线圈以保证系统有较高的传输效率. 但在实际应用中,如果只能随着负载的变化而改变中继线圈的位置,以其来保证系统的传输效率和输出功率的话,将与无线传能技术方便快捷的应用目的背道而驰.3 三线圈系统的电磁仿真为了进一步分析中继线圈对电磁场的影响情况,本文选取几个典型的中继线圈位置来对三线圈结构的无线电能传输系统的电磁场情况进行仿真. 其中,发射线圈和接收线圈的间距固定设置为20 cm,而中继线圈则分别放在与发射线圈相距5 cm、10 cm和15 cm的位置,用于模拟中继线圈靠近发射线圈时、处在发射线圈和接收线圈正中间时以及靠近接收线圈时三个典型情况的位置.假设三个线圈的结构都相同,即认为三个线圈各自的电感值相等,线圈自身携带的电阻相等,完全谐振匹配时所需的补偿电容值相等,L1 = L2 = L3 = L,R1 = R2 = R3 = R,C1 = C2 = C3 = C. 当ω = 1/时,三个回路均处于完全谐振状态,负载阻抗虚部为0,则式(1)可化简为:Z1 = Rs + RZ2 = RZ3 = RL + R (2)根据基尔霍夫电压定律,可从图2得到以下电路方程.Rs + R jωM1,2 jωM1,3jωM1,2 R jωM2,3jωM1,3 jωM2,3 RL + Ri1i2i3 = Us 0 0 (3)各个回路中的电流分别为:当发射线圈与接收线圈距离较远时,二者耦合较弱,互感M1,3可以忽略,因此负载的输出功率PL与系统传输效率η可以近似地表示为:2 三线圈系统的数值仿真本章利用 Matlab 对三线圈结构系统进行了数值仿真. 通过数值仿真结果进一步了解三线圈系统的优越性,详细分析了中继线圈的不同位置变化所导致的系统输出功率和传输效率的变化情况.由式(5)(6)可以看出,该系统的传输效率是与负载阻值RL和互感M1,2、M2,3有关的函数. 然而,当发射线圈与接收线圈的距离d3固定时,中继线圈具体的位置变化会同时导致M1,2、M2,3发生变化. 两个线圈之间的互感与二者间的距离有关,三个线圈之间的距离满足d1 + d2 = d3,因此M1,2、M2,3都可以表示成发射线圈与中继线圈距离d1的函数. 同轴放置的两个平面螺旋线圈之间的互感可以近似表示为:式中:μ0表示真空磁导率;N1、N2分别表示两个线圈的匝数;r1、r2则表示两个线圈的半径;d1指代线圈之间的距离.由于线圈结构完全相等,因此,可令线圈匝数为N,半径为r,则M1,2、M2,3可以表示为:2.1 中继线圈位置对系统输出功率的影响将式(8)代入式(5),进行数值仿真,得到输出功率PL关于发射线圈与中继线圈间距d1的曲线,如图3所示. 其中,線圈的仿真参数见表1.从图3可以看出,中继线圈与发射线圈的间距d1对于输出功率的最佳位置有且仅有一个最优值,且该最优值的变化随着负载阻值的变化而发生变化. 当RL = RS时,最大输出功率所对应的位置接近发射线圈与接收线圈的正中间;当RL > RS时,最大输出功率所对应的中继线圈的最佳位置靠近接收线圈一侧;当RL < RS时,最佳位置靠近发射线圈一侧. 输出功率PL对负载阻值RL进行求导,令ΔPL /ΔRL = 0,得到输出功率最大时的最佳阻抗RL,opt1的表达式为:从式(9)可以看出,最佳阻抗RL,opt1的变化趋势是随互感M1,2的增大而减小,随互感M2,3的增大而增大. 当中继线圈位于正中间时,中继线圈与左右两线圈的互感相等,即M1,2 = M2,3,若此时的线圈自身的阻抗R远小于电源内阻,则此时的最佳阻抗RL,opt1 ≈ RS,接近于电源内阻,与图3的仿真结果一致.2.2 中继线圈位置对系统传输效率的影响在参数不变的情况下,对于系统的传输效率η进行数值仿真,得到传输效率对于中继线圈位置变化的曲线,如图4所示.由图4可知,关于系统效率的中继线圈的最佳位置同样仅有一个最优值. 与输出效率不同的是,当负载的阻值发生变化时,系统效率的最佳位置一直处于靠近发射线圈的一侧,只是在该侧略微移动. 负载的最佳阻值与电源内阻并无联系,当阻值慢慢增大时,最佳位置逐渐远离发射线圈. 而当中继线圈的位置越过中间位置靠近接收线圈时,系统的效率开始急剧下降,逐渐趋于0.同理,通过系统效率η对负载电阻RL进行求导,并令Δη/ΔRL = 0,则系统效率的最佳阻抗RL,opt2的表达式为:从式(10)可以看出,与RL,opt1类似,系统效率的最佳阻抗RL,opt2也是随M1,2的增大而减小,随M2,3的增大而增大. 但是值得注意的是,RL,opt2的值始终大于ω与M2,3的乘积,其中ω = 2πf,f为电源频率,决定了线圈处的磁场强度,通常取10 k ~ 100 MHz. 因此当M2,3增加时,RL,opt2会急剧增加. 运用相同的参数进行仿真,得出系统效率和输出功率的最佳负载关于线圈位置的特性曲线如图5所示.从图5可以看出,系统效率的最佳阻抗值RL,opt2总是大于输出功率的最佳阻抗RL,opt1. 此外,当中继线圈越过中间位置时,RL,opt2的值已经达到500以上并仍在急剧上升,这是一般负载所不能达到的,而在靠近发射线圈一侧二者的差距并不明显. 因此,由最佳阻抗关于线圈位置的数值仿真结果可知,中继线圈靠近接收线圈时的三线圈系统更适合大负载的情况. 当系统负载远超过电源内阻时,中继线圈的位置应该靠近接收线圈以保证系统有较高的传输效率. 但在实际应用中,如果只能随着负载的变化而改变中继线圈的位置,以其来保证系统的传输效率和输出功率的话,将与无线传能技术方便快捷的应用目的背道而驰.3 三线圈系统的电磁仿真为了进一步分析中继线圈对电磁场的影响情况,本文选取几个典型的中继线圈位置来对三线圈结构的无线电能传输系统的电磁场情况进行仿真. 其中,发射线圈和接收线圈的间距固定设置为20 cm,而中继线圈则分别放在与发射线圈相距5 cm、10 cm和15 cm的位置,用于模拟中继线圈靠近发射线圈时、处在发射线圈和接收线圈正中间时以及靠近接收线圈时三个典型情况的位置.假设三个线圈的结构都相同,即认为三个线圈各自的电感值相等,线圈自身携带的电阻相等,完全谐振匹配时所需的补偿电容值相等,L1 = L2 = L3 = L,R1 = R2 = R3 = R,C1 = C2 = C3 = C. 当ω = 1/时,三个回路均处于完全谐振状态,负载阻抗虚部为0,则式(1)可化简为:Z1 = Rs + RZ2 = RZ3 = RL + R (2)根据基尔霍夫电压定律,可从图2得到以下电路方程.Rs + R jωM1,2 jωM1,3jωM1,2 R jωM2,3jωM1,3 jωM2,3 RL + Ri1i2i3 = Us 0 0 (3)各个回路中的电流分别为:当发射线圈与接收线圈距离较远时,二者耦合较弱,互感M1,3可以忽略,因此负载的输出功率PL与系统传输效率η可以近似地表示为:2 三线圈系统的数值仿真本章利用 Matlab 对三线圈结构系统进行了数值仿真. 通过数值仿真结果进一步了解三线圈系统的优越性,详细分析了中继线圈的不同位置变化所导致的系统输出功率和传输效率的变化情况.由式(5)(6)可以看出,该系统的传输效率是与负载阻值RL和互感M1,2、M2,3有关的函数. 然而,当发射线圈与接收线圈的距离d3固定时,中继线圈具体的位置变化会同时导致M1,2、M2,3发生变化. 两个线圈之间的互感与二者间的距离有关,三个线圈之间的距离满足d1 + d2 = d3,因此M1,2、M2,3都可以表示成发射线圈与中继线圈距离d1的函数. 同轴放置的两个平面螺旋线圈之间的互感可以近似表示为:式中:μ0表示真空磁导率;N1、N2分别表示两个线圈的匝数;r1、r2则表示两个线圈的半径;d1指代线圈之间的距离.由于线圈结构完全相等,因此,可令线圈匝数为N,半径为r,则M1,2、M2,3可以表示为:2.1 中继线圈位置对系统输出功率的影响将式(8)代入式(5),进行数值仿真,得到输出功率PL关于发射线圈与中继线圈间距d1的曲线,如图3所示. 其中,线圈的仿真参数见表1.从图3可以看出,中继线圈与发射线圈的间距d1对于输出功率的最佳位置有且仅有一个最优值,且该最优值的变化随着负载阻值的变化而发生变化. 当RL = RS时,最大输出功率所对应的位置接近发射线圈与接收线圈的正中间;当RL > RS时,最大输出功率所对应的中继线圈的最佳位置靠近接收线圈一侧;当RL < RS时,最佳位置靠近发射线圈一侧. 输出功率PL对负载阻值RL进行求导,令ΔPL /ΔRL = 0,得到輸出功率最大时的最佳阻抗RL,opt1的表达式为:从式(9)可以看出,最佳阻抗RL,opt1的变化趋势是随互感M1,2的增大而减小,随互感M2,3的增大而增大. 当中继线圈位于正中间时,中继线圈与左右两线圈的互感相等,即M1,2 = M2,3,若此时的线圈自身的阻抗R远小于电源内阻,则此时的最佳阻抗RL,opt1 ≈ RS,接近于电源内阻,与图3的仿真结果一致.2.2 中继线圈位置对系统传输效率的影响在参数不变的情况下,对于系统的传输效率η进行数值仿真,得到传输效率对于中继线圈位置变化的曲线,如图4所示.由图4可知,关于系统效率的中继线圈的最佳位置同样仅有一个最优值. 与输出效率不同的是,当负载的阻值发生变化时,系统效率的最佳位置一直处于靠近发射线圈的一侧,只是在该侧略微移动. 负载的最佳阻值与电源内阻并无联系,当阻值慢慢增大时,最佳位置逐渐远离发射线圈. 而当中继线圈的位置越过中间位置靠近接收线圈时,系统的效率开始急剧下降,逐渐趋于0.同理,通过系统效率η对负载电阻RL进行求导,并令Δη/ΔRL = 0,则系统效率的最佳阻抗RL,opt2的表达式为:从式(10)可以看出,与RL,opt1类似,系统效率的最佳阻抗RL,opt2也是随M1,2的增大而减小,随M2,3的增大而增大. 但是值得注意的是,RL,opt2的值始终大于ω与M2,3的乘积,其中ω = 2πf,f为电源频率,决定了线圈处的磁场强度,通常取10 k ~ 100 MHz. 因此当M2,3增加时,RL,opt2会急剧增加. 运用相同的参数进行仿真,得出系统效率和输出功率的最佳负载关于线圈位置的特性曲线如图5所示.从图5可以看出,系统效率的最佳阻抗值RL,opt2总是大于输出功率的最佳阻抗RL,opt1. 此外,当中继线圈越过中间位置时,RL,opt2的值已经达到500以上并仍在急剧上升,这是一般负载所不能达到的,而在靠近发射线圈一侧二者的差距并不明显. 因此,由最佳阻抗关于线圈位置的数值仿真结果可知,中继线圈靠近接收线圈时的三线圈系统更适合大负载的情况. 当系统负载远超过电源内阻时,中继线圈的位置应该靠近接收线圈以保证系统有较高的传输效率. 但在实际应用中,如果只能随着负载的变化而改变中继线圈的位置,以其来保证系统的传输效率和输出功率的话,将与无线传能技术方便快捷的应用目的背道而驰.3 三线圈系统的电磁仿真为了进一步分析中继线圈对电磁场的影响情况,本文选取几个典型的中继线圈位置来对三线圈结构的无线电能传输系统的电磁场情况进行仿真. 其中,发射线圈和接收线圈的间距固定设置为20 cm,而中继线圈则分别放在与发射线圈相距5 cm、10 cm和15 cm的位置,用于模拟中继线圈靠近发射线圈时、处在发射线圈和接收线圈正中间时以及靠近接收线圈时三个典型情况的位置.假设三个线圈的结构都相同,即认为三个线圈各自的电感值相等,线圈自身携带的电阻相等,完全谐振匹配时所需的补偿电容值相等,L1 = L2 = L3 = L,R1 = R2 = R3 = R,C1 = C2 = C3 = C. 当ω = 1/时,三个回路均处于完全谐振状态,负载阻抗虚部为0,则式(1)可化简为:Z1 = Rs + RZ2 = RZ3 = RL + R (2)根据基尔霍夫电压定律,可从图2得到以下电路方程.Rs + R jωM1,2 jωM1,3jωM1,2 R jωM2,3jωM1,3 jωM2,3 RL + Ri1i2i3 = Us 0 0 (3)各個回路中的电流分别为:当发射线圈与接收线圈距离较远时,二者耦合较弱,互感M1,3可以忽略,因此负载的输出功率PL与系统传输效率η可以近似地表示为:2 三线圈系统的数值仿真本章利用 Matlab 对三线圈结构系统进行了数值仿真. 通过数值仿真结果进一步了解三线圈系统的优越性,详细分析了中继线圈的不同位置变化所导致的系统输出功率和传输效率的变化情况.由式(5)(6)可以看出,该系统的传输效率是与负载阻值RL和互感M1,2、M2,3有关的函数. 然而,当发射线圈与接收线圈的距离d3固定时,中继线圈具体的位置变化会同时导致M1,2、M2,3发生变化. 两个线圈之间的互感与二者间的距离有关,三个线圈之间的距离满足d1 + d2 = d3,因此M1,2、M2,3都可以表示成发射线圈与中继线圈距离d1的函数. 同轴放置的两个平面螺旋线圈之间的互感可以近似表示为:式中:μ0表示真空磁导率;N1、N2分别表示两个线圈的匝数;r1、r2则表示两个线圈的半径;d1指代线圈之间的距离.由于线圈结构完全相等,因此,可令线圈匝数为N,半径为r,则M1,2、M2,3可以表示为:2.1 中继线圈位置对系统输出功率的影响将式(8)代入式(5),进行数值仿真,得到输出功率PL关于发射线圈与中继线圈间距d1的曲线,如图3所示. 其中,线圈的仿真参数见表1.从图3可以看出,中继线圈与发射线圈的间距d1对于输出功率的最佳位置有且仅有一个最优值,且该最优值的变化随着负载阻值的变化而发生变化. 当RL = RS时,最大输出功率所对应的位置接近发射线圈与接收线圈的正中间;当RL > RS时,最大输出功率所对应的中继线圈的最佳位置靠近接收线圈一侧;当RL < RS时,最佳位置靠近发射线圈一侧. 输出功率PL对负载阻值RL进行求导,令ΔPL /ΔRL = 0,得到输出功率最大时的最佳阻抗RL,opt1的表达式为:从式(9)可以看出,最佳阻抗RL,opt1的变化趋势是随互感M1,2的增大而减小,随互感M2,3的增大而增大. 当中继线圈位于正中间时,中继线圈与左右两线圈的互感相等,即M1,2 = M2,3,若此时的线圈自身的阻抗R远小于电源内阻,则此时的最佳阻抗RL,opt1 ≈ RS,接近于电源内阻,与图3的仿真结果一致.2.2 中继线圈位置对系统传输效率的影响在参数不变的情况下,对于系统的传输效率η进行数值仿真,得到传输效率对于中继线圈位置变化的曲线,如图4所示.由图4可知,关于系统效率的中继线圈的最佳位置同样仅有一个最优值. 与输出效率不同的是,当负载的阻值发生变化时,系统效率的最佳位置一直处于靠近发射线圈的一侧,只是在该侧略微移动. 负载的最佳阻值与电源内阻并无联系,当阻值慢慢增大时,最佳位置逐渐远离。
Memristive devices for computing
The search for new computing technologies is driven by the con-tinuing demand for improved computing performance, but to be of use a new technology must be scalable and capable. Memristor or memristive nanodevices seem to fulfil these require-ments — they can be scaled down to less than 10 nm and offer fast, non-volatile, low-energy electrical switching. Memristors are two-terminal ‘memory resistors’ that retain internal resistance state according to the history of applied voltage and current. They are sim-ple passive circuit elements, but their function cannot be replicated by any combination of fundamental resistors, capacitors and induc-tors 1,2. Moreover, their microscopically modified internal state is easily measured as an external two-terminal resistance. Memristors were originally defined as components that linked charge and mag-netic flux 1, but they can be more usefully described as devices with a pinched-hysteresis loop whose size is frequency dependent 3. The natural computing application for such devices is resistive random access memory (ReRAM), but their dynamical nonlinear switching also suggests that they could be used to develop alternative computer logic architectures.Memristive switching behaviour can be traced back two centu-ries 4, but its theoretical inception came only 40 years ago 1,2 and the link between theory and experiment was only established in 20085. In the 1960s, advances in thin-film technology allowed very high electric fields in ultrathin metal/oxide/metal films to be obtained and mem-ristive behaviour was pronounced enough to be observed 6,7. However, after a decade of intensive study 7, research efforts into these devices faded, which is perhaps not surprising given the rise of silicon inte-grated circuit technology. Interest remained low until the late 1990s, when a gradual reduction in the progress of silicon technologies led to renewed interest in alternative switching devices.The successful commercialization of any application demands a robust and predictive understanding of its underlying mechanisms. For memristors, understanding their electrical switching has been limited by the chemical, stochastic and localized nature of the effects. However, in the past decade advances in the growth and characteri-zation of nanoscale materials has led to significant progress in the understanding and optimization of microscopic memristive switch-ing. These developments have recently been covered by a variety ofMemristive devices for computingJ. Joshua Yang 1, Dmitri B. Strukov 2 and Duncan R. Stewart 3Memristive devices a re electrica l resista nce switches tha t ca n reta in a sta te of interna l resista nce ba sed on the history of applied voltage and current. These devices can store and process information, and offer several key performance characteristics that exceed conventional integrated circuit technology. An important class of memristive devices are two-terminal resistance switches based on ionic motion, which are built from a simple conductor/insulator/conductor thin-film stack. These devices were originally conceived in the late 1960s and recent progress has led to fast, low-energy, high-endurance devices that can be scaled down to less than 10 n m and stacked in three dimensions. However, the underlying device mechanisms remain unclear, which is a significant barrier to their widespread application. Here, we review recent progress in the development and understanding of memristive devices. We also examine the performance requirements for computing with memristive devices and detail how the outstanding challenges could be met.excellent review articles 8–19. Here, we focus on the chemical and phys-ical mechanisms of memristive devices, and try to identify the key issues that impede the commercialization of memristors as computer memory and logic.Memristive materials and nanoscale devicesMemristive devices can be classified based on switching mechanism, switching phenomena or switching materials. Here we loosely group all ionic switching devices into two categories — anion devices and cation devices — to simplify our discussion of their mechanisms.Anion devices. The switching materials of anion-based devices include oxide insulators, such as transition metal oxides, complex oxides, large bandgap dielectrics, and some non-oxide insulators, such as nitrides and chalcogenides. In most metal oxides, for exam-ple, the oxygen anion (or equivalently the positive-charged oxygen vacancy) is thought to be the mobile species. Anion motion then leads to valence changes of the metal (cations), which causes the resistance change of the metal oxide material. Therefore, these devices are also called valence change memories 9. Resistance switching can originate from a variety of defects that alter electronic transport rather than a specific electronic structure of insulating materials, and consequently almost all insulating oxides exhibit resistance switching behaviour. In principle, it should also be possible to observe this switching in most other insulating compound materials, such as halides, borides, carbides and phosphides. The key to obtaining controllable switching seems to be engineering structural and/or chemical defects into the material either through fabrication processes or electrical operations.Since the early demonstration of resistance switching phenom-enon in oxides around 50 years ago 6,7, oxides have been extensively studied as anion-based switching materials 20–26, including MgO, TiO x , ZrO x , HfO x , VO x , NbO x , TaO x , CrO x , MoO x , WO x , MnO x , FeO x , CoO x , NiO x , CuO x , ZnO x , AlO x , GaO x , SiO x , SiO x N y , GeO x , SnO 2, BiO x , SbO x , oxides of rare-earth metals including Y , Ce, Sm, Gd, Eu, Pr, Er, Dy and Nd, and perovskites (SrTiO 3, Ba 0.7Sr 0.3TiO 3, SrZrO 3, BiFeO 3, Pr 0.7Ca 0.3MnO 3, La 0.33Sr 0.67FeO 3, Pr y La 0.625−y Ca 0.375MnO 3). Among the even larger class of non-oxide insulators, a few examples of switch-ing materials have been demonstrated in nitrides (for example, AlN),1Hewlett-Packard Laboratories, Palo Alto, California 94304, USA, 2Department of Electrical and Computer Engineering, University of California, Santa Barbara, Santa Barbara, California 93106, USA, 3Steacie Laboratories, National Research Council of Canada, Ottawa K1A 0R6, Canada. e-mail: jianhuay@ ; strukov@ ; duncan.stewart@nrc.catellurides (for example, ZnTe) and selenides (for example, ZnSe). References and some detailed information of these switching materi-als are given in Supplementary Table S1.The switching mode can be bipolar or unipolar (also called nonpo-lar when devices can be operated with both voltage polarities). Bipolar switching requires opposite voltage polarities to be used for switching ON (set) and OFF (reset) respectively, whereas nonpolar and unipo-lar switching has no such requirement. Most of the above materials can switch in both nonpolar and bipolar modes27,28 depending princi-pally on the structure of the device, and in particular the asymmetry obtained through device fabrication or electrical operations. Switching mechanisms.Caution needs to be taken when identifying the exact switching material and mechanism. Many chemical interac-tions29,30 are possible inside a device under a high electric field and Joule heating, and the entire material stack should be taken into con-sideration. For example, the electrode31 or even the substrate mate-rial32,33 could be responsible for the observed switching phenomena. In most cases, a new material phase is formed in the insulating mate-rial during the initial electroforming processes11,34–36 or device fab-rication, and this new phase accounts for the switching. Therefore, identifying the actual switching material is a challenging but crucial first step towards understanding the switching mechanism. The spe-cific questions that need to be addressed are: what are the mobile spe-cies, and where (location), why (driving force) and how (microscopic picture) are they moving under electrical excitations?Insulating oxides can also be viewed as semiconductors with native dopants, resulting from oxygen deficiency (n-type, for exam-ple, TiO2−x; refs 37,38) or oxygen excess (p-type, for example, Co1−x O; refs 39,40). The thermally and/or electrically activated motion of these native dopants results in chemical changes in the oxides, such as valence state change, leading to resistance switching. The mobil-ity and concentration of oxygen vacancies or cation interstitials are sufficiently high in the temperature range in question8,9,41, especially in transition metal oxides. Therefore, it is generally believed that they are the mobile species responsible for switching, and this seems to be supported by experimental evidence22,38,42–44. However, more direct evidence would still be needed to clarify the identity of the mobile species in the representative switching oxides. Experiments using isotope tracers should be particularly useful45. In addition to the native dopants, other impurities, such as hydrogen, have been suggested to play a role in switching46,47, and this seems likely in cation devices48.The switching region in a micrometre-size device or larger is typi-cally a localized conduction channel tens or hundreds of nanome-tres in diameter38,44. Switches with a laterally (that is, parallel to the electrode surface) uniform switching region typically have a shorter retention and lower switching speed. The switching channel is usu-ally created in the electroforming process11,35,36, in which the virgin device is preconditioned to a switchable state by applying a higher-than-usual voltage or current. For a symmetric bipolar device, the switching polarity is usually determined by the voltage polarity of this electroforming process37,49,50–52. In contrast, for an asymmetric bipo-lar device, the switching polarity is often governed by the asymmetry of the device stack rather than the polarity of electroforming35. Even interface switching (as opposed to bulk switching) is localized to a small area of the interface37,50,53.The important role of the interface in the switching is reflected by a commonly observed rectifying current–voltage (I–V) relation in the high-resistance state (OFF state). In most cases, one interface of a bipolar device is essentially ohmic with a large density of dopants and the other interface is more resistive with fewer dopants. As a volt-age divider, most of the applied voltage drops on the resistive inter-face to force switching. Only a small fraction of the applied voltage is dropped on the highly conductive ohmic-like interface, which always remains at low resistance. The rectification orientation of the I–V curves could be used to identify the interface that blocks the current and this interface is usually the switching interface37. However, it is not uncommon that two opposite switching polarities coexist in the same device54,55, which could be rationalized by considering that both interfaces might be switchable under a certain circumstance and they switch to the opposite resistance states because they always see the opposite electric fields56,57. A family of nanodevices have been dem-onstrated in simple metal/oxide/metal structures with rich switching behaviours by tailoring the switching properties of the two interfaces. Nonpolar devices can switch either at the interface region50–52 or in the interior of the switching film58.An electrical bias generates two main effects in a switching mate-rial: an electric field and Joule heating. Joule heating is expected given the high current densities (of the order of >106 A cm−2) typi-cally required for switching in anion-based memristors and has been confirmed in both bipolar and nonpolar devices49,51,59–63. E lectric field and Joule heating generally coexist in all memristive switching, although their relative importance varies depending on the device stack, materials, electrical operation history and more. This leads to four main classes of switching commonly observed in oxide-based switches: bipolar nonlinear, bipolar linear, nonpolar bistable and nonpolar threshold switching. The four classes are shown schemati-cally in Fig. 1a–d. In all cases there are four main driving forces that work independently or together to influence atomic motion or rear-rangement: electric potential gradient (field), electron kinetic energy, species concentration gradient and temperature gradient (Fig. 1e–h). The microscopic picture of how exactly these factors drive the mobile species to actuate a particular type of switching are still under debate. Therefore, experiments that could visualize the switching in real time and at nanoscale resolution, and with chemical and/or structural information would be extremely valuable, such as those using in situ transmission electron microscopy38,64,65 and in situ scanning transmis-sion X-ray microscopy44.A high electric field gradient can move charged dopants, as illus-trated in Fig. 1e. High-speed electrons under a high electric field can also move atoms by momentum transfer or ‘electron wind’ (Fig. 1f), which has been demonstrated to reversibly switch the resistance of a Au nanowire66. Both electric field and electron kinetic energy are polarity dependent and can cause bipolar switching. The role of Joule heating is more complicated and not yet fully understood. High temperatures from Joule heating significantly enhance drift (Fig. 1e) and diffusion (Fig. 1g). Moreover, the high temperature is local-ized around the conduction channel, which generates a high tem-perature gradient laterally. Similar to an electric potential gradient or an element concentration gradient, a high temperature gradient itself might also induce a net mass transfer of atoms67 (Fig. 1h). Drift and electromigration move dopants vertically along the conduction channel, while the temperature gradient might contribute to lateral motion of dopants. Diffusion can happen in both ways, because element concentration gradients exist both vertically (within the channel) and laterally (into and out of the channel). Finally, for each microscopic device state with a particular arrangement of impurities, defects or dopants,the I–V characteristic is determined by the avail-able electron conduction mechanisms, as summarized in Fig. 1i for n-type materials. This I–V behaviour is the key device property for applications and also provides crucial information to decipher the switching mechanism.Generally speaking, the switching tends to be bipolar if the elec-tric field plays a significant role and nonpolar if thermal effects are dominant. Figure 1a presents schematically a device driven by an electric field. The growth and retraction of the conduction channel vertically under the electric field (drift or electromigration) in the interface region results in the typical switching loop (inset in Fig. 1a), where the rectifying I–V curve in the OFF state and the symmetric nonlinear I–V curve in the ON state reflect a Schottky-like barrier and a residual tunnel barrier in the OFF and ON states, respectively.DOI: 10.1038/NNANO.2012.240Figure 1b shows another type of bipolar switching, which has a linear I –V curve in both the ON and OFF states. In this class of switching, there is a conduction channel bridging the top and bottom electrodes all the time in the entire switching cycle. The resistance change origi-nates from the change in composition, volume or geometry inside the channel, which is a result of the combined effect of the electric-field-induced vertical drift and the thermally enhanced lateral diffusion 68.An increasing role of the thermal effect leads to nonpolar switching (Fig. 1c) where the same voltage polarity can be used to set and reset the device. The physics of nonpolar switching is still controversial. On the one hand, the temperature gradient shown in Fig. 1h might, for example, attract oxygen vacancies to the conduction channel region, switching the device ON. On the other hand, the set switching ini-tially resembles ‘soft breakdown’ of dielectrics under an electric field. It is likely, it is a combined two-step process, where a purely electronic effect (breakdown) leads to a high current and then heat-assisted ionic motion follows 67. The reset switching of the nonpolar device is normally described as a thermal rupture (fuse) of the conduction channel, possibly caused by thermal diffusion driven by concentra-tion gradient and/or reduction of free surface energy of the filament 58 or even a phase-change process induced by heat and/or electric field 69.In contrast, the switching shown in Fig. 1d is the threshold switching, which is essentially a volatile switching with a hyster-esis loop. With increasing current, the insulating device suddenlybecomes metallic at a certain current level accompanying a steep current increase in the I –V plot. However, after reducing the cur-rent level, the device becomes insulating again. Threshold switching has been observed in NiO x when its electrode is thin, and attributed to a spontaneous rupture of filaments at high temperature due to an insufficient heat dissipation 51,70. Threshold switching has been more commonly observed in metal–insulator–transition materials 71, such as VO 2, NbO 2 and Ti 2O 3, where negative differential resistance (NDR) phenomenon is frequently seen. A localized high temperature from Joule heating converts the heated region of a metal/insulator/transi-tion material from insulating to metallic via mechanisms still under debate, giving rise to the abrupt current increase. Reducing the cur-rent decreases the local temperature to below the metal/insulator/transition temperature, recovering the insulating state. Therefore, this type of switching (Fig. 1d) is viewed as a purely thermal effect.Most switching phenomena are thus a result of both thermal and electric field effects — indeed, a purely electric-field-induced switch-ing is yet to be unambiguously demonstrated in anion-based devices. As the device resistance changes during switching (and with it the voltage and current), even the relative contributions of the coupled thermal and electric field effects are dynamically changing.Material selection criteria. Joule heating is essentially unavoidable in these devices, and this has a major impact on material selection 72. ToFigure 1 | The driving forces, electrical characteristics, transport mechanisms of ions and electrons for the switching of anion-based devices. a –d , Simplified schematics of conduction channels (red) in switching matrix materials (blue) in four typical switching devices, where both electric field and Joule heating drive the switching. Switches with a laterally uniform switching region across the entire device area are not included here. The grey arrows indicate the idealized ionic motion. Different from c , the channel in d usually completely disappears in the high-resistance state and may or may not (for example, Mott transition) involve ionic motion. Inset to each schematic shows switching current–voltage loops typical of bipolarnonlinear switching 37 (a ), bipolar linear switching 68 (b ), nonpolar non-volatile switching 38 (c ) and nonpolar threshold switching 51,71 (d ). e –h , Schematic illustration of the factors that influence oxygen anion motion for drift (electric potential gradient, e ), electromigration (electron kinetic energy, f ), Fick diffusion (concentration gradient, g ), and thermophoresis (temperature gradient, h ). Any of the four factors shown in e –h may contribute with others simultaneously to produce switching of type a –d , which are idealized limiting cases; real-world switching is usually combinations of these. i , Schematic of the possible electron transport paths in the devices. (1) Schottky emission: thermally activated electrons injected over the barrier into the conduction band. (2) Fowler–Nordheim tunnelling: electrons tunnel from the cathode into the conduction band; usually occurs at high electric field. (3) Direct tunnelling: electrons tunnel from cathode to anode directly; only when the oxide is thin enough. When the insulator has localized states (traps) caused by disorder, off-stoichiometry or impurities, trap-assisted transport contributes to additional conduction, including the following steps: (4) tunnelling from cathode to traps; (5) emission from traps to the conduction band (Poole–Frenkel emission); (6) tunnelling from trap to conduction band; (7) trap-to-trap hopping or tunnelling, ranging from Mott hopping between localized states to metallic conduction through extended states (see Fig. 2b); and (8) tunnelling from traps to anode. E F , Fermi energy level; E v , valence band; E c , conduction band; E b , Schottky barrier height; E t , trap barrier height. Panel i reproduced with permission from ref. 16, © 2012 IEEE.DOI: 10.1038/NNANO.2012.240form a resistance switching system, both conductive and insulating phases are required. Reliable switching requires that these two phases do not react with each other chemically to form a new phase, even at the high temperatures induced by Joule heating. This would require a simple material system, such as those with the phase diagram shown in Fig. 2a. In this system there are only two thermodynamically stable solid-state phases, meaning that they will not react with each other to form a new phase even at high temperature. The MeO n phase is the insulating phase and the (Me) phase is relatively conductive, serv-ing as the conduction channel. What distinguishes any (Me) phase as an ideal conduction channel material is a large solubility of oxy-gen, which allows the channel to readily accommodate mobile spe-cies in and out without losing them after many switching cycles. A very large amount of oxygen can be accommodated in the nanoscale amorphous material (Me), especially under a fast quenching process during switching 68. Changes in the volume, geometry or composition of the channel phase can cause resistance switching.Figure 2b illustrates a resistance change from metallic to insu-lating in a disordered oxide that can be attributed to changes in conduction-centre concentration and thus hopping transport mechanisms 73. Multilevel cell or even analogue switching behaviour can be readily obtained with such conduction channels. Reliable switching up to a trillion cycles has been demonstrated in TaO x -based devices 74 and endurance close to ten billion switching cycles has been demonstrated using the similar Hf–O system 75. Based on the above criteria 72 of two stable phases and a large solubility, other oxide systems, such as Er–O and Y–O, may be expected to have a similar electrical performance.Cation devices. Cation-based devices are often called electrochemi-cal metallization memory, conductive bridging RAM, programmablemetallization cells or atomic switches. They were first reported in the 1970s 76 and have been further developed for memory applications since the late 1990s 77. In most cases, the mobile species is believed to be the metallic cation. The physical device stack is similar to that of anion-based devices, being an electrode/insulator/electrode trilayer 9,12,78,79.A signature of the cation-based devices is to have an electrode made from (or the insulator doped with) an electrochemically active material, such as Cu (ref. 79), Ag (ref. 80) or an alloy of these metals (CuTe, for example)78. Devices without this signature are discussed as anion-based devices in this Review, although their mobile species might be cation interstitials, such as with Ni 1−x O devices. The coun-ter electrode is usually an electrochemically inert metallic material, such as W , Pt, Au, Mo, Co, Cr, Ru, Ir, doped poly-Si, TiW or TaN (ref. 12). The insulating materials have traditionally been electro-lytes 81–84, including sulphides (Ag-doped Ge x S x , As 2S 3, Cu 2S, Zn x Cd 1−x S), iodides (AgI, RbAg 4I 5), selenides (Ag-doped Ge x Se y ), tellurides (Ge x Te y ), ternary chalcogenides (Ge–Sb–Te) and water. Other mate-rials have also been studied for this purpose, such as methylsilesqui-oxane, doped organic semiconductors, amorphous Si, C and even vacuum gaps 85,86. More and more insulating oxides or nitrides have recently been used 87–89, including Ta 2O 5, SiO 2, HfO 2, WO 3, MoO x , ZrO 2, SrTiO 3, TiO 2, CuO x , ZnO, Al 2O 3, GdO x and AlN. References and some detailed information of these switching materials are given in Supplementary Table S2. Changing from traditional electrolytes to oxide materials increases the switching voltages from below 0.3 V to above the operating voltage of CMOS (complementary metal–oxide–semiconductor) devices, making them suitable for some special applications, such as non-volatile switches in large-scale integrated circuits 87. Retention may also be improved using oxides,which are usually inexpensive and CMOS compatible.Meat%OT e m p e r a t u r eabFigure 2 | Material selection criteria for high endurance and repeatability. a , Simplified schematic phase diagram of a metal–oxygen (Me–O) system with only two solid-state phases at low temperature. The MeO n phase is an insulating stoichiometric phase, serving as the matrix material in the switching device illustrated schematically in Fig. 1. The (Me) phase is a metal–oxygen solid solution, serving as the conduction channel. These two phases are thermodynamically stable with each other and do not mix by reaction to form an intermediate phase even at high temperature, for example, locally induced by Joule heating. The metal (Me) has a large solubility of oxygen, readily accommodating mobile oxygen anions or vacancies during switching. b , With increasing oxygen content in the channel region, the electron transport mechanism changes, producing corresponding resistance changes. The schematic depicts a sequence of evolving conduction centre density and conduction mechanisms (top), and corresponding photoemission core-level (CL, middle) and valence-band (VB, bottom) measurements, from a disordered transition metal oxide in the course of oxidation. The red circles are the localization radii. Unoxidized metallic state (i), weakly localized variable range hopping (VRH) regime (ii), more strongly localized nearest-neighbour hopping (NNH, iii), strong localization regime on the verge of percolation breakdown (iv), and final highlyinsulating sub-percolation insulating state (v). X is the fraction of conduction centre sites and X cr is the critical fraction at the percolation threshold. E F , Fermi energy. Panel b reproduced with permission from ref. 73, © 2012 Springer.DOI: 10.1038/NNANO.2012.240Cation switching mechanisms strongly resemble those of anion-based devices, and can also be roughly described by the schematics in Fig. 1. E lectroforming in cation-based devices causes structural changes to the electrolyte and forms nanoscale channels that persist and serve as the template to host the electrochemically active metal atoms for subsequent switching78. Most of the cation-based switches are bipolar, suggesting that the dominating effect is the electric field (Fig. 1a,b). Unipolar switching shown in Fig. 1c has also been dem-onstrated in cation-based devices90,91, substantiating a possible role of Joule heating. The switching mechanism is relatively well understood with some electrolytes12,78,92, such as a Ag/H2O/Pt device93 (Fig. 3): during electroforming or set switching, a positive high voltage on the Ag electrode oxidizes the electrode atoms into Ag+ cations, which are dissolved into the electrolyte. These cations drift across the electro-lyte to the inert counter electrode (Pt, cathode) under a high elec-tric field; then they are electrochemically reduced to Ag atoms at the cathode and deposited on the surface of the cathode electrode, which allows the Ag atoms to grow towards the anode (Ag electrode) as a filament(s), reaching the Ag electrode and switching the device ON. Any of these steps could be the speed-limiting process for the entire switching event, depending on the material systems, in particular the insulating materials. An opposite voltage (positive) is then applied to the electrochemically inert Pt electrode for reset switching, which anodically dissolves the Ag filament (the virtual anode now) start-ing from the interface of the Ag electrode/Ag filament, and switches the device OFF. In this picture, the electric field is the only driving force and Joule heating is negligible given the small current usually involved in these devices.However, more research is still needed to clarify the microscopic picture of switching in cation devices, especially for those with non-traditional electrolyte materials, such as some oxides or amorphous Si (refs 12,64,65,94). These materials are usually not good ionic con-ductors and require a higher voltage (thus a high electric field and substantial heating) for switching. A temperature-dependent switch-ing study in a Cu/Ta2O5/Pt system suggests that the reset switch-ing is likely to be thermal-diffusion assisted (similar to in Fig. 1b). Furthermore, some experimental results have shown that the conduc-tion channel64,65 has an opposite geometry to that in Fig. 3, suggest-ing a possibility that the switching occurs at the interface between the inert electrode and the conduction channel in some cases. The reason for the observed discrepancy among different electrolytes remains unclear. It is worth noting that the conduction channel(s) might be composed of nano-islands rather than a continuous filament, espe-cially in the OFF state. This possibility is supported by the observation of a Coulomb blockade effect at low temperature87 and also by some direct imaging of the filament65.Ph ysical switch es.Both the cation- and anion-based devices are chemical switches because chemical reactions (redox) are involved in the switching mechanisms. There are also various switching phe-nomena where only physical changes are involved and some of these may also belong to generalized memristive devices3. There are, for example, electronic, magnetic, ferroelectric and microstructural pro-cesses, which lead to electronic resistance switches, magnetic tunnel junctions95, ferroresistive switches96,97 and phase-change switches98,99, respectively. Among them, magnetic tunnel junctions and phase-change switches have been the most intensively studied.In electronic switches, resistance change can stem from charge trapping (de-trapping) at an electrode/insulator interface to increase (decrease) the contact barrier10, or inside a disordered thin film (for example, Pt-doped SiO2)100 to increase or decrease the degree of Anderson localization. E lectronic switches have also been demon-strated in metal-doped polymers and are attributed to charge trans-fer between the metal nanoparticles and the organic materials101,102. Another type of electronic resistance switch relies purely on an elec-tronic phase change such as the Mott transition, which applies to systems (for example, GaTa4S8)103 that should be metals according to band-structure theory but turn out to be insulators due to strong electronic Coulomb interactions below a certain critical density of electrons, as determined by electric or magnetic fields, pressure, or carrier doping104. A ferroelectric tunnel junction, an example of fer-roresistive switches97, utilizes an ultrathin ferroelectric material (for example, BaTiO3)96 as a tunnel barrier in a tunnel junction, where electric-field-induced polarization reversal in the ferroelectric mate-rial changes the interface transmission, thus the tunnelling current and the device resistance. These device concepts seem promising, but experimental data need to be carefully examined as different switch-ing mechanisms, such as the chemical switching discussed before, are also possible in these devices.Other device geometries.In addition to the most commonly used two-terminal, vertical-stack and crosspoint devices discussed above, other device geometries have also been explored, such as three-termi-nal and lateral (planar) two-terminal devices. Three-terminal resist-ance switches, which resemble a transistor, utilize a third electrode as a gate to control the formation and annihilation of the conduction channel by controlling the drift of dopants. This allows the signal and control lines to be separated. Functioning three-terminal devices have been demonstrated both in cation-105 and anion-based switches39,106, which are related to the 1960 ‘memistor’107. A lateral device has two electrodes on the same plane separated by a small gap, which is filled with a switching material42. This device configuration is mainly used for research because it allows easy access to the switching region for material characterization.Nanowires have also been employed in resistance switches. Single-walled carbon nanotubes with a breaking gap filled with a GeSbTe phase-change material have been used to demonstrate the sub-10-nm scalability and sub-10-μA switching current in phase-change switches108. Oxide nanowires (for example, CoO x shell/MgO core) have been used to fabricate lateral devices with multielectrodes39 to study the field effect and the switching location. Nanowire core–shell switches have been fabricated by oxidizing the metal nanowire (for example, Co, one electrode) surface to form a switchable metal oxide shell (for example, CoO), on which another electrode wire (for example, Au) is placed perpendicular to the core–shell wire109.A single metal nanowire (for example, Au) has displayed memristive switching based on electromigration effects66. Self-assembled nanow-ire devices have proved valuable in fundamental studies at the sub-lithographic scale, but high-quality dense integration of nanowires is still a problem without a known good solution. Furthermore, very abAg AgPt Pt1 μm 1 μmFigure 3 | Switching of a traditional cation-based device (electrochemical metallization memory) with the cell stack of Pt/H2O/Ag. a, Scanning electron microscopy (SEM) image showing the high-resistance state of the device with shorter and smaller Ag dendrites. b, SEM image of the same cell at low-resistance state with longer and larger Ag dendrites, obtained by applying a positive voltage on the Ag electrode side. Figure reproduced with permission from ref. 93, © 2007 AIP.DOI: 10.1038/NNANO.2012.240。
物理选修三知识点总结
物理选修三知识点总结Physics elective three is an essential course for students interested in furthering their understanding of the physical world. This elective covers a wide range of topics, from electromagnetism to quantum mechanics, providing students with a broad overview of the key concepts in physics.物理选修三是对于对物理世界有进一步了解的学生来说是一个必要的课程。
这门选修课涉及了广泛的主题,从电磁学到量子力学,为学生提供了物理学中关键概念的广泛概述。
One of the main topics covered in physics elective three is electromagnetism. This includes the study of electric fields, magnetic fields, electromagnetic waves, and the relationship between electric and magnetic fields. Understanding electromagnetism is crucial for a wide range of applications, from designing electronics to understanding the behavior of light.物理选修三涵盖的主要主题之一是电磁学。
这包括电场、磁场、电磁波的研究,以及电场与磁场之间的关系。
了解电磁学对于各种应用至关重要,从设计电子设备到了解光的行为。
微尺燃烧及其应应用
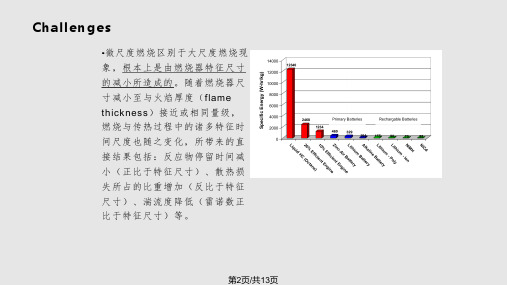
din=1 mm, t=0.5 mm
din=2 mm, t=0.5 mm
d=2 mm
L=10, 15 and 20 mm
d=3 mm
L=10, 15 and 20 mm
ห้องสมุดไป่ตู้
d=3 mm
L=10, 15 and 20 mm
d=4 mm
L=10, 15 and 20 mm
s=0.5 mm s=1.0 mm s=0.5 mm s=1.0 mm
第7页/共13页
Wall heat flux maximization
• Cylindrical tubes with backward-facing steps 有凸台的圆管
Fixed parameters
Independent Variables
Dependant variables
After combustion experiment, surface oxidized
Challenges
•微 尺 度 燃 烧 区 别 于 大 尺 度 燃 烧 现 象,根本上是由燃烧器特征尺寸 的减小所造成的。随着燃烧器尺 寸减小至与火焰厚度(flame thickness)接近或相同量级, 燃烧与传热过程中的诸多特征时 间尺度也随之变化,所带来的直 接结果包括:反应物停留时间减 小(正比于特征尺寸)、散热损 失所占的比重增加(反比于特征 尺寸)、湍流度降低(雷诺数正 比于特征尺寸)等。
A
B
流速 2
m/s
Φ=0.6
Φ=0.8
3 m/s
Φ=1.0
Φ=0.6
Φ=0.8
Φ=1.0
第11页/共13页
Thank you very much for your attention!
无储能光-电微网下的抽油机井群间抽混合整数非线性优化方法

文章编号:1000 − 7393(2023)06 − 0773 − 10 DOI: 10.13639/j.odpt.202311042无储能光-电微网下的抽油机井群间抽混合整数非线性优化方法高小永 李晨龙 檀朝东 黄付宇 米思怡 袁宇中国石油大学(北京)信息科学与工程学院引用格式:高小永,李晨龙,檀朝东,黄付宇,米思怡,袁宇. 无储能光-电微网下的抽油机井群间抽混合整数非线性优化方法[J ]. 石油钻采工艺,2023,45(6):773-782.摘要:多数低渗透油藏丛式井因供液不足而采用间抽采油方式,光伏、风电等绿电引入油田生产后在减少碳排放方面发挥了重要作用。
为解决人工制定的错峰开井和间抽制度存在的井群运行能耗高等问题,以各抽油机的启停状态和电源频率,以及各光伏机组和高压电网的出力为决策变量,用直流母线实现抽油机组倒发电电能互馈,根据井群生产需求充分考虑源荷端约束,以系统运行成本最低为目标,建立一种无储能环节光-电微网下的错峰开井和间抽运行的混合整数非线性模型,用Gurobi 对该问题求解。
案例分析结果表明,所建模型求解结果与高压电网供电下井群常开以及人为制定间抽制度比较,井群耗电量分别降低35.687%和15.219%,系统运行成本分别降低35.471%和23.884%,并且相较于后者井群日产量提高21.620%。
研究将光伏引入抽油机间抽系统,建立调度模型,大幅降低井群运行能耗和运行成本,凸显了模型的有效性。
关键词:抽油机井群;间抽运行;调度优化;错峰开井;微电网;倒发电中图分类号:TE348; TM727 文献标识码: AA mixed integer nonlinear optimization method for inter well pumping between pumping unitsin a non energy storage opto electric microgridGAO Xiaoyong, LI Chenlong, TAN Chaodong, HUANG Fuyu, MI Siyi, YUAN YuCollege of Information Science and Engineering , China University of Petroleum (Beijing ), Beijing 102249, ChinaCitation: GAO Xiaoyong, LI Chenlong, TAN Chaodong, HUANG Fuyu, MI Siyi, YUAN Yu. A mixed integer nonlinear optimization method for inter well pumping between pumping units in a non energy storage opto electric microgrid [J ]. Oil Drilling & Production Technology, 2023, 45(6): 773-782.Abstract: For most cluster wells in low-permeability reservoirs, intermittent pumping is adopted due to insufficient liquid supply,and the introduction of green energy such as photovoltaics and wind power is playing a crucial role in reducing carbon emissions in oilfield production. To address issues such as high energy consumption of well clusters running in manually scheduled staggered well opening and intermittent pumping systems, by taking the start-stop status and the power frequency of each pump, as well as the output of each photovoltaic unit and high-voltage power grid as variables for decision, mutual feedback of electrical energy reversely generated from pump units was achieved using DC bus. Taking into account the constraints of the source-load side according to the基金项目: 国家自然科学基金“考虑过程耦合与操作动态的炼油化工生产调度多目标优化” (编号:22178383);国家自然科学基金“基于大数据解析的大规模非集输油井群生产及拉运调度协同优化”(编号:51974327)。
nano micro letters关于静电的文章
nano micro letters关于静电的文章【中英文版】Title: Nano Micro Letters: An Article on ElectrostaticsIntroduction:Electrostatics, the study of static electricity, has long been a topic of interest and research.In this article, we will delve into the fascinating world of electrostatics, exploring its basic principles, fascinating phenomena, and practical applications.基本原理:The basic principle of electrostatics can be summarized by the law of conservation of charge, which states that charge cannot be created or destroyed, only transferred or redistributed.This is evident in the process of charging objects by friction, where electrons are transferred from one object to another, resulting in one object gaining a negative charge and the other a positive charge.静电现象:Electrostatics gives rise to a variety of intriguing phenomena.One such phenomenon is the attraction or repulsion of objects with the same or opposite charges, respectively.Another fascinating aspect is the ability of certain materials to accumulate static charges, which can lead to static shocks when接触with conductive materials.实际应用:The practical applications of electrostatics are numerous and diverse.One common application is in the field of photography, where static charges are used to attract and fix Developer on film or paper, facilitating the formation of visible images.Additionally, electrostatics plays a crucial role in various industrial processes, such as painting and printing, where static charges are used to enhance the adhesion of ink or paint to surfaces.总结:In conclusion, electrostatics is a fascinating field of study with wide-ranging applications.From the basic principles of charge conservation to the intriguing phenomena and practical uses, the study of electrostatics continues to captivate and inspire scientists and engineers alike.As we continue to explore the nanoscopic and microscopic world, we can expect further discoveries and advancements in the field of electrostatics.总结:总结一下,静电学是一个引人入胜的研究领域,具有广泛的应用。
microamp -回复

microamp -回复什么是[microamp]?[microamp]是一个单位,它代表微安(microampere)的缩写。
微安是电流的国际标准单位之一,在国际单位制中表示为μA,在计量学中有非常重要的意义。
本文将一步一步回答关于[microamp]的问题,从解释其定义和用途,到介绍相关的计算方法和实际应用。
第一步:[microamp]的定义和背景微安是电流的单位,通常用于测量和描述电路中流动的电子和电荷的数量。
微安的定义是每秒钟通过导体横截面的电荷量等于每秒通过这个导体的带电粒子数,即1微安等于每秒通过导体横截面的1百万电子或其他带电粒子。
微安的定义源于安培(Ampere)单位的基本概念,安培是电流的基本单位。
1微安等于1百万分之一安,或者更准确地说是1 x 10^-6安。
第二步:计算和转换微安在电路中,我们常常需要计算电流值或将不同的电流单位进行转换。
对于微安的计算,我们可以使用以下公式:I(A)= I(μA)x 10^-6其中I(A)代表安培,I(μA)代表微安。
例如,如果一个电路的电流值为500μA,我们可以通过上述公式将其转换为安培:I(A)= 500μA x 10^-6 = 0.0005A = 5 x 10^-4A换句话说,500μA等于0.0005A或5 x 10^-4A。
第三步:[microamp]在实际应用中的意义微安作为电流单位在很多领域都有广泛的应用。
以下是一些微安在实际中的常见应用:1. 电子设备:微安常用于描述和测量电子设备中的小电流流动,例如集成电路、传感器和微处理器等。
在这些设备中,微安级别的电流通常是常见的。
2. 生物医学:在生物医学领域,微安被用来测量生物体内的微小电流。
例如,在脑电图(EEG)测量中,微安被用来记录大脑中的电活动。
3. 能量管理:微安也被用于能量管理和电力消耗方面的研究。
通过测量电路中微小的电流变化,可以评估和改进设备的能源效率。
4. 通信和电信:在通信和电信领域,微安常用于描述电路中的信号强度和数据传输速率。
镁合金新型氟钛酸盐电解液体系微弧氧化电参数的优化
镁合金新型氟钛酸盐电解液体系微弧氧化电参数的优化董凯辉;孙硕;宋影伟;单大勇【摘要】A new fluotitanate electrolyte was used for preparing microarc oxidation (MAO) film on AM60 Mg alloys. Four electrical parameters, including current density, oxidation time, frequency and duty cycle, were investigated for determining the optimum parameters. The surface and cross-section morphologies were characterized by SEM (Scanning electron microscopy). The chemical composition and phase structure were analyzed by EDX (Energy dispersive X-ray spectroscopy) and XRD (X-ray diffractometry). The corrosion resistance was evaluated by polarization and EIS (Electrochemical impedance spectroscopy) measurements. The optimal electrical parameters are determined as follows:current density 3 A/dm2, oxidation at constant current to 420 V, frequency 800 Hz and positive duty cycle 30%. The micro-pores on the surface of the film are in-situ sealed during the film formation process, thus avoiding the porous structure asthe traditional MAO film. The corrosion current density of the MAO film under the optimum processing conditions can reach 1×10⁻⁷ A/cm2, which is superior to the corrosion resistance of traditional MAO films.%采用新型氟钛酸盐电解液对AM60镁合金进行微弧氧化处理,通过改变电流密度、氧化时间、频率和占空比4种电参数进行对比研究,采用SEM(扫描电子显微镜)观察材料的表面及截面形貌,采用EDX (能量色散X射线光谱仪)以及XRD(X射线衍射仪)确定其化学成分和相组成,通过极化曲线和阻抗谱对材料的耐蚀性进行评价。
三电极开关系统自击穿特性微观分析
三电极开关系统自击穿特性微观分析詹艳艳;刘晓明;吴楠【摘要】针对三电极开关系统基于粒子扩散、碰撞、电离、激发等过程,建立等离子体流体—化学模型,采用有限元法,模拟真空条件下三电极开关自击穿微观过程,并与其在SF6介质中微观过程进行对比分析.仿真分析了开关从放电初始到等离子体通道形成的物理过程.结果表明,与SF6介质相比,开关在真空条件下等离子体通道电子密度数较多、电子温度较低;开关等离子体通道电子密度和电子温度随间距增加而增加.%Aiming at the system of triple-electrode switch,the fluid-chemistry model of plasma is established based on the particles'diffusion,collision,ionization and excitation and the finite element method. The micro process of self-breakdown of triple-electrode switch system is simulated in vacuum and contrasted with the process in SF6.The simulation results analyzes the physical process from initial discharge to plasma channel formed.The plasma channel has more electron number in vacuum than that in SF6,and the electron tem-perature is lower.Electron density and electron temperature increases with the distance in-creasing,which describes physical mechanism of triple-electrode switch system.【期刊名称】《沈阳理工大学学报》【年(卷),期】2018(037)001【总页数】6页(P11-16)【关键词】三电极开关;自击穿微观过程;等离子体通道;流体化学模型【作者】詹艳艳;刘晓明;吴楠【作者单位】沈阳工业大学电气工程学院,沈阳110870;沈阳理工大学自动化与电气工程学院,沈阳110159;天津工业大学天津市电工电能新技术重点实验室,天津300387;沈阳工业大学电气工程学院,沈阳110870【正文语种】中文【中图分类】TM854应用于Marx发生器 [1-3]中的气体火花开关以其优越的性能被国内外学者广泛关注。
- 1、下载文档前请自行甄别文档内容的完整性,平台不提供额外的编辑、内容补充、找答案等附加服务。
- 2、"仅部分预览"的文档,不可在线预览部分如存在完整性等问题,可反馈申请退款(可完整预览的文档不适用该条件!)。
- 3、如文档侵犯您的权益,请联系客服反馈,我们会尽快为您处理(人工客服工作时间:9:00-18:30)。
E 1 2 3 4 6 5
值得注意的是,电子的 净位移与施加的电场方向相 反。
这种在外电场作用下载流子的定向运动称为漂移运动。
广东工业大学物理与光电工程学院
半导体器件物理与工艺
载流子输运现象 6
载流子漂移
电子在每两次碰撞之间,自由飞行期间施加于电子的冲 量为-qEτc,获得的动量为mnvn,根据动量定理可得到
载流子输运现象 5
载流子漂移
当一个小电场E施加于半导体时,每一个电子会从电场上受到一个-qE的 作用力,且在各次碰撞之间,沿着电场的反向被加速。因此,一个额外的速 度成分将再加至热运动的电子上,此额外的速度成分称为漂移速度(drift
velocity)
一个电子由于随机的热 运动及漂移成分两者所造成 的位移如图所示。
广东工业大学物理与光电工程学院
vn n E
半导体器件物理与工艺
载流子输运现象 19
载流子漂移
对空穴有类似结果,但要将空穴所带的电荷转变为正。
J p qpvp qp p E
所以,因外加电场而流经半导体中的总电流则为电子及空 穴电流的总和,即
J J n J p qn n qp p E
mn n 0.26 0.91 10 30 kg 1000 10 4 m 2 / V s c q 1.6 10 19 C
1.48 1013 s 0.148 ps.
又
1 3 3k T 2 mn vth k T vth 10 7 cm / s 2 2 mn
广东工业大学物理与光电工程学院
p , Dp
20 10 5
1018 1019
1020
100
半导体器件物理与工艺
载流子输运现象 13
扩散系数/(cm 2 s -1 )
电子及空穴的迁移率皆随 着杂质浓度的增加而减少, 并于最后在高浓度下达到一 个最小值;
p , Dp
10
15
2 1
10
16
1017
In
n / cm 3
In
In
L
面积=A
假设施加一电场E至样品上,流经样品中的电子电流密度Jn 便等于每单位体积中的所有电子n的单位电子电荷(-q)与电子 速度乘积的总和,即 n In J n (qvi ) qnvn qn n E. A i 1 其中In为电子电流。上式利用了
1 . qn n
而对p型半导体而言,可简化为(因为p>>n)
1 . qp p
广东工业大学物理与光电工程学院 半导体器件物理与工艺
载流子输运现象 21
载流子漂移
电阻率的测量
最常用的方法为四探针法,如图,其中探针间的距离相等,一个从恒定电
流源来的小电流I,流经靠外侧的两个探针,而对于内侧的两个探针 间,测量其电压值V。就一个薄的半导体样品而言,若其厚度为W, 且W远小于样品直径d,其电阻率为
I N型 电子 V
在外加电场的影响下, 载流子的运输会产生电流, 称为漂移电流(drift current)
qV
EC EF Ei EV
空穴 (b) 偏压情况下
广东工业大学物理与光电工程学院
半导体器件物理与工艺
载流子输运现象 18
载流子漂移
考虑一个半导体样品,其截面积为A,长度为L,且载流子 浓度为每立方厘米n个电子,如图。
广东工业大学物理与光电工程学院
半导体器件物理与工艺
载流子输运现象 9
载流子漂移
杂质散射: 杂质散射是当一个带电载流子经过一个电离的杂质时所引 起的。
由于库仑力的交互作用,带电载流子的路径会偏移。杂质 散射的几率视电离杂质的总浓度而定。
然而,与晶格散射不同的是,杂质散射在较高的温度下变 得不太重要。因为在较高的温度下,载流子移动较快,它们在 杂质原子附近停留的时间较短,有效的散射也因此而减少。由 杂质散射所造成的迁移率µ 理论上可视为随着T3/2/NT 而变化, I 其中NT为总杂质浓度。
I N型 电子
EC EF Ei EV
E N型 V
qV
EC EF Ei
能量
x (a) 热平衡时 (b) 偏压情况下
EV
空穴
广东工业大学物理与光电工程学院
半导体器件物理与工艺
载流子输运现象 16
载流子漂移
当一电场E施加于半导体上,每一个电子将会在电场中受 到一个-qE的力,这个力等于电子电势能的负梯度,即 dEc E I qE dx N型 V 由于导带底部EC 相当于电子 电子 的电势能,对电势能梯度而 言,可用与EC 平行的本征费 qV 米能级Ei的梯度来代替,即 E 1 dEc 1 dEi E E E q dx q dx E
载流子漂移
影响迁移率的因素:
散射机制 平均自由时间 迁移率
最重要的两种散射机制:
晶格散射(lattice scattering) 杂质散射(impurity scattering)。
广东工业大学物理与光电工程学院
半导体器件物理与工艺
载流子输运现象 8
载流子漂移
晶格散射: 晶格散射归因于在任何高于绝对零度下晶格原子的热震动 随温度增加而增加,在高温下晶格散射自然变得显著,迁移率 也因此随着温度的增加而减少。理论分析显示晶格散射所造成 的迁移率µ 将随T-3/2方式减少。 L 增加动画演示
qE c mn vn
或
q c E vn mn
上式说明了电子漂移速度正比于所施加的电场,而比例因子则 视平均自由时间与有效质量而定,此比例因子即为迁移率。 因此 同理,对空穴有
vn n E
vp p E
半导体器件物理与工艺
广东工业大学物理与光电工程学院
载流子输运现象 7
电子迁移率 空穴迁移率
广东工业大学物理与光电工程学院
q c n mn q c p mp
半导体器件物理与工艺
载流子输运现象 3
载流子漂移
迁移率的导出 半导体中的传导电子不是自由电子,晶格的影响需并入传导 电子的有效质量 在热平衡状态下,传导电子在三维空间作热运动 由能量的均分理论得到电子的动能为
上式右端括号部分即为电导率
qn n p p
1 . q ( n n p p ) 1
所以,电阻率亦为
广东工业大学物理与光电工程学院
半导体器件物理与工艺
载流子输运现象 20
载流子漂移
一般来说,非本征半导体中,由于两种载流子浓度有好几 次方的差异,只有其中一种对漂移电流的贡献是显著的。 如对n型半导体而言,可简化为(因为n>>p)
半导体器件物理与工艺
载流子输运现象 2
载流子漂移
迁移率(mobility)
迁移率是用来描述半导体中载流子在单位电场下运动快慢的物 理量,是描述载流子输运现象的一个重要参数,也是半导体理论中 的一个非常重要的基本概念。
迁移率定义为:
q c m
单位: cm2/(V· s)
由于载流子有电子和空穴,所以迁移率也分为电子迁移率和 空穴迁移率,即:
1
l
1
i
载流子输运现象 11
半导体器件物理与工艺
载流子漂移
实例
右图为不同施主浓度硅晶 µ 与T的实测曲线。小插图则 n 为理论上由晶格及杂质散射所 造成的µ 与T的依存性。 n 对低掺杂样品,晶格散射 为主要机制,迁移率随温度的 增加而减少;对高掺杂样品, 杂质散射的效应在低温度下最 为显著,迁移率随温度的增加 而增加。同一温度下,迁移率 随杂质浓度的增加而减少。
如图为室温下硅及砷化镓中所测量到的以杂质浓度为函数的迁移率。
2000
迁移率/[cm2 (V S ) 1 ]
50 Si
n , Dn
10 5
200 100 50 20
10
14
迁移率/[cm2 (V S ) 1 ]
5000 2000 1000 500 200
n , Dn
100 50
电子的迁移率大于空穴的 迁移率,而较大的电子迁移 率主要是由于电子较小的有 效质量所引起的。
所以,平均自由程则为
l vth c (107 cm / s) (1.48 1013 s) 1.48 106 cm 14.8nm.
广东工业大学物理与光电工程学院 半导体器件物理与工艺
载流子输运现象 14
载流子漂移
电导率(conductivity)与电阻率(resistivity): 电导率与电阻率互为倒数,均是描述半导体导电性能的基 本物理量。电导率越大,导电性能越好。 半导体的电导率由以下公式计算:
1 3 2 mn vth kT 2 2
其中mn为电子的有效质量,而vth为平均热运动速度。 在室温下(300K),上式中的电子热运动速度在硅晶及砷化镓中 约为107cm/s。
广东工业大学物理与光电工程学院 半导体器件物理与工艺
载流子输运现象 4
载流子漂移
半导体中的电子会在所有的方向做快速的移动,如图所示. 单一电子的热运动可视为与晶格原子、杂质原子及其他散射中心碰撞所引发 的一连串随机散射,在足够长的时间内,电子的随机运动将导致单一电子的 净位移为零。 平均自由程(mean free path):
广东工业大学物理与光电工程学院
半导体器件物理与工艺
载流子输运现象 10
流子漂移
碰撞几率: 平均自由时间的倒数。 在单位时间内,碰撞发生的总几率1/τc是由各种散射机所引 起的碰撞几率的总和,即
1
c
1
c ,晶格 c ,杂质
1
所以,两种散射机制同时作用下的迁移率可表示为:
1
广东工业大学物理与光电工程学院