FusionCharts使用手册
FusionCharts二次开发指南

FusionCharts1.FusionCharts介绍:FusionCharts是一个基于Flash的图表组件,可以用来提供数据驱动的动态图表,fusioncharts可用于任何网页脚本语言,如HTML,JSP等。
提供交互式和强大的动态图标,fusioncharts充分利用流体美的Flash为模版,使用XML作为数据接口,产生和用户互动的动态图表。
2.数据接口XML:FusionCharts是以XML为数据接口而成图表。
提供XML两种形式:直接以XML文件提供数据。
基于数据库数据动态生成XML。
3.FusionCharts安装(以java的web工程为例):➢将所有的SWF文件拷贝到WebRoot下的一个自己创建的文件夹。
➢拷贝FusionCharts.jsp文件到WebRoot下(可以将其放在WebRoot下的某个文件夹中),这个文件包含生成的flash图标嵌入到jsp或者HTML中。
➢拷贝FusionCharts.js,这个文件提供了createChartHTML函数使我们轻松的创建图表。
4.创建一个Chart(以Column 2D为例):以本地为例,首先创建一个FusionCharts的文件夹(D:\FusionCharts)。
把下载根目录下的Charts文件夹拷贝过来,这里就包含了所有的我们要引用的SWF文件,然后拷贝FusionCharts.js文件到该目录下,将就需要创建XML数据文档:<chart palette='2' caption='Unit Sales' xAxisName="month" yAxisName='Units' decimals='1' showValues='1' formatNumberScale='0' useRoundEdges='1'><set label='Jan' value='462' /><set label='Feb' value='857' /><set label='Mar' value='671' /><set label='Apr' value='494' /><set label='May' value='761' /><set label='Jun' value='960' /></chart>接下来创建一个包含图形的HTML页面:<?xml version="1.0" encoding="iso-8859-1"?><!DOCTYPE html PUBLIC "-//W3C//DTD XHTML 1.0 Transitional//EN" "/TR/xhtml1/DTD/xhtml1-transitional.dtd"><html xmlns="/1999/xhtml"><head><meta http-equiv="Content-Type" content="text/html; charset=iso-8859-1" /><title>FusionCharts v3 Documentation</title><link rel="stylesheet" href="../Contents/Style.css" type="text/css" /><script language="JavaScript" src="../JSClass/FusionCharts.js"></script></head><body><table width="98%" border="0" cellspacing="0" cellpadding="3" align="center"><tr><td valign="top" class="text" align="center"> <div id="chartdiv" align="center">FusionCharts. </div><script type="text/javascript">var chart = new FusionCharts("../Charts/Column2D.swf", "ChartId", "500", "300", "0", "0");chart.setDataURL("../Data/Column2D.xml");chart.render("chartdiv");</script> </td></tr><tr><td valign="top" class="text" align="center"> </td></tr><tr><td valign="top" class="text" align="center"><a href="Data/Column2D.xml" target="_blank"><img src="../Contents/Images/BtnViewXML.gif" alt="View XML for the above chart" width="75" height="25" border="0" /></a></td></tr></table></body></html>这样就生成了如Column 2D Chart图例所示,其他图形只需要正确的SWF文件和XML 文件代替上面代码中红色标记的地方即可生成需要的图形。
Fusioncharts Web系统开发指南说明书

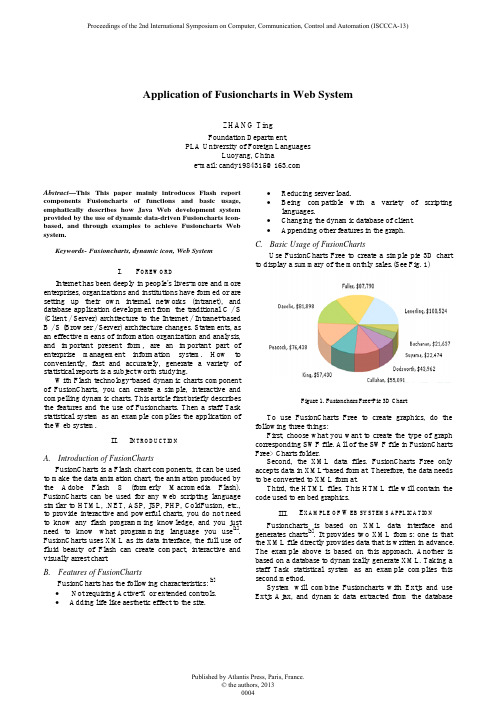
Application of Fusioncharts in Web SystemZHANG TingFoundation Department,PLA University of Foreign LanguagesLuoyang, ChinaAbstract—This This paper mainly introduces Flash report components Fusioncharts of functions and basic usage, emphatically describes how Java Web development system provided by the use of dynamic data-driven Fusioncharts icon-based, and through examples to achieve Fusioncharts Web system.Keywords-Fusioncharts, dynamic icon, Web SystemI.F OREWORDInternet has been deeply in people's lives-more and more enterprises, organizations and institutions have formed or are setting up their own internal networks (intranet), and database application development from the traditional C / S (Client / Server) architecture to the Internet / Intranet-based B / S (Browser / Server) architecture changes. Statements, as an effective means of information organization and analysis, and important present form, are an important part of enterprise management information system. How to conveniently, fast and accurately, generate a variety of statistical reports is a subject worth studying.With Flash technology-based dynamic charts component of FusionCharts, you can create a simple, interactive and compelling dynamic charts. This article first briefly describes the features and the use of Fusioncharts. Then a staff Task statistical system as an example complies the application of the Web system.II.I NTRODUCTIONA.Introduction of FusionChartsFusionCharts is a Flash chart components, it can be used to make the data animation chart, the animation produced by the Adobe Flash 8 (formerly Macromedia Flash). FusionCharts can be used for any web scripting language similar to HTML, .NET, ASP, JSP, PHP, ColdFusion, etc., to provide interactive and powerful charts, you do not need to know any flash programming knowledge, and you just need to know what programming language you use[1]. FusionCharts uses XML as its data interface, the full use of fluid beauty of Flash can create compact, interactive and visually arrest chart.B.Features of FusionChartsFusionCharts has the following characteristics: [2]• Not requiring Active-X or extended controls.•Adding life like aesthetic effect to the site.•Reducing server load.•Being compatible with a variety of scripting languages.•Changing the dynamic database of client.•Appending other features in the graph.C.Basic Usage of FusionChartsUse FusionCharts Free to create a simple pie 3D chart to display a summary of the monthly sales.(See Fig. 1)Figure 1. Fusionchars Free-Pie 3D ChartTo use FusionCharts Free to create graphics, do the following three things:First, choose what you want to create the type of graph corresponding SWF file. All of the SWF file in FusionCharts Free> Charts folder.Second, the XML data files. FusionCharts Free only accepts data in XML-based format. Therefore, the data needs to be converted to XML format.Third, the HTML files. This HTML file will contain the code used to embed graphics.III.E XAMPLE OF W EB SYSTEMS APPLICATION Fusioncharts is based on XML data interface and generates charts[3]. It provides two XML forms: one is that the XML file directly provides data that is written in advance. The example above is based on this approach. Another is based on a database to dynamically generate XML. Taking a staff Task statistical system as an example complies this second method.System will combine Fusioncharts with Extjs and use Extjs Ajax, and dynamic data extracted from the databasewill be transmitted into XML format to Fusionchartsinterface showing a brilliant flash graphical report.When the user clicks the Statistics button on the page, the request is submitted after verification judgment on the legitimacy of the user input via JavaScript, backstage Servlet or Action summary of the data in the database will retrieve the required conditions, get the results and respond to the output in accordance with the FusionCharts control XML format required, then get the XML content to serve FusionCharts control through AJAX technology. What is particularly worth mentioning is that the document production attached is very specific and comprehensive. It is very convenient to realize the chart via documentation provided. [4]A. Defined various of XML elements in Background In the Fusioncharts Free the system uses the ScrollCombi2D.swf, and each element contained in the xml file is the dynamic data-driven icon, should be defined in Java in the background. Java xml file operation is a very mature technology, and we use the xml comments in the JDK (Annotations) to defineeach element node in the xml file, what is needed to use are the XmlAttribute, XmlRootElement and XmlElement, three annotation types of javax.xml.bind.annotation package. Using these three types, we can define FusionChart class, FusionChartCategories class, FusionChartCategory class, FusionChartData class and FusionChartDataset. The XmlAttribute is mainly responsible for the properties of elements in the xml file, and the XmlElement is mainly responsible for the assignment of elements in the xml file, that is, the value got from the background is assigned to the element. The core code of Fusioncharts class is as follows: package com.ndsc.no7ss2.service.fusioncharts;import java.util.ArrayList;import java.util.List;import javax.xml.bind.annotation.XmlAttribute;import javax.xml.bind.annotation.XmlElement;import javax.xml.bind.annotation.XmlRootElement;@XmlRootElement(name = "chart")public class FusionChart{ @XmlAttribute(name = "caption") public String caption; @XmlAttribute(name = "lineThickness") public int lineThickness; @XmlAttribute(name = "showValues") public int showValues; @XmlAttribute(name = "areaOverColumns") public int areaOverColumns; @XmlAttribute(name = "formatNumberScale") public int formatNumberScale;@XmlAttribute(name = "useRoundEdges")public int useRoundEdges;@XmlAttribute(name = "palette") public int palette;@XmlAttribute(name = "legendBorderAlpha") public int legendBorderAlpha; @XmlElement(name = "categories") public FusionChartCategories categories; @XmlElement(name = "dataset") public List<FusionChartDataset> datasets; @XmlElement(name = "trendLines") public FusionChartTrendLines line;public FusionChart( ) { categories = newFusionChartCategories();datasets = new ArrayList<FusionChartDataset>(); line = new FusionChartTrendLines(); } } B. Data reception Data from the database query is stored in the form of a List, which is needed to read from this List to the xml element corresponding to each data , assign, and finally get a FusionCharts which can read xml format file [5]. From List to value, and assignment to previously defined individual elements is relatively easy, but the focus of this section and the difficulty is: how to package the value of the xml elements that has been got into a xml format file. Java provides an interface Marshaller, and the Marshaller class is responsible for the process of managing the serialized Java content tree back to XML data. The first parameter of the overloaded Marshaller.marshalmust be JAXB element calculated by JAXB Introspector.isElement; Otherwise, Marshaller.marshal must throw MarshalException, an instance coexistence of two kinds of mechanism for marshalling a JAXB element. One approach is to pack the instance as the JAXBElement value, and put the wrapper object as the first parameter to transmit to the Marshaller.marshal method. Another is a Java bound to the mode, you can simply use the @ XmlRootElement annotation to the class of the instance.The core code is as follows:String task_month;StringWriter writer = new StringWriter( ); StreamResult result = new StreamResult(writer); try { JAXBContext context = JAXBContext.newInstance(FusionChart.class); Marshaller marshaller = context.createMarshaller( ); marshaller.marshal(fusionChartObject, result);} catch (JAXBException e) {logger.error(e.getMessage());returnnull;}task_month=writer.toString();task_month=task_month.replace('"','\'');returntask_month;C.Foreground showingThe foreground uses the way of combing Extjs with Fusioncharts, which mainly use Extjs Ajax approach and theExt Grid properties and methods. When the user clicks the Query button, the results are first presented via Grid form; When the user Double-clicks any line of the Grid, throughExtjs Grid control "rowdbclick", it will pass the Parameter ofthis line to the back-end database, and query again with thepop-up window, and get columnar task Fusioncharts comparison chart. (See Fig. 2)The core code is as follows:var FusionChartView = function(tagId, XML){var MyChart = new FusionCharts(Content/test/ScrollCombi2D.swf","SwatchQuerymyChartId","1000", "400");MyChart.setDataXML(XML);MyChart.render("FusionChart");returnMyChart;}Grid_Result.on("rowdblclick",function(grid, rowIndex, e){var Rec = Result_store.getAt(rowIndex);var OpidParams = Rec.get("OP_ID");Params.OpId = OpidParams;Ext.Ajax.request({url : "/…/…/…",success:Ajax_Success,failure:Ajax_Failure,params : Params});var FusionChart_Windows = new Ext.Window({title : 'cylindrical graphic',width:1030,height : 500,layout : 'fit',renderTo:tagId,constrain : false,autoDestroy : true,html : '<div id="FusionChart"></div>',buttons : [{text:'closed',handler:function(){FusionChart_Windows.close();}}]});FusionChart_Windows.show();});From the code can be seen, the Fusioncharts XML is based on the database dynamic.Figure 2 Columnar chart of task comparisonIV.C ONCLUSIONFusioncharts presents practical and brilliant Flash graphics statements, but it not only provides functionality. We can also take advantage of the technology of Html Div to present multiple graphics statements in a page and we can use the Fusioncharts drilling technology to present more detailed data. In short, Fusioncharts is a good graphics-reporting tool .With the growing trend to the B / S architecture, it is playing an increasingly important role in statements field.R EFERENCES[1]FusionCharts Free Chinese Developer's Guide.[2]FusionCharts chart control Chinese version of the user manual.[3] Liu Genglong, Sui Wei aromatic. The FusionCharts chart under C / S mode design and realization [J]. Computer Knowledge and Technology. 2010.05:[4]Yang Kai. To use FusionCharts components to create dynamic web charts [J]. Microcomputer world. 2009.07:[5]Han Yibo, Song Li, CCP YUNNAN AJAX technology combines XML or JSON use [J] Computer Knowledge and Technology 2009, 5 (1) :101-103。
FusionCharts详细说明

FusionCharts详细指导1.FusionCharts简单介绍图表显示是很多开发工作所必不可少的一项功能,FusionChart是一个基于Flash的图表组件,可以用来提供数据驱动的动态图表。
通过Adobe Flash,用XML 格式的数据输入,实现数据展示的图表化,动态化以及交互性。
使用FusionChart 可以方便的生成漂亮的柱状图、曲线图等图标,显示数据直观、清晰。
(1)与AJAX/JavaScript结合:可以通过页面的热点链接或者动态的服务器端的数据更新,而无需刷新页面来刷新图形。
(2)只需要将SWF文件复制到系统中,不需要安装任何插件之类的东西(3)需要把图形格式和数据以XML的格式传送给SWF文件,即可得到你所要的图形。
(4)减轻了服务器的加载负担。
FusionCharts 是由客户端的Adobe Flash平台根据服务器婴儿湿疹怎么办端提供的SWF文件以及XML格式的数据文件生成的图形。
(5)丰富多样的图形类型,Flash动画图表、地图和仪表盘。
访问官网:/2. FusionCharts可展示的图形类型柱状图、折线图、饼图、条形图、区域图、堆叠图、冒泡图、仪表盘、滑动条、地图、ffdy电影等二FusionCharts的使用1.基本步骤(1)SWF 文件引入你想创建图形类型对应的SWF文件,如3D柱状图对应的SWF文件是Column3D.swf(2)xml格式的数据文件FusionCharts只能访问预选定义的xml格式的数据,所以首先要把你要展示的数据转换成xml格式。
如下:是简单的3D柱状图的xml数据格式。
源文件Data.xml<chart>标签里面的树形定义是和整个图形相关的一个属性,图形名称显示,X轴Y轴的名称显示等。
<set>部分是具体的数据部分,label和value分别定义了某个数据的具体值,在图形上表现为柱状图每条柱子的名字及值。
(3)嵌入图形的html文件这里用到一个公用的FusionCharts.js文件,页面中一定要引入。
FusionChart完全入门手册

FusionChart完全入门手册前言:在翻译FunsionChart V3的时候,发现官方的帮助文档汉化其实是一个很浩大的工程,里面涉及的内容非常多,基本上可以写成一本书了。
但是在一些点上,描述又不是很清楚,很多地方只是给出了描述文字,具体使用上的操作或者技巧,就更谈不上了。
结合我前一阶段进行的BI项目的情况,结合我本人手头翻译的帮助文档,产生了写一些实例帮助文档的想法,姑且叫做《FusionChart完全入门手册》吧。
一、概述:(略,如果效果好,以后补充)二、Charts类型FusionCharts总共包含了很多的系列,如●FusionCharts -- 图表系列●FusionMap -- 地图系列●FusionWidgets -- 仪表盘系列●PowerCharts -- 不好翻译,但是其中最著名的是漏斗,姑且称为漏斗系列吧我们这里介绍的是使用最多,样式也最繁杂的图标系列三、一个简单的实例一个完整的工程应该包含以下几个部分●控制文件(如FusionCharts.js,如果需要导出图形还需要FusionChartsExportComponent.js)●资源文件(swf文件,如Area2D.swf)●程序文件(如.html /.aspx /.asp/.php/.jsp等)●数据文件(根据实现方式,此部分可省略,后续进行说明)下面,先看一个简单的例子,本章节如不加说明,默认显示的是2D柱状图(别小看它,2D学会了其他的水到渠成,大家稍安勿躁)代码:代码1<!DOCTYPE html PUBLIC "-//W3C//DTD XHTML 1.0 Transitional//EN" "ht tp:///TR/xhtml1/DTD/xhtml1-transitional.dtd">2<html xmlns="/1999/xhtml">3<head>4<meta http-equiv="Content-Type" content="text/html; charset=utf-8 "/>5<title>FusionCharts v3 完全入门手册</title>6<link rel="stylesheet" href="style/Style.css" type="text/css"/>7<script language="JavaScript" src="JSClass/FusionCharts.js"></scri pt>8</head>910<body>11<table width="98%" border="0" cellspacing="0" cellpadding="3" alig n="center">12<tr>13<td valign="top" class="text" align="center"><div id="chartdi v" align="center">14 FusionCharts. </div>15<script type="text/javascript">16var chart = new FusionCharts("Charts/Column2D.swf", "Ch artId", "500", "300", "0", "0");17 chart.setDataURL("Data/Column2D.xml");18 chart.render("chartdiv");19</script></td>20</tr>2122</table>23</body>24</html>25需要说明的是,工程的目录结构如下:程序中的关键行是代码<script language="JavaScript" src="JSClass/FusionCharts.js"></script>这里指定了控制文件<script type="text/javascript">var chart = new FusionCharts("Charts/Column2D.swf", "Chart Id", "500", "300", "0", "0");chart.setDataURL("Data/Column2D.xml");chart.render("chartdiv");</script>这里指定了资源文件和数据文件并用控制文件调用资源文件和数据文件,在页面显示。
FusionCharts参数说明——3D饼图属性(Pie3D.swf)

FusionCharts参数说明——3D饼图属性(Pie3D.swf)animation 是否显示加载图表时的动画palette 内置的图表样式,共5个paletteColors 自定义图表元素颜色(为多个,如过过少会重复) showAboutMenuItem 右键是否显示"关于FusionCharts" aboutMenuItemLabel 右键关于自定义文字aboutMenuItemLink 右键关于自定义链接(FusionCharts链接格式) showZeroPies 是否显示0值的饼showPercentValues labels上是否显示百分数showPercentInToolTip tip上是否显示百分数showLabels 是否显示LabelmanageLabelOverflow 当Label溢出时进行自动管理useEllipsesWhenOverflow 当Label溢出时候使用... showValues 是否显示值labelSepChar label上的分隔符defaultAnimation 是否关闭默认动画一开始自定义动画clickURL 整个图表的点击的url标题caption 主标题subCaption 副标题图表的装饰showBorder 显示边框borderColor 边框颜色borderThickness 边框粗细borderAlpha 边框透明度bgColor 背景颜色bgAlpha 背景透明度bgRatio 背景比例bgAngle 背景角度bgSWF 背景flash地址可以是图片地址bgSWFAlpha 背景flash的透明度showVLineLabelBorderlogoURL log地址logoPosition log位置logoAlpha log透明度logoScale log比例logoLink log链接元素的装饰showPlotBorder 每一片的边框plotBorderColor 每一片的边框颜色plotBorderThickness 每一片的边框粗细plotBorderAlpha 每一片的边框透明度plotFillAlpha 每一片的边框填充透明度use3DLighting 3d光效果饼/圈专有属性slicingDistance 当点击图表的时候这一片饼离开中心点的距离pieRadius 饼的外半径startingAngle 起始角度enableRotation 开启旋转pieInnerFaceAlpha 图表里面的透明度pieOuterFaceAlpha 图表外面的透明度pieYScale 饼立起来的角度,角度越大看到的面积越大. pieSliceDepth 图表的厚度标明线& Labels (label和图表元素之间的线)enableSmartLabels 是否开启标明显skipOverlapLabels 跳过重复标签isSmartLineSlanted 标明线方式(倾斜或直)smartLineColor 标明线颜色smartLineThickness 标明线粗细smartLineAlpha 标明线透明度labelDistancesmartLabelClearance 标明线长度数字formatNumber 逗号来分隔数字(千位,百万位),默认为1(True);若取0,则不加分隔符formatNumberScale 是否格式化数字,默认为1(True),自动的给你的数字加上K(千)或M(百万);若取0,则不加K或MdefaultNumberScale 默认数量级numberScaleUnitnumberScaleValuenumberPrefix 数字前缀numberSuffix 数字后缀decimalSeparator 小数分隔符thousandSeparator 千位分割符inDecimalSeparator 在十进位分割符inThousandSeparator 在千位分割符decimals 小数forceDecimals 是否用0填充以至满足要保留的小数位字体baseFont 基本字体baseFontSize 基本字号baseFontColor 基本字颜色Tool-tipshowT oolTip 是否显示提示toolTipBgColor 提示背景色toolTipBorderColor 提示边框色toolTipSepChar 提示分隔符showToolTipShadow 是否显示提示Tool-tip阴影边距captionPadding 标题内边距chartLeftMargin 图表左外边距chartRightMargin 图表右外边距chartTopMargin 图表上外边距chartBottomMargin 图表下外边距set元素borderColor 边框颜色isSliced 被切开label [label]value 值color 颜色link 链接(FusionCharts链接格式)toolText 自定义提示图例(3.2版本以上)showLegend 是否显示图例legendPosition 图例位置legendCaption 图例说明legendIconScale 图例图标0-5(图例图标大小)legendBgColor 图例背景色legendBgAlpha 图例透明度legendBorderColor 图例边框颜色legendBorderThickness 图例边框粗细legendBorderAlpha 图例边框透明度legendShadow 图例阴影legendAllowDrag 是否允许拖动图例legendScrollBgColor 图例滚动条背景色legendScrollBarColor 图例滚动条颜色legendScrollBtnColor 图例滚动条按钮颜reverseLegend 反转图例interactiveLegend 图例交互(是否可点击)legendNumColumns 设置图例的列数(如果设置不当会自动设置,如果legendPosition设置为右面该属性自动设置为1)minimiseWrappingInLegend。
Fusioncharts XT V3.2.2最新版教程

Fusioncharts XT V3.2.2最新版教程目录一、Fusioncharts V3.2.2产品简介 (2)使用Fusioncharts的优势: (2)二、系统要求 (5)三、安装FusionCharts (5)1、在网页应用程序安装FusionCharts (5)2、你本地机器安装FusionCharts创建通用图表 (6)四、下载包内容 (8)1、SWF文件(准备使用图表) (8)2、FusionCharts JavaScript Classes (9)3、示例代码 (9)服务器导出操作(Image/PDF保存脚本) (10)4、工具 (10)5、Chart XSD schema (10)6、图表源代码 (10)7、图表示例 (11)五、升级FusionCharts XT Evaluation (11)六、FusionCharts v3.x.y版本升级到XT(v3.2.2)版本 (12)在iPad/iPhone上运行你的图表 (12)在设备上自动启用那些禁用、未安装或不支持Flash Player的JavaScript图表 (13)仅从Flash呈现图表转换到JavaScript呈现 (13)使用FusionCharts jQuery插件呈现图表 (14)使用新的JavaScript事件 (19)使用新的JavaScript函数 (21)利用动态(%based)调整大小 (22)一、Fusioncharts V3.2.2产品简介FusionCharts V3.2.2帮助您的网站和企业应用程序创建交互式的图表。
它是业界领先的企业级的图表组件,它的功能可以无缝地在PC机,Macs,iPad,iPhone和大多数其他移动设备上实现。
Fusioncharts惊人的外观,生动的动画,强大的报表功能,让它在全球内得到认可。
有110多个国家和地区的19,000客户、,400,000用户添加“wow”到他们的应用程序。
FusionCharts详细中文使用手册

FusionCharts使用说明一、FusionCharts简介FusionCharts是InfoSoft Global的一个产品,InfoSoft Global 公司是专业的Flash图形方案提供商,他们还有几款其他的,基于Flash技术的产品,都非常的漂亮。
FusionCharts free 是一个跨平台,跨浏览器的flash图表组件解决方案,能够被, ASP, PHP, JSP, ColdFusion, Ruby on Rails, 简单HTML 页面甚至PPT调用。
你不需要知道任何关于flash编程的知识,你只需要知道你所用的编程语言就可以了。
旗下共有如下产品:FusionCharts V3:主打产品,包含44种常用的报表图形;FusionCharts FREE:免费,包含22中常用的报表图形;FusionWidgets V3:小部件,包括仪表盘,刻度尺等;FusionMaps V3:地图;PowerCharts V3:预览版,提供更强大图形展示功能,但可能存在一定的缺陷;二、FusionCharts商用性说明据官方网站介绍,目前FusionCharts在全球110个国家中有超过12000个客户以及250000用户,其中不乏微软、谷歌、IBM等知名IT厂商。
三、FusionCharts使用说明安装:在当前工程中新建一个文件夹,命名为:FusionCharts,压缩包中的swf文件、js文件全部放入该文件夹,安装完成(以上为官方介绍的方法,实际使用中,可以将js文件放入js文件夹,swf文件单独建一个swf的文件夹即可)。
原理:官方提供了44中不同的图形种类,每种图形以swf文件的形式提供。
另外官方提供了一组js脚本文件,通过这些脚本文件可以将按照规定格式的xml数据传递给相应的swf文件,从而展示不同的图表。
具体xml格式见fusioncharts XML api。
使用:使用FusionCharts进行绘制报表最重要的环节就是如何把XML数据传送给FusionCharts。
Fusioncharts3.1教程

Fusioncharts教程Fusioncharts 报表工具 (2)1.Fusioncharts 介绍 (2)2. 数据接口XML: (2)3. 使用前的准备工作(基于java的Web工程为例): (2)4. 创建第一个Chart: (2)5. FusionCharts提供多样式图: (4)6.FusionCharts的高级特性: (8)7. FusionCharts提供了很多设置chart样式的属性: (10)8.动态XML生成的chart: (10)9.FusionCharts的优缺点 (10)10 购买FusionCharts注意的事项: (10)Fusioncharts 报表工具1.Fusioncharts 介绍:Fusioncharts是一个基于Flash的图表组件,可以用来提供数据驱动的动态图标,fusioncharts可用于任何网页脚本语言如, HTML格式,JSP技术等等。
提供交互式和强大的动态图标,fusioncharts充分利用流体美丽的Flash为模板,使用XML作为其数据接口,创造紧凑,互动和真正的动态图表。
2. 数据接口XML:Fusioncharts是以XML为数据接口而成图表。
提供XML两种形式:直接以XML文件提供数据。
基于数据库数据动态生成XML(此方法在后面详细介绍)。
3. 使用前的准备工作(基于java的Web工程为例):➢拷贝所有的flash文件(所有的图标文件在下载包中Charts 包中)到工程WebRoot目录下,这些flash文件作为生成报表的模板图标。
➢拷贝FusionCharts.jsp(下载包Includes包中)文件到WebRoot下(可以将其放在WebRoot下的某个文件夹中),这个文件包含将生成的flash图标嵌入到jsp或者HTML文件中。
➢拷贝FusionCharts.js(下载包JSCLASS包中),这个文件提供了createChartHTML 函数是我们轻松的创建图表。
FusionCharts_free_使用手册

FusionCharts free 使用手册一、概述FusionCharts是InfoSoft Global公司的一个产品,InfoSoft Global 公司是专业的Flash图形方案提供商,他们还有几款其他的,基于Flash技术的产品,都非常的漂亮。
FusionCharts Free则是FusionCharts提供的一个免费版本,虽然免费,功能依然强大,图形类型依然丰富。
不得不感叹技术发展的真快,99年的时候,flash刚刚在互联网上流行,那时还只是一个简单的动画软件,编程能力有限。
但现在flash几乎无所不能了,图形报表则是它大展手脚的一个领域。
FusionCharts free 是一个跨平台,跨浏览器的flash图表组件解决方案,能够被 , ASP, PHP, JSP, ColdFusion, Ruby on Rails, 简单 HTML 页面甚至PPT调用。
你不需要知道任何关于flash编程的知识,你只需要知道你所用的编程语言就可以了。
FusionCharts free 目前最新版本是v2.1,主要做了以下改动:∙增加了使用jsp和Ruby on Rails来集成FusionCharts的代码和文档。
∙F usionCharts DOM更加容易地把图表加载到你的页面上。
∙修改了.Net的使用代码和文档。
∙增加了新的PHP API ,并修复了一些BUG。
∙修改了FusionCharts.js ,以便可以支持双引号。
(那就是说以前不支持?)∙增加了在FusionCharts使用UTF-8编码的示例。
FusionCharts到底能做什么呢?下面就给大家展示一下。
3D/2D 柱形图图片1图片2 曲线图图片3图片43D/2D饼图、环图图片5图片6 区域图图片7图片8 堆栈图图片9图片10联合图图片11图片12 蜡烛图图片13图片14 漏斗图图片15图片16甘特图图片17图片18看了这么多漂亮的图形以后,是不是有点感到兴奋呢?如果把这么漂亮专业的图形放到用户面前,相信他们也会满意的。
FusionCharts图表控件中文版超详细整理使用手册资料

FusionCharts图表控件中文版使用手册附注fusionCharts详细属性一、构成fusionCharts的三要素: (3)swf、data.xml、承载图表的载体 (3)二、对于我们还未使用的功能: (3)图表转换成图片或者pdf导出、热点链接 (3)三、重点 (3)fusionCharts的基本知识部分: (4)一、SWF 动画文件 (4)二、XML数据文件 (4)三、HTML(当然也可以使用JSP)嵌入charts文件 (5)四、结合javascript 的应用: (5)五、热点链接:link=’ ’ (5)六、图表数据导出 (6)七、图表导出为pdf或者图片(JPEG和PNG)形式 (6)八、中文编码解决方法: (7)附注fusionCharts详细属性: (7)1、边框及整个背景的属性: (7)2、图表背景属性: (8)3、外部引入LOGO: (8)4、图表名称和轴属性: (9)5、data plot属性 (9)6、数据横纵轴属性 (9)7、图表上的数据显示 (10)8、图表调色板 (10)9、横轴坐标最大值、最小值属性 (10)10、图表内部的div线相关属性 (10)11、图表内部垂直div线的相关属性 (10)12、Zero plan相关属性 (11)13、Anchors相关属性(针对线图) (11)14、tool-tip 属性 (11)15、padding属性 (11)16、数据格式相关属性 (12)17、legend相关属性 (12)18、3D图表属性 (12)19、自定义菜单属性 (13)20、趋势线: (13)21、Styles属性:(eg)定义自定义效果属性,然后在一个对象上进行使用。
(13)按照编程xml构造结构分:(只列举出了几种主要属性,主要用于xmlBuiler).. 16一、构成fusionCharts的三要素:swf、data.xml、承载图表的载体1、Swf:按照你所设计的图表类型加载相应的.swf文件到你的工程即可(eg:若你想生成一张二维柱状图,那么在你的工程里就必须包含Column2D.swf文件)2、Data.xml:方法一:直接用data.jsp文件替代data.xml文件,写法格式同xml。
FusionCharts如何自定义图表导出菜单或界面

FusionCharts的导出组件界面有两种模式:Compact Mode: 用于保存单张图片,每一个单独的导出组件实例都代表单独的图表。
在这种模式下,只有一个按钮和标题是可见的。
Full Mode: 保存多个图表,无论是单独或作为一个单独的文件。
在这种模式下,用户可以选择需要保存的图表以及保存的格式。
在两种模式下,你可以自定义导出组件的颜色、字体和标题。
在进入属性之前,先快速看一下导出组件的各种元素。
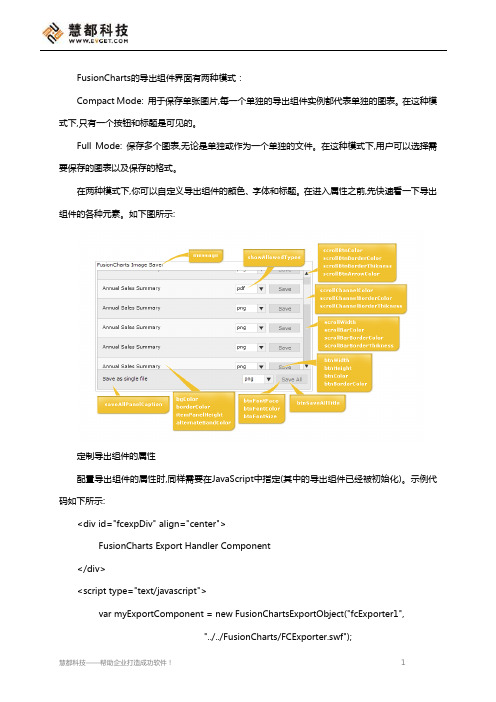
如下图所示:定制导出组件的属性配置导出组件的属性时,同样需要在JavaScript中指定(其中的导出组件已经被初始化)。
示例代码如下所示:<div id="fcexpDiv" align="center">FusionCharts Export Handler Component</div><script type="text/javascript">var myExportComponent = new FusionChartsExportObject("fcExporter1","../../FusionCharts/FCExporter.swf");//Customize the component properties//Width and heightponentAttributes.width = '400'; ponentAttributes.height = '60';//Background colorponentAttributes.bgColor = 'ffffdd';//Border propertiesponentAttributes.borderThickness = '2'; ponentAttributes.borderColor = '0372AB';//Font propertiesponentAttributes.fontFace = 'Arial'; ponentAttributes.fontColor = '0372AB'; ponentAttributes.fontSize = '12';//Message - caption of exportcomponent ponentAttributes.showMessage = '1'; ponentAttributes.message = 'Export thechart first, and then click on this button to save';//Button visual configurationponentAttributes.btnWidth = '200'; ponentAttributes.btnHeight= '25'; ponentAttributes.btnColor = 'E1f5ff'; ponentAttributes.btnBorderColor = '0372AB';//Button font propertiesponentAttributes.btnFontFace = 'Verdana'; ponentAttributes.btnFontColor = '0372AB';ponentAttributes.btnFontSize = '15';//Title of buttonponentAttributes.btnsavetitle = 'Save the chart' ponentAttributes.btndisabledtitle = 'Waiting for export'; //Render the exporter SWF in our DIVfcexpDiv myExportComponent.Render("fcexpDiv");</script>经过上面的操作之后,导出组件的各种参数就已经完成指定了。
FusionCharts入门讲义

可通过Styles 设置丰富的效果
<styles> <definition> <style name='myShadow' type='shadow' angle='45' distance='3'/> • <style name='myBeval' type='beval' distance='15' angle='45' shadowColor='000000' strength='5'/> • <style name='myLabelsFont' type='font' font='Arial' size='14' color='666666' bold='1' underline='1'/> • <style name = ‘’ type=‘grow’/> • <style name=‘’ type=‘blur’/> • <style name=‘’ type=‘animation’/> </definition> <application> <apply toObject='DATAPLOT' styles='myBevel, myShadow, myBeval' /> </application>
批量导出为图片
• <input type='button' onClick="javascript:initiateExport();" value="batch export" /> • <div id="fcexpDiv" align="center">FusionCharts Export Handler Component</div> • <script type="text/javascript"> • var myExportComponent = new FusionChartsExportObject("fcBatchExporte", "../flash/FCExporter.swf"); • myExportComponent.sourceCharts = ['myChartId','myGridId']; • ponentAttributes.fullMode='1'; • //Set saving mode as both. This allows users to download individual charts/ as well as download all charts as a single file. • ponentAttributes.saveMode='both'; • myExportComponent.render("fcexpDiv"); • </script>
FusionCharts 中文文档

1导出为PDF或图像>“服务器端出口榜单>下载导出的选举作为输出当返回导出的输出下载到浏览器(图像/ PDF格式),整个流程看起来下:在您的Web页的图表中读取XML数据,并呈现。
此XML数据包含的参数,帮助您配置的出口参数。
当用户在图表上点击右键并选择菜单项的出口图表,图表中的数据发送到服务器(其中FusionCharts的出口采取行动来处理程序)。
服务器端处理程序接受来自图表导出此位图数据,以及其他参数,生成图像/ PDF和返回回浏览器。
让我们快速了解如何配置整个安装。
设置服务器端的出口处理首先,你需要复制粘贴所需的服务器端处理程序导出下载包“> ExportHandlers文件夹到您的服务器。
对于这个例子,我们的PHP 文件复制到/FusionCharts/ExportHandlers/PHP 。
确保你已经复制了相应的文件夹的所有文件。
这就完成了例行的出口下载服务器端设置。
下一步,我们将配置参数的XML的出口。
我们的出口在几种语言处理一些如其他图书馆取决于PHP的GD和GZip压缩处理程序需要在服务器上安装。
同样,Ruby on Rails的需要RMagick和zlib加入到你的服务器上。
请确保你已经正确安装这些依赖。
出口参数添加到XML如果 exportEnabled 设置为0,图表不能启动导出过程中,不论扳机。
接下来,您需要设置出口处理程序,它是处理程序的路径到服务器端的出口。
对于我们的例子中,我们已经设置为路径 /FusionCharts/ExportHandlers/PHP -所以现在看起来的XML: <图exportEnabled = '1'exportHandler ='http://www。
/ FusionCharts的/ ExportHandlers / PHP的'...>现在,既然我们打算使用服务器端的出口,我们设置 <图表... exportAtClient = '0'...>最后,使用服务器端出口处理程序中,我们打算有导出文件下载到用户的机器上。
fusioncharts用法实例

fusioncharts⽤法实例⽀持xml格式和json格式的数据。
⽤法很简单。
1.需要引⼊FusionCharts.js.2.html中定义个id="chart"的div<div id="chart"></div>3.js代码调⽤即可(⼀)xml格式。
var dataXml = "<graph caption='每⽉销售额柱形图' xAxisName='⽉份' yAxisName='Units' showNames='1' decimalPrecision='0' formatNumberScale='0'><set name='⼀⽉' value='462' color='AFD8F8' /><set name='⼆⽉' value='857' color='F6BD0F' /><set name='三⽉' value='671' color='8BBA00' /><set name='四⽉' value='494' color='FF8E46' /><set name='五⽉' value='761' color='008E8E' /><setname='六⽉' value='960' color='D64646' /><set name='七⽉' value='629' color='8E468E' /><set name='⼋⽉' value='622' color='588526' /> <set name='九⽉' value='376' color='B3AA00' /><set name='⼗⽉' value='494' color='008ED6' /><set name='⼗⼀⽉' value='761'color='9D080D' /><set name='⼗⼆⽉' value='960' color='A186BE' /></graph>";var myChart = new FusionCharts("${base}/thirdparty/FusionCharts/ChartsV3/Charts/Pie3D.swf", "myChartId_00", "500", "400");//参数分别为【需要使⽤的swf样式】,【chart的id(同⼀个页⾯有多个chart避免重复)】,【width】,【height】//myChart.setJSONData(${jsondata!});myChart.setDataURL(dataXml);myChart.render("chart");(⼆)json1. //使⽤json数据2. var MSLine = new FusionCharts("flex/fusioncharts/MSLine.swf", "MSLineID", "460", "350", "0", "1"); MSLine.setJSONData({3. "chart":{4. "caption":"Business Results 2005 v 2006",5. "xaxisname":"Month",6. "yaxisname":"Revenue",7. "showvalues":"0",8. "numberprefix":"$" },9. "categories":[{10. "category":[11. { "label":"Jan" },12. { "label":"Feb" },13. { "label":"Mar" },14. { "label":"Apr" },15. { "label":"May" },16. { "label":"Jun" },17. { "label":"Jul" },18. { "label":"Aug" },19. { "label":"Sep" },20. { "label":"Oct" },21. { "label":"Nov" },22. { "label":"Dec" }]23. }24. ],25. "dataset":[26. {27. "seriesname":"2006",28. "data":[29. { "value":"27400" },30. { "value":"29800" },31. { "value":"25800" },32. { "value":"26800" },33. { "value":"29600" },34. { "value":"32600" },35. { "value":"31800" },36. { "value":"36700" },37. { "value":"29700" },38. { "value":"31900" },39. { "value":"34800" },40. { "value":"24800" } ] },41. { "seriesname":"2007",42. "data":[43. { "value":"27900" },44. { "value":"29800" },45. { "value":"15800" },46. { "value":"24800" },47. { "value":"19600" },48. { "value":"32600" },49. { "value":"35800" },50. { "value":"31700" },51. { "value":"39700" },52. { "value":"51900" },53. { "value":"14800" },54. { "value":"20800" } ] },55. { "seriesname":"2005",56. "data":[{ "value":"10000" },57. { "value":"11500" },58. { "value":"12500" },59. { "value":"15000" },60. { "value":"11000" },61. { "value":"9800" },62. { "value":"11800" },63. { "value":"19700" },64. { "value":"21700" },65. { "value":"21900" },66. { "value":"22900" },67. { "value":"20800" } ] } ],68. "trendlines":{69. "line":[{ "startvalue":"26000",70. "color":"91C728",71. "displayvalue":"Target",72. "showontop":"1"73. }]74. },75. "styles":[{76. "definition":[{77. "style":[{ "name":"CanvasAnim",78. "type":"animation",79. "param":"_xScale",80. "start":"0",81. "duration":"1"82. }]83. }],84. "application":[{85. "apply":[{ "toobject":"Canvas",86. "styles":"CanvasAnim"87. }]88. }]89. }]90. });//如果java代码⽣成,可以理解为整个是map,chart是纯map格式的,data是map中包含了list<Map>。
FushionCharts使用文档

Fusioncharts使用文档FusionCharts是一个Flash的图表组件,它可以用来制作数据动画图表,目前已经封装实现的图形有:线路图,柱状图,饼状图,半圆盘,蜡烛图。
实现方法大致概括为:1)导入相关文件2)确定你需要实现的图形3)在页面写JS方法进去后台处理业务4)根据你需要实现的图形,在后台组装特定格式的数据返回到页面进行渲染。
不同图形有相应的封装方法,实现例子已在下文中给出,以下是实现效果、相关的属性与方法:1)无图例的线路图形2)有图例的线路图形3)无图例的2D柱状图4)无图例的3D柱状图5)有图例的2D柱状图6)有图例的3D柱状图7)饼状图8)温度计9)半圆盘10)蜡烛图1、已实践例子(有图例的曲线图):1) 首先把相关文件拷贝进项目中(js包下的fuctioncharts文件夹为图表模型与JS文件,JAVA 包下的fuctioncharts文件夹为相关模块,拷贝请注意路径,JAVA包下的文件夹建议放在平台biz包下)2) 在页面中引入两个js文件(路径根据项目而定):<script type="text/javascript"src="${pageContext.request.contextPath}/resources/scripts/fusionchart s/FusionCharts.js"></script><script type="text/javascript"src="${pageContext.request.contextPath}/resources/scripts/fusionch arts/fusioncharts_1.0.js"></script>3) 在方法中调用ajax获取数据后传回页面,只需要调用封装好的方法即可进行图标展示:function youSePuKLine(start,end){var deviceid=${deviceid};$.ajax({type:"POST",url:"<c:url value='/ajax'/>",data:{service:".monitorPage.service.MonitorPageService", method: "getYouSePuKLineView", params:[deviceid,start,end]},success:function(data){//有图例的曲线图,具体方法可以参考fusioncharts_1.0.jsFusionChartForMSLine("div的ID",data.JSONDATA,"100%","100%");},error:function(){},dataType:"json"});}4) service方法后台的数据组装返回的格式可以是json格式的也可以是xml格式的,现在封装使用json格式例子如下:public DataRecord getYouSePuKLineView(String deviceid,Stringstart,String end) {DataRecord dr=new DataRecord();Map<String,Object> map=new HashMap<String,Object>();map.put("deviceid", deviceid);map.put("start", start);map.put("end", end);List<DataRecord>dataList=this.getDao().queryForDataSet(".monitorpage.getYo uSePuKLine", map).getResults();FusionChartUtil c=new FusionChartUtil();Chart chart=new Chart();chart.setLegendPosition("RIGHT");String jsonStr= c.fusionChart(chart,dataList, null);//有图例dr.put("JSONDATA",jsonStr);return dr;}5) SQL查询特定格式的dataList:(特定格式为:object_type作为图例X轴显示标签,其他为Y 轴显示线条)<select id="getYouSePuKLine"parameterType="map"resultType="datarecord">select XXX as object_type ,XXX 一般,XXX 重大,XXX 紧急 from 表名</select>2、关键类Chart.java可设置图形的相关属性/**Y轴名称**/private String yaxisname="";private String xaxisname="";/**标题**/private String caption="";private String numberprefix="";//数字前缀private String numberSuffix="";//数字后缀/**设置透明度的几个参数**/private String canvasBgAlpha="0";private String bgAlpha="0";private String borderThickness="0";private String borderAlpha="0";private String formatNumberScale="0";//网格透明度private String alternateHGridAlpha="0";private String alternateVGridAlpha;//设置字体private String baseFont;private String baseFontColor;private String baseFontSize="12";private String outCnvBaseFontSize="12";//1-72画板外字体的大小private String outCnvBaseFontColor;private String outCnvBaseFont;private String labelStep="0";private String showCanvasBase="true";//字体是否倾斜显示private String labelDisplay=""; //X轴标签对齐方式为旋转,ROTATE旋转,空不旋转。
fusionchart的参数详细说明

FusionChart的参数详细说明(2)<chart caption='各地市对比图' xAxisName='' yAxisName='' outCnvBaseFontColor='#000000' showValues='0' decimals='3' formatNumberScale='0' baseFontSize='13' bgAlpha='40' bgColor='#F3EED1' legendPadding='0' slantLabels='1' showLabels='1' chartLeftMargin='1' chartRightMargin='1' chartTopMargin='1' chartBottomMargin='1' canvasBgColor='#F9F9F9' canvasBaseColor='#F9F9F9' canvasBaseDepth='3' showCanvasBg='1' showCanvasBase='1'><set lable='...'value='...'/><set lable='...' value='...'/><setlable='...' value='...'/><set lable='...' value='...'/></chart>FusionCharts 的XML标签属性有一下四种数据类型* Boolean - 布尔类型,只能为1或者0。
FusionCharts使用说明

FusionCharts使用说明FusionCharts使用说明1、下载:/demo/fusionchartsfree/2、使用:a)新建项目‘FusionCharts_Demo’在项目中新建文件夹‘sse’,‘Data’,’FusionCharts’,’js’b)将下载的FusionCharts插件的charts文件夹中的SWF文件(共22个)复制到FusionCharts’文件夹中,将‘FusionCharts.js’和‘highcharts.js’拷到js文件夹中,将xml文件拷到Data文件夹中,也可以不适用Xml的数据,可自己在后台拼接Xml格式,引入FusionCharts.dll3、FusionCharts 和HighCharts的比较a)FusionCharts1)、FusionCharts 是一个跨平台,跨浏览器的flash图表组件解决方案,能够被, ASP, PHP, JSP, ColdFusion, Ruby on Rails, 简单HTML 页面甚至PPT调用。
2)、FusionCharts是通过xml文件传送数据,对xml的格式要求比较高,也就是错一个节点,可能图像就显示不出来。
3)、FusionCharts从3.2版本以后也开始支持json数据格式,之前只支持xml。
4)、Fusioncharts的优点:图表渲染速度快,外观及交互方式很炫,可以导出为图形,允许将其嵌入到报告中。
5)、Fusioncharts的缺点:使用起来虽然简单,只要调用其API即可,但是不够灵活,例如不能修改其图表模板,不能实现图表的灵活定制及参数修改。
b)Highcharts1)、Highcharts是一个制作图表的纯Javascript类库。
2)、兼容当今所有浏览器,包括IE,火狐,IPhone等。
3)、不管是PHP、还是Java都可以使用,它只需要三个文件:一个是Highcharts的核心文件highcharts.js,还有a canvas emulator for IE和Jquery类库或者MooTools类库。
Flash图表控件FusionCharts如何定制图表中的趋势线和趋势区

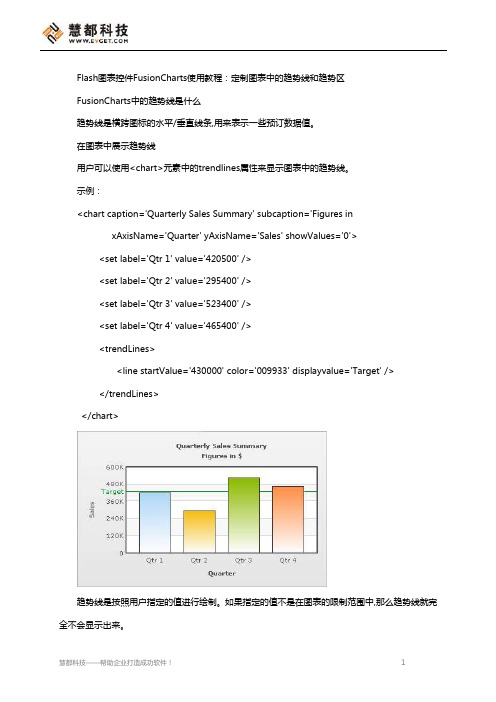
Flash图表控件FusionCharts使用教程:定制图表中的趋势线和趋势区FusionCharts中的趋势线是什么趋势线是横跨图标的水平/垂直线条,用来表示一些预订数据值。
在图表中展示趋势线用户可以使用<chart>元素中的trendlines属性来显示图表中的趋势线。
示例:<chart caption='Quarterly Sales Summary' subcaption='Figures inxAxisName='Quarter' yAxisName='Sales' showValues='0'><set label='Qtr 1' value='420500' /><set label='Qtr 2' value='295400' /><set label='Qtr 3' value='523400' /><set label='Qtr 4' value='465400' /><trendLines><line startValue='430000' color='009933' displayvalue='Target' /> </trendLines></chart>趋势线是按照用户指定的值进行绘制。
如果指定的值不是在图表的限制范围中,那么趋势线就完全不会显示出来。
显示图表中趋势线的文本当用户使用toolText属性的时候,趋势线也可以显示文本信息。
用户可以根据下列数据为趋势线指定一个自定义工具文本:<chart caption='Quarterly Sales Summary' subcaption='Figures inxAxisName='Quarter' yAxisName='Sales' showValues='0'><set label='Qtr 1' value='420500' /><set label='Qtr 2' value='295400' /><set label='Qtr 3' value='523400' /><set label='Qtr 4' value='465400' /><trendLines><line startValue='430000' color='009933' displayvalue='Target'toolText='This trend was calculated last year'/></trendLines></chart>什么是FusionCharts的趋势区趋势区域类似于趋势线,只是标出的是一个区域整个区而不是一条线。
- 1、下载文档前请自行甄别文档内容的完整性,平台不提供额外的编辑、内容补充、找答案等附加服务。
- 2、"仅部分预览"的文档,不可在线预览部分如存在完整性等问题,可反馈申请退款(可完整预览的文档不适用该条件!)。
- 3、如文档侵犯您的权益,请联系客服反馈,我们会尽快为您处理(人工客服工作时间:9:00-18:30)。
FusionCharts free 使用手册
一、概述
FusionCharts是InfoSoft Global公司的一个产品,InfoSoft Global 公司是专业的Flash图形方案提供商,他们还有几款其他的,基于Flash技术的产品,都非常的漂亮。
FusionCharts Free则是FusionCharts提供的一个免费版本,虽然免费,功能依然强大,图形类型依然丰富。
不得不感叹技术发展的真快,99年的时候,flash刚刚在互联网上流行,那时还只是一个简单的动画软件,编程能力有限。
但现在flash几乎无所不能了,图形报表则是它大展手脚的一个领域。
FusionCharts free 是一个跨平台,跨浏览器的flash图表组件解决方案,能够被 , ASP, PHP, JSP, ColdFusion, Ruby on Rails, 简单 HTML 页面甚至PPT调用。
你不需要知道任何关于flash编程的知识,你只需要知道你所用的编程语言就可以了。
FusionCharts free 目前最新版本是v2.1,主要做了以下改动:
∙增加了使用jsp和Ruby on Rails来集成FusionCharts的代码和文档。
∙F usionCharts DOM更加容易地把图表加载到你的页面上。
∙修改了.Net的使用代码和文档。
∙增加了新的PHP API ,并修复了一些BUG。
∙修改了FusionCharts.js ,以便可以支持双引号。
(那就是说以前不支持?)
∙增加了在FusionCharts使用UTF-8编码的示例。
FusionCharts到底能做什么呢?下面就给大家展示一下。
3D/2D 柱形图
精选word范本!
图片1 精选word范本!
图片2 曲线图
精选word范本!
图片3 精选word范本!
图片4 3D/2D饼图、环图
精选word范本!
图片5 精选word范本!。
