1 AN AUTOMOD MODEL OF BARGE
Automod中文教程1_Basic(精)

运行窗口的控制
鼠标:
– 左键:主键,可以点选、拖选 – 右键:辅助功能
View Control
– 在左下的快捷工具栏上
跟我做:滚动、视图、选项的作用
7
Applied Materials Confidential
View Control 的快捷键
快捷键
– – – – – – – – s /<Shift>S: 放大缩小 x / <Shift>X:围绕 x-轴 旋转 y / <Shift>Y:围绕 y-轴旋转 z / <Shift>Z :围绕 z-轴旋转 w :turns solids 开关 v :顶视图 top view <control/shift>u :前视图 previous view h:帮助 help
11
Applied Materials Confidential
实体(Loads)的概念
Loads 是模型中的活动单位; AutoMod 是靠实体驱动的,即是“实体”来完成各个进程的逻辑的; 实体所占据的物理上的空间被称为“域territories” Loads在模型中将会有如下行为:
注意:文件命名不能有空格.
modelname.arc目录:
– ASCII 文件; – “Export”的时候生成; – systemname.asy:模型的系统描述文 件 – model.amo:模型文件列表
保存拷贝模型只要 arc目录
3
Applied Materials Confidential
模型与系统(Models & Systems) 进程(Process)的概念 实体(Loads) 和 实体类型(Load Types) 域( Territories )的概念 使用BEdit编写逻辑定义文件 语法Syntax 运行控制
AUTOMODE 课件

2011-9-8
物流仿真
2
1 AutoMod 操作
启动 AutoMod AutoMod的文件结构 导入模型 编译模型 运行窗口控制:鼠标和 View Control 运行 AutoMod模型 模型中的实体
2011-9-8
物流仿真
3
1.1 导入模型Import model
菜单: 菜单:Model Open; AutoMod安装目录\demos\gswa\examp02-1\ 正确结果: 显示loading信息 importing or reading the different systems creating entities and paths 显示模型窗口编辑窗口
2011-9-8
物流仿真
30
建立进程 步骤1:模型编辑处于Process系统窗口; 步骤2:Process工具条,Processes New; 步骤3:键入要新建的进程名称,如Pstart ;
2011-9-8
物流仿真
31
建立Load 步骤1:模型编辑处于Process系统窗口; 步骤2:Process工具条,Loads New; 步骤3:键入要新建的Load名称,如L_start; 步骤4:设置其他属性,如产生属性,起始Pstart,每5 分钟产生1个; 步骤5:保存;
2011-9-8 物流仿真 29
作业1
平均间隔5分钟(按照指数分布exponentially distributed ),有1辆卡车到达; 卡车将等待7-13分钟(按照distributed uniformly分布 ); 向消息窗口输出等待的信息; 等待结束后,卡车离开系统。 (建议加上两个Queues,便于看效果)
2011-9-8
物流仿真
第一章模拟与Automod模拟软体

AutoMod
Step3 資料收集
(2ห้องสมุดไป่ตู้2)
輸入的資料包含:
歷史資料(historical data)
模擬政策(policies) 隨機程序與資料(random) 常數(constant)
資料的定義更要明確,譬如停機時間是否包括設備修理時
間、而設備修理時間是否也包括等待物料及修理人員的時
使用統計分析去獲得模式正確的結果。
AutoMod
Step10 模式額外的執行
根據模擬完成後的分析,決定是否需要增加額外
的運轉測試,而這些額外的測試可能必須再重新
設計模式的某一部份,並回步驟八的實驗設計階
段,重新定義實驗設計的內容。
AutoMod
Step11 書面報告整理
將結果以書面方式紀錄下來,可在未來參酌或修改模式時,
AutoMod
Step12 模式結果的執行
最後執行階段的成功端賴前述十一項步驟的實施
的程度,若最終使用者在模式建立階段能參與並
了解模式本身的特性與結果,則模式執行階段的
構的模式,是否能真實描繪出實際系統的特性與
彼此之間行為。確認模式的專業人員必須評估模
擬的程序 (procedures) 與語法 (algorithms) ,是否能
適當表達出模式定義範圍內所模擬的系統的行為。
AutoMod
Step8 實驗設計
經過模式驗證與確認的步驟後,我們即可設計適
當的實驗程序以分析系統的行為與結果。其中系
AutoMod
第一節 模擬基本概念
(5/5)
AutoMod 雖然建模的過程是以圖示的方式來建構,
automod教学大纲
automod教学大纲自动化模块(AutoMod)是一种强大的工具,用于模拟和优化物流和生产系统。
它可以帮助企业提高生产效率,降低成本,并提供精确的数据分析。
本文将介绍AutoMod的教学大纲,以帮助初学者快速上手并掌握这一工具。
1. AutoMod简介- AutoMod是由Automated Systems, Inc.开发的一款模拟软件,用于模拟和优化物流和生产系统。
- 它可以模拟各种工业环境,包括制造、仓储、物流等,并提供详细的数据分析和可视化结果。
2. AutoMod的基本操作- 安装和启动AutoMod软件。
- 创建新模型或导入现有模型。
- 添加和配置设备、工作站、运输工具等。
- 设定物料流动和作业流程。
- 运行模拟并分析结果。
3. AutoMod的高级功能- 使用AutoMod的建模语言(ModL)进行自定义建模。
- 添加逻辑和规则,如优先级、条件、约束等。
- 使用统计分析工具进行数据分析和优化。
- 进行实时仿真和虚拟现实(VR)交互。
4. AutoMod的应用领域- 制造业:优化生产线布局、提高生产效率、降低生产成本。
- 仓储与物流:优化仓库布局、提高货物处理效率、减少运输时间。
- 物料处理:优化物料流动、减少库存、提高物料处理效率。
5. AutoMod的案例研究- 案例一:某制造企业使用AutoMod优化生产线布局,减少工人等待时间,提高生产效率20%。
- 案例二:某仓储企业使用AutoMod优化仓库布局,减少货物处理时间,降低运输成本10%。
- 案例三:某物料处理企业使用AutoMod优化物料流动,减少库存,提高物料处理效率30%。
6. AutoMod的学习资源- 官方网站提供的教程和文档。
- 在线论坛和社区,与其他用户交流和分享经验。
- 培训课程和认证考试,提供专业的培训和认证。
7. AutoMod的未来发展- 自动化技术的不断进步将推动AutoMod的发展。
- 与其他软件和系统的集成,实现更高级的自动化和智能化。
automod整体介绍
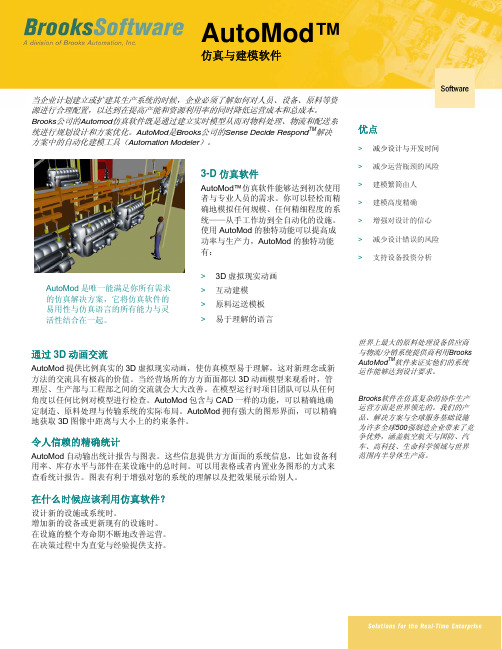
AutoMod™ 仿真与建模软件优点> 减少设计与开发时间> 减少运营瓶颈的风险> 建模繁简由人> 建模高度精确> 增强对设计的信心> 减少设计错误的风险> 支持设备投资分析世界上最大的原料处理设备供应商与物流/分销系统提供商利用BrooksAutoMod TM软件来证实他们的系统运作能够达到设计要求。
Brooks软件在仿真复杂的协作生产运营方面是世界领先的。
我们的产品、解决方案与全球服务基础设施为许多全球500强制造企业带来了竞争优势,涵盖航空航天与国防、汽车、高科技、生命科学领域与世界范围内半导体生产商。
当企业计划建立或扩建其生产系统的时候,企业必须了解如何对人员、设备、原料等资源进行合理配置,以达到在提高产能和资源利用率的同时降低运营成本和总成本。
Brooks公司的Automod仿真软件既是通过建立实时模型从而对物料处理、物流和配送系统进行规划设计和方案优化。
AutoMod是Brooks公司的Sense Decide Respond TM解决方案中的自动化建模工具(Automation Modeler)。
通过3D动画交流AutoMod提供比例真实的3D虚拟现实动画,使仿真模型易于理解,这对新理念或新方法的交流具有极高的价值。
当经营场所的方方面面都以3D动画模型来观看时,管理层、生产部与工程部之间的交流就会大大改善。
在模型运行时项目团队可以从任何角度以任何比例对模型进行检查。
AutoMod包含与CAD一样的功能,可以精确地确定制造、原料处理与传输系统的实际布局。
AutoMod拥有强大的图形界面,可以精确地获取3D图像中距离与大小上的约束条件。
令人信赖的精确统计AutoMod自动输出统计报告与图表。
这些信息提供方方面面的系统信息,比如设备利用率、库存水平与部件在某设施中的总时间。
可以用表格或者内置业务图形的方式来查看统计报告。
图表有利于增强对您的系统的理解以及把效果展示给别人。
transformers automodel用法 -回复
transformers automodel用法-回复Transformers 是一个开源的自然语言处理库,提供了丰富的模型架构和预训练模型,以帮助开发者更好地处理文本数据。
其中,AutoModel 是Transformers 中的一个模型类别,它是一个高级别的模型类,可以自动推断模型类型并加载对应的预训练模型。
AutoModel 的使用相对简单,但对于新手来说,可能还是有些困惑。
在这篇文章中,我们将一步一步地介绍如何使用Transformers 中的AutoModel。
首先,我们需要安装Transformers 库。
可以通过以下命令使用pip 来安装Transformers:pip install transformers安装完成后,我们可以开始使用AutoModel 类。
1. 导入所需的库和模块在代码中,我们首先需要导入transformers 模块,使其可用于使用AutoModel。
另外,我们可能还需要导入其他的Python 模块,如torch,numpy 等,以便对数据进行处理和模型操作。
下面是一个简单的导入示例:pythonimport torchimport numpy as npfrom transformers import AutoModel2. 创建一个AutoModel 对象接下来,我们需要创建一个AutoModel 对象。
AutoModel 类是一个抽象类,不能直接被实例化,但可以通过`AutoModel.from_pretrained` 方法来创建一个AutoModel 对象,并加载相应的预训练模型。
`from_pretrained` 方法接受一个参数,即预训练模型的名称或路径。
下面是一个简单的示例:pythonmodel_name = "bert-base-uncased"model = AutoModel.from_pretrained(model_name)上述代码将从Hugging Face 模型仓库中下载并加载了一个基于BERT的预训练模型,该模型是大小写不敏感的。
EICAD3.0说明

6.45.4道路模型实体................................................................................................................9
3.22.2MeshEditor程序支持快捷、高效的模型编辑..............................................................6
3.32.3支持道路设计过程中实时剖切....................................................................................6
EICAD简介
EICAD简介
1.目录................................................................................................................................................2
EICAD 3.0.0在原有2.99版的改进型导线法、积木法和扩展模式法的基础上,吸收了国
内外道路、轨道和管线等领域新的线路平面设计理论和实现方法。大大强化了全过程动
态拖动设计功能;实现了快捷、实时的实体联动。
在布设各种复杂立交、在众多高压线塔、高架桥桥墩等障碍之间的穿行、在山
Adobe Acrobat SDK 开发者指南说明书
This guide is governed by the Adobe Acrobat SDK License Agreement and may be used or copied only in accordance with the terms of this agreement. Except as permitted by any such agreement, no part of this guide may be reproduced, stored in a retrieval system, or transmitted, in any form or by any means, electronic, mechanical, recording, or otherwise, without the prior written permission of Adobe. Please note that the content in this guide is protected under copyright law.
诺基亚智能手机使用指南说明书
C
Capacities Chart .................... 344, 346 Carbon Monoxide Hazard .............. 52 Carrying Cargo .............................. 202 Cassette Player
Charging System Indicator .... 58, 328 Checklist, Before Driving............. 206 Child Safety ...................................... 20 Child Seats........................................ 25
Before Driving ............................... 191 Belts, Seat ..................................... 8, 41 Beverage Holder............................ 101 Body Repair .................................... 310
Maintenance............................... 279 Usage .................................. 111, 117 Air Outlets (Vents)................ 110, 115 Air Pressure, Tires ........................ 282 Alcohol in Gasoline........................ 350 Aluminum Wheels, Cleaning........ 305 Antifreeze ....................................... 253 Anti-lock Brakes (ABS) Indicator................................ 59, 219 Operation .................................... 218 Anti-theft, Audio System............... 179 Anti-theft Steering Column Lock .. 76
仿真(AUTOMOD automod)

AutoMod基本操作與簡介這一章的內容主要分成三個部分,第一節AutoMod基本操作主要是讓初學者能儘快地熟悉AutoMod軟體的操作環境,包括如何去開啟一個模式、建構一個模式等等,第二節AutoMod基本架構主要是讓使用者了解各系統模組的功能及特性,第三節AutoMod基本概念則是建立使用者在使用AutoMod建構模式時應該了解的基本概念。
2-2第一節 AutoMod 基本操作在本節中我們將針對AutoMod 的基本操作進行初步的介紹,包括如何開啟AutoMod 的介面、如何開啟一個模式、如何儲存一個模式,以及如何執行一個模式等相關的操作。
學習任何一套軟體的使用,初學者必須身體力行,花時間努力的研究並且實際去動手體驗,才是學習好軟體的不二法門。
學習AutoMod 當然也不例外,因此讀者若願意多花些時間研讀本書的內容,並且遵循書中的內容多做練習,相信即可以透過AutoMod 建構出有效的模式。
在安裝AutoMod 時,可選擇Standard(標準)模式或VR(虛擬實境)模式,其中本書的範例是以AutoMod 安裝在C 磁碟機及VR 模式呈現,所有範例皆可在AutoMod 11.0以上的版本實際練習與操作。
2-1-1 AutoMod 環境在整個AutoMod 軟體中,主要可分成兩個環境,編輯環境及模擬環境,其中: 編輯環境:提供使用者建構模式的環境及各項參數的設定。
模擬環境:可利用模擬環境進行模擬以獲得相關的統計資料,並將模式以動畫的方式呈現。
2-1-2 開啟AutoMod當你順利完成AutoMod 的安裝後,在程式集中點選AutoMod 12.0 (VR Graphics)中的AutoMod 選項即可打開AutoMod 的編輯介面。
這個編輯介面就是建構模式及定義模式相關參數的環境。
AutoMod 編輯介面AutoMod 基本操作與簡介2-32-1-3 建構模式要在AutoMod 的編輯介面中建構一個模式,你可以選擇建構一個新的模式或是開啟舊模式進行編輯。
1202奥派电子政务操作汇总
模块4 92 83 81 81 83 100 94 100 100 96 92 94 87 98 83 96 85 92 100 100 87 98 98 94 94 87 89 98 87 87 89 85 100 98 83 100 92 51 89 100 58 100 85 100 89 87 92 100 53 100 100 100 100
模块5 100 100 100 100 100 100 100 100 100 100 100 100 100 100 100 100 100 100 100 100 100 100 100 100 100 100 100 100 100 100 100 100 100 100 100 100 100 100 100 100 100 100 100 100 100 100 100 100 100 100 100 100 100
模块2 100 100 100 100 100 100 100 94 100 100 100 100 76 100 100 94 94 94 100 94 100 88 88 100 94 100 100 100 94 100 94 94 100 100 100 100 100 94 94 100 100 94 94 100 100 100 100 100 100 100 100 100 100
学号 1230020052 1230020049 1230020061 1230020051 1230020057 1230020072 1230020097 1230020100 1230020101 1230020079 1230020108 1230020078 1230020094 1230020054 1230020102 1230020090 1230020066 1230020095 1230020098 1230020089 1230020069 1230020083 1230020081 1230020073 1230020087 1230020047 1230020093 1230020077 1230020058 1230020076 1230020099 1230020107 1230020103 1230020074 1230020085 1230020070 1230020110 1230020046 1230020106 1230020092 1230020063 1230020084 1230020105 1230020080 1230020104 1230020064 1230020075 1230020067 1230020053 1230020086 1230020059 1230020091 1230020056
Automod中文教程1_Basic

模型的逻辑和核心
– 0~n个运动系统(movement systems)
Conveyor systems Vehicle systems –Pathmover –Power & Free –AS/RS –Bridge Crane –Kinematics
– 0~n个静态系统( static systems)
2
Applied Materials Confidential
文件结构
每个模型都有对应的目录存储: \modelname\
注意:文件命名不能有空格.
modelname.arc目录:
– ASCII 文件; – “Export”的时候生成; – systemname.asy:模型的系统描述文 : 件 – model.amo:模型文件列表 :
新建process 新建
新建process
– – – – 左键点击process New 输入process的名称 完成
15
Applied Materials Confidential
建立load type 建立
新建load type
– – – – – 点击load New 输入名称 编辑图形属性:颜色、大小等 编辑被创建属性
其他快捷键:
– p:开始运行模型,相当于Continue – d/<shift>d:运行速度的加快/减慢
8
Applied Materials Confidential
AutoMod模型的运行 模型的运行
模型运行:
– 方法1:运行窗口, “Control” 菜单->“Continue” – 方法2:快捷键,p
AutoMod培训教程 AutoMod培训教程
SIMATIC Energy Manager PRO V7.2 - Operation Operat
2 Energy Manager PRO Client................................................................................................................. 19
2.1 2.1.1 2.1.2 2.1.3 2.1.4 2.1.5 2.1.5.1 2.1.5.2 2.1.6
Basics ................................................................................................................................ 19 Start Energy Manager ........................................................................................................ 19 Client as navigation tool..................................................................................................... 23 Basic configuration ............................................................................................................ 25 Search for object................................................................................................................ 31 Quicklinks.......................................................................................................................... 33 Create Quicklinks ............................................................................................................... 33 Editing Quicklinks .............................................................................................................. 35 Help .................................................................................................................................. 38
AutoMod基本操作

AutoMod
第一節 AutoMod基本操作 (1/2)
AutoMod環境
開啟AutoMod
建構模式 執行模式 啟動模擬/暫停模擬 調整模擬動畫速度
AutoMod
第一節 AutoMod基本操作 (2/2)
3-D模擬動畫開關轉換
改變視野(view)
控制快速鍵 關閉AutoMod AutoMod學生版限制 AutoMod學生版與專業版之切換
AutoMod
第二節 AutoMod基本架構
AutoMod
檔案系統
程序系統
子系統
執行系統
分析系統
子 模 式
自 動 倉 儲 系 統
路 線 移 動 系 統
輸 送 帶 系 統
天 車 系 統 系 統
Top:從正Z軸方向觀察實體。
Front:從負Y軸方向觀察實體。 Bottom:從負Z軸方向觀察實體。
Back:從正Y軸位址觀察實體。
Right Side:從正X軸位址觀察實體。 Left Side:從負X軸位址觀察實體。 Create Views:透過此選項可以建立一個適當的視野,並儲存起來 以供下次使用,不需浪費時間再做一次調整。 Set Limits:此選項允許調整編輯介面中,格線區域大小。
橋 式 起 重 機 系 統
管 線 與 儲 存 槽 系 統
AutoMod
第三節 AutoMod基本概念
程序系統(Process System)
搬運系統(Movement System)
Loads 擺放Loads的區域(Territory)和空間(Space) 系統命名習慣 Entity命名習慣
AutoMod系统建模与仿真实验指导书

AutoMod
系统建模与仿真
实验指导书
北京邮电大学 自动化学院 北京亿特克科技有限公司 答案整理
目录
概述 AutoMod 软件简介和仿真试验综述 .............................................................................. 1 实验一 简单流水作业线仿真 ............................................................................................... 8 实验一 简单流水作业线仿真详细解析 ........................................................................... 11 1 新建一个模型 ............................................................................................................. 12 2 定义各种实体单元 ..................................................................................................... 13 3 绘制模型平面布置图 ................................................................................................. 20 4 定义 Source File .......................................................................................................... 21 5 设定 Run Control ......................................................................................................... 22 6 模型运行 ..................................................................................................................... 22 7 查看运行结果 ............................................................................................................. 25 8 模型优化 ..................................................................................................................... 26 附录 Source File 的内容 ................................................................................................ 27 实验二 传送带系统仿真 ..................................................................................................... 30 实验二 传送带系统仿真详细解析 ................................................................................. 33 1 创建一个新的模型 ...................................................................................................... 33 2 定义各种实体单元 ...................................................................................................... 38 3 绘制模型平面布置图 ................................................................................................. 41 4 定义 Source File .......................................................................................................... 41 5 设定 Run Control ......................................................................................................... 42 6 定义 Business Graphics ............................................................................................... 42 7 模型运行 ..................................................................................................................... 44 8 查看运行结果 ............................................................................................................. 45 9 模型优化 ..................................................................................................................... 46 附录 Source File 内容 ..................................................................................................... 46 实验三 循经运动系统仿真 ................................................................................................. 49 实验三 循径运动系统仿真详细解析 ............................................................................. 53 1 创建一个新的模型 ..................................................................................................... 53 2 定义 Path Mover 子系统 pm ...................................................................................... 55
侠盗猎车手圣安地列斯mod大全
侠盗猎车手圣安地列斯mod大全侠盗猎车手圣安地列斯(GTA San Andreas)是一款备受玩家喜爱的游戏,而mod则是让游戏更加丰富多彩的重要元素之一。
在这篇文档中,我将为大家介绍一些值得安装的侠盗猎车手圣安地列斯mod,让你的游戏体验更上一层楼。
首先,我们来谈谈图形mod。
对于喜欢追求游戏画面表现的玩家来说,图形mod是必不可少的。
比如,你可以安装ENB系列mod,它可以大幅提升游戏画面的真实感和细节表现,让游戏中的光影效果更加逼真。
另外,如果你喜欢拍摄游戏视频或者截图,那么一些特效mod也是不错的选择,比如可以安装一些天气效果mod,让游戏中的天气变化更加生动。
其次,音效mod也是让游戏更加有趣的一种选择。
比如,你可以安装一些车辆音效mod,让游戏中的车辆引擎声更加真实震撼;或者安装一些环境音效mod,让游戏中的街头喧嚣、鸟鸣虫鸣更加栩栩如生。
这些音效mod可以让你的游戏体验更加身临其境。
除此之外,一些游戏性mod也是不可或缺的。
比如,你可以安装一些新增车辆mod,让游戏中的车辆种类更加丰富多样;或者安装一些改变游戏玩法的mod,比如增加一些新的任务、剧情或者角色。
这些mod可以让你在游戏中发现更多的乐趣和挑战。
最后,我们也不要忽视一些美化mod。
比如,你可以安装一些角色美化mod,让游戏中的主角卡尔·约翰逊更加英俊帅气;或者安装一些地图美化mod,让游戏中的地图更加细致精美。
这些mod可以让你在游戏中享受到视觉上的盛宴。
总的来说,侠盗猎车手圣安地列斯mod为游戏增添了许多新的元素,让游戏更加富有趣味性和挑战性。
希望通过本文的介绍,你可以找到适合自己的mod,让你的游戏体验更加完美。
祝你游戏愉快!。
mod8id用法 -回复

mod8id用法-回复mod8id是一种语言处理软件,他的主要用途是生成文章大纲和辅助写作。
下面将逐步说明mod8id的用法以及如何使用它来撰写一篇1500-2000字的文章。
第一步:安装和启动mod8id首先,我们需要在电脑上安装mod8id软件。
可以在mod8id官方网站上下载安装包,并根据安装向导完成安装过程。
安装完成后,可以在桌面或开始菜单中找到mod8id的图标,点击启动软件。
第二步:设置文章主题在软件启动后,我们需要设置文章主题。
在软件的界面上,可以看到一个文本框。
在这个文本框中输入[mod8id用法],表示文章的主题是关于mod8id的用法。
点击确认按钮,软件将根据主题生成一个文章大纲。
第三步:生成文章大纲在设置主题后,我们需要生成文章的大纲。
点击软件界面上的“生成大纲”按钮,mod8id将根据主题自动生成一个大纲。
大纲会显示文章的结构和主要部分。
第四步:补充和修改大纲生成大纲后,我们可以对其进行补充和修改。
在大纲上单击鼠标右键,可以查看菜单选项,包括添加、删除、修改等。
通过这些选项,我们可以根据自己的需求对大纲进行修改和调整,使其更符合自己的写作意图。
第五步:编写文章内容完成大纲的修改后,我们可以开始编写文章的内容。
点击界面上的“写作模式”按钮,软件会自动切换到写作模式。
在写作模式下,可以在生成的大纲的每个部分中添加文字和段落。
我们可以根据大纲的提示,逐步填充每个部分的内容。
同时,我们还可以使用软件提供的编辑工具,如字体、对齐、插入图片等,使文章内容更加丰富多样。
第六步:保存和导出文章在完成文章内容的编写后,我们可以点击软件界面上的“保存”按钮,将文档保存到本地。
同时,软件也提供了导出功能,可以将文章导出为常见的文本格式,如doc、txt、pdf等,方便进行后续的编辑和分享。
第七步:修改和完善文章保存和导出文章后,我们可以对文章进行修改和完善。
可以重新打开文章,通过软件的编辑工具进行修改。
蝙蝠侠阿甘骑士mod制作教程
蝙蝠侠阿甘骑士mod制作教程蝙蝠侠阿甘骑士mod制作教程简介本教程将教您如何制作蝙蝠侠阿甘骑士模组,让您的游戏体验更加丰富有趣。
准备工作•安装游戏:首先需要确保您已经安装了适合您的游戏版本。
•下载mod制作工具:您可以在官方网站上找到合适的mod制作工具并下载安装。
步骤1.创建新项目:–打开mod制作工具并选择创建新项目。
–输入项目名称和描述,并选择适用的游戏版本。
–点击“创建”按钮,新项目将被创建并打开。
2.导入资源:–在资源管理器中找到游戏文件夹,并导入蝙蝠侠阿甘骑士的相关资源文件。
–可以通过拖放或导入按钮将资源文件添加到项目中。
3.修改游戏设置:–打开项目的设置文件,并对游戏设置进行相应修改。
–常见的游戏设置包括角色属性、游戏规则等。
4.编写脚本:–打开脚本编辑器,并编写相关脚本。
–您可以使用脚本语言来实现各种功能,如新角色的行为、任务等。
5.制作人物模型:–使用模型编辑器创建蝙蝠侠阿甘骑士的人物模型。
–可以使用现有模型作为基础,并进行修改和定制。
6.设计关卡:–打开关卡编辑器,创建新关卡并设计关卡地图。
–添加地形、道具、敌人等元素,以增加游戏的可玩性。
7.调试和测试:–在制作过程中进行常规的调试和测试。
–确保蝙蝠侠阿甘骑士的角色模型、脚本等功能正常运行。
发布与分享1.打包项目:–在完成制作后,将项目打包为一个可执行文件或zip压缩包。
–可以选择不同的发布选项,如仅限个人使用、公开发布等。
2.发布到mod社区:–将您的蝙蝠侠阿甘骑士mod上传到mod社区并分享给其他玩家。
–可以提供详细的描述和截图,以吸引更多玩家体验您的mod。
3.参与mod社区:–加入mod社区,与其他mod制作者交流经验、学习新技术。
–可以参与mod制作比赛或活动,展示自己的作品并获得奖励。
以上就是制作蝙蝠侠阿甘骑士mod的详细教程。
希望能帮助到您,祝您顺利完成mod制作,并能在游戏中享受到乐趣!注意事项在制作蝙蝠侠阿甘骑士mod的过程中,需要注意以下事项:•确保您拥有合法的游戏副本,并遵守游戏的许可协议。
automodelforcausallmwithvalueshead用法
automodelforcausallmwithvalueshead用法
automodelforcausallmwithvalueshead是因果推断领域的一个工具包,用于对数据进行因果分析,探索变量之间的因果关系。
该工具包基于概率图模型,使用可视化方法来概括数据中的因果结构,并通过相关算法进行因果推断。
具体用法包括:
1. 数据处理:将数据集转化为因果网络结构的数据格式。
2. 模型构建:使用automodelforcausallmwithvalueshead构建概率图模型。
3. 模型训练:使用数据集进行模型训练,并获取因果关系强度和置信度等参数。
4. 模型测试:使用测试集验证模型的效果。
5. 模型解释:使用可视化工具对模型结果进行解释和展示,以便更好地理解数据结构和因果关系。
gtamod整合包方块字
gtamod整合包方块字
GTAMod整合包方块字是指在游戏《侠盗猎车手》中使用Mod整合包安装后,可以添加方块字效果的Mod。
方块字是指将字母或文字转换为由方块组成的图案,使得文本在游戏中以方块的形式呈现。
安装GTAMod整合包方块字可以为游戏中的标语、广告牌、标志等文本元素添加更加独特的视觉效果。
这样的Mod可以为游戏增添一些特别的个性化元素,使得游戏中的文字更加生动活泼。
安装方块字Mod的具体步骤可能因不同的Mod而有所不同,一般来说,你需要先下载并安装相应的Mod,然后将Mod文件放入游戏的Mod文件夹中,最后根据Mod的说明进行配置和调整。
需要注意的是,在安装Mod时请确保选择可信的来源,以防止下载到恶意程序或病毒。
此外,使用Mod也可能导致游戏的稳定性或性能方面的问题,请在使用前备份游戏文件,并在出现问题时及时修复或删除相关Mod。
总之,GTAMod整合包方块字可以为《侠盗猎车手》带来一些有趣的变化,增加游戏的可玩性和个性化体验。
- 1、下载文档前请自行甄别文档内容的完整性,平台不提供额外的编辑、内容补充、找答案等附加服务。
- 2、"仅部分预览"的文档,不可在线预览部分如存在完整性等问题,可反馈申请退款(可完整预览的文档不适用该条件!)。
- 3、如文档侵犯您的权益,请联系客服反馈,我们会尽快为您处理(人工客服工作时间:9:00-18:30)。
Proceedings of the 2004 Winter Simulation ConferenceR .G. Ingalls, M. D. Rossetti, J. S. Smith, and B. A. Peters, eds. ABSTRACTThis paper describes the integration of Geographic Informa-tion Systems (GIS) with simulation modeling of traffic flow on inland waterways. Two separate modeling efforts are de-scribed: (a) GIS/AutoMod modeling of barge traffic on the Ohio River, and (b) GIS/Arena modeling of the transit of ocean-going vessels through the Panama Canal. These mod-eling efforts demonstrate the benefits that accrue both to modeling realism and to the initialization process with dis-crete-event models of traffic flow on these waterways. 1AN AUTOMOD MODEL OF BARGETRAFFIC ON THE OHIO RIVERAn AutoMod 11.0 model was developed of barge traffic on the Ohio River. The focus of this modeling effort was toinvestigate the delays incurred at the numerous control structures along the river. Figure 1 illustrates the locks anddams on the Ohio River as it borders Kentucky. The mainresources used within the model are the control structures (locks and dams) on the inland waterway system. Thesecontrol structures delay each of the tows as they journey from their origin to their destination. However, they are necessary for the safe and consistent travel of these tows.The locks and dams provide a means of maintaining depthwithin the pools of water as well as keeping any rap-ids from creating disastrous conditions for the tows. 1.1 Modeling MethodologyThe model is created using a path-mover system in Auto-Mod version 11.0 build 1942.7. There are two paths that follow the contour of the river. A non-accumulating sys-Figure 1: Control Structures along the Ohio RiverINTEGRATION OF SIMULATION AND GEOGRAPHIC INFORMATION SYSTEMS:MODELING TRAFFIC FLOW IN INLAND WATERWAYSWilliam E. Biles Daniel Sasso Department of Industrial Engineering University of Louisville Louisville, KY 40292, U.S.A.Jerry K. BilbreyDepartment of Computer ScienceFrancis Marion UniversityFlorence, SC 29501, U.S.A.(Underlined Locks have webpages ready for viewing.)tem is used to keep the tows from having collisions and for model efficiency (Moon 2003). Geographic data for the Ohio River is obtained from the Water Resource Informa-tion System Website (2003). The data comes in the form of AutoCAD format .dwg files. These files are imported into AutoMod and then used to draw the paths to scale based on the boundaries of the river. Also, geographically referenced initialization data is downloaded from the US Army Corps of Engineers website.A “tow” is one of the basic entities flowing along the river system. It is modeled within AutoMod as a vehicle carrying a load. A “tow” consists of a tow boat and a set of barges (e.g., 15 barges). Entities flow either upstream or downstream, and can stop at any of several ports along the river to drop off and/or pick up barges. The simulation is initialized by placing entities at typical points along the river based on geographically referenced input data.Due to the relatively small number of tows in a given area on the river at a given time, it is assumed that passing is not a problem within the model. Along this same line of logic, tows may start or continue a pass (Brewer 2004) in the bend of a river. Also, using a non-accumulating system it is assumed that as many tows as is necessary may con-currently be side by side. In actuality it is not likely that more than three tows would be in the same area at the same time. So, it is also for this reason that it is assumed that passing is not a significant problem within the model sys-tem. One end is the Greenup L & D another entity utilized within the AutoMod model is the control point. Control points are placed throughout the model to represent each of the logical locations where a tow would be required to stop. They represent geographically referenced locations that are used to direct the tows to their next location. As well as references for the initial locations of the tows and logical stopping points, control points are used to represent the locations of the ports between the locks. While stopped at these control points (ports) the system generates new data for the tows upcoming trip.After model initialization, arrivals enter the system through the two ends of the system. One end is the Greenup L & D and the other end is the Lock 52 L & D. The rest of the system is self-contained accordingly. Once entering the system a tow only leaves the system by traveling to one of the two ends. At the beginning of a tow’s trip its parameters are determined. Parameters that are calculated are tonnage, number of barges empty, number of barges full, destination, speed, and the number of the port where the tow is sched-uled to stop. At model initialization and again after every stop a tow updates its parameters and follows this newly prescribed route until it is finished. Then the process re-peats. This process is illustrated in Figure 2.There are three points between each of the locks at which a tow may stop. These are evenly distributed be-tween the locks to indicate “close travel”, “medium travel”, and “distant travel” from the previous lock. These points are derived in an attempt to model the many different portsFigure 2: Looping Process of the Ohio River Modelon the river system and closely represent the actual ports on the Ohio River. Within the model it is assumed that one third of the tows stopping in the current pool will stop at the closest point, one third will stop at the middle point, and the last third will stop at the further point. This is an attempt to demonstrate the tows traveling to different ports to load and unload their cargo while utilizing each of the ports evenly over a long period of time.1.2 Model ParametersThere are several parameters in the model, most of which are based on the database provided by the United States Army Corps of Engineers (Lisney 2002). This data is from the year 2001 and pertains to all of the lockages that hap-pened on the Ohio River. It includes all arrival times begin-ning lockage times and ending lockage times. These times are used for various calculations to determine queue waiting distributions, resource (locking) distributions, and travel speed distributions. Other parameters included within the database are boolean stop flags, tonnage, number of loaded and unloaded barges within a tow, vessel number, lock name, and river mile of lock.Within the model, tows have attributes including ves-sel number, tonnage, array of locks for the trip, speed, number of empty barges, number of loaded barges, stop flag, destination, and stop time length. There are many other standard simulation parameters that are calculated for the entire system such as lock utilization, queue delays, number in queue, etc. There are both upstream and down-stream distributions for speeds derived from historical data. There are also upstream and downstream locking time dis-tributions used at each lock.There is a stopping time distribution calculated for the tows on the river. At the end of each trip a tow stops for a length of time calculated from this distribution before pro-ceeding through the model. It is assumed that each tow will stop for a period of time no longer than 50 minutes. In reality, this is not what happens at all. Tows may stop for several days. However, as some tows stop for several days and other tows start after several days of being stopped the natural system reaches somewhat of a constant state. Forroutine short stops, 50 minutes is considered to be a rea-sonable amount of time (Gardner 2003).Behavior of the tows is also converted into a distribu-tion which in turn is given to the behavior attribute of the tow. The upstream behavior is illustrated in Figure 3 as the number of pairs of locks a tow passes through before stop-ping. For instance, about 70 percent of the tows on the river pass through only one lock (hence zero pairs) before stopping at a port. This function is used to determine the future behavior of all of the tows in the model. 1.3 Model InputsInputs are crucial to the success of the model. Also, some desired inputs and associated expected outputs are not presently available. These have to be derived using rea-sonable assumptions. Model initialization data and arrival data fall into this category.One assumption that has to be made concerns the des-tination. It has to be estimated because the data is not available. There is a large range of potential errors in the system. For instance, there is no data for precise starting or stopping time. In fact, the stopping time has to be gen-erally estimated using basic assumptions about the flow of traffic. Tributaries allowing tows to enter and exit the sys-tem are yet another major source of potential error. There are four significant rivers that enter the Ohio River as it borders Kentucky. These are the Tennessee, Kentucky, Green and Cumberland. However, data was not available to add to this model. With these consequent entries and exits into and from the system it could easily change someof the other parameters.Figure 3: Distribution of the Number of Pairs of Locks the Tows Typically Travel through before Stopping1.4 ResultsThe model warm-up time is determined using graphs of the queue utilizations. It is determined that the model takes between 90 and 120 days of runtime to reach steady-state from an empty and idle startup. Consequently, using ini-tialization data there is no warm-up time necessary. This saves computer time as this warm-up period takes ap-proximately 5 minutes on a Pentium IV 2.2 GHz machine.It is found that the model gives good indicators for the short-term future. The measurement tested is the number of tows in each pool. Although this number is not as pre-cise as is desired, it is the best measure with the available data. The model is initialized with the input data and ran for periods of 1-25 hours. Averages are taken of the output of the model and compared with the actual results for the time period. The results are shown in Figure 4. These re-sults are based on the formula abs[ (observed – ex-pected)/expected].Figure 4: Results of Number of Tows in the Pool in PoolThe results are quite promising. The average error for the three runs for the first hour is 9.7%. The average error for the three runs for the second hour is 13.3%. Lastly, the average error for the three runs for the third hour is 9.7%. This suggests that the model could be used to predict the state of the model with an error of less than 15% for the first three hours. It is seen in the graph that starting at hour 4, the variability of the observed from expected number in each pool approaches 20% and continues to climb each hour thereafter. It is noted that some of the values in the obtained data files are obviously wrong. Several tows are found to have traveled more than 90 miles in about an hour. This is very inaccurate as the tows have a calculated maximum speed of 15 mph and a top actual speed of around 7 mph. This inaccuracy within the data gives rea-son to believe that the predictability would be much stronger if the input data set were more accurate. Also, the input data is far from detailed about the destination of the individual tows. Obviously, if the destinations were known for the initialization data the short-term accuracy would improve. 2 A GIS/ARENA SIMULATION MODELOF THE PANAMA CANALThe Panama Canal is a 50-mile long waterway that joins the Atlantic and Pacific Oceans through the Isthmus of Pa-nama. It consists of three sets of locks, Miraflores, Pedro Miguel, and Gatun. Arriving vessels are classified in dif-ferent categories based on their beam, draft, length, type, and priority. These categories determine their scheduling scheme and the time required to go through the Canal.The objective of this model is to populate a sample da-tabase with different kinds of vessels with their coordinates and randomly re-sample them placing them at their corre-sponding positions in a geo-referenced map to start the simulation. This is accomplished by gathering the plotting data from Global Positioning System (GPS) readings and loading it into a Microsoft Access database. A Geographic Information System (GIS) reads these coordinates and plots them in a geo-referenced map of the Panama Canal. The database will also contain the vessel categories as their attributes which will be used in the Arena simulation model to determine their transit process through the Canal.2.1 Description of the GeographicInformation System (GIS)One of the key elements of this research is the GIS that must be integrated into the simulation model. The impor-tance of this implementation is based on the capacity of having a vessel management tool to start the simulation with the actual number of vessels in the system with their corresponding positions. The integration of this interface will allow the daily scheduling of vessels ready to transit and currently on transit taking into account waiting time in queue, booking status, navigation restrictions and their times through the locks.The interface development was initiated with the con-figuration of the GIS software, ArcView 8.3, from Envi-ronmental Systems Research Institute (ESRI). The map-ping scheme that the software uses consists of layers. A layer references the data contained in the data source which can be coverages, shapefiles, CAD files, grids, images and others. Once the data is referenced, it allows the layers on a map to automatically reflect the most up to date informa-tion in the GIS database (Murad-al-Shaikh et al. 2003).Using the layer principle, the next step consisted on constructing the map for the Panama Canal. First, the politi-cal data layer had to be loaded, which is the country’s shape and boundaries. On top of the political data layer came the lakes and rivers layers that constitute Panama’s hydrography (Geo Community Website 2004). It is important to have every layer with the same geographic coordinate system (GSC) in order to have an accurate map. After adding all the layers we have our starting map, shown in Figure 5.Figure 5: A Starting GIS Map of the Isthmus of PanamaWith the map in place, the following procedure was to de-fine the route for the vessels through the Canal and loca-tion of the locks in the map with their corresponding coor-dinates (latitude and longitude). Figure 6 shows the Panama Canal with the positions of routes and locks.Figure 6: Panama Canal with Routes and Locks 2.2 Description of the DatabaseTo start the experiment, it is required to populate a database with the vessel coordinates at different points along the route. For this purpose, historical data was gathered from the Panama Canal Authority (Panama Canal Authority Web-site 2004), using vessel transits for the fiscal years 2002 through 2003 to estimate the number of transits per day. Vessels are classified in different categories that can be configured by the database manager. These categories are beam, draft, length, market segment/type, and priority.Table 1 shows a summary of the number of transits by market segment for the years 2002 and 2003.Table 1: Panama Canal Transits per Market Segment No. of Transits Market Segment 2003 2002Avg % Container Vessels 2,369 2,012 19 Dry Bulk Carriers 2,347 2,676 21 Refrigerated Cargo 2,207 2,135 18 Tankers 1,581 1,802 14 General Cargo 827 985 8 Vehicle Carriers 816 773 7 Passenger Ships 203 206 2 Others 1,375 1,271 11 Total 11,725 11,860 100%This mix of vessels was entered into a Microsoft Ac-cess database with their coordinates and categories as the sample to choose from to initialize the simulation which will be explained in the next section. One of the advan-tages of using Microsoft Access is that it easily interfaces with ArcView, allowing it to read the coordinates for each vessel plotting them on the map. 2.3 Description of the Simulation ModelFigure 7 shows a simplified Arena model of vessel transit of the Panama Canal. Note that there is a model segment for the Atlantic-to-Pacific route and another for the Pacific-to-Atlantic route. A previous approach to the development of a simulation model for the Panama Canal was undertaken by Golkar, Shekhar, and Buddhavarapu (1998) who divided theFigure 7: An Arena Model of Traffic Flow on the Panama Canaldevelopment process in two phases. In this paper we makereference to operational elements of the simulation enginedescribed in phase two with a few modifications.The simulation model is better developed and under-stood by dividing its design in modules. The modules repre-sent key components that will simulate operating scenarioswith assigned rules, strategies and restrictions (Panama Ca-nal Authority RFP 2003). The modules are the following: • Locks Module: This module includes all the activi-ties in the Gatun, Pedro Miguel and MirafloresLocks. The activities include: the utilization of thewater chambers, locomotives and linehandlers.• Navigation Channels Module: The channels are: Pacific Entrance, Miraflores Lake, Culebra Cut,Gatun Lake, and Atlantic Entrance. The design ofthis module consists on specifying the navigationspeeds and times per vessel category for eachchannel.• Tie-up Stations and Moorings Module: These are: Miraflores Moorings, Paraiso tie-up station, GatunAnchorage.• Tugboat Module: The module represents the avail-ability of the tugboat fleet to assist the vessels.• Pacific and Atlantic Anchorages Module: These are the locations were vessels arrive and need to becleared by authorities before they start transit. Thisis the queue prior to entering the Canal. The gen-erated vessels are scheduled based on their catego-ries. The schedule may consist on a first come firstserve discipline, preference, booking, or selectedreordering. For this module a vessel arrival mix isgenerated based on historical data or probabilisticdistribution and selected from the GIS database.• Restrictions and Weather Module: In this module the user specifies all the nature conditions thatmay influence the transit through the Canal suchas daylight hours, tides, lake levels, water avail-ability, and fog.2.4 Model InitializationThe initialization consists on having a Visual Basic macrowithin Microsoft Access randomly re-sample from the data-base a certain number of vessels to be plotted on the Canalmap. The vessels plot represents a day’s traffic through theCanal. The length of a day’s run may be extended to moredays by editing the database.Before the simulation begins, all the data from the GISis loaded into Arena so that the software interprets the in-formation and proceeds according to the specifications ofeach vessel in transit and in queue. Each vessel will carryits attributes which include: coordinate, direction, andcategory. This means that if a vessel is currently located ata certain coordinate on the Gatun Lake going into the At-lantic, Arena would automatically determine the remaining time before it enters the locks based on the vessel category and traffic. This would be the same case with every vessel chosen from the database for a simulation run.3 SUMMARY AND CONCLUSIONSIt has been shown that using geographically referenced data adds much value to a simulation model of an inland water-way system. Using a geographically referenced model al-lows the model to be initialized with current Global Posi-tioning System (GPS) data and gives an indication of the short-term future state of the actual system. There are other initialization and sampling issues that remain to be investi-gated, but in both models initialization with real-time data is feasible and greatly reduces simulation runtime. REFERENCESBrewer, R. 2004. Personal phone conversation, January 29, 2004. Boat Captain, Crounse Corporation, Paducah, Kentucky.Gardner, Capt. R. 2003, Personal phone conversation, De-cember 30, 2003, Boat Captain, Barge America, Lou-isville, Kentucky.Geo Community Website. 2004. Available online via <>, (accessed Febru-ary 15, 2004).Golkar, J., A. Shekhar and S. Buddhavarapu. 1998. Pa-nama Canal Simulation Model. In Proceedings of the 1998 Winter Simulation Conference, eds. D. J. Ma-deiros, E. F. Watson, J. S. Carson and M. S. Manivan-nan, 1229—1237, The Society for Computer Simula-tion International, Washington, DC.Lisney, M. W. 2002. Personal Correspondence, May 2002, Civil Engineer, Louisville District, United States Army Corps of Engineers.Moon, W. 2003, Accumulating vs. Non-Accumulating Ve-hicles, Autoflash, Brooks Automation, Vol. 16, No. 5. Murad-al-shaikh, M., K. Page, M. Stewart, and M. Taggart.2003. Introduction to ArcGIS (for ArcView 8, ArcEditor 8, and ArcInfo 8), Course Lectures and Exercises, ESRI Educational Services, Redlands, California.Panama Canal Authority. 2003. Request for Proposal No.CDO–150552 .Panama Canal Authority Website. 2004. Available online via <>, (accessed 04-30-04).Water Resource Information System Website. 2003. Avail-able online via </ wris/mapgis/data.htm>, [accessed March 9, 2003].AUTHOR BIOGRAPHIESWILLIAM E. BILES, Ph.D., P.E.is the Edward R. Clark Professor of Computer Aided Engineering in the Depart-ment of Industrial Engineering of the University of Louis-ville. He received the B.S.Ch.E. from Auburn University, the M.S.I.E. from the University of Alabama in Huntsville, and the Ph.D. in Industrial Engineering and Operations Re-search from Virginia Polytechnic Institute and State Uni-versity. Dr. Biles has served on the faculties of the Univer-sity of Notre Dame, The Pennsylvania State University, and Louisiana State University. He is a Fellow of the Insti-tute of Industrial Engineers and a registered Professional Engineer in Indiana and Kentucky. His email address is <webile01@>.JERRY K. BILBREY, JR. is an Assistant Professor of Computer Science at Francis Marion University. He re-ceived the B.S. degree in Industrial Engineering from Ten-nessee Technological University, the M.E. degree in Com-puter Engineering from the University of South Carolina, and the Ph.D. degree in Industrial Engineering at the Uni-versity of Louisville. His research interests include simula-tion using geographic data, object-oriented simulation mod-eling and real-time simulation. His research is motivated by logistics problems and systems inefficiencies. His email ad-dress is <jbilbrey@>.DANIEL SASSO is a Ph.D. student in Industrial Engineer-ing at the University of Louisville. He has a B.S. degree in Electronics Engineering from Santa Maria La Antigua Uni-versity in Panama City, Panama and the M.Eng. in Engineering Management from University of Louisville. He has worked as a contractor for commercial airlines and the U.S. Air Force. His current interests are in simulation and transportation logistics. He is a member of IIE and INFORMS. His email address is <daniel@>.。
