Infrared Spectroscopy of Atomic Lines in Gaseous Nebulae
红外与拉曼光谱的比较

极化率是分子的平均偶极矩u与电场强度E的比 值。符号α ;u=αE 它是统计平均值
拉曼光谱和红外光谱的互相补充 1)同种分子的非极性键S-S,C=C,N=N,CC产生强拉曼谱 带, 随单键双键三键谱带强度增加。 2)红外光谱中,由C N,C=S,S-H伸缩振动产生的谱带一 般较弱或强度可变,而在拉曼光谱中则是强谱带。
40—4000cm-1
光谱产生的方式 吸收光谱
散射光谱
检测对象
化学分子的的偶极距
分子的电子云的极化。
测定要求 水溶液样品
谱图信息
能斯特灯、碳化硅棒等作光源; 激光作光源;样品不需前处理 样品需前处理
水的吸收强,严重影响测试结 吸收弱,可以应用于生物的活体测试 果,限制了应用领域
主要反映分子的官能团
主要反映分子的骨架,用于分析生物 大分子
拉曼光谱技术 的特点
一些缺点
信号强度弱 有荧光干扰 数据库仍然不全
THANKS
照射过程中,光子与分子之间没 有能量交换,光子只改变运动方 向,不改变频率
照射过程中,光子与分子之间 发生能量交换,光子不仅改变 运动方向,而且改变频率
小结:红外与拉曼原理的区别
红外光谱 吸收;分子在振动跃迁过程中有偶极矩的改变
偶极矩指正、负电荷中心间的距离d和电荷中心 所带电量q的乘积,表达式为μ=qd,方向规定为 从正电中心指向负电中心。
3)环状化合物的对称振动常常是最强的拉曼谱带。
5)C-C伸缩振动在拉曼光谱中是强谱带。
红外与拉曼谱图对比
红外:基团 拉曼:分子骨架的测定
甲基的特征吸收频率: 2960cm-1 2870cm-1 1460cm-1 1380cm-1
Protein infrared spectroscopy
5 Protein infrared spectroscopy蛋白质红外光谱学Infrared spectroscopy is based on the infrared absorption of molecules and is, compared with crystallography, a relatively simple and inexpensive tool for the global characterization of molecular conformations and conformational changes of proteins and other biomolecules.红外光谱法是基于分子的红外吸收,与晶体学相比,它是一个相对简单和便宜的工具,用于总体描述蛋白质及其它生物大分子的分子构象和构象变化。
Depending on the measurement technique, scanning infrared (IR) spectrometers, Fourier transform infrared (FTIR) spectrometers, and single wavelength infrared apparatuses are distinguished (see Sect. 5.1).根据测量方法,扫描红外光谱仪,傅里叶变换红外光谱仪,和单波长的红外装置被区分开来(见5.1节)。
Typically the most interesting spectral region for biomolecules is ν equals four hundred to four thousand recipro cal centimeter, where the wavenumber, ν, is defined as ν is identical to one over wavelength.对于生物分子,典型地最令人关注的光谱区间是v = 400 - 4000 cm-1,这里的波数,v 被定义为:v 恒等于波长的倒数。
金属材料常用分析方法
EDS XPS XRD
特点 定性与定量分析。可多元素同时检测。可对约70种元素(金属元素及磷、硅、砷、碳、硼等非 金属元素)进行分析。在一般情况下,用于1%以下含量的组份测定,检出限可达ppm,精密度 为± 10%左右,线性范围约2个数量级。 主要适用样品中微量及痕量组分分析。元素之间的干扰较小,可不经分离在同一溶液中直接测 定多种元素。可直接测定70多种微量金属元素,还能用间接法测度硫、氮、卤素等非金属元素 及其化合物。 利用物质对不同波长的红外辐射的吸收特性,进行分子结构和化学组成分析。 用于化合物结构鉴定不如红外光谱有效,主要用于定量分析(以朗伯-比尔定律为理论基础)。 制样简单、放大倍数可调范围宽、图像的分辨率高、景深大。可观察纳米材料,材料断口的分 析,观察生物试样,表面形貌。扫描电镜除了观察表面形貌外还能进行成分和元素的分析。 观察超微结构,分辨率为0.1~0.2nm,放大倍数可达百万倍,样品需要处理得很薄。常用于研 究纳米材料的结晶情况,观察纳米粒子的形貌、分散情况及测量和评估纳米粒子的粒径。 提供各种类型样品的表面状态信息,可以得到样品表面的三维形貌图象;并可对扫描所得的三 维形貌图象进行粗糙度计算、厚度、步宽、方框图或颗粒度分析。 利用量子隧道效应产生隧道电流的原理制作的显微镜,其分辨率可达原子水平,即观察到原子 级的图像,具有比原子力显微镜更加高的分辨率。在生物学中,可观察大分子和生物膜的分子 结构。 组织结构测量。 利用不同元素X射线光子特征能量不同这一特点,对材料微区成分元素种类与含量分析,配合扫 描电子显微镜与透射电子显微镜的使用。能测铍以上元素,样品必须导热导电,必要时表面需 要喷炭或金。可对固体材料的表面涂层、镀层进行分析。 可以根据能谱图中出现的特征谱线的位置鉴定除H、He以外的所有元素。根据能谱图中光电子 谱线强度(光电子峰的面积)反应原子的含量或相对浓度。 不损伤样品,通过对材料进行X射线衍射,分析其衍射图谱,获得材料的成分、材料内部原子或 分子的结构或形态等信息。样品可以是金属、非金属、有机、无机材料粉末。 利用X射线穿透被测材料时,X射线的强度的变化与材料的厚度相关的特性,从而测定材料的厚 度,是一种非接触式的动态计量仪器。
材料表征方法名词
材料表征方法名词以下是常见的材料表征方法名词:1. X射线衍射(X-ray diffraction,XRD):利用X射线的衍射原理来分析材料的晶体结构、晶体相、晶体缺陷等。
2. 扫描电子显微镜(Scanning Electron Microscope,SEM):通过使用电子束来照射样品表面并收集其反射电子来观察材料的形貌、表面形态、粒径等。
3. 透射电子显微镜(Transmission Electron Microscope,TEM):利用透射电子来观察材料的微观结构,例如晶体结构、晶格缺陷、晶界、原子尺度的成分分析等。
4. 傅里叶变换红外光谱(Fourier Transform Infrared spectroscopy,FTIR):利用材料对红外辐射的吸收和散射来分析材料的化学组成、分子结构等。
5. 热重分析(Thermogravimetric Analysis,TGA):通过在控制升温条件下测量材料质量的变化来分析材料的热稳定性、热分解特性等。
6. 原子力显微镜(Atomic Force Microscope,AFM):利用探针与样品表面之间的相互作用力来观察材料的表面形态、表面粗糙度、力学性能等。
7. 核磁共振(Nuclear Magnetic Resonance,NMR):利用材料中的原子核在外磁场作用下的共振吸收来分析材料的分子结构、组成等。
8. 拉曼光谱(Raman Spectroscopy):利用材料对激光的散射来分析材料的分子振动、晶体结构、材料性能等。
9. 等离子体质谱(Inductively Coupled Plasma Mass Spectrometry,ICP-MS):通过将样品化合物转化为离子并通过质谱仪测量其质量-电荷比来分析材料中的元素组成、含量等。
10. X射线光电子能谱(X-ray Photoelectron Spectroscopy,XPS):利用材料表面电子对X射线的光电离来分析材料表面的成分、化学态等。
《结构化学》教学大纲(英文版)
‘Structural Chemistry ’Course SyllabusCourse Code:09040001Course Category:Major BasicMajors:ChemistrySemester:SpringTotal Hours:54 Hours Credit:3Lecture Hours:54 HoursTextbooks:《Structural Chemistry》孙墨珑编著,东北林业大学出版社。
I.Introduction to Structural ChemistryThe major targets this course includes the followings: (1) to introduce the material structure of the basic concepts, basic theory, and basic methods for learning “Structural Chemistry”; (2) to explore the relationship between the microstructures and properties of atoms, molecules, and crystals; (3) to systematically clarify the essence of the periodic law of elements; (4) to deeply and qualitatively clarify the essence of the chemical bonds. This course introduces the basic principles of quantum mechanics and their applications in simple systems, structure of atoms, molecules, and crystals, symmetry of molecular orbitals, molecular orbital theory, and ligand field theory, etc. After learning this course, the students should be able to analyze and solve the basic chemistry problems from the point of view of quantum mechanics.II.Table of contentsSection I (Chapter 1) Basic knowledge of quantum mechanics1.1 Failures of classical mechanics1)Black-body radiation & Planck’s solution;2)Ph otoelectric effect & Einstein’s theory;3)Hydrogen spectrum & Bohr’s model.1.2Characteristics of the motion of microscopic particles1)Wave-particle duality;2)Uncertainty principle.1.3The basic postulates of quantum mechanics1)Postulate 1: wavefunction;2)Postulate 2: Hermitian operators;3)Postulate 3: Schrödinger equation;4)Postulate 4: linearity and superposition;5)Postulate 5: Pauli exclusion principle.1.4Applications of quantum mechanics in simple cases1)Free particle in one-dimensional (1D) box;2)Applications of the 1D-box model in simple chemical systems;3)Free particle in two-dimensional (2D) & three-dimensional (3D) box;4)Tunneling & scanning tunneling microscopy (STM).Section II (Chapter 2) Structures and properties of atoms2.1 One-electron atom: H atom1)The Schrödinger equation of H atoms;2)Solution of the Schrödinger equation of H atom.2.2Quantum numbers1)Principle quantum number, n;2)Angular momentum quantum number, l;3)Magnetic quantum number, m;4)Zeeman effect.2.3Wavefunction and electron cloud1)Radial distribution;2)Angular distribution;3)Spatial distribution.2.4 Structure of multi-electron atoms1)The Schrödinger equation of multi-electron atoms•Self-consistent field method;•Central field approximation.2)The building-up principles and electron configuration of multi-electron atoms•Pauli exclusion principle;•Principle of minimum energy;Hund’s rule.2.5Electron spin and Pauli exclusion principle2.6Atomic spectroscopy1)Orbital-spin coupling;2)Spectroscopic terms & term symbol;3)Derivation of atomic term.4)Hund’s rule on the spectroscopic terms;2.7Atomic properties1)Energy of ionization;2)Electron affinity;3)Electronegativity.Section III (Chapters 3-6) Structures and properties of molecules Chapter 3 Geometric structure of molecules─Molecular symmetry & symmetry point group3.1Symmetry elements and symmetry operations1)Symmetry elements and symmetry operations;2)Combination rules of symmetry elements;3.2Point groups & symmetry classification of molecules3.3Point groups & groups multiplication3.4Applications of molecular symmetry1)Chirality & optical activity;2)Polarity & dipole moment.Chapter 4 S tructure of biatomic molecules (X2 & XY)4.1 Linear variation method and structure of H2+ ion1) Shrödinger equation of H2+ ion;2) Linear variation method;3) Treatment of H2+ ion using linear variation method;4) Solutions of H2+ ion.4.2 Molecular orbital theory and diatomic molecules1) Molecular orbital theory;2) Structure of homonuclear diatomic molecules (X2);3) Structure of heteronuclear diatomic molecules (XY).4.3 Valence bond (VB) theory and H2 moleculeChapter 5 Structure of polyatomic molecules (A)5.1 Structure of Methane (CH4)1) Delocalized molecular orbitals of methane (CH4);2) Localized molecular orbitals of methane (CH4).5.2 Molecular orbital hybridization1) Theory of molecular orbital hybridization;2) Construction of hybrid orbitals;3) Structure of AB n molecules;4) Molecular stereochemistry: valence shell electron-pair repulsion (VSEPR)model.5.3 Delocalized molecular orbital theory─Hückel molecular orbital (HMO) theory1) HMO method & conjugated systems;2) HMO treatment for butadiene;3) HMO treatment for cyclic conjugated polyene (C n H n);4) Molecular diagrams;5) Delocalized π bonds.5.4 Structure of electron deficient molecules5.5 Symmetry of molecular orbitals and symmetry rules for molecular reactions5.6 Molecular spectroscopy1)Infrared absorption spectroscopy: molecular vibrations;2)Raman scattering spectroscopy: molecular vibrations;3)Fluorescence spectroscopy: electronic transitions;4)NMR spectroscopy: nuclear magnetic resonances.Chapter 6 Structure of polyatomic molecules (B), coordination compounds 6.1 Crystal field theory6.2 CO and N2 coordination complexes6.3 Organic metal complexes1) Zeise’s salts;2) Sandwich complexes.6.4 Clusters1) Transition-metal cluster compounds2) Carbon clusters and nanotubesSection IV (Chapters 7-9) Structure of crystalsChapter 7 Basics of crystallography7.1 Periodicity and lattices of crystal structure1) Characteristics of crystal structure;2) Lattices and unit cells;3) Bravais lattices and unit cells of crystals;4) Real crystals & crystal defects.7.2 Symmetry in crystal structure1) Symmetry elements and symmetry operations;2) Point groups (32) and space groups (230).7.3 X-Ray diffraction of crystals1) X-ray diffraction of crystals•Laue equation;•Bragg’s law;•Reciprocal lattice.2) Instrumentation of X-ray diffraction;3) Applications of X-Ray diffraction•Single crystal diffraction: crystal structure determination;•Powder diffraction: qualitative & quantitative analysis of crystalline materialsChapter 8 Crystalline solids, I: metals and alloys8.1 Close Packing of Spheres1) Close packing of identical spheres;2) Packing density;3) Interstices.8.2 Structures and Properties of Pure Metals8.3 Structures and Properties of AlloyChapter 9 Crystalline solids, II: ionic crystals9.1 Packing of Ions;9.2 Crystal Structure of Some Typical Ionic Compounds9.3 Trend of Variation of Ionic Radii9.4 Pauling Rule of Ionic Crystal Structure9.5 Crystals of Functional Materials1) Nonlinear optical materials;2) Magnetic materials;3) Conductive polymers;4) Semiconductors: band gap and photocatalysisIII.Table of ScheduleReferences[1] 王荣顺主编,东北师范大学等,《结构化学》,高等教育出版社,2003年。
煤的化学结构及仪器分析方法
第31卷第5期辽宁工程技术大学学报(自然科学版)2012年10月Vol.31No.5Journal of Liaoning Technical University (Natural Science )Oct.2012收稿日期:2012-05-19基金项目:国家自然科学基金重点项目(50834002)作者简介:高飞(1984-),辽宁葫芦岛人,助教,理学硕士,主要从事煤结构的实验理论研究.本文编校:张凡文章编号:1008-0562(2012)05-0720-04煤的化学结构及仪器分析方法高飞,邓存宝,王雪峰,邓汉忠,张勋(辽宁工程技术大学安全科学与工程学院,辽宁阜新123000)摘要:针对煤的氧化自燃理论的深入研究,结合煤结构的分析仪器,对不同变质程度煤的XRD 光谱、拉曼光谱、红外光谱以及原子力显微镜等实验方法进行了研究,并对不同变质程度煤的实验数据所呈现出的规律性变化进行了讨论.研究发现,X-射线衍射法能够揭示煤中原子排列的有序性等信息;IR 光谱和Raman 光谱能够得到煤中所含有官能团的种类、脂肪以及芳香结构等方面信息;在原子力显微镜下可以观测到煤表面微结构等相关信息.关键词:煤;煤化程度;煤结构;仪器分析;XRD ;Raman ;IR ;AFM 中图分类号:X936文献标志码:ACoal chemical structure and its instrumental analysis methodG AO Fei,DENG Cunbao,WANG Xuefeng,DENG Hanzhong,ZHANG Xun(College of Safety Science a nd Engineer ing,Liaoning Technica l Univer sity ,Fuxin 123000,China )Abstra ct:In order to study the oxidation of coal spontaneous combustion theory,this paper briefly overviews the method of instrumental analysis on coal structure.Based on the study on coal chemical structure using XRD,Raman spectroscopy ,infrared spectroscopy and atomic force microscopy images,it is found that the coal structure shows a regular change with the continuous improvement of coal ranking.The study demonstrates that the information of ordered atomic arrangement can be observed by XRD;the information of functional groups and aromaticity can be characterized by IR spectroscopy;the first coalification jump can be characterized by Raman spectroscopy and the micro-structure information at coal surface can be observed by atomic force microscopy .Key wor ds:coal;coal rank;coal structure;instrumental analysis;XRD;Raman;IR;AFM0引言煤炭自燃是威胁煤矿安全生产的重大灾害之一.煤是一种由多种官能团、多种化学键组成的复杂的有机大分子,因此煤炭自燃是一个非常复杂的物理化学变化过程.从结构化学来看,煤是一种短程有序、长程无序,且具有层次结构的非晶态固体物质,其化学结构的研究,对分析煤的化学性质以及研究煤的氧化自燃理论具有重要意义.从成因来看,煤具有阶段性演化特征,即从褐煤经烟煤至无烟煤的演化,其物理、化学性质的演变具有阶段性演化的特点.自1830年煤的起源问题解决后,科学家将目光逐步转向煤结构的研究.20世纪初,科学家试图把煤的结构和煤的起源相联系,但发现用这种方式来推断煤结构比较迷茫;除此之外,研究者们试图从一些反应产物来推断煤的结构,但这种方法同样被证明非常困难,因为这些产物几乎和煤本身一样复杂.随着新的仪器分析技术的发展和新实验方法的建立,研究者们尝试用各种实验数据和信息建立煤的结构模型[1-3].1煤结构的分类煤结构研究主要包括化学结构和物理结构的研究.1.1煤的化学结构煤的化学结构是指在煤的有机分子中,原子相互联结的次序和方式.煤主要由碳元素组成,除此之外还有氢、氧、氮、硫等元素,煤具有高碳物料的特征.煤的化学结构模型包括Fuchs 模型、Given 模型、Wiser 模型和Shinn 模型等.如图1.煤不同于一般的高分子有机化合物,它具有特别的复杂性、多样性和不均一性.即使在同一小块煤中,也不存在一个统一的化学结构.第5期高飞,等:煤的化学结构及仪器分析方法721(a)Given模型(b)Wiser模型(c)Shinn 模型图1煤的化学结构模型Fig.1chemical structure model of coal.1.2煤的物理结构传统的物理结构指煤的孔隙结构,主要是指其相界面间空隙及芳香层间的层间隙.煤的芳烃族和官能团之间参差不齐的排列形成了内部空隙,使煤成为多孔性物质,所以煤的物理结构实质上是由煤的化学结构决定的.目前广泛应用的物理结构模型有Hirsch 模型和两相模型(如图2).C80%敞开结构适用于C <85%C89%液体结构适用于C <85%~90%C94%无烟煤结构适用于C >91%(a)Hirsh 模型(b)两相模型图2煤的物理结构模型Fig.2physical structure model of coal.2煤结构的仪器分析方法长期以来人们对煤的化学结构的研究方法可以归纳为物理化学方法、化学方法、物理方法.其中溶剂抽提、吸附性能和物化特性法等属于物理化学研究方法,氧化、加氢、卤化、解聚、热解、烷基化和官能团分析等属于化学研究方法.物理研究方法是使用现代分析仪器,如X-射线、红外光谱、拉曼光谱以及原子力显微镜等仪器对煤结构进行解析.2.1X-射线衍射分析法(XRD )用X-射线衍射法分析晶体结构时,衍射方向及衍射强度可以体现出晶胞的形状和大小及原子在晶胞中的排列方式等信息.煤虽然不是晶体,但是随着煤化程度的加深,X-射线分析能揭示煤中原子排列的有序性等信息.王丽等[4-5]人对七种不同变质程度煤的XRD 谱图进行分析,如图3,随着变质程度的增加,微晶参数呈现规律性变化,煤的结构转变得越来越接近石墨结构.这是因为随着时间的增加,煤不断发生裂解与聚合反应,因此碳原子层之间的距离(d(002))芳环、氢化芳环脂键、醚键小分子C94%无烟煤结构适用于C>91%C89%液体结构适用于C<85%~90%C80%敞开结构适用于C<85%交联键芳香层片孔无定形结构2nm单独层片和无定形结构0.8nm0.8nm2nm辽宁工程技术大学学报(自然科学版)第31卷722不断缩小,而微晶的尺寸不断地扩大.所以,煤的La 与Lc 和d 的数值就更加接近石墨的参数.图3不同变质程度煤的XRD 谱图Fig.3XRD spectrum of different coal rank.2.2红外(IR )光谱IR 光谱中吸收峰的位置和强度取决于分子中各官能团的振动形式以及相邻官能团的影响.因此通过光谱解析,可以确定煤分子中所含有的官能团信息.邓存宝等[6-7]人对不同变质程度煤的红外光谱进行了研究,如图4,烷基侧链的伸缩振动峰(3097~2994cm -1)随着煤化程度的提高而迅速减弱,说明烷基侧链的平均长度随煤化程度提高而缩短至消失.苯酚、伯胺基团中NH 氢和OH 氢的伸缩振动峰(3606~3308cm -1)同样随着煤化程度的提高而迅速减弱,说明煤中含氧、含氮官能团也随煤化程度提高而减少.其中甲氧基消失得最快,在年老褐煤中就几乎不存在了;其次是羧基,到中等煤化程度的烟煤时,羧基已基本消失;羟基和羰基在整个烟煤阶段都存在,甚至在无烟煤阶段还有发现.平庄风水沟矿丝炭北京长沟峪矿无烟煤大同晋华宫矿烟煤平庄红庙矿裼煤500100015002000250030003500Wavenumber cm-10.050.100.150.200.25A b s o r b a n c e U n i t s 0.30图4不同变质程度煤的红外光谱图Fig.4IR spectrum of different coal rank2.3拉曼(Raman )光谱拉曼光谱对碳材料的结构有序状态非常敏感,因此可以为煤结构中原子排列的有序性程度提供非常可靠的信息.曾凡桂等[8-10]人对不同煤级煤的激光拉曼光谱进行了研究(如图5),实验表明在拉曼光谱一级模内存在的两个明显振动峰与碳含量呈现出良好地相关关系,随着碳含量的增加,D 峰位置向低频率区域移动,G 峰位置向高频率区域移动.通过对峰强度与半峰宽的分析,发现半峰宽及峰强比值在碳含量大于75%时与碳含量线性相关.第一次煤化作用跃变便发生在碳含量75%左右时,这说明拉曼光谱特征可以反映第一次煤化作用跃变.图5不同变质程度煤的Raman 光谱Fig.5Raman spectrum of different coal rank.2.4原子力显微镜(AFM )煤层经历了沉积、成岩、变质及变形等多种地质作用后,会在煤层中留下孔隙、裂隙、显微构造等痕迹或标志,全面而系统地研究煤的孔隙、裂隙和煤的表面结构,能够充分揭露煤的内部机构,为煤层气生、储、运过程、机理研究和瓦斯突出煤的研究提供直观性资料.在AFM 下观测煤的表面微结构,可观察到看似光滑的煤表面其实凸凹不平,如图6所示,亮色部分是突起部分,暗色为凹下部分.同时还可以观测到煤表面存在着大小不等的空隙以及裂隙,说明煤是一类多孔性物质.除此之外,AFM 与系统配套软件结合还可以检测到煤块的相对高度和绝对高度以及其它大量煤体微结构的信息.10001200140016001800JC HDT-3SF HDT-2YZ YM HLM ML-3SH-3ML-5Raman shift/cm -1In t e n s i t y 3.0020.0040.0060.00晋城无烟煤西山贫煤峰峰瘦煤峰峰焦煤峰峰肥煤老虎台气煤抚顺长焰煤第5期高飞,等:煤的化学结构及仪器分析方法723图6煤的AFM图像Fig.6The AFM image of coal.2.5煤结构的其它研究方法除上述仪器分析方法外,目前广泛应用于煤结构研究的技术如表1.表1煤结构的仪器分析方法Tab.1Instrumental analysis of the coal structure方法提供的信息密度测定;比表面积测定;小角X射线衍射;核磁共振成像;计算机断层扫描孔容、孔结构、气体吸附与扩散、反应特性电子透射/扫描显微镜(TEM/SEM);扫描隧道显微镜(STM)形貌、表面结构、孔结构、微晶结构紫外-可见光谱(UV-Vis);核磁共振谱(NMR);质谱芳香结构大小;碳、氢原子分布、芳香度、缩合芳香结构;碳原子数分布、碳氢化合物类型、相对分子质量X射线光电子能谱(XPS)、X射线吸收近边谱(XANES)有机S和无机N此外,用X射线径向分布函数法解析煤结构也是近年来的一大特色.3结论通过对上述仪器分析结果的研究,得出以下结论:(1)使用X-射线衍射法能够揭示出煤中原子排列有序性等信息,对不同变质程度煤的XRD谱图分析表明,随着煤化程度的提高,煤的晶体结构逐渐趋近于石墨结构;(2)使用IR光谱和Raman光谱可以对煤中所含有官能团的种类、脂肪以及芳香结构等方面进行研究;对不同变质程度煤的IR和Raman谱图分析表明,随着煤化程度的提高,烷基及含氧官能团等逐渐消失,在碳含量75%左右时,发生第一次煤化作用的跃变.(3)在原子力显微镜下观测到煤表面空隙、裂隙等微结构信息,说明煤是一类多孔性物质.参考文献:[1]Anna Marzec.Toward an understanding of the coal structure:areview[J].Fuel Processing Technology,2002(77/78):25-32.[2]Meyers R.Coal structure[M].New York:Academic Press,1982.[3]琚宜文,李小诗.构造煤超微结构研究新进展[J].自然科学进展,2009,19:131-140.Ju Yiwen,Li Xiaoshi.The new reserch development of construct coal ultrastruct ure[J].Progress in Natural Science,2009,19,131-140.[4]王丽,张蓬洲.煤的XRD的结构分析[J].煤炭转化,1997,20:50-53.W ang Li,Zhang Pengzhou.XRD study of coal structure[J].Coal Conversion,1997,20:50-53.[5]Lu L,Sahajwalla V,Kong C et al.Quantitat ive X-ray DiffractionAnalysis and its Appl ication to Vari ous coals[J].Carbon,2001,39: 1821-1833.[6]Ibarra J V,Munoz E,Moliner R.FT-IR s t udy of the evolution of coalstructure during t he coalification process[J].Organic Geochemistry, 1996,24(6-7):725-735.[7]邓存宝.煤的自燃机理及自燃危险性指数研究[D].阜新:辽宁工程技术大学,2006.Deng Cunbao.The reserch of spontaneous combustion of coal and the spontaneous combustion risk index[D].Fuxi n:Liaoning Technical University,2006.[8]李美芬,曾凡桂.不同煤级煤的Raman谱特征及与XRD结构参数的关系.光谱学与光谱分析[J].2009,29:2446-2449.Li Meifen,Zeng Fangui.Raman spectroscopic characteristics of different rank coals and the relation with XRD structural parameters.Spectroscopy and Spectral Analysis,2009,29:2446-2449.[9]段菁春,庄新国,何谋春.不同变质程度煤的激光拉曼光谱特征[J].地质科技情报,2002,21:65-68.Duan Qingchun,Zhuang Xi nguo,He mouchun.Characteristics in l aser Raman spectrum of different ranks of coal[J].Geological Science and Technology Information,2002,21:65-68.[10]Zerda T W,J ohn A,Chmura K.Raman s t udies of coals[J].Fuel,1981,5:375-378.。
红外光谱(I R)(Infrared Spectroscopy)

红外光谱(I R)(Infrared Spectroscopy)第一节:概述1、红外吸收光谱与紫外吸收光谱一样是一种分子吸收光谱。
红外光的能量(△E=0.05-1.0ev)较紫外光(△E=1-20ev)低,当红外光照射分子时不足以引起分子中价电子能级的跃迁,而能引起分子振动能级和转动能级的跃迁,故红外吸收光谱又称为分子振动光谱或振转光谱。
2、红外光谱的特点:特征性强、适用范围广。
红外光谱对化合物的鉴定和有机物的结构分析具有鲜明的特征性,构成化合物的原子质量不同、化学键的性质不同、原子的连接次序和空间位置不同都会造成红外光谱的差别。
红外光谱对样品的适用性相当广泛,无论固态、液态或气态都可进行测定。
3、红外光谱波长覆盖区域:0.76 mm ~ 1000mm.红外光按其波长的不同又划分为三个区段。
(1)近红外:波长在0.76-2.5mm之间(波数12820-4000cm-1)(2)中红外:波长在2.5-25mm(在4000-400 cm-1)通常所用的红外光谱是在这一段的(2.5-15mm,即 4000-660 cm-1)光谱范围,本章内容仅限于中红外光谱。
(3)远红外:波长在25~1000mm(在400-10 cm-1)转动光谱出现在远红外区。
4、红外光谱图:当物质分子中某个基团的振动频率和红外光的频率一样时,分子就要吸收能量,从原来的振动能级跃迁到能量较高的振动能级,将分子吸收红外光的情况用仪器记录,就得到红外光谱图。
5、红外光谱表示方法:(1)红外光谱图红外光谱图以透光率T%为纵坐标,表示吸收强度,以波长l ( mm)或波数 s (cm-1)为横坐标,表示吸收峰的位置,现主要以波数作横坐标。
波数是频率的一种表示方法(表示每厘米长的光波中波的数目)。
通过吸收峰的位置、相对强度及峰的形状提供化合物结构信息,其中以吸收峰的位置最为重要。
(2)将吸收峰以文字形式表示:如下图可表示为,3525cm-1(m),3097cm-1(m),1637cm-1(s)。
举例说明纳米微粒尺寸常用的方法
举例说明纳米微粒尺寸常用的方法纳米微粒尺寸的测量方法有很多种,下面将介绍常用的10种方法。
1. 透射电子显微镜(Transmission Electron Microscopy,TEM)TEM是一种常用的纳米微粒尺寸测量方法。
它通过透射电子束来观察样品的微观结构,可以直接测量纳米级颗粒的尺寸。
2. 扫描电子显微镜(Scanning Electron Microscopy,SEM)SEM是一种常用的纳米微粒尺寸测量方法。
它通过扫描电子束来观察样品的表面形貌,可以间接推测纳米级颗粒的尺寸。
3. 动态光散射(Dynamic Light Scattering,DLS)DLS是一种常用的纳米微粒尺寸测量方法。
它利用光散射的原理,通过测量散射光的强度和时间的变化,来推测颗粒的大小和分布。
4. X射线衍射(X-ray Diffraction,XRD)XRD是一种常用的纳米微粒尺寸测量方法。
它利用材料对X射线的衍射来推测颗粒的晶格结构和尺寸。
5. 原子力显微镜(Atomic Force Microscopy,AFM)AFM是一种常用的纳米微粒尺寸测量方法。
它通过探针与样品表面进行相互作用,测量力的变化来推测颗粒的尺寸。
6. 扫描隧道显微镜(Scanning Tunneling Microscopy,STM)STM是一种常用的纳米微粒尺寸测量方法。
它利用电子的隧穿效应,通过探针与样品表面的距离变化来推测颗粒的尺寸。
7. 粒度分析仪粒度分析仪是一种常用的纳米微粒尺寸测量方法。
它通过测量样品中颗粒的沉降速度、散射光强度等参数,来推测颗粒的尺寸。
8. 静态光散射(Static Light Scattering,SLS)SLS是一种常用的纳米微粒尺寸测量方法。
它利用光散射的原理,通过测量散射光的强度和角度的变化,来推测颗粒的大小和分布。
9. 红外光谱(Infrared Spectroscopy,IR)红外光谱是一种常用的纳米微粒尺寸测量方法。
红外反射成像(IRR)
红外反射成像(IRR)米尔科·登莱乌(Milko den Leeuw)1.分类红外反射成像(infrared reflectography,IRR)属于非侵入式成像技术。
它利用的红外线属于电磁频谱中非可见光波段。
2.说明红外线可穿透颜料,穿透深度因颜料层厚度、颜料成分和入射红外线的波长而异。
波长较大的波可以穿透大多数颜料层,但会被富碳材料吸收。
IRR与红外照相非常相似,但是它们对反射射线的收集方式不同,因此它们的探测极限也不同。
IRR用的是InGaAs探测器,探测波长较长,对波长高达1700 nm的红外线也非常敏感,能穿透红外照相无法穿透的绿色和蓝色颜料层。
3.应用IRR特别适用于绘画底层素描和底稿的检测。
底层素描或底稿可以显露到什么程度,取决于该层富碳颜料的含量、上方覆盖的颜料层厚度、颜料层中颜料粉的类型以及底料层的颜色。
因此,这项技术可提供的信息包括绘画的结构、画家的技法以及绘画的历史修复和历史状况信息。
4.局限性反射图是由一幅画不同层位的信息集成的二维图像,因此无法分辨一幅画中每个细节的层位深度。
这项技术在收集信息方面的效果也受画中吸收或反射红外线的材料所限,这些材料可能会妨碍目标区域的成像。
铁基墨水素描可能也很难检测,因为铁基墨水不能有效吸收红外线。
此外,颜料层越厚就越难被红外线穿透,因此底层的成像也受颜料层厚度的限制。
反射设备也会为检测带来局限性,它可能会造成光学失真和几何变形,生成的图像通常还需进行后期处理,这也可能会导致错误。
5.补充技术昼光照相术、紫外照相术、红外照相术、红外假彩色照相术、X 射线照相术、X射线荧光成像、K-edge成像以及同步辐射X射线荧光成像。
6.技术规范与注意事项—相机/设备—镜头—曝光时间—感光度(ISO)—红外探测器—红外光源—滤镜7.技术简史第二次世界大战后出现了多种类型的红外设备,但直到20世纪60年代,才开始有研究团队用IRR作为底层素描检测的主要技术,第一个应用这项技术的是布鲁塞尔皇家文化遗产研究所(KIK-IRPA)。
物理专业英语词汇(I)题库

物理专业英语词汇(I)ice 冰ice calorimeter 冰量热计ice model 冰模型iconoscope 光电摄象管icosahedron 二十面体ideal black body 理想黑体ideal constraints 理想拘束ideal crystal 理想晶体ideal fluid 完整铃ideal gas 理想气体ideal gas law 理想气体定律ideal lattice 理想晶格ideal liquid 理想液体ideal solid 理想固体ideal solution 理想溶液ideally imperfect crystal 理想非完满晶体ideally perfect crystal 理想完满晶体identity parameter 晶体参数ignition 点火ignition potential 点火电位ignitron 点火管illuminance 光照度illuminant 光源illuminating engineering 照盲程学illuminating lamp照闷illumination 光照度illumination curve 照度曲线illumination photometer 照度计illumination photometry 照度丈量illuminator 照冒置illuminometer 照度计image 象image analyzer 图象剖析器image charge 象电荷image contrast 象对照度image converter 变象管image converter tube 变象管image distortion 图象失真image force 象力image formation 成象image frequency 象频image hologram 象全息图image iconoscope 图象光电摄象管image intensifier 影象加强器影象放大器image intensifier tube 影象加强器影象放大器image orthicon 超正析象管image parameter 成象参数image pickup tube 摄象管image plane 象平面image point 象点image processing 图象办理image ratio 镜频波道的相对增益image restoration 象恢复image space 象空间image surface 象曲面imagelyzer 图象剖析器immersion 淹没immersion lens 淹没透镜immersion method 淹无法immersion microscope 油浸显微镜immersion objective 淹没物镜immersion refractometer 淹没折射计impact 冲击impact ionization 碰撞电离impact matrix 碰撞矩阵impact parameter 碰撞参数impact parameter method 碰撞参数法impact strength 冲豢度impact stress 冲沪力impact test 冲辉验impedance 阻抗impedance bridge 阻抗电桥impedance matching 阻抗般配imperfect crystal 非完满晶体imperfect gas 非理想气体impressed forces 外力imprisonment of resonance radiation 共振辐射陷获improper variable 准变星impulse 冲击冲量impulse approximation 冲稽似impulse function 脉冲函数impulse generator 脉冲发生器impulse of force 冲量impulsive current 脉冲电流impulsive force 冲力impulsive sound 冲基impulsive tone 撞霍impurity 杂质impurity atom 杂质原子impurity band 杂质能带impurity center 杂质中心impurity conduction 杂质导电impurity level 杂质能级impurity scattering 杂质散射impurity semiconductor 杂质半导体in clockwise direction 向顺时针的方向in counter colckwise direction 向反时针的方向in situ observation 就地察看incandescence 白炽incandescent lamp 白炽灯inch 英寸incidence 入射incidence angle 入射角incident beam 入射束incident light 入射光incident particle 入射粒子incident plane 入射面incident ray 入射光芒incident wave 入射波inclination factor 倾斜因子inclinometer 磁倾计incoherence 非相关性incoherent light 非相关光incoherent scatteering 非相关散射incommensurate structure 不相应构造incompressibility 不行压缩性incompressible flow 不行压缩流indefinite metric 不定胸怀independent atom model 独立原子模型independent particle 独立粒子independent particle model 独立粒子模型independent variable 自变数indeterminancy 不确立性indeterminancy principle 测禁止原理index 指数index of refraction 折射率indicating lamp 指示灯indicator 指示器指示剂indifferent equilibrium 中性均衡indirect exchange interaction 间接交换互相酌indirect illumination 间接照明indirect measurement间接丈量indirect transition 间接跃迁indirectly heated cathode 旁热式阴极indistinguishability of identical particles 全同粒子的不行分辨性indium 铟individual error 人为偏差individual excitation 独自激发induced current 感觉电流induced electromotive force 感觉电动势induced emission 感觉发射induced radioactivity 感觉放射性induced representation 引诱表示inductance 电感感觉系数inductance coil 感觉线圈induction 感觉; 概括induction accelerator 感觉加快器induction coefficient 感觉系数induction coil感觉线圈induction field 感觉磁场induction furnace 感觉电炉induction heating 感觉加热induction method 概括法induction motor 感觉电动机inductive 感觉的inductor coil 感觉线圈indus 印第安座inelastic collision 非弹性碰撞inelastic scattering 非弹性散射inert gas 惰性气体inertia 惯性inertial force 惯性力inertial frame of reference 惯性系inertial mass 惯性质量inertial resistance 惯性阻力inertial system 惯性系inertial wave 惯性波inferior conjunction 下合inferior mirage 下现幻景inferior planet 地行家星infinite medium 无穷介质infinite universe 无穷宇宙infinitesimal rotation 无量小转动infinitesimal transformation 无量小变换inflationary universe 狂涨宇宙inflector 偏转器influence machine感觉起电机information processing 信息办理information quantity 信息量information retrieval 信息恢复information theory 信息论infra acoustic 声下的infra acoustic frequency 亚声频infra sound 次声infranics 红外线电子学infrared 红外线的infrared active 红外激活的infrared astronomical satellite 红外天文卫星infrared astronomy 红外天文学infrared catastrophe 红外灾变infrared divergence 红外发散infrared lamp 红外灯infrared laser 红外激光器infrared magnitude 红外星等infrared microscope 红外线显微镜infrared photocell 红外线光电管infrared photography 红外拍照infrared radiation 红外辐射infrared rays 红外线infrared spectrophotometer 红外分光光度计infrared spectroscopy 红外光谱学infrared spectrum 红外光谱inhomogeneous broadening 非平均增宽inhomogeneous plasma 非平均等离子体inhomogeneous superconductor 非均质超导体inhomogeneous universe 非平均宇宙initial black hole 原始黑洞initial permeability 初始磁导率initial phase 初相initial state 初态initial stress 初应力initial velocity 初速度injection 注入injection laser 注入型激光器注入型二极管激光器injector accelerator 注入加快器injury 损害inlet pressure 入口压力inner bremsstrahlung 内韧致辐射inner corona 内冕inner electron 内层电子inner product 内积inner quantum number 内量子数inner shell 内壳层input 输入input output channel 输入输出通道input output unit 输出输入装置input program 输入程序input routine 输入程序insolation 日射inspection 检查instability 不稳固性instability energy 不稳固能instantaneous axis of rotation 刹时转动轴instantaneous neutron 瞬发中子instantaneous pole 刹时极instantaneous power 刹时功率instanton 瞬子instruction 指令instrument 仪器仪表instrument transformer 仪表变换器instrumental error 仪企差instrumental function 仪漂数insulating paper绝缘纸insulating transformer 绝缘变压器insulation 绝缘insulation resistance 绝缘电阻insulator 绝缘体integral calculus 积分学integral equation 积分方程integral invariant 积分不变式integral transform 积分变换integrated circuit 集成电路integrated optics 集成光学integrated reflection intensity 积分反射强度integrating sphere 乌布利希球integrating wattmeter 积累瓦特计integration circuit 积分电路integration type analog to digital conversion 积分型模拟数字变换intense slow positron beam 强慢速阳电子束intensifier 加厚剂intensity 强度intensity alternation 强度交变intensity factors of spectral lines 谱线强度因子intensity modulation 亮度灯intensity of magnetic field 磁场强度intensity of magnetization 磁化强度intensity of radioactivity 放射性强度intensity of sound 声强intensity region 强度范围intensive quantity 内包量intensive variable 示强变量interaction 互相酌interaction energy 互相酌能interaction force 互相酌力interaction potential 互相酌势interaction range 互相酌区interatomic 原子间的interatomic distance 原子间距离interatomic forces 原子间力intercalation 夹层interchange instability 变换不稳固性interchangeability 交换性intercombination 互相组合intercrystalline 晶粒间的interdiffusion 互扩散interface 界限面interfacial electric phenomenon 界面电现象interfacial potential 界面势interfacial tension 界面张力interfacial viscosity 界面粘性interference 干预interference color 扰乱色interference filter 扰乱滤光片interference fringe 干预条纹interference microscope 干预显微镜interference of equal inclination 等倾角干预interference of equal thickness 等厚度干预interference of light 光的干预interference of polarized light 偏振光的干预interference refractometer 干预折射计interference spectroscope 干预分光镜interferometer 干预仪interferometry 干预胸怀学intergalactic matter 星系际物质intergalactic space 星系际空间intermediate coupling 中间耦合intermediate energy 中间能量intermediate energy physics 中能物理学intermediate frequency 中频intermediate frequency transformer 中频变换器intermediate image 中间影象intermediate neutron 中速中子intermediate nucleus 复核intermediate orbit 中间轨道intermediate state 中间态intermediate vector boson 弱玻色子intermetallic compounds 金属间化合物intermittent discharge 间歇放电intermolecular 分子间的intermolecular force 分子间力intermolecular interaction 分子间互相酌internal adsorption 内吸附internal conversion 内变换internal conversion electron 内变换电子internal electron pair creation 内电子对产生internal energy 内能internal exposure 内照耀internal force 内力internal friction 内摩擦internal impedance 内阻抗internal ionization 内电离internal magnetic field 内磁场internal photoelectric effect 内光电效应internal pressure 内压internal quantum number 内量子数internal reflection 内反射internal resistance 内阻internal rotation 内旋转internal storage 内部储存器internal stress 内应力internal target 内靶internal viscosity 内粘滞international atomic time 国际原子时international geophysical year 国际地球物理年international latitude service 国际纬度服务international practical temperature scale 国际适用温标international prototype metre 国际米原器international standard atomsphere 国际标准大气international system of units 国际单位制international temperature scale 国际温标international thermonuclear experimental reactor 国际热核实验反响堆international unit 国际单位interpenetration 互相穿透interplanar crystal spacing 晶面间距interplanetary dust 行星际灰尘interplanetary magnetic field 行星际磁场interplanetary matter 行星际物质interplanetary space 行星际空间interpolation formula 内插公式interrupt 中止interrupter 断续器interspace 缝隙interstellar absorption 星际汲取interstellar absorption line 星际线interstellar cloud 星际云interstellar dust 星际灰尘interstellar gas 星际气体interstellar line 星际线interstellar magnetic field 星际磁场interstellar matter 星际物质interstellar molecule 星际分子interstellar reddening 星际红化interstellar space 星际空间interstice 缝隙interstitial alloy 填隙式合金interstitial atom 填隙原子interstitial diffusion 填隙式扩散interstitial ion 填隙离子interstitial solid solution 填隙式固溶体interval间隔interval rule 间隔规则intraatomic 原子内的intracrystalline 晶体内的intramolecular分子内的intramolecular bond 分子内键intramolecular forces 分子内力intramolecular rotation 分子内转动intrinsic conduction 本占电intrinsic energy 内能intrinsic magnetic moment 固有磁矩intrinsic magnetization 内倥化intrinsic parity 内兕称intrinsic permeability 固有磁导率intrinsic semiconductor 本针导体intrinsic viscosity 本粘性intrinsic wavelength 固有波长invar 殷钢invariable plane 不变平面invariance 不变性invariant 不变式invariant of strain 应变不变量invariant subgroup 不变子群inverse circuit 反演电路inverse compton effect 逆康普顿效应inverse fluorite structure 逆萤石构造inverse photoelectric effect 逆光电效应inverse photoelectron spectroscopy 逆光电光谱学inverse piezoelectric effect 逆压电效应inverse predissociation 逆前级离解inverse problem 逆问题inverse process 逆过程inverse proportion 反比率inverse raman effect 反转喇曼效应inverse raman spectroscopy反转喇曼光谱学inverse reaction 逆反响inverse scattering method 逆散射法inverse spinel 反尖晶石inverse spinel structure 反尖晶石型构造inverse square law 平方反比律inverse transformation 逆变换inverse voltage 逆电压inverse zeeman effect 反向塞曼效应inversion 反演inversion axis 反演轴inversion doublet 反转两重线inversion formula 反演公式inversion layer 反转层 ; 逆温层inversion spectrum 反转光谱inversion system 倒象系inversion temperature 变换温度invert 反演inverted magnetron gage 逆磁控管计inverted multiplet 反转多重态inverted term颠倒项inverter 逆变换装置inviscid flow 无粘性流invisible radiation 不行见的辐射invisible rays 不行见的射线iodine 碘ion 离子ion accelerator 离子加快器ion acceptor 离子接受体ion acoustic instability 离子声波不稳固性ion activity 离子活度ion avalanche 离子雪崩ion beam 离子束ion beam probe 离子束探针ion bombardment 离子轰击ion channelling 离子沟道效应ion cloud 离子云ion cluster 离子簇ion concentration 离子浓度ion condensation 离子凝集ion cyclotron frequency 离子盘旋频次ion cyclotron resonance heating 离子盘旋共振加热ion cyclotron resonance method 离子盘旋共振法ion density 离子密度ion diffusion 离子扩散ion electron recombination 离子电子再化合ion exchange 离子交换ion exchange resin 离子交换尸ion impact 离子碰撞ion implantation 离子注入ion implanted junction 离子注入结ion induced desorption 离子感觉退吸ion induced x ray analysis 离子感觉 x 射线剖析ion lattice 离子晶格ion loss 离子消耗ion microprobe analyzer 离子微探针剖析器ion microscope 离子显微镜ion molecule 离子型分子ion neutralization 离子中和ion neutralization spectroscopy 离子中和波谱学ion optics 离子光学ion orbit 离子轨道ion pair 离子对ion pair formation 离子对生成ion plasma frequency 离子等离子体频次ion pump 离子泵ion recombination 离子复合ion saturation current 离子饱和电流ion scattering spectroscopy 离子散射能谱学ion selective electrode 离子选择电极ion sheath 离子鞘ion source 离子源ion temperature 离子温度ion trap 离子圈套ion yield 离子产额ionic atmosphere 离子氛围ionic bond 异极键ionic charge 离子电荷ionic compound 离子化合物ionic conduction 离子导电ionic crystal 离子晶体ionic current 离子电流ionic laser 离子激光器ionic migration 离子迁徙ionic mobility 离子迁徙率ionic molecule 离子型分子ionic polymerization 离子聚合ionic radius 离子半径ionic recombination 离子复合ionic strength 离子强度ionic structure 离子构造ionium 锾ionization 电离ionization by collision 碰撞电离ionization chamber 电离室ionization current 电离电流ionization density 电离密度ionization fluctuation 电离涨落ionization limit 电离极限ionization loss 电离损失ionization potential 电离电势ionization power 致电离能力ionization rate 电离率ionization vacuumgage 电离真空计ionized atom 电离原子ionized layer 电离层ionizer 电离装置ionizing energy 电离能量ionizing power 致电离能力ionizing radiation 电离线ionoluminescence 离子发光ionometer离子计ionosphere电离层ionospheric disturbance电离层扰动ionospheric storm 电离层暴iras object iras 天体iridescence 虹色iridium 铱iris 可变光栏iris diaphragm锁定光栏iris type accelerator guide 隔阂型加快波导管iron 铁iron constantan thermocouple 铁康铜热电偶iron group elements 铁族元素iron loss 铁耗irradiation 辐照irradiation damage 辐照损害irradiation hardening 辐照硬化irradiation reactor 辐照用堆irreducible representation 不行约表示irregular galaxy 不规则星系irregular nebula 不规则星云irregular reflection 不规则反射irregular variable 不规则变星irreversibility 不行逆性irreversible process 不行逆过程irreversible reaction 不行逆反响irrotational field 非旋场isentrope 等熵线isentropic analysis 等熵剖析isentropic surface 等熵面ising model 伊辛模型isoanomalous line 等异样线isobar 等压线isobaric 等压的isobaric analog resonance同质异位素相像共振isobaric analog state 同质异位素相像态isobaric process 等压过程isobaric surface 等压面isocandle diagram 等烛光图isochor 等容线isochromatic 等色的isochromatic line 等色线isochromatic surface 等色面isochrone 等时线isochronism 等时性isochronous cyclotron 等时性盘旋加快器isoclinal 等倾线isoclinal line 等倾线isoclinic line 等倾线isodiaphere 同差素isodynamic line 等力线isoelectric point 等电点isogon 等偏线isolated point 孤点isolation 隔绝isolator 隔绝器绝缘体isolux curve 等照度线isomagnetism 等偏isomer 同质异能素isomer shift 同质异能位移isomeric state 同质异能态isomeric transition 同质异能跃迁isomerism 同质异能性isomerization energy 同质异能化能isometric process 等容过程isomorphism 同构isopycnic 等密度的isopycnic line 等密度线isospace 电荷空间isospin 同位旋isostasy 地壳均衡说isostere 等比容线isosteric molecule 电子等排分子isotherm 等温线isothermal 等温的isothermal atmosphere 等温大气isothermal change 等温变化isothermal equilibrium 等温均衡isothermal expansion 等温膨胀isothermal process 等温过程isotone 同中子素isotope 同位素isotope analysis 同位素剖析isotope effect 同位素效应isotope incoherence 同位素非相关性isotope separation 同位素分别isotope separator 同位素分别器isotope shift 同位素位移isotopic abundance 同位素丰度isotopic dating 同位素测年纪isotopic invariance 同位旋不变性isotopic spin同位旋isotopic tracer 示踪同位素isotropic scattering 蛤同性散射isotropic turbulence 蛤同性湍流isotropic universe 蛤同性宇宙isotropy 蛤同性iterative method 迭代法itinerant electron 巡回电子itinerant electron magnetism 遍历电子磁性。
常用分析化学专业英语词汇

常用分析化学专业英语词汇1. Analytical chemistry - 分析化学2. Sample - 样品3. Analyte - 分析物4. Instrument - 仪器设备5. Chromatography - 色谱法6. Spectroscopy - 光谱学7. Mass spectrometry - 质谱法8. Gas chromatography - 气相色谱9. Liquid chromatography - 液相色谱10. UV-visible spectroscopy - 紫外-可见光谱11. Infrared spectroscopy - 红外光谱12. Nuclear magnetic resonance spectroscopy - 核磁共振光谱13. Atomic absorption spectrometry - 原子吸收光谱14. Flame atomic absorption spectrophotometry - 火焰原子吸收光谱法15. Inductively coupled plasma mass spectrometry - 电感耦合等离子质谱法16.pH-酸碱度/pH值17. Standard solution - 标准溶液18. Calibration - 校准19. Quantitative analysis - 定量分析20. Qualitative analysis - 定性分析21. Accuracy - 准确性22. Precision - 精密度23. Sensitivity - 灵敏度24. Selectivity - 选择性25. Limit of detection (LOD) - 检测限26. Limit of quantification (LOQ) - 定量限27. Method validation - 方法验证28. Method development - 方法开发29. Quality control - 质量控制30. Analytical technique - 分析技术31. Chemical reaction - 化学反应32. Titration - 滴定33. Electrochemistry - 电化学34. Ion chromatography - 离子色谱35. Atomic force microscopy - 原子力显微镜36. Analytical balance - 分析天平37. Data analysis - 数据分析38. Statistical analysis - 统计分析39. Error propagation - 误差传递。
有机化学中的核磁共振与红外光谱
有机化学中的核磁共振与红外光谱核磁共振(Nuclear Magnetic Resonance,NMR)和红外光谱(Infrared Spectroscopy,IR)是有机化学中常用的分析技术,能够提供有机分子结构和官能团的信息。
本文将介绍核磁共振和红外光谱的原理、应用以及在有机化学中的重要性。
一、核磁共振核磁共振是一种基于核自旋与外加磁场相互作用的分析技术。
其原理是利用核自旋磁矩在外加磁场下的取向分布和磁矩的相互作用,通过外加射频信号的作用,使核自旋能级间的跃迁发生,从而产生共振信号。
核磁共振技术广泛应用于有机化学中,可以用于确定有机化合物的分子结构、官能团以及有机反应过程的动力学研究。
核磁共振谱图通常由化学位移、积分强度和耦合常数等信息构成。
化学位移是指核磁共振信号相对于参考物质(一般以四氢呋喃或三甲基硅氢酮为参考物质)的相对位置,可以通过核磁共振频率进行定量测定。
积分强度表示每个核磁共振峰的相对积分面积,反映了各个核的数量比例关系。
耦合常数则提供了有机分子中质子之间的相互作用情况,可以用于确定分子结构以及官能团的位置。
核磁共振在有机化学研究中的应用广泛,其中一个重要的应用是结构鉴定。
通过分析核磁共振谱图,可以确定有机化合物的分子式以及分子结构,包括碳骨架的排列、官能团的存在以及官能团的位置。
此外,核磁共振还可以用于研究反应动力学,通过观察反应中的中间体或过渡态的核磁共振信号变化,推断出反应机理,并探究反应速率和活化能。
二、红外光谱红外光谱是一种基于分子振动引起的能级跃迁的分析技术。
当物质受到红外光的辐射时,分子内部的化学键能够吸收特定频率的红外光,产生振动和转动的能级跃迁。
红外光谱图通常由吸收带的位置和强度构成,吸收带的位置对应于不同的官能团或化学键,吸收强度与特定官能团或化学键的相对数量相关。
红外光谱在有机化学研究中有着广泛的应用,其重要性不可忽视。
首先,红外光谱可用于识别官能团和化学键。
光谱法分为下列几大类

光谱法分类光谱法是分析化学中常用的一种分析技术,它基于物质与电磁辐射之间的相互作用关系,通过测量样品对辐射的吸收、发射、散射等现象来获得有关样品成分和性质的信息。
根据不同的原理和应用领域,光谱法可以分为下列几大类:1.紫外-可见吸收光谱法(UV-Vis Spectroscopy):紫外-可见吸收光谱法是测量样品对紫外光和可见光的吸收情况,利用物质分子电子跃迁的特性获取信息。
通过测量样品在特定波长范围内的吸收强度,可以推断样品的物质成分、浓度、反应动力学等。
2.红外光谱法(Infrared Spectroscopy):红外光谱法通过测量样品对红外光的吸收及散射行为来获得信息。
红外光谱主要用于研究物质的分子结构和化学键的类型、官能团的存在与否、样品的组成等。
3.核磁共振光谱法(Nuclear Magnetic Resonance Spectroscopy,NMR):核磁共振光谱法是利用样品中的核自旋与外加强磁场相互作用的原理。
通过测量核磁共振信号的频率和强度,可以确定样品的结构、物质的构象、体系的动力学行为等。
4.质谱法(Mass Spectrometry):质谱法通过将样品中的分子或原子离子化并分离,然后根据它们的质荷比通过质谱仪进行检测和测量。
质谱法广泛应用于物质的组成分析、结构鉴定、分子质量测定、代谢产物的研究等。
5.荧光光谱法(Fluorescence Spectroscopy):荧光光谱法利用样品吸收光能后再辐射出较长波长的荧光光,测量荧光的强度和发射光谱,从而研究样品的性质和活性。
荧光光谱法在药物分析、生物分析、环境检测等领域具有重要的应用价值。
除了上述主要的光谱法,还有许多其他类型的光谱法,如原子吸收光谱法(Atomic Absorption Spectroscopy)、拉曼光谱法(Raman Spectroscopy)、电子自旋共振光谱法(Electron Spin Resonance Spectroscopy)等。
本科生、分析研究生均可使用《化学》中常见词汇的中英对照
《分析化学》中常见词汇的中英对照第一章绪论分析化学:analytical chemistry定性分析:qualitative analysis定量分析:quantitative analysis物理分析:physical analysis 物理化学分析:physico-chemical analysis仪器分析法:instrumental analysis流动注射分析法:flow injection analysis;FIA顺序注射分析法:sequentical injection analysis。
SIA化学计量学:chemometrics第二章误差的分析数据处理绝对误差:absolute error 相对误差:relative error系统误差:systematic error 可定误差:determinate error 随机误差:accidental error 不可定误差:indeterminate error准确度:accuracy精确度:precision偏差:debiation,d平均偏差:average debiation 相对平均偏差:relative average debiation标准偏差<标准差):standerd deviation。
S相对平均偏差:relatibe standard deviation。
RSD变异系数:coefficient of variation误差传递:propagation of error有效数字:significant figure 置信水平:confidence level显著性水平:level of significance合并标准偏差<组合标准差):pooled standard debiation 舍弃商:rejectionquotient 。
Q化学定量分析第三章滴定分析概论滴定分析法:titrametric analysis滴定:titration容量分析法:volumetric analysis化学计量点:stoichiometric point等当点:equivalent point电荷平衡:charge balance电荷平衡式:charge balance equation质量平衡:mass balance物料平衡:material balance 质量平衡式:mass balance equation第四章酸碱滴定法酸碱滴定法:acid-base titrations质子自递反应:autoprotolysis reaction质子自递常数:autoprotolysis constant质子条件式:proton balance equation酸碱指示剂:acid-base indicator指示剂常数:indicator constant变色范围:colour change interval混合指示剂:mixed indicator 双指示剂滴定法:double indicator titration第五章非水滴定法非水滴定法:nonaqueous titrations质子溶剂:protonic solvent 酸性溶剂:acid solvent碱性溶剂:basic solvent两性溶剂:amphototeric solvent无质子溶剂:aprotic solvent 均化效应:differentiating effect区分性溶剂:differentiating solvent离子化:ionization离解:dissociation结晶紫:crystal violet萘酚苯甲醇: α-naphthalphenol benzyl alcohol奎哪啶红:quinadinered百里酚蓝:thymol blue 偶氮紫:azo violet溴酚蓝:bromophenol blue第六章配位滴定法配位滴定法:compleximetry乙二胺四乙酸:ethylenediamine tetraacetic acid,EDTA螯合物:chelate compound金属指示剂:metal lochrome indcator第七章氧化还原滴定法氧化还原滴定法:oxidation-reduction titration碘量法:iodimetry溴量法:bromimetry ]溴量法:bromine method铈量法:cerimetry高锰酸钾法:potassium permanganate method条件电位:conditional potential溴酸钾法:potassium bromate method硫酸铈法:cerium sulphate method偏高碘酸:metaperiodic acid 高碘酸盐:periodate亚硝酸钠法:sodium nitrite method重氮化反应:diazotization reaction重氮化滴定法:diazotization titration亚硝基化反应:nitrozation reaction亚硝基化滴定法:nitrozation titration外指示剂:external indicator 外指示剂:outside indicator 重铬酸钾法:potassium dichromate method第八章沉淀滴定法沉淀滴定法:precipitation titration容量滴定法:volumetric precipitation method银量法:argentometric method 第九章重量分析法重量分析法:gravimetric analysis挥发法:volatilization method引湿水<湿存水):water of hydroscopicity包埋(藏>水:occluded water 吸入水:water of imbibition 结晶水:water of crystallization组成水:water of composition 液-液萃取法:liquid-liquid extration溶剂萃取法:solvent extration反萃取:counter extraction 分配系数:partitioncoefficient分配比:distribution ratio 离子对<离子缔合物):ion pair沉淀形式:precipitation forms称量形式:weighing forms 《分析化学》下册仪器分析概述物理分析:physical analysis 物理化学分析:physicochemical analysis仪器分析:instrumental analysis第十章电位法及永停滴定法电化学分析:electrochemical analysis电解法:electrolytic analysis method电重量法:electtogravimetry 库仑法:coulometry 库仑滴定法:coulometric titration电导法:conductometry电导分析法:conductometric analysis电导滴定法:conductometric titration电位法:potentiometry直接电位法:dirext potentiometry电位滴定法:potentiometric titration伏安法:voltammetry极谱法:polarography溶出法:stripping method电流滴定法:amperometric titration化学双电层:chemical double layer相界电位:phase boundary potential金属电极电位:electrodepotential化学电池:chemical cell液接界面:liquid junction boundary原电池:galvanic cell电解池:electrolytic cell 负极:cathrode正极:anode电池电动势:eletromotive force指示电极:indicator electrode参比电极:reference electroade标准氢电极:standard hydrogen electrode一级参比电极:primary reference electrode饱和甘汞电极:standard calomel electrode银-氯化银电极:silver silver-chloride electrode 液接界面:liquid junction boundary不对称电位:asymmetry potential表观PH值:apparent PH复合PH电极:combination PH electrode离子选择电极:ion selective electrode敏感器:sensor晶体电极:crystalline electrodes均相膜电极:homogeneous membrance electrodes非均相膜电极:heterog eneous membrance electrodes非晶体电极:non- crystalline electrodes刚性基质电极:rigid matrix electrode流流体载动电极:electrode with a mobile carrier气敏电极:gas sensing electrodes酶电极:enzyme electrodes金属氧化物半导体场效应晶体管:MOSFET离子选择场效应管:ISFET总离子强度调节缓冲剂:total ion strength adjustment buffer,TISAB永停滴定法:dead-stop titration双电流滴定法<双安培滴定法):double amperometric titration第十一章光谱分析法概论普朗克常数:Plank constant 电磁波谱:electromagnetic spectrum光谱:spectrum光谱分析法:spectroscopic analysis原子发射光谱法:atomic emission spectroscopy质量谱:mass spectrum质谱法:mass spectroscopy,MS 第十二章紫外-可见分光光度法紫外-可见分光光度法:ultraviolet and visible spectrophotometry。
碳基单原子催化剂需要用的表征手段
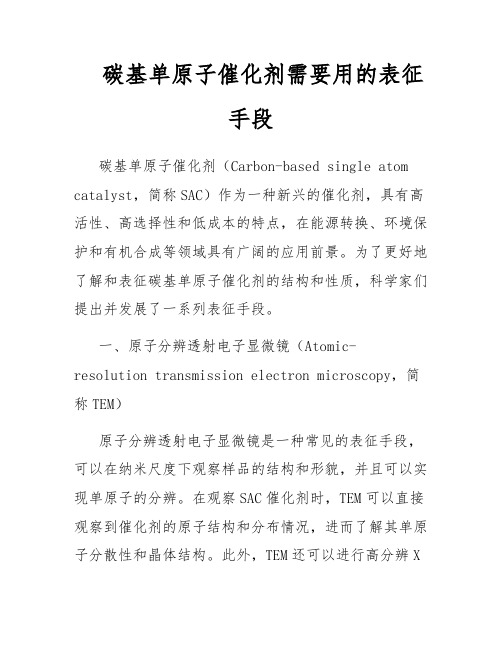
碳基单原子催化剂需要用的表征手段碳基单原子催化剂(Carbon-based single atom catalyst,简称SAC)作为一种新兴的催化剂,具有高活性、高选择性和低成本的特点,在能源转换、环境保护和有机合成等领域具有广阔的应用前景。
为了更好地了解和表征碳基单原子催化剂的结构和性质,科学家们提出并发展了一系列表征手段。
一、原子分辨透射电子显微镜(Atomic-resolution transmission electron microscopy,简称TEM)原子分辨透射电子显微镜是一种常见的表征手段,可以在纳米尺度下观察样品的结构和形貌,并且可以实现单原子的分辨。
在观察SAC催化剂时,TEM可以直接观察到催化剂的原子结构和分布情况,进而了解其单原子分散性和晶体结构。
此外,TEM还可以进行高分辨X射线能谱分析(Energy dispersive X-ray spectroscopy,简称EDS)和电子能谱分析(Electron energy loss spectroscopy,简称EELS),以进一步确定催化剂的元素组成和化学状态。
二、X 射线吸收近边结构谱(X-ray absorption near-edge structure,简称XANES)和巴伦谱XANES和巴伦谱是准直光束与样品相互作用时产生的特殊X射线吸收谱。
通过X射线光谱仪可以获得样品在不同吸收边的吸收谱线,进而分析样品的化学组成和原子的价态。
对于SAC催化剂,XANES和巴伦谱能够提供关于催化剂的电子结构、价态和活性位点等信息,以及原子间的相互作用情况。
此外,藉由与理论计算相结合,可以更准确地推测出催化剂的元素组成和结构。
三、表面扩散反射红外光谱(Diffuse Reflectance Infrared Fourier Transform Spectroscopy,简称DRIFTS)DRIFTS 是一种可以表征催化剂表面吸附物种的手段,可以推断催化剂上的功能基团、催化反应的中间产物以及与催化剂表面相互作用的反应物种。
分析化学常用仪器英文名称

stretching vibration对称伸缩振动:Symmetrical stretching vibration 不对称伸缩振动:asymmetrical stretching vibration 弯曲振动:bending vibrati on变形振动:formati on vibrati on面内弯曲振动:in -pla ne bending vibratio n, B剪式振动:Scissori ng vibrati on, S面内摇摆振动:rock ing vibrati on, p面外弯曲振动:out- of-plane bending vibration, 丫面外摇摆振动:Wagg ing vibrati on, 3蜷曲振动:twisti ng vibrati on , T对称变形振动:symmetrical deformati on vibrati on , S不对称变形振动:asymmetrical deformati on vibrati on, 特征吸收峰:characteristic absorption band 特征频率:characteristic freque ncy 相关吸收峰:correlatio n absorpti on band 杂化影响:Hybridizati on affect环大小效应:ring size effect柱色谱法:colu mn chromatography 填充柱:packed column 毛细管柱:capillary colu mn 微填充柱:Microbore packed colu mn高效液相色谱法:high performa nee liquid chromatography,HPLC 平板色谱法:pla nar 平板色谱法:pla ne chromatography 纸色谱法:paper chromatography薄层色谱法:thin layer chromatography,TLC 薄膜色谱法;thin filmchomatography 毛细管电泳法:capillary electrophoresis,CE分配色谱法:Partiti on chromatography吸附色谱法:absorpti on chromaography离子交换色谱法:ion excha nge chromatography,IEC空间排阻色谱法:Steric exclusi on chromatography,SEC亲和色谱法:Affin ity chromatography分配系数:distributio n cofficie nt狭义分配系数:partiti on coefficie nt 凝胶色谱法:gel chromatography 凝胶渗透色谱法:gel permeatio n chromatography,GPC凝胶过滤色谱法:gel filtrati on chromatography,GFC反相液相色谱法reversed phase liquid chromatography RPLC 柱液相色谱法liquid colu mn chromatography高效液相色谱法high performanee liquid chromatography, HPLC 尺寸排除色谱法size exclusion chromatography SEC凝胶过滤色谱法gel filtration chromatography凝胶渗透色谱法gel permeation chromatography GPC离子交换色谱法ion excha nge chromatography IEC离子色谱法ion chromatography离子抑制色谱法ion suppressi on chromatography离子对色谱法ion pair chromatography疏水作用色谱法hydrophobic in teract ion chromatography制备液相色谱法preparative liquid chromatography平面色谱法pla nar chromatography纸色谱法paper chromatography薄层色谱法thin layer chromatography, TLC高效薄层色谱法high performa nee thin layer chromatography HPTLC 浸渍薄层色谱法impreg nated thin layer chromatography。
碳纳米管的制备工艺与表征
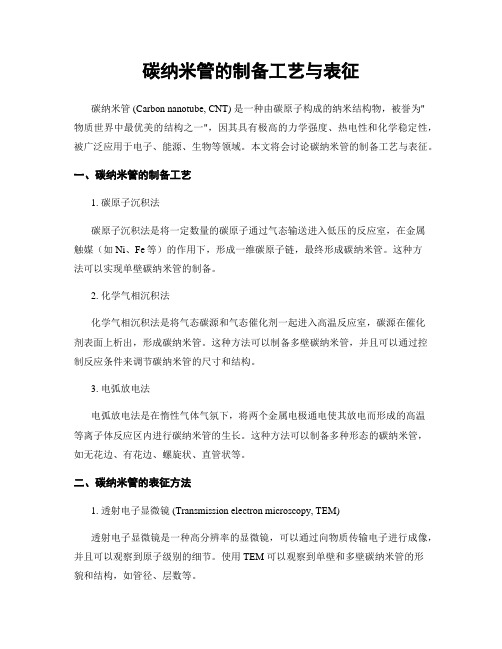
碳纳米管的制备工艺与表征碳纳米管 (Carbon nanotube, CNT) 是一种由碳原子构成的纳米结构物,被誉为"物质世界中最优美的结构之一",因其具有极高的力学强度、热电性和化学稳定性,被广泛应用于电子、能源、生物等领域。
本文将会讨论碳纳米管的制备工艺与表征。
一、碳纳米管的制备工艺1. 碳原子沉积法碳原子沉积法是将一定数量的碳原子通过气态输送进入低压的反应室,在金属触媒(如Ni、Fe等)的作用下,形成一维碳原子链,最终形成碳纳米管。
这种方法可以实现单壁碳纳米管的制备。
2. 化学气相沉积法化学气相沉积法是将气态碳源和气态催化剂一起进入高温反应室,碳源在催化剂表面上析出,形成碳纳米管。
这种方法可以制备多壁碳纳米管,并且可以通过控制反应条件来调节碳纳米管的尺寸和结构。
3. 电弧放电法电弧放电法是在惰性气体气氛下,将两个金属电极通电使其放电而形成的高温等离子体反应区内进行碳纳米管的生长。
这种方法可以制备多种形态的碳纳米管,如无花边、有花边、螺旋状、直管状等。
二、碳纳米管的表征方法1. 透射电子显微镜 (Transmission electron microscopy, TEM)透射电子显微镜是一种高分辨率的显微镜,可以通过向物质传输电子进行成像,并且可以观察到原子级别的细节。
使用 TEM 可以观察到单壁和多壁碳纳米管的形貌和结构,如管径、层数等。
2. 扫描电子显微镜 (Scanning electron microscopy, SEM)扫描电子显微镜是一种能够对物质表面进行高分辨率成像的显微镜。
使用SEM 可以观察到碳纳米管的形貌和表面结构,如螺旋状、直管状等。
3. 原子力显微镜 (Atomic force microscopy, AFM)原子力显微镜是一种高分辨率的表面形貌和力学性质的表征技术。
使用 AFM可以观察到碳纳米管的形状、长度、直径等,还可以得到其力学性质,如弹性模量、硬度等信息。
实验一 红外光谱分析实验
实验一红外光谱分析实验一、学时:2学时二、实验类型:演示性实验三、实验目的:1.了解傅立叶变换红外光谱仪的基本构造及工作原理2.学习高分子聚合物红外光谱测定的制样方法3.学会用傅立叶变换红外光谱仪进行样品测试4.掌握几种常用的红外光谱解析方法四、实验原理红外光是一种波长介于可见光区和微波区之间的电磁波谱。
波长在0.78~300μm。
通常又把这个波段分成三个区域,即近红外区:波长在0.78~2.5μm (波数在12820~4000cm-1),又称泛频区;中红外区:波长在2.5~25μm(波数在4000~400cm-1),又称基频区;远红外区:波长在25~300μm(波数在400~33cm-1),又称转动区。
其中中红外区是研究、应用最多的区域。
红外及拉曼光谱都是分子振动光谱。
通过谱图解析可以获取分子结构的信息。
作为红外光谱的特点,首先是应用面广,提供信息多且具有特征性,故把红外光谱通称为"分子指纹"。
它最广泛的应用还在于对物质的化学组成进行分析。
用红外光谱法可以根据光谱中吸收峰的位置和形状来推断未知物的结构,依照特征吸收峰的强度来测定混合物中各组分的含量。
其次,它不受样品相态的限制,无论是固态、液态以及气态都能直接测定,甚至对一些表面涂层和不溶、不熔融的弹性体(如橡胶)也可直接获得其光谱。
它也不受熔点、沸点和蒸气压的限制,样品用量少且可回收,是属于非破坏分析。
而作为红外光谱的测定工具-红外光谱仪,与其他近代分析仪器(如核磁共振波谱仪、质谱仪等)比较,构造简单,操作方便,价格便宜。
因此,它已成为现代结构化学、分析化学最常用和不可缺少的工具。
红外光谱仪主要有两种类型:色散型和干涉型(傅立叶变换红外光谱仪)。
色散型红外光谱仪是以棱镜或光栅作为色散元件,这类仪器的能量受到严格限制,扫描时间慢,且灵敏度、分辨率和准确度都较低。
随着计算方法和计算技术的发展,20世纪70年代出现新一代的红外光谱测量技术及仪器——傅立叶变换红外光谱仪。
(完整版)红外震动类型表示与英文名称
红外振动类型的英文表示方法及其全称(remove the research barrier)1、红外光谱的产生和表示在分子的振动过程中,只有那些能引起分子偶极矩改变的振动,才能吸收红外辐射,从而在红外光谱中出现吸收谱带。
多原子分子的振动是由许多简单的、独立的振动组合而成的。
在每个独立的振动中,所有原子都是以相同相位运动,可以近似地看作谐振子振动。
这种振动称为简正振动。
每个简正振动具有一定的能量,故应在特有的波数位置产生吸收。
由n个原子组成的多原子分子存在有3n—6个简正振动,而线型分子则为3n—5个简正振动。
在简单分子中,对这些基本振动进行理论解析是可能的,但在实际的复杂有机化合物中,简正振动数目很多,而且由于倍频振动和组合频振动也会出现吸收,所以使红外光谱变得很复杂。
对于所有的红外吸收谱带在理论上进行解析将是非常困难的。
因此,当红外光谱用于定性分析时,通常是利用各种特征频率吸收图表,选出与官能团和骨架构有关的吸收谱带,而且还要与待定化合物的标准光谱相比较才能得出结论。
红外光谱图的横坐标一般用波数v(单位cm-1),纵坐标常用百分透过率(T%)表示。
2、多原子分子的振动方式基团的各种振动类型用如下符号来表示:ν伸缩振动γ面外弯曲振动δ变形振动β面内弯曲振动 t扭绞振动τ扭转振动ω面外摇摆振动 s对称振动 as不对称振动r面内摇摆振动3、吸收带强度吸收带的强弱主要取决于分子振动时偶极矩变化的大小。
分子的对称性越高,偶极矩的变化越小,吸收带越弱。
一般,仅含碳和氢的化合物的吸收是较弱的。
但是由电负性差别显著的原子所组成的键,如c—N、c—o、c=o、c=N等,其吸收带一般都是很强的。
吸收带的强度用表观摩尔吸光系数来表示,也用如下符号来表示:VS(very strong,极强),S(strong,强),M(medium,中),w(weak,弱),Vw(very weak,极弱)。
红外线:infrared ray,IR中红外吸收光谱:mid-infrared absorption spectrum,Mid-IR远红外光谱:Far-IR微波谱:microwave spectrum,MV红外吸收光谱法:infrared spectroscopy红外分光光度法:infrared spectrophotometry振动形式:mode of vibration伸缩振动:stretching vibration对称伸缩振动:symmetrical stretching vibration不对称伸缩振动:asymmetrical stretching vibration弯曲振动:bending vibration变形振动:formation vibration面内弯曲振动:in-plane bending vibration,β剪式振动:scissoring vibration,δ面内摇摆振动:rocking vibration,ρ面外弯曲振动:out-of-plane bending vibration,γ面外摇摆振动:wagging vibration,ω蜷曲振动:twisting vibration ,τ对称变形振动:symmetrical deformation vibration ,δs不对称变形振动:asym metrical deformation vibration, δas 特征吸收峰:charateristic avsorption band特征频率:characteristic frequency相关吸收峰:correlation absorption band杂化影响:hybridization affect环大小效应:ring size effect吸收峰的强度:intensity of absorption band环折叠振动:ring prckering vibration。
- 1、下载文档前请自行甄别文档内容的完整性,平台不提供额外的编辑、内容补充、找答案等附加服务。
- 2、"仅部分预览"的文档,不可在线预览部分如存在完整性等问题,可反馈申请退款(可完整预览的文档不适用该条件!)。
- 3、如文档侵犯您的权益,请联系客服反馈,我们会尽快为您处理(人工客服工作时间:9:00-18:30)。
a rXiv:as tr o-ph/19398v123Se p21**TITLE**ASP Conference Series,Vol.**VOLUME**,**PUBLICATION YEAR****EDITORS**Infrared Spectroscopy of Atomic Lines in Gaseous Nebulae 1R.H.Rubin 2,3,R.J.Dufour 4,T.R.Geballe 5,S.W.J.Colgan 2,J.P.Harrington 6,S.D.Lord 7, A.L.Liao 2,and D.A.Levine 7Abstract.Spectroscopy in the infrared provides a means to assess im-portant properties of the plasma in gaseous nebulae.We present some of our own work that illustrates the need for interactions between the themes of this conference –astronomical data,atomic data,and plasma simulations.We undertook Infrared Space Observatory (ISO)observa-tions with the intent of better understanding the effects of density vari-ations in nebulae,particularly planetary nebulae (PNs),by determining average electron densities from the flux ratios of several fine-structure,IR emission lines.Instead,we are able to ascertain only minor density information because of several instances of the observed line flux ratios being out of range of the theoretical predictions using current atomic data.In these cases,the ISO data cannot presently be used to derive electron density,but rather provide direction for needed improvements in the atomic collision strengths.We have detected an unidentified (uid)strong emission line in an ISO/SWS spectrum of the Orion Nebula.The line has a rest wavelength 2.89350±0.00003µm.A long-slit UKIRT observation confirms the pres-ence of this line and shows that the emission is spatially extended and appears to be coincident with the brightest part of the ionized region.We do not detect the uid line in our SWS02spectra of any of the several bright PNs which we observed for a comparable time.The need for ba-sic atomic data,in this case wavelengths to aid species identification,is paramount for future progress.We look toward the future with a brief synopsis of upcoming or planned IR missions that promise a significant spectroscopic bearing.The2Rubin et al.missions(and their instruments)discussed are SIRTF,SOFIA,and HER-SCHEL(upcoming)and NGST,GSMT,and SAFIR(planned).1.IntroductionMost observational tests of the chemical evolution of the universe rest on emis-sion line objects;these define the endpoints of stellar evolution and probe the current state of the interstellar medium.Gaseous nebulae are laboratories for understanding physical processes in all emission-line sources,and probes for stellar,galactic,and primordial nucleosynthesis.There is a fundamental issue that continues to be problematic–the discrep-ancy between heavy element abundances inferred from emission lines that are collisionally excited compared with those due to recombination/cascading,the so-called“recombination lines”.Studies of planetary nebulae(PNs)contrast-ing recombination and collisional abundances(Liu et al.1995,Kwitter&Henry 1998)oftenfind differences exceeding a factor of two.In an extensive study of NGC6153,Liu et al.(2000)found that C++/H+,N++/H+,O++/H+,and Ne++/H+ratios derived from optical recombination lines are all a factor of∼10 higher than the corresponding values deduced from collisionally-excited lines. Abundances determined from these two methods disagree by a factor larger than the spread of abundances used to determine such fundamental quantities as Galactic abundance gradients(e.g.,Shaver et al.1983;Simpson et al.1995; Henry&Worthey1999).Most of the efforts to explain the abundance puzzle between collisional and recombination values have attempted to do so by examining electron tempera-ture(T e)variations in the plasma.This is often done,using the formalism of Peimbert(1967),in terms of the mean-square variation(t2)of T e.The inferred metallicity obtained by using the usual(optical/UV)forbidden lines is very sen-sitive to T e(exponential)and t2.On the other hand,recombination lines are rather insensitive to T e and t2.Agreement close to the higher recombination value can be forced in the derived abundance by attributing the difference to (solving for)t2.For instance,consider the case of the PN NGC7009,which has stood near the center of the abundances controversy.Liu et al.(1995)found that the recombination C,N,and O abundances are a factor of∼5larger than the corresponding collisional abundances.By invoking t2∼0.1for oxygen in NGC7009,agreement can be forced in the derived abundance close to the higher recombination value–a value more than2.5times larger than the solar O/H of 7.41×10⁻⁴(Grevesse&Sauval1998).Such a large t2is not at all predicted by current theory/models(e.g.,Kingdon&Ferland1998).For NGC7009,Rubin et al.(2000)produced a T e map on a pixel scale of 0.1′′from theflux ratio of[O iii]4363/5007using a set of HST/WFPC2images that included narrow-bandfilters F437N and F502N to assess these linefluxes. Their analysis of t2in the plane of the sky indicates very small values,∼<0.01, throughout the nebula.It seems clear that something more than T e variations alone is necessary to explain the abundance dilemma.We have been addressing other ingredients that may affect the determina-tion of elemental abundances from observations.Perhaps the most importantInfrared Spectroscopy3Figure1.Three valuable indicators of N e–the intensity ratio of[N ii](205/122),[O iii](88/52),and[S iii](33/19)vs.N e(cm−3).The[N ii]ratio is most sensitive at the lowest N e,and[S iii]at the highest.of these is density variations.While T e variations are expected theoretically to be fairly small in PNs and H ii regions,variations in electron density(N e)are almost certainly very large.High N e values(∼106cm−3)are inferred in the cometary knots of the Helix nebula(e.g.,Walsh&Meaburn1993;Burkert& O’Dell1998)and around proplyds in Orion(e.g.,Henney&O’Dell1999and references therein).Gas at N e=106cm−3will produce106times as much emission as the same volume of“normal”nebular gas at N e=103cm−3for re-combination lines and collisionally-excited lines that are not suffering collisional deexcitation–when N e<N crit(the critical density).Several well known line ratios of collisionally-excited lines serve as diagnos-tics of N e,probing different ionization conditions and different density regimes. Because various collisionally-excited lines undergo collisional deexcitation at dif-ferent N crit values,the derivation of an average N e for a given line ratio depends on the specific N e(and T e)dependence of the respective volume emissivities. In general,different average N e values are obtained for various line pairs due to different contributions to the observed intensities from the volume observed. Very substantial biases in the inference of abundances from collisionally-excited lines may then result(Rubin1989;Viegas&Clegg1994;Liu et al.2000).2.The Promise of the Infrared for Density Diagnostics Measurement of the two∆J=1IRfine-structure transitions for species with a 3P ground state provides a diagnostic for N e.The ratio of theirfluxes is a sen-sitive indicator of N e(over some range in N e)that generally is not significantly affected by T e or extinction.For example,theflux ratios[O iii]52/88µm,[S iii]4Rubin et al.Figure2.Similar to Fig.1for two other indicators of N e–the inten-sity ratio of[Ne iii](36/15)and[Ar iii](22/9).These diagnostics arenow available from ISO.These ratios are sensitive indicators of higherdensity material than those ratios in Fig.1.19/33µm,and[N ii]122/205µm provide N e[O iii],N e[S iii],and N e[N ii], respectively,as shown in Figure1(Rubin et al.1994).There is only a weak dependence on T e as illustrated for each species by the three curves for T e=5000,8000,and10000K.For conditions prevalent in many PNs and H ii regions,these lines readily show the effect of collisional deexcitation because some of the plasma may exceed their respective N crit-values.We are able to use only two of the above diagnostics because ISO did not observe the 205µm line.With ISO,there are now at least three important additional IR line ratios available–[Ne iii]36.0/15.5,[Ne v]14.3/24.3,and[Ar iii]21.8/8.99µm–for studies of N e structure and variations.This is because ISO was able to observe the[Ne iii]15.5µm,[Ne v]14.3µm,and[Ar iii]21.8µm lines,which suffer very seriously from the atmosphere even for airborne astronomy,e.g.,for the Kuiper Airborne Observatory(KAO)or SOFIA.(Observations of these lines with the IRAS LRS were sparse and of dubious quality.)These three ratios are sensitive indicators of higher density material than are the other three ratios mentioned earlier.Two of these ratios–[Ne iii]36/15µm and[Ar iii]22/9µm–are displayed in Figure2.The ratios are similar in that they are most discriminant in the range3.8∼< log N e∼<5.4.We will use two more N e-diagnostic line ratios[Mg v]13.5/5.61µm and[Ar v]13.1/7.9µm.These will be used to probe the higher ionization gas. Although usually weaker than the lines mentioned earlier,all are expected to be seen in a large number of high ionization PNs.The hope for the ISO IR data is that these numerous“new”N e diagnostics,in combination with the N e diagnostics available from the optical/UV,will permit a viable tomographic analysis of the N e structure in PNs.Infrared Spectroscopy5 3.ISO Observations and Results for the Density AnalysisUnder our GO programs,we observed the PNs NGC2022,NGC6210,NGC6818, and IC2165with the ISO Short Wavelength Spectrometer(SWS).Our obser-vations with SWS were made in SWS02mode,which provides higher spectral resolution than SWS01mode.One of our goals was to derive N e from several di-agnostic line pairs in order to address density variations within these objects.As described above,we aimed to obtain N e values from the following sixflux ratios: [S iii](18.7/33.5),[Ar iii](8.99/21.8),[Ne iii](15.5/36.0),[Ar v](7.90/13.1), [Ne v](14.3/24.3),and[Mg v](5.61/13.5µm).Because the ISO/SWS aperture size depends on wavelength,the above linefluxes are not always directly compa-rable.For the lines discussed here,the sizes were:14′′×20′′for the5.61,7.90, &8.99µm lines;14′′×27′′for the13.1–24.3µm lines;and20′′×33′′for the 33.5&36.0µm lines.Table1provides a summary of which lines were observed in the various sources.Table1.The position angles(PA)of the long-axis of the various apertures were 183.17,13.27,349.07,and193.71o for NGC2022,NGC6210,NGC6818,and IC2165,respectively,and rough estimates of the respective source“diameters”are19′′,16.2′′,20′′,and9′′.However,there is certainly emission well beyond these“diameters”in the case of NGC6210–see an overlay (/∼rubin/turtle.html)of our ISO apertures on6Rubin et al.14.2814.2914.314.3114.3214.3314.3414.35Figure 3.ISO SWS02spectrum of [Ne v ]14.32µm line in the PN NGC 6818.This important N e -diagnostic line cannot be observed even from an airborne platform.The data (asterisks)have been fit with a Gaussian and a linear baseline.The residuals,data point minus curve fit,are indicated as the dashed line.HST/WFPC2images taken by us under GO-6792–and NGC 6818–(/∼rubin/zorro.html)other WFPC2images un-der GO-6792.The best object for our analysis in this sense is IC 2165,which is smaller than the smallest aperture.For the other PNs,the use of line flux ratios may still be valid as long as the specific ionic emitting zone is circumscribed by the smaller of the two apertures.Of the six line sets,only the [Ne v ]pair of lines (14.3,24.3)was observed with the same aperture size.Figures 3and 4are ISO SWS02spectra of the [Ne v ]14.32and 24.32µm lines in NGC 6818.The aperture used for each was 14′′×27′′.The data are fit very well by a Gaussian profile.Data processing was performed using the ISO Spectral Analysis Package (ISAP).NGC 6818is not fully enclosed by a 14′′×27′′aperture.However,the same portion of the nebula is observed in both of these lines.Because the high ionization Ne +4zone is much more concentrated toward the central star than the entire ionized (H ii )region is,it is highly probable that the total Ne +4zone is enclosed within the observed aperture.Figure 5shows the theoretical flux ratio F(14.3)/F(24.3)vs.N e (cm −3),using effective collision strengths from Lennon &Burke (1994).Throughout this paper,we shorten effective collision strength (Υ)to collision strength (CS).Our ISO data with regard to this ionic species are most interesting.In the subsections to follow,we present the SWS data and discuss the six ionic species in order of lowest to highest degree of ionization as indicated by the range in ionization potential (I.P.)over which the species exist.3.1.S iiiObservations were made of both the [S iii ]18.7and 33.5µm lines in all four of our program PNs.The line profiles were fit with the line-fitting routine in ISAP,Infrared Spectroscopy 724.2424.2624.2824.324.3224.3424.36Figure 4.Similar to Fig.3for the ISO SWS02spectrum of [Ne v ]24.32µm line in the PN NGC 6818.F l u x R a t i o [N e V ] 14.3/24.3012345670246810Figure 5.An outstanding indicator of N e is the flux ratio of [Ne v ](14.3/24.3).This shows the theoretical flux ratio F(14.3)/F(24.3)vs.N e (cm −3)using Lennon &Burke (1994)collision strengths.The ratio is insensitive to T e (10,000K solid,15,000K dashed curve).This diagnostic is now available from ISO data.8Rubin et al.which provides the lineflux and uncertainty.Wefit the data points with a Gaussian and a linear baseline such as shown in Figs.3and4for the[Ne v] data.In general,the data werefit well by this method.Table2presents the measuredfluxes and uncertainties.These uncertainties do not include systematic errors.The last column has the N e derived from theflux ratio assuming a T e of10,000K.It is likely that only the N e for IC2165is valid.Because of the extended[S iii]emission and the mismatch of aperture sizes,the F(18.7)/F(33.5) ratio is likely a lower limit and the N e entry a lower limit for the other objects.In the lower part of Table2,we provide the theoretical F(18.7)/F(33.5) ratio in the low-N e limit;there,the smallest value of the ratio obtains.The transitions are shown in a term diagram(not to scale)with N crit-values for levels2and3given for T e=10,000K.Table2.3.2.Ar iiiObservations were made of the[Ar iii]8.99and21.8µm lines in NGC6210and NGC6818.Table3presents the measuredfluxes for these data.The comments regarding linefitting,etc.,and the tabular entries that accompanied Table2 apply here and for the ionic species to follow.In the lower part of the Table, we have the theoretical F(21.8)/F(8.99)ratio in the low-N e limit,where the highest value of the ratio obtains.For NGC6210,the observed ratio is close to the low-N e asymptotic limit,where the ratio is insensitive to N e and thus not useful for deriving N e.For this and other such instances,“near low limit”is entered in the N e-column of the Table.For NGC6818,the observed ratio exceeds the low-N e limit for any reasonable T e.Because the[Ar iii]emission is likely more extended than the smaller14′′×20′′aperture used for the8.99µm line,the F(21.8)/F(8.99)ratio is likely an upper limit and thus any inference that the observed ratio is out of the theoretical bounds is uncertain.We enter “XXX low?”in the Table.Infrared Spectroscopy9 Table3.3.3.Ne iiiObservations were made of the[Ne iii]15.5and36.0µm lines in IC2165, NGC6210,and NGC6818.Table4presents the measuredfluxes for these data as well as the theoretical F(36.0)/F(15.5)ratio in the low-N e limit,where the highest value of the ratio obtains.For all the sources,the observed ratio exceeds the low-N e limit.However because the[Ne iii]emission for NGC6210 and NGC6818may be more extended than the smaller14′′×27′′aperture used for the15.5µm line,the F(36.0)/F(15.5)ratio is likely an upper limit and again has an uncertain(XXX low?)conclusion.On the other hand,for IC2165, we are dealing with integratedfluxes and conclude robustly that the observed ratio is out of the theoretical bounds and enter“XXX low”in the Table.The theoretical ratio in the low-N e limit is set by the effective collision strengths. We suggest the data for IC2165are pointing to a need to reexamine the CS, particularly those between the3Pfine-structure levels.Table4.10Rubin et al.3.4.Ar vObservations were made of the[Ar v]7.90and13.1µm lines in IC2165and NGC6818.Table5presents the measuredfluxes for these data as well as the theoretical F(7.90)/F(13.1)ratio in the low-N e limit,where the lowest value of the ratio obtains.For both PNs,the observed ratio is near the low-N e limit. Here,even in the case of NGC6818,it is likely that the Ar+4zone is much more centrally concentrated than the size of the H+zone;but if the[Ar v] 7.90emission were more extended than the smaller14′′×20′′used,then the F(7.90)/F(13.1)ratio would be a lower limit.Table5.Table6.3.5.Ne vObservations were made of the[Ne v]14.3and24.3µm lines in IC2165, NGC2022,and NGC6818(see Figs.3&4).Table6has the measuredfluxes for these data as well as the theoretical F(14.3)/F(24.3)ratio in the low-N e limit,Infrared Spectroscopy11 where the lowest value of the ratio obtains.For NGC6818,the observed ratio is well below the low-N e theoretical limit for any reasonable T e;for NGC2022,the observed ratio is also out of bounds.For IC2165,we derive N e=1310(if T e= 10,000K)and1950cm−3(if T e=15,000K)from Fig.5(see Table6).Com-pared to N e-values derived for IC2165by Stanghellini&Kaler(1989),albeit for other ions,the values here are very low.We are aware of three other measurements of N e from the[Ne v]ratio using ISO data.For the Seyfert galaxy NGC4151,Alexander et al.(1999) found an observed ratio that is close to the low-N e limit For the PNs NGC7027 and NGC6302,van Hoof et al.(2000),found N e of26,900and12,300cm−3 using T e∼20,pared to N e-values derived from optical data for these PNs for other ions(Stanghellini&Kaler1989),the IR values are lower.The fact that these previously published[Ne v]ratios and our new IC2165result yield generally lower N e-values than other methods tends to lend support to our conclusion that the low-N e theoretical limit may need re-examination per our XXX low results.Just because the NGC7027,NGC6302,and IC2165data lead to“legal,in-theoretical-bounds values”does not mean the inferred N e s are correct and does not rule out the possibility that the collision strengths between the3P levels may need revision.3.6.Mg vObservations were made of the[Mg v]5.61and13.5µm lines in IC2165.Table7 presents the measuredfluxes as well as the theoretical F(13.5)/F(5.61)ratio in the low-N e limit,where the highest value of the ratio obtains.Again,the observed ratio is out of the theoretical bounds.Table7.4.Observations of a Strong Unidentified IR Emission LineWe have detected an unidentified(uid)strong emission line in an ISO SWS02 spectrum of the Orion Nebula that was obtained for our Guest Investigator program on1997October12(UT),see Figure6.The14′′×20′′aperture was centered atα,δ=05h35m14.s71,–05o23′41.′′5)(equinox J2000).This position is the center of position1SW,18.5′′S and26.2′′W ofθ1Ori C,observed with HST (see Rubin et al.1997).The orientation of the long axis of the aperture was at12Rubin et al.2.888 2.89 2.892 2.894 2.896 2.898 2.9 2.902Figure6.ISO SWS02spectrum of the2.8935µm line in the OrionNebula taken at position1SW(see text for details).Observations weremade with a14′′×20′′aperture.The data(asterisks)have beenfit witha Gaussian and a linear baseline.The residuals,data point minus curvefit,are indicated as the dashed line.PA190.28o,determined by the time of the actual observation.With a correction for V helio=17km s−1from emission lines arising in the main ionization zone (O’Dell et al.1993),the line has a rest wavelength2.89350±0.00003µm(3456.02 cm−1);it is a factor of3.6weaker than the nearby,H i11–5line(2.8728µm). The average surface brightness in this aperture was3.9E-18W m−2arcsec−2.We do not detect the uid line in our SWS02spectra of any of thefive bright PNs,which we observed for a comparable time.These are the PNs discussed earlier plus NGC7009(the Saturn Nebula).We have also examined many of the ISO archival spectra taken by others of the Orion Nebula as well as several other PNs.Wefind no indication of the uid line in the PNs examined,which included NGC7027,NGC6543,the low ionization PNs IC418and BD+303639,as well as the bright H ii region M17.Unlike our1SW position(well in the heart of the ionized region),most of the other ISO Orion spectra were taken at positions where molecular/photodissociation(PDR)/neutral species would be expected to dominate.There is some indication of the uid line in the following two archival spectra:•an SWS01low-resolution scan of“Orion Bar d2”(PI Drapatz)α,δ= 05h35m21.s40,–05o25′40.′′1(J2000),taken1997October11.The exposure was 1912sec.with a20′′×33′′aperture.The long axis of the aperture was at PA= 189.87o.We measure a lineflux of3.25E-19±0.75E-19W cm−2.•an SWS06scan of“Orion-BN”(PI Cernicharo)α,δ=05h35m14.s20,–05o22′23.′′6,taken1997October12(UT).The exposure was7598sec.with a20′′×27′′aperture.The long axis of the aperture was at PA=190.36o.We measure a lineflux of4.11E-20±1.22E-20W cm−2.Infrared Spectroscopy132.892 2.893 2.894 2.895123Figure 7.Portion of UKIRT long-slit spectrum of the 2.8935µm line in the Orion Nebula that is centered at position 1SW (see text for details).This 1-D plot represents the spectrum through a 0.74arcsec 2aperture.Error bars are shown.Spectra of Orion taken at the United Kingdom Infrared Telescope (UKIRT)confirm the presence of this strong uid line.A long-slit observation (80′′×1′′)cen-tered at 1SW and pointing through θ1Ori C shows that the emission is spatially extended and appears to be coincident with the brightest part of the H ii region.The highest surface brightness occurs at 1SW:1.2E-17W m −2arcsec −2(±20%)with FWHM =24km s −1(resolved).Figure 7shows a spectrum at this location for which the wavelength scale has not been corrected for the Doppler velocity of the source.When the correction is made,the rest wavelength is 2.8935µm.A second observation was made with the slit passing through the proplyd P159-350(O’Dell &Wen 1994)and pointing toward θ1Ori C.This spectrum also shows extended emission in the uid line with no significant enhancement of the line at the proplyd location.Because P159-350has N e at least as high as 105cm −3as measured by the [C iii ]1909/1907flux ratio from GO-7514HST STIS pro-gram (PI Rubin)(Henney &O’Dell 1999),it is a likely indication that the uid line emissivity is not strongly enhanced at higher electron density,which may indicate the line is collisionally excited and not a recombination line.We checked against lists of wavelengths of atomic ions and molecules.For this,the atomic line list provided at /∼peter/atomic by Peter van Hoof was a particularly useful resource.There were two ionic lines that were very close to the uid wavelength and that were “reasonable”candidates.The first (best)candidate is:[Cr iii ]2.89349±0.00020µm (3d 43G 4→3d 43H 5)arising from 20851.87cm −1(∼2.6eV)above ground (Ekberg 1997).Chromium has a solar number abundance log [Cr/H]+12=5.67(Grevesse &Sauval 1998).The I.P.range for Cr ++is 16.49–30.96eV,which would make Cr ++one of the dominant Cr species in Orion although the fraction of Cr +3may be higher.However,we do not believe that this [Cr iii ]line is a likely identification14Rubin et al.because there are other[Cr iii]lines for which we have upper limits.These are [Cr iii]2.77830±0.00020µm(3d43G5→3d43H5)arising20995.16cm−1above ground;2.88560±0.00022µm(3d43G5→3d43H6);and2.91564±0.00020µm (3d43G3→3d43H4)arising20702.45cm−1above ground.There was no hint of these lines in various SWS02bandpasses that we observed covering these3 other transitions.From the similarity of the levels within the multiplet and∆J of0or-1,it is difficult to understand how the2.89349line would be so strong and all the others absent.The second close coincidence is an[Fe v]line at2.8934±0.00075µm(3d43G5→3d43F4)arising from30430.10cm−1above ground.Fe v is isoelectronic with Cr iii.The I.P.range for Fe+4is54.8–75.0eV,which is higher than the He++ limit of54.4eV.There is a stringent upper limit on the ionizingflux greater than54.4eV in Orion by virtue of deep spectroscopy that set a“record”limit on theflux ratio He ii4686/Hβ<7×10−5(Baldwin et al.2000).Thus,there should be negligible Fe v in Orion.Our assessment of what ionization range might produce the uid line is that it is likely from a species having a production I.P.between13.6and54.4eV because it is not seen in the PNs we examined.However the uid line is also not detected in the H ii region M17or the low-ionization PNs IC418and BD+303639.In Orion,the uid line is much stronger in the ionized region and only marginally present(if present at all)in the PDR/molecular/neutral zones. The fact that it is found in only the Orion Nebula reminds one of the uniqueness of proplyds to Orion(at least before they were found in some other nebulae).There is a reward offered for the correct identification of this uid line.The details were presented at the meeting and will be provided to anyone interested by writing to thefirst author.5.Upcoming and Planned IR MissionsIn this section,we discuss planned IR spectroscopic capability with a major em-phasis on NASA and ESA projects.There are some comparisons with the past projects/missions such as KAO,IRAS,and ISO.With one exception,we do not cover ground-based observatories but do remind the reader of excellent spectro-scopic capabilities to be afforded by these facilities(e.g.,Gemini North/South, Keck,and the VLTs).5.1.Space Infrared Telescope Facility(SIRTF)This is a NASA space observatory with an0.85-m telescope.It will have three cryogenically-cooled instruments.The launch date is expected in July2002 with a goal of a lifetime in excess of5years.SIRTF will be in an Earth-trailing,heliocentric orbit.The main spectroscopic instrument is the Infrared Spectrograph(IRS)(PI Jim Houck).There will be4separate modules that cover 5.3–40µm at resolution(R)from60–120(low-R mode)and a higher resolution (R=600)capability from10–37µm.It will provide a major advance in photometric sensitivity as can be seen in Figure8which shows comparisons with KAO,IRAS,ISO,and SOFIA.The angular resolution will be an improvement over ISO but somewhat less than the KAO as is seen in Figure9.The URL provides further details.Infrared Spectroscopy15 5.2.Stratospheric Observatory for Infrared Astronomy(SOFIA) This is a joint project of NASA and the German aerospace center DLR.SOFIA will be the successor to the KAO.The facility is a modified Boeing747SP air-plane with a2.5-meter telescope.First light is expected in late2004,with general observing commencing in2005.The planned lifetime is20years and the home base is Moffett Field at the NASA/Ames Research Center.The photometric sensitivity is shown in Figure8in comparison with other missions.The angular resolution will be a substantial improvement,especially if the goal(solid curve)is attained(see Figure9).The complement of First Light Instruments now being built are all listed below,but we describe here only those with medium to high spectral resolution capability.Figure10shows the instrument coverage,along with those of SIRTF,in R–λspace. CAMERAS:There is one Principal Investigator(PI)instru-ment,HIPO(PI Dunham).SPECTROGRAPHS16Rubin et al.Figure9.The spatial resolutions(∼50%encircled energy diameter)for IRAS,KAO,ISO,SIRTF,SOFIA,and Herschel.Graphics fromhttp://sofi.(2)the CAltech Submillimeter and far-Infrared MIxing Receiver(CASIMIR) (PI Zmuidzinas)that is a heterodyne receiver which will operate from250–600µm with high spectral resolution.(3)the Echelon Cross Echelle Spectrometer(EXES)(PI Lacy)–a grating spec-trograph that will operate from5–28µm with high(R∼105),medium(R∼104),and low(R∼3000)spectral resolution.(4)the Field Imaging Far-Infrared Line Spectrometer(FIFI LS)(PI Poglitsch). This will cover from45–210µm with R∼1700.(5)the German Receiver for Astronomy at Terahertz Frequencies(GREAT)(PI Guesten).This is also a heterodyne receiver and will operate from75–250µm with high R.(6)the Submillimeter And Far InfraRed Experiment(SAFIRE)(PI Moseley). This is an imaging Fabry-Perot bolometer array spectrometer which will operate from145–655µm with an ultimate goal of reaching R=10,000.Further details are available via the SOFIA web site at http://sofi/5.3.Herschel Space Observatory(HERSCHEL)Formerly called FIRST,this is an ESA“Cornerstone Mission”with substantial NASA participation.It consists of a3.5-m diameter telescope radiatively cooled to∼80K with coverage in the60–670µm range.After launch,expected to。