Intense upconversion luminescen Er3-Yb3 oxyfluoride-borosilicate-glass ceramics Ba2GdF7 nanocrystals
华南理工大学 杨中民 窄线宽光纤激光器 2011
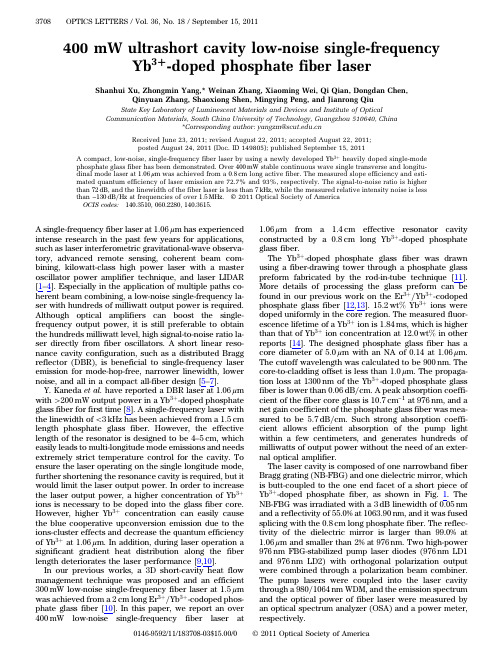
400mW ultrashort cavity low-noise single-frequency Yb3 -doped phosphate fiber laserShanhui Xu,Zhongmin Yang,*Weinan Zhang,Xiaoming Wei,Qi Qian,Dongdan Chen,Qinyuan Zhang,Shaoxiong Shen,Mingying Peng,and Jianrong QiuState Key Laboratory of Luminescent Materials and Devices and Institute of OpticalCommunication Materials,South China University of Technology,Guangzhou510640,China*Corresponding author:yangzm@Received June23,2011;revised August22,2011;accepted August22,2011;posted August24,2011(Doc.ID149805);published September15,2011A compact,low-noise,single-frequency fiber laser by using a newly developed Yb3þheavily doped single-modephosphate glass fiber has been demonstrated.Over400mW stable continuous wave single transverse and longitu-dinal mode laser at1:06μm was achieved from a0:8cm long active fiber.The measured slope efficiency and esti-mated quantum efficiency of laser emission are72.7%and93%,respectively.The signal-to-noise ratio is higher than72dB,and the linewidth of the fiber laser is less than7kHz,while the measured relative intensity noise is less than−130dB=Hz at frequencies of over1:5MHz.©2011Optical Society of AmericaOCIS codes:140.3510,060.2280,140.3615.A single-frequency fiber laser at1:06μm has experienced intense research in the past few years for applications, such as laser interferometric gravitational-wave observa-tory,advanced remote sensing,coherent beam com-bining,kilowatt-class high power laser with a master oscillator power amplifier technique,and laser LIDAR [1–4].Especially in the application of multiple paths co-herent beam combining,a low-noise single-frequency la-ser with hundreds of milliwatt output power is required. Although optical amplifiers can boost the single-frequency output power,it is still preferable to obtain the hundreds milliwatt level,high signal-to-noise ratio la-ser directly from fiber oscillators.A short linear reso-nance cavity configuration,such as a distributed Bragg reflector(DBR),is beneficial to single-frequency laser emission for mode-hop-free,narrower linewidth,lower noise,and all in a compact all-fiber design[5–7].Y.Kaneda et al.have reported a DBR laser at1:06μm with>200mW output power in a Yb3þ-doped phosphate glass fiber for first time[8].A single-frequency laser with the linewidth of<3kHz has been achieved from a1:5cm length phosphate glass fiber.However,the effective length of the resonator is designed to be4–5cm,which easily leads to multi-longitude mode emissions and needs extremely strict temperature control for the cavity.To ensure the laser operating on the single longitude mode, further shortening the resonance cavity is required,but it would limit the laser output power.In order to increase the laser output power,a higher concentration of Yb3þions is necessary to be doped into the glass fiber core. However,higher Yb3þconcentration can easily cause the blue cooperative upconversion emission due to the ions-cluster effects and decrease the quantum efficiency of Yb3þat1:06μm.In addition,during laser operation a significant gradient heat distribution along the fiber length deteriorates the laser performance[9,10].In our previous works,a3D short-cavity heat flow management technique was proposed and an efficient 300mW low-noise single-frequency fiber laser at1:5μmwas achieved from a2cm long Er3þ=Yb3þ-codoped phos-phate glass fiber[10].In this paper,we report an over 400mW low-noise single-frequency fiber laser at 1:06μm from a1:4cm effective resonator cavity constructed by a0:8cm long Yb3þ-doped phosphate glass fiber.The Yb3þ-doped phosphate glass fiber was drawn using a fiber-drawing tower through a phosphate glass preform fabricated by the rod-in-tube technique[11]. More details of processing the glass preform can be found in our previous work on the Er3þ=Yb3þ-codoped phosphate glass fiber[12,13].15:2wt%Yb3þions were doped uniformly in the core region.The measured fluor-escence lifetime of a Yb3þion is1:84ms,which is higher than that of Yb3þion concentration at12:0wt%in other reports[14].The designed phosphate glass fiber has a core diameter of5:0μm with an NA of0.14at1:06μm. The cutoff wavelength was calculated to be900nm.The core-to-cladding offset is less than1:0μm.The propaga-tion loss at1300nm of the Yb3þ-doped phosphate glass fiber is lower than0:06dB=cm.A peak absorption coeffi-cient of the fiber core glass is10:7cm−1at976nm,and a net gain coefficient of the phosphate glass fiber was mea-sured to be5:7dB=cm.Such strong absorption coeffi-cient allows efficient absorption of the pump light within a few centimeters,and generates hundreds of milliwatts of output power without the need of an exter-nal optical amplifier.The laser cavity is composed of one narrowband fiber Bragg grating(NB-FBG)and one dielectric mirror,which is butt-coupled to the one end facet of a short piece of Yb3þ-doped phosphate fiber,as shown in Fig.1.The NB-FBG was irradiated with a3dB linewidth of0:05nm and a reflectivity of55.0%at1063:90nm,and it was fused splicing with the0:8cm long phosphate fiber.The reflec-tivity of the dielectric mirror is larger than99.0%at 1:06μm and smaller than2%at976nm.Two high-power 976nm FBG-stabilized pump laser diodes(976nm LD1 and976nm LD2)with orthogonal polarization output were combined through a polarization beam combiner. The pump lasers were coupled into the laser cavity through a980=1064nm WDM,and the emission spectrum and the optical power of fiber laser were measured by an optical spectrum analyzer(OSA)and a power meter, respectively.3708OPTICS LETTERS/Vol.36,No.18/September15,20110146-9592/11/183708-03$15.00/0©2011Optical Society of AmericaAs shown in Fig.1,the effective length of the resonator includes the 0:8cm active fiber and a half of the 1:0cm NB-FBG.It is only less than 1:4cm,giving a longitudinal mode spacing of 7:4GHz.The NB-FBG has a reflection bandwidth of less than 13:3GHz.It is clear that only one longitudinal mode is supported within the laser cav-ity.Figure 2(a)illustrates the output spectrum of the Yb 3þ-doped phosphate fiber laser.The fiber laser spec-trum centered at 1063:90nm is recorded with a spectrum resolution of 0:1nm by OSA.The signal-to-noise ratio (SNR)of more than 72dB is obtained.The laser cavity was assembled into a copper tube,which was tempera-ture-controlled by a cooling system with a resolution of 0:05°C.The single-frequency characteristics were con-firmed by the scanning Fabry –Perot interferometer (SA210-9A),as shown in Fig.2(b).With the proper tem-perature control,the laser operated stably in a single fre-quency without mode hop and mode competition.As shown in Fig.2(c),the output power of the Yb 3þ-doped phosphate fiber laser at 1:06μm versus the launched pump power.The lasing threshold is around 25mW.When the pump power is above the threshold,the laser output power is approximately linearly increased with the pump power.An output power of 408mW is obtained from the 0:8cmYb 3þ-doped phosphate fiber at the pumppower of 570mW,which is the highest output power from this kind of fiber lasers reported to date [8,15–17].The slope efficiency against the launched pump power is measured to be 72.7%,and the experimental quantum ef-ficiency of the laser emission related to the absorbed pump power is estimated to be 93%,since only 85%of the pump power was coupled into the phosphate fiber core due to the coupling loss,scattering,and pump leak-age.From our understanding,these are also the highest slope efficiency and quantum efficiency from this kind of single-frequency fiber laser [8,15–17].The stabilities of the output power at 300mW in an hour were investigated and the result is shown in Fig.2(d).The power instability of <0:25%of the average power was observed,which is caused by the small fluctuations in the pump laser power and the small changes of ambient temperature.After the fiber laser worked for half an hour,the output power of the laser obviously became very stable.As shown in Fig.2(c),the output power was saturated at the pump power larger than 570mW.When the pump power was set to be more than 740mW,the output power of the laser became unstable due to the backscatter light inducing the instability of the two pump LDs.Laser noise is an important parameter of the single-frequency fiber laser.The relative intensity noise (RIN)was measured using bandwidth resolution 3:1kHz of the electrical spectrum and the results are shown in Fig.3.As shown by the left inset of Fig.3,at the low frequencies of <230kHz there are noise peaks at −100dB =Hz,due to environmental influences,such as acoustics or vibration.With increasing the frequency to 500kHz,the RIN de-creases from −100dB =Hz to −120dB =Hz.A relaxation os-cillation frequency peak of −112dB =Hz was observed at the frequencies of 970kHz.The RIN is stabilized less than −130dB =Hz for frequencies above 1:5MHz.In order to further investigate the phase noise charac-teristics of the fiber laser,the linewidth of the fiber laser was measured by a self-heterodyne method using a 10km fiber delay.It is 60kHz with −20dB from the peak,which indicates the measured laser linewidth is approximately 3:0kHz FWHM,as shown in the right inset of Fig.3.The linewidth resolution of the self-heterodyne measurement with a 10km fiber delay is about 6:6kHz,so the laser line-width is affirmed to be less than 7kHz.In conclusion,an over 400mW single longitude mode laser at 1:06μm from a 0:8cm long Yb 3þ-dopedDielectric Mirror0.8-cm Yb 3+-doped Phosphate FiberNB-FBGLaser Output980/1060nm WDM976 nm LD11060nm Isolator976 nm LD2PBCFig.1.(Color online)Experimental setup of the short linear cavity Yb 3þ-doped phosphate fiber laser.P o w e r L e v e l (d B m )Wavelength (nm)P Z T V o l t a g e (V )Time (s)L a s e r O u t p u t P o w e r (m W )Pump Power (mW)280290300310P o w e r (m W )Time (min)< 0.25 %(d)Fig.2.(Color online)(a)Laser spectrum of the Yb 3þ-doped phosphate fiber laser.(b)The longitudinal modes characteris-tics of the fiber laser measured by the scanning Fabry –Perot interferometer.(c)The output power of the fiber laser at 1064nm versus the pump power.(d)The power stabilities of the fiber laser for anhour.Fig.3.(Color online)Noise characteristics of the Yb 3þ-doped phosphate fiber laser.Inset (left):the magnified RIN at the low frequencies of <2:0MHz.Inset (right):the self-heterodyne line-width of the fiber laser.September 15,2011/Vol.36,No.18/OPTICS LETTERS3709phosphate fiber has been demonstrated.The slope effi-ciency is72.7%and the quantum efficiency of laser emis-sion has been estimated to be93%.The SNR is morethan72dB,and the RIN of the fiber laser is less than −130dB=Hz at the frequency higher than1:5MHz.The laser linewidth is less than7kHz.These results show thatthe short linear cavity based on the Yb3þ-doped phos-phate single-mode glass fiber is a very promising candi-date as an efficient and compact single-frequency fiber laser at1:0μm region.This research was supported by the China State863Hi-tech Program(2011AA030203),the National NaturalScience Foundation of China(NSFC)(U0934001and60977060),the Guangdong Province and Hong Kong In-vite Public Bidding Program(TC10BH07-1),the Scienceand Technology Project of Guangdong(2009A090100044,2009B091300127,cgzhzd0903,and2010B2101230),theProject of Education Department of Guangdong Province(2009N9100200),the Fundamental Research Funds forthe Central Universities(2009ZM0219,2011ZZ0001,and2009ZZ0054),the Open Research Fund of State Key La-boratory of Precision Spectroscopy,and the Young Nat-ural Science Foundation of South China University ofTechnology(E5090880).References1.LIGO Scientific Collaboration,Rep.Prog.Phys.72,076901(2009).2.D.Psaltis,Science298,1359(2002).3.Y.Ma,X.Wang,J.Leng,H.Xiao,X.Dong,J.Zhu,W.Du,P.Zhou,X.Xu,L.Si,Z.Liu,and Y.Zhao,Opt.Lett.36, 951(2011).4.J.G.Williams,S.G.Turyshev,and D.H.Boggs,Phys.Rev.Lett.93,261101(2004).5.M.Leigh,W.Shi,J.Zong,Z.Yao,S.Jiang,and N.Peyghambarian,Appl.Phys.Lett.92,181108(2008).6.T.Qiu,S.Suzuki, A.Schlzgen,L.Li, A.Polynkin,V.Temyanko,J.V.Moloney,and N.Peyghambarian,Opt.Lett.30,2748(2005).7.M.Leigh,W.Shi,J.Zong,J.Wang,S.Jiang,and N.Peyghambarian,Opt.Lett.32,897(2007).8.Y.Kaneda,C.Spiegelberg,J.Geng,Y.Hu,T.Luo,J.Wang,S.Jiang,Proceeding of IEEE Conference on Lasers and Electro-Optics(IEEE,2004),paper CThO3.9.T.Liu,Z.M.Yang,and S.H.Xu,Opt.Express17,235(2009).10.S.H.Xu,Z.M.Yang,T.Liu,W.N.Zhang,Z.M.Feng,Q.Y.Zhang,and Z.H.Jiang,Opt.Express18,1249(2010).11.Q.Qian and Z.M.Yang,Acta Opt.Sin.30,1904(2010).12.S.H.Xu,Z.M.Yang,Q.Y.Zhang,Z.D.Deng,and Z.H.Jiang,Chin.Phys.Lett.23,633(2006).13.S.H.Xu,Z.M.Yang,Z.M.Feng,Q.Y.Zhang,Z.H.Jiang,andW.C.Xu,Chin.Phys.Lett.26,047806(2009).14.Y.W.Lee,M.J.F.Digonnet,S.Sinha,K.E.Urbanek,R.L.Ryer,and S.Jiang,IEEE J.Sel.Top.Quantum Electron.15, 93(2009).15.S.Huang,Y.Feng,G.Qin,A.Shirakawa,M.Musha,andK.Ueda,Jpn.J.Appl.Phys.43,L1379(2004).16.W.Guan and J.R.Marciante,Electron.Lett.43,558(2007).17.J.L.Chen,L.Wang,L.P.Chang,G.Y.Li,B.Chen,and Z.Q.Lin,Chinese Science Bulletin53,2729(2008).3710OPTICS LETTERS/Vol.36,No.18/September15,2011。
高热稳定CaGdAlO4∶Er3_+_

第53卷第4期2024年4月人㊀工㊀晶㊀体㊀学㊀报JOURNAL OF SYNTHETIC CRYSTALS Vol.53㊀No.4April,2024高热稳定CaGdAlO 4ʒEr 3+/Yb 3+荧光粉的上转换发光及其温度传感性能李玉强1,杨㊀健2,王㊀帅2,郑基源1,赵㊀炎1,周恒为1,刘玉学2(1.伊犁师范大学物理科学与技术学院,新疆凝聚态相变与微结构实验室,伊宁㊀835000;2.东北师范大学物理学院,长春㊀130024)摘要:获得具有良好热稳定性和发光性能的非接触式光学温度传感材料是目前的研究热点之一,本工作通过高温固相法制备了Er 3+/Yb 3+共掺CaGdAlO 4ʒEr x ,Yb 0.10(x =0.006㊁0.008㊁0.010㊁0.012㊁0.014)荧光粉,尺寸大小分布在0.6~4.2μm㊂在980nm 激光激发下,该荧光粉在500~700nm 发射谱由两个发射带组成,528和550nm 处两个较强的绿光发射带,归属于Er 3+的2H 11/2ң4I 15/2㊁4S 3/2ң4I 15/2能级跃迁,663nm 处较弱的红光发射带,归属于Er 3+的4F 9/2ң4I 15/2能级跃迁㊂上转换发光强度最大组分为CaGdAlO 4ʒEr 0.010,Yb 0.10㊂300~573K 变温发射谱表明,基于荧光强度比FIR 528/550参数,温度传感绝对灵敏度S A 从44.4ˑ10-4K -1(@300K)先增大到52.0ˑ10-4K -1(@445K)随后减小到49.0ˑ10-4K -1(@573K)㊂相对灵敏度S R 则从0.95ˑ10-2K -1(@300K)单调减小到0.27ˑ10-2K -1(@573K)㊂冷热循环实验表明该材料的热重复性优于98%㊂结果表明,CaGdAlO 4ʒEr 0.010,Yb 0.10荧光粉在光学温度传感领域具有潜在的应用前景㊂关键词:稀土离子;荧光粉;Er 3+/Yb 3+共掺;上转换;荧光强度比;温度传感;高温固相法中图分类号:O482.31;TN312+.8㊀㊀文献标志码:A ㊀㊀文章编号:1000-985X (2024)04-0649-07Upconversion Luminescence and Temperature Sensing Properties of High Thermal Stabilized CaGdAlO 4ʒEr 3+/Yb 3+PhosphorsLI Yuqiang 1,YANG Jian 2,WANG Shuai 2,ZHENG Jiyuan 1,ZHAO Yan 1,ZHOU Hengwei 1,LIU Yuxue 2(1.Xinjiang Laboratory of Phase Transitions and Microstructures of Condensed Matter Physics,School of Physical Science and Technology,Yili Normal University,Yining 835000,China;2.School of Physics,Northeast Normal University,Changchun 130024,China)㊀㊀收稿日期:2023-11-01㊀㊀基金项目:伊犁师范大学校级科研项目(2023YSZD005)㊀㊀作者简介:李玉强(1978 ),男,新疆维吾尔自治区人,博士,副教授㊂E-mail:250961713@ ㊀㊀通信作者:刘玉学,博士,教授㊂E-mail:yxliu@Abstract :Obtaining non-contact optical temperature sensing materials with good thermal stability and luminescent properties is one of the current research hotspots.In this work,Er 3+/Yb 3+co doped CaGdAlO 4ʒEr x ,Yb 0.10(x =0.006,0.008,0.010,0.012,0.014)single-phase phosphors were prepared by high-temperature solid-state method.For CaGdAlO 4ʒEr x ,Yb 0.10powders with different Er 3+doping concentrations,the particle sizes range from 0.6μm to 4.2μm.When the samples are under 980nm laser excitation,there exists two emission bands in the 500~575nm range and one emission band in the 630~690nm.The two stronger green emission bands located at 528and 550nm,and they could be attributed to 2H 11/2ң4I 15/2and 4S 3/2ң4I 15/2transitions,while the weaker red emission band at 663nm could be attributed to 4F 9/2ң4I 15/2transition of Er 3+.The optimal upconversion luminescence intensity was obtained from CaGdAlO 4ʒEr 0.010,Yb 0.10.In the temperature range of 300~573K,based on fluorescence intensity ratio FIR 528/550parameters,the absolute sensitivity S A increases from 44.4ˑ10-4K -1(@300K)to 52.0ˑ10-4K -1(@445K),and then decreases to 49.0ˑ10-4K -1(@573K).The relative sensitivity S R decreases monotonically from 0.95ˑ10-2K -1(@300K )to 0.27ˑ10-2K -1(@573K ).Furthermore,the heating-cooling cycling experiment shows that the thermal repeatability of temperature sensing for the phosphor is better than 98%.The results demonstrate that CaGdAlO 4ʒEr 0.010,Yb 0.10phosphors have potential applications in the field of optical temperature sensing.650㊀研究论文人工晶体学报㊀㊀㊀㊀㊀㊀第53卷Key words:rare earth ion;phosphor;Er3+/Yb3+co doping;upconversion;fluorescence intensity ratio;temperature sensing; high-temperature solid-state method0㊀引㊀㊀言精准测温一直是科学研究的重要课题㊂传统的接触式温度计难以胜任火山监测㊁腐蚀性环境等领域的测温[1-3]㊂稀土离子掺杂上转换(upconversion,UC)发光非接触式温度传感,因具有灵敏度高㊁响应速度快等优点备受研究者的青睐[4]㊂然而,基于稀土离子热耦合能级荧光强度比(fluorescence intensity ratio,FIR)测温技术的UC发光温度传感参数,如温度传感绝对和相对灵敏度㊁热稳定性㊁适用范围等,往往受限于基质材料的物性[5],如近年来开展的CaWO4和CaMoO4等荧光粉在高温条件下的物相和化学稳定性研究[6],钙钛矿量子点与稀土离子结合的光学多功能化探索中的量子点长期稳定性研究[7],为了克服高温环境UC发光强度热猝灭使用的LiYGeO4发光增强材料的物性和发光机理研究等[8]㊂由此可见,开展热稳定性好的㊁发光性能优异的基质材料开发及其光学温度传感性能表征,目前仍是国内外光学温度传感研究的热点[4]㊂CaGdAlO4无序结构晶体[9],具有声子能量低(最大声子能量约为618cm-1)[10]㊁热传导性较高[11]㊁物理化学稳定性好等优点[12],归属于四方晶系(空间群I4/mmm),ABCO4化学式,K2NiF4类化合物家族(ABCO4: A 代表Ca2+㊁Sr2+㊁Ba2+等碱土金属; B 代表Gd3+㊁La3+㊁Y3+等三价稀土金属, C 代表Al3+㊁Ga3+等)[13]㊂其中,六配位的Al3+位于沿晶轴c稍微拉伸形变的[AlO6]八面体的中心,Ca2+和Gd3+则按1ʒ1等概率随机分布在[AlO6]八面体的层间,形成九配位的[Ca/GdO9]多面体[12]㊂Ca2+和Gd3+这种无序分布将引起局域晶体场畸变,使掺杂离子发射谱非均匀展宽,已引起激光器件研究者的关注[10,14-16]㊂近年来,稀土离子掺杂CaGdAlO4荧光粉,在太阳能电池[17]㊁LED照明[18]等领域展现出诱人的应用前景㊂在光学温度传感领域,相关文献报道了CaGdAlO4ʒTm3+,Yb3+荧光粉在173~823K的温度传感,特别是该材料优异的发光热稳定性和适用于还原和氧化等极端条件下温度检测[19]㊂但在室温到600K的温度范围,Tm3+的3F2,3/3H4热耦合能级之间较大(~1800cm-1)的能量差,使FIR693/801随温度的变化较小,并且693nm处发光强度较弱,这给实际的光谱检测和数据分析精度带来困难㊂幸运的是,Er3+的2H11/2/4S13/2热耦合能级热布居在该温度范围十分敏感的特性引起了研究者的关注[20-21]㊂此外,Er3+/Yb3+掺杂CaGdAlO4荧光粉的UC发光FIR 温度传感特性及其热稳定性仍需进一步研究㊂本文使用高温固相法制备了Er3+/Yb3+不同掺杂浓度的CaGdAlO4荧光粉,研究了980nm激发下的UC 发光特性和发光机理㊂基于Er3+的2H11/2/4S13/2热耦合能级的FIR528/550参数,研究了300~573K的光学温度传感特性,评估了温度传感灵敏度和热重复性㊂1㊀实㊀㊀验1.1㊀实验原料与制备方法采用高温固相法制备了Er3+/Yb3+不同浓度掺杂CaGd1-0.10-x Er x Yb0.10AlO4样品,记为CaGdAlO4ʒEr x, Yb0.10(x=0.006㊁0.008㊁0.010㊁0.012㊁0.014)㊂实验原料为CaCO3(纯度99.99%)㊁Gd2O3(纯度99.99%)㊁Al2O3(纯度99.99%)㊁Yb2O3(纯度99.99%)和Er2O3(纯度99.99%)㊂所有原料均购买自Aladdin公司,实验前未经过进一步处理㊂按照预制样品化学式摩尔比准确称取原料放入研钵,加入适量无水乙醇研磨1h 使其混合均匀,随后将混合原料放入Al2O3坩埚中,置于马弗炉500ħ煅烧3h,随炉降至室温后研磨1h㊂然后在空气气氛下,1450ħ进行二次煅烧4h,降温后经相同研磨过程得到所需粉末样品㊂最后,进行物相结构和形貌表征,以及室温和变温UC发光性能测试㊂1.2㊀性能测试与表征样品结构的表征,采用日本RIGAKU公司D/MAX-2500型X射线衍射(XRD)仪进行测试,其辐射光源为Cu-Kα(λ=0.154056nm),工作电流/电压分别为100mA/40kV;扫描范围10ʎ~80ʎ,扫描速度5(ʎ)/min,扫描步长0.02ʎ㊂样品形貌和尺寸的表征,通过美国FEI公司Quanta FEG型扫描电子显微镜(SEM)进行测试㊂样品室温UC发射谱的表征,以北京海特公司980nm固体激光器为激发光源,北京卓立汉光公司㊀第4期李玉强等:高热稳定CaGdAlO4ʒEr3+/Yb3+荧光粉的上转换发光及其温度传感性能651㊀OMINI-λ300型荧光光谱仪进行测试,其光电倍增管型号为CR131A㊂变温UC发射谱的温度控制,采用美国INSTEC公司HCP621G型冷热控温系统进行控温,其温度分辨率优于ʃ0.005K㊂2㊀结果与讨论2.1㊀结构和形貌特性CaGdAlO4ʒEr x,Yb0.10(0.006ɤxɤ0.014)粉末样品的XRD图谱如图1(a)所示㊂通过与CaGdAlO4标准卡(JCPDS:24-0192)比较发现,各样品的衍射峰尖锐且强度大,并没有出现新的衍射峰,这意味着合成了纯相的㊁结晶性良好的㊁Er3+/Yb3+共掺杂的CaGdAlO4粉末㊂从图1(b)中衍射峰(103)和(110)的局部放大可以看出,当Er3+掺杂浓度x从0.006增大到0.014时,衍射峰表现出向大衍射角方向偏移的变化趋势,这种变化是由较小离子半径的Er3+(r=1.062Å,CN=9)取代较大离子半径的Gd3+(r=1.107Å,CN=9)所引起的[22]㊂结果表明,采用高温固相法成功制备了纯相的Er3+/Yb3+掺杂CaGdAlO4粉末样品㊂为了确认粉末颗粒的大小和形貌,样品CaGdAlO4ʒEr0.010,Yb0.10的代表性SEM照片如图2所示㊂可以看出,颗粒形貌呈不规则形状,尺寸分布在0.6~4.2μm㊂对不同浓度Er3+掺杂样品而言,颗粒形貌和尺寸分布未发现明显变化㊂图1㊀CaGdAlO4ʒEr x,Yb0.10(x=0.006㊁0.008㊁0.010㊁0.012㊁0.014)粉末的XRD图谱Fig.1㊀XRD patterns of CaGdAlO4ʒEr x,Yb0.10(x=0.006,0.008,0.010,0.012,0.014)powders图2㊀CaGdAlO4ʒEr0.010,Yb0.10粉末的SEM照片Fig.2㊀SEM image of CaGdAlO4ʒEr0.010,Yb0.10powders2.2㊀UC发光特性为了研究CaGdAlO4ʒEr x,Yb0.10样品在室温条件下的发光性能,在980nm激光激发下,对500~700nm 的UC发射谱进行了测试,结果如图3所示㊂从图中可以看出,所有样品发射谱在绿光区528和550nm,以及红光区663nm处,出现了典型的Er3+的特征发射峰,依次归属于Er3+的2H11/2ң4I15/2㊁4S3/2ң4I15/2和4F9/2ң4I15/2能级跃迁[7]㊂由于绿光发光强度远大于红光,所有样品呈现明亮的绿色㊂随着Er3+掺杂浓度的增大,绿光和红光发射峰的峰形相似且峰位几乎没有变化,但受局域晶体场的影响,绿光发射带均劈裂成三个发射峰[6]㊂相似的发射谱峰型和峰位,常见于CaYAlO4ʒEr3+,Yb3+㊁SrGdAlO4ʒEr3+,Yb3+等荧光粉UC发射谱的相关报道[20-21]㊂当Er3+掺杂浓度x从0.006增大到0.010时,发光强度表现出逐渐增大的变化趋势;而当Er3+掺杂浓度x从0.010增大到0.014时,发光强度却表现出逐渐减小的变化趋势㊂当Er3+掺杂浓度x=0.010时,发光强度达到最大值㊂通过对500~575nm光谱范围发射峰积分强度随Er3+掺杂浓度的变化进行拟合,最佳发光强度对应Er3+掺杂浓度的拟合值(x=0.0104)接近于实验值(x=0.010),如图3插图所示㊂由于粒子尺寸未呈现显著变化,当Er3+掺杂浓度大于0.010时,发光强度的减小可能是增大了非辐射能量传递(energy transfer,ET)过程和Er3+之间的交叉弛豫(cross-relaxation,CR)过程[6]㊂随着Er3+掺杂浓度x从0.006增大到0.014,UC发射谱红绿光强度比表现为先从6.17减小到3.92,随后再增大到7.14,并在掺杂浓度x=0.010时达到最小比值㊂Er3+发光强度红绿比这种先减小随后增大的变化规律,也常见于LiLuW2O8ʒEr3+, Yb3+㊁NaYF4ʒEr3+,Yb3+㊁Ba2ScAlO5ʒEr3+,Yb3+等荧光粉的报道[23-25]㊂此外,当固定Er3+掺杂浓度x=0.010652㊀研究论文人工晶体学报㊀㊀㊀㊀㊀㊀第53卷时,所制备的CaGdAlO4ʒEr0.010,Yb y(y=0.06㊁0.08㊁0.10㊁0.12㊁0.14)荧光粉在980nm激发下的UC发射谱表明,当Yb3+掺杂浓度y=0.10时,发光强度达到最大值㊂为了理解980nm激发下CaGdAlO4ʒEr0.010,Yb0.10荧光粉的UC发光过程,160~1148mW激发功率范围的室温UC发射谱如图4所示㊂可以看出,随着激发功率的增大,发光强度表现出单调增大的变化趋势㊂众所周知,UC积分发光强度(I UC)与激发光功率(P)满足I UCɖP n[6,24,26],其中,n是参与UC发光过程所需泵浦光的光子数㊂UC发射谱中,发射峰积分强度随激发功率的双对数ln(I UC)-ln(P)曲线的线性拟合及其拟合参数如图4插图所示㊂可以计算出,528㊁550和663nm处的3个发射峰发光强度随激发功率变化的斜率(n)分别为1.65㊁1.56和1.52,这意味着UC发光主要是双光子吸收过程㊂本研究中,n的计算值偏离了理论值(n=2),可以解释为CR过程和能量反向传递(energy back transfer,EBT)过程,与占主导地位的ET过程,以及基态/激发态吸收(ground/excited state absorption,GSA/ESA)过程的相互竞争引起的[21,23]㊂图3㊀CaGdAlO4ʒEr x,Yb0.10(x=0.006㊁0.008㊁0.010㊁0.012㊁0.014)荧光粉的室温UC发射谱(λex=980nm),插图是500~575nm发光积分强度随Er3+掺杂浓度的变化Fig.3㊀UC emission spectra of CaGdAlO4ʒEr x,Yb0.10(x=0.006, 0.008,0.010,0.012,0.014)phosphors under980nm excitation at room temperature.The inset shows the integratedintensity as a function of Er3+concentrations in thewavelength range of500~575nm 图4㊀不同激发功率条件下CaGdAlO4ʒEr0.010,Yb0.10荧光粉的UC发射谱㊂插图是发射峰积分强度与激发光功率双对数拟合曲线Fig.4㊀UC emission spectra of CaGdAlO4ʒEr0.010,Yb0.10phosphors with different excitation powers.The insetshows the double logarithmic plot of integratedintensity as a function of excitation power为了进一步阐释CaGdAlO4ʒEr3+,Yb3+荧光粉UC发光的激发和发射机理,Er3+㊁Yb3+相关能级㊁辐射跃迁㊁无辐射弛豫(nonradiative relaxation,NR)过程等如图5所示㊂主要的UC发光过程表述为:在980nm激光激发下,Yb3+从基态2F7/2(Yb3+)激发至激发态2F5/2(Yb3+)㊂与此同时,Yb3+和Er3+之间通过ET过程ET1[2F5/2(Yb3+)+4I15/2(Er3+)ң2F7/2(Yb3+)+4I11/2(Er3+)]和ET2[2F5/2(Yb3+)+4I11/2(Er3+)ң2F7/2(Yb3+)+4F7/2(Er3+)][20],形成4F7/2(Er3+)能级布居㊂再通过NR过程NR1和NR2,形成2H11/2(Er3+)和4S3/2(Er3+)能级布居㊂随后,一部分通过辐射跃迁过程2H11/2(Er3+)ң4I15/2(Er3+)和4S13/2(Er3+)ң4I15/2(Er3+),产生峰值位于528和550nm处的绿光发射;另一部分则经NR过程NR3,形成4F9/2(Er3+)能级布居,再通过辐射跃迁过程4F9/2ң4I15/2(Er3+)产生峰值位于663nm处的红光发射㊂然而,Er3+-Er3+之间CR过程[2H11/2(Er3+)+4I15/2(Er3+)ң4I9/2(Er3+)+4I13/2(Er3+)][23],以及Er3+到Yb3+的EBT过程[4S3/2(Er3+)+ 2F7/2(Yb3+)ң4I13/2(Er3+)+2F5/2(Yb3+)][21],增强了4I13/2(Er3+)能级布居,再经能量传递过程ET3[2F5/2(Yb3+)+4I13/2(Er3+)ң2F7/2(Yb3+)+4F9/2(Er3+)][8],进一步增强了4F9/2(Er3+)能级布居,以及663nm红光发射㊂2.3㊀变温发光及温度传感特性为了研究温度对CaGdAlO4ʒEr0.010,Yb0.10荧光粉UC发光强度的影响,在980nm激发下,300~573K的变温发射谱如图6所示㊂可以看出,Er3+发射峰强度均表现出显著的温度依赖性㊂需要说明的是,变温光谱测试使用了约8W/cm2的激发功率密度以消除光热效应的影响[27-28]㊂通过图6插图中绿光发射峰的归一化㊀第4期李玉强等:高热稳定CaGdAlO 4ʒEr 3+/Yb 3+荧光粉的上转换发光及其温度传感性能653㊀积分强度可以看出,峰值在550nm 处的4S 3/2ң4I 15/2能级跃迁发射峰强度,表现出随温度升高而单调减小的变化趋势,但峰值在528nm 处的2H 11/2ң4I 15/2能级跃迁发射峰强度,却表现出随温度的升高先增大随后减小的变化趋势,这意味着4S 3/2和2H 11/2能级之间存在热布居过程,如图5中Heating 过程所示㊂一般情况下,热耦合能级的能量差应在200~2000cm -1[23,29-31],2H 11/2和4S 3/2能级能量差使得2H 11/2能级粒子布居可通过激发态4S 3/2能级的热激活过程实现,这引起了2H 11/2ң4I 15/2和4S 3/2ң4I 15/2辐射跃迁对应的积分发光强度发生了相对变化㊂图5㊀CaGdAlO 4ʒEr 3+,Yb 3+荧光粉的激发和发射机理(λex =980nm)Fig.5㊀Excitation and emission mechanisms of CaGdAlO 4ʒEr 3+,Yb 3+phosphors under 980nmexcitation 图6㊀CaGdAlO 4ʒEr 0.010,Yb 0.10荧光粉的变温发射谱(λex =980nm),插图是528和550nm 发射峰归一化积分强度在300~573K 温度范围的变化Fig.6㊀Temperature-dependent UC emission spectra of CaGdAlO 4ʒEr 0.010,Yb 0.10phosphors under 980nm excitation.The inset shows the normalized integrated UC luminescence intensity of 528and 550nm peaks in the temperature range of 300~573K图7为CaGdAlO 4ʒEr 0.010,Yb 0.10荧光粉温度依赖的FIR 528/550曲线㊂从图中可以看出,FIR 528/550随温度的升高表现出单调增大的变化趋势㊂基于Boltzmann 统计[4,32],峰值位于528nm(2H 11/2ң4I 15/2)和550nm(4S 3/2ң4I 15/2)处的FIR 可以表示为[5]FIR 528/550=I 528I 550=B exp(-ΔE c /k B T )(1)图7㊀CaGdAlO 4ʒEr 0.010,Yb 0.10荧光粉温度依赖的FIR 528/550Fig.7㊀Temperature-dependent FIR 528/550of CaGdAlO 4ʒEr 0.010,Yb 0.10phosphors式中:参数I ㊁B ㊁ΔE c ㊁k B 和T 分别代表发光积分强度㊁与温度无关的常数㊁热耦合能级能量差㊁玻尔兹曼常数和绝对温度㊂通过公式(1)进行数据拟合,拟合精度为0.9993,可以计算出2H 11/2和4S 3/2热耦合能级能量差ΔE c 为612.2cm -1,该数值非常接近Er 3+的2H 11/2和4S 3/2能级的能量差㊂为了评估CaGdAlO 4ʒEr 0.010,Yb 0.10荧光粉的温度传感特性,温度传感绝对灵敏度S A 和相对灵敏度S R 可以表示为[4,6]S A =∂FIR ∂T (2)S R =1FIR ∂FIR ∂T (3)通过公式(2)和(3),基于温度依赖的FIR 528/550参数,计算出CaGdAlO 4ʒEr 0.010,Yb 0.10荧光粉的S A 和S R 随温度的变化,如图8所示㊂可以看出,当温度从300K 经445K 再增大到573K 时,S A 从44.4ˑ10-4K -1(@300K)先增大到52.0ˑ10-4K -1(@445K),随后减小为49.0ˑ10-4K -1(@573K)㊂S R 则从0.95ˑ10-2K -1(@300K)单调减小到0.27ˑ10-2K -1(@573K)㊂根据Murat Erdem 等的研究[8,33],Er 3+/Yb 3+掺杂的钛酸盐㊁钒酸654㊀研究论文人工晶体学报㊀㊀㊀㊀㊀㊀第53卷盐㊁锗酸盐㊁磷酸盐㊁硅酸盐㊁铝酸盐和氟化物等荧光粉中,S A 的最大值位于(23~110)ˑ10-4K -1,对应的温度值分布在300~573K,这进一步佐证了CaGdAlO 4ʒEr 0.010,Yb 0.10荧光粉具有较高的测温灵敏度㊂为了进一步表征温度传感特性,热重复性可表征为[26,34-35]R =1-Max FIR a -FIR i FIR a (4)式中:FIR a 为测温参数FIR 的平均值,FIR i 为升降温过程FIR 的实测值㊂CaGdAlO 4ʒEr 0.010,Yb 0.10荧光粉基于测温参数FIR 528/550与冷热循环次数的依赖关系如图9所示㊂可以看出,基于测温参数FIR 528/550的热重复性优于98%,这也进一步表明CaGdAlO 4ʒEr 0.010,Yb 0.10荧光粉具有优异的热稳定性㊂图8㊀S A 和S R 随温度的变化Fig.8㊀S A and S R versus temperature 图9㊀CaGdAlO 4ʒEr 0.010,Yb 0.10荧光粉FIR 528/550测温参数随冷-热循环次数的变化Fig.9㊀FIR 528/550of CaGdAlO 4ʒEr 0.010,Yb 0.10phosphors as a function of heating-cooling cycling number 3㊀结㊀㊀论采用高温固相法成功制备了Er 3+/Yb 3+共掺杂的纯相的CaGdAlO 4荧光粉㊂颗粒形貌呈无定形态,尺寸分布在0.6~4.2μm㊂在980nm 激光激发下,CaGdAlO 4ʒEr 0.010,Yb 0.10样品的发光强度最大,发射谱位于528㊁550和663nm 处的发射峰,分别归属于Er 3+的2H 11/2ң4I 15/2㊁4S 3/2ң4I 15/2和4F 9/2ң4I 15/2能级跃迁㊂300~573K 的变温发射谱表明,该荧光粉表现出优异的温度传感特性㊂基于FIR 528/550参数,S A 最大值为52.0ˑ10-4K -1(@445K),S R 最大值为0.95ˑ10-2K -1(@300K)㊂冷热循环实验表明该材料的热重复性优于98%㊂结果表明,CaGdAlO 4ʒEr 0.010,Yb 0.10荧光粉在光学温度传感领域具有一定的应用价值㊂参考文献[1]㊀WANG X F,LIU Q,BU Y Y,et al.Optical temperature sensing of rare-earth ion doped phosphors[J].RSC Advances,2015,5(105):86219-86236.[2]㊀LIU Y,WANG Z X,MIAO K,et al.Research progress on near-infrared long persistent phosphor materials in biomedical applications[J].Nanoscale Advances,2022,4(23):4972-4996.[3]㊀DEDYULIN S,AHMED Z,MACHIN G.Emerging technologies in the field of thermometry[J].Measurement Science and Technology,2022,33(9):092001.[4]㊀WANG Q A,LIAO M,LIN Q M,et al.A review on fluorescence intensity ratio thermometer based on rare-earth and transition metal ions dopedinorganic luminescent materials[J].Journal of Alloys and Compounds,2021,850:156744.[5]㊀JAQUE D,VETRONE F.Luminescence nanothermometry[J].Nanoscale,2012,4(15):4301-4326.[6]㊀LI X X,BAO B T,HE X Y,et al.Optical temperature sensing with an Er 3+,Yb 3+co-doped LaBMoO 6single crystal[J].Journal of MaterialsChemistry C,2023,11(7):2494-2504.[7]㊀XU Z Q,CHEN L H,ZHANG L Q,et al.Yb /ErʒCs 2Ag(In /Bi)Cl 6lead-free double perovskite for dual-modal optical temperature sensing[J].Journal of Luminescence,2022,248:118996.[8]㊀CUI H Q,CAO Y Z,ZHANG Y H,et al.Upconversion luminescence thermal enhancement and emission color modulation of LiYGeO 4ʒEr 3+/Yb 3+phosphors[J].Journal of Alloys and Compounds,2022,927:167107.[9]㊀WANG P F,LI K A,JIN Y C,et al.Spectral properties and high-efficiency broadband laser operation of TmʒCaY 0.9Gd 0.1AlO 4crystal[J].㊀第4期李玉强等:高热稳定CaGdAlO4ʒEr3+/Yb3+荧光粉的上转换发光及其温度传感性能655㊀Optics&Laser Technology,2023,161:109217.[10]㊀ZHANG N,WANG H Y,YIN Y Q,et al.Cracking mechanism and spectral properties of Er,YbʒCaGdAlO4crystals grown by the LHPG method[J].CrystEngComm,2020,22(5):955-960.[11]㊀LI X J,ZHANG Y,GENG D L,et al.CaGdAlO4ʒTb3+/Eu3+as promising phosphors for full-color field emission displays[J].Journal ofMaterials Chemistry C,2014,2(46):9924-9933.[12]㊀HU Q Q,JIA Z T,TANG C,et al.The origin of coloration of CaGdAlO4crystals and its effect on their physical properties[J].CrystEngComm,2017,19(3):537-545.[13]㊀PAN Z B,LOIKO P,SLIMI S,et al.Tm,Ho:Ca(Gd,Lu)AlO4crystals:crystal growth,structure refinement and Judd-Ofelt analysis[J].Journal of Luminescence,2022,246:118828.[14]㊀MARTA MOLTENI L,PIRZIO F,MANZONI C,et al.Few-optical-cycle pulse generation based on a non-linear fiber compressor pumped by alow-energy Yb:CALGO ultrafast laser[J].Optics Express,2020,28(9):13714.[15]㊀PAN Z B,LOIKO P,SERRES J M,et al. Mixed TmʒCa(Gd,Lu)AlO4 a novel crystal for tunable and mode-locked2μm lasers[J].Optics Express,2019,27(7):9987.[16]㊀DI J Q,XU X D,XIA C T,et al.Growth and spectra properties of Tm,Ho doped and Tm,Ho co-doped CaGdAlO4crystals[J].Journal ofLuminescence,2014,155:101-107.[17]㊀ZHANG X Y,LIU Y X,ZHANG M,et al.Efficient deep ultraviolet to near infrared quantum cutting in Pr3+/Yb3+codoped CaGdAlO4phosphors[J].Journal of Alloys and Compounds,2018,740:595-602.[18]㊀ZHANG Y,LIU X M,LI X J,et al.Overcoming crystallographically imposed geometrical restrictions on the valence state of Eu in CaGdAlO4:realization of white light emission from singly-doped Eu phosphors[J].Dalton Transactions,2015,44(17):7743-7747.[19]㊀LI Y Q,YANG J A,WANG M W,et al.Tm3+/Yb3+codoped CaGdAlO4phosphors for wide-range optical temperature sensing[J].Journal ofLuminescence,2022,248:118935.[20]㊀PERRELLA R V,SCHIAVON M A,PECORARO E,et al.Broadened band C-telecom and intense upconversion emission of Er3+/Yb3+co-doped CaYAlO4luminescent material obtained by an easy route[J].Journal of Luminescence,2016,178:226-233.[21]㊀LI X X,LI J T,XU X F,et al.Bi3+assisted enhancement of photoluminescence and thermal sensing of Er3+/Yb3+co-doped SrGdAlO4phosphor with unusual stable color[J].Ceramics International,2021,47(6):8538-8544.[22]㊀SHANNON R D.Revised effective ionic radii and systematic studies of interatomic distances in halides and chalcogenides[J].ActaCrystallographica Section A,1976,32(5):751-767.[23]㊀YUN X Y,ZHOU J,ZHU Y H,et al.Green up-conversion luminescence and optical thermometry of Yb3+/Er3+co-doped LiLuW2O8phosphor[J].Journal of Physics and Chemistry of Solids,2022,163:110545.[24]㊀ZHANG M L,ZHAI X S,LEI P P,et al.Selective enhancement of green upconversion luminescence from NaYF4ʒYb,Er microparticles throughGa3+doping for sensitive temperature sensing[J].Journal of Luminescence,2019,215:116632.[25]㊀HU J S,BIAN X M,WANG R N,et al.Single red upconversion luminescence inβ-Ba2ScAlO5ʒYb3+/Er3+phosphor assisted by Ce3+ions[J].Journal of Luminescence,2022,246:118832.[26]㊀LI M J,SU L B,CHEN X Y,et al.Effect of Yb3+concentration on Er3+doped CaF2single crystal for temperature sensor applications[J].Optics Communications,2022,520:128488.[27]㊀LI D Y,WANG Y X,ZHANG X R,et al.Optical temperature sensor through infrared excited blue upconversion emission in Tm3+/Yb3+codoped Y2O3[J].Optics Communications,2012,285(7):1925-1928.[28]㊀LU H Y,YANG J S,HUANG D C,et al.Ultranarrow NIR bandwidth and temperature sensing of YOFʒYb3+/Tm3+phosphor in low temperaturerange[J].Journal of Luminescence,2019,206:613-617.[29]㊀AVRAM D,TISEANU C.Thermometry properties of Er,Yb-Gd2O2S microparticles:dependence on the excitation mode(cw versus pulsedexcitation)and excitation wavelength(980nm versus1500nm)[J].Methods and Applications in Fluorescence,2018,6(2):025004. [30]㊀ZHANG H J,DONG X B,JIANG L Y,et parative analysis of upconversion emission of LaF3ʒEr/Yb and LaOFʒEr/Yb for temperaturesensing[J].Journal of Molecular Structure,2020,1206:127665.[31]㊀HU C L,LEI L,WANG Y B,et al.Improved thermally coupled levels based temperature sensing performance by engineering host phonon energy[J].Journal of Luminescence,2022,252:119357.[32]㊀GAO W X,GE W Y,SHI J D,et al.A novel upconversion optical thermometers derived from non-thermal coupling levels of CaZnOS:Tm/Ybphosphors[J].Journal of Solid State Chemistry,2021,297:122063.[33]㊀ERDEM M,CANTÜRK S B,ERYÜREK G.Upconversion Yb3+/Er3+ʒLa2Ti2O7phosphors for solid-state lighting and optical thermometry[J].Spectrochimica Acta Part A:Molecular and Biomolecular Spectroscopy,2022,270:120854.[34]㊀NEXHA A,CARVAJAL J J,PUJOL M C,et nthanide doped luminescence nanothermometers in the biological windows:strategies andapplications[J].Nanoscale,2021,13(17):7913-7987.[35]㊀ZI Y Z,YANG Z W,XU Z,et al.A novel upconversion luminescence temperature sensing material:negative thermal expansion Y2Mo3O12ʒYb3+,Er3+and positive thermal expansion Y2Ti2O7ʒYb3+,Er3+mixed phosphor[J].Journal of Alloys and Compounds,2021,880:160156.。
表面增强拉曼试纸的制备及保质性

1 实验 部 分
1 . 1 试 剂与 仪器
罗丹 明 6 G和银粉 ( 分 析纯 ,阿拉丁试 剂公 司) ; 双 圈牌 滤纸 ( 杭州 沃华 滤纸 有 限公 司 ) . J O B I N Y V O N T 6 4 0 0 0共 聚焦显 微 拉 曼 光 谱 仪 ;J E O L J S M- 6 7 0 0 F场 发 射 扫 描 电子 显 微 镜 ( S E M) ; S I M0 0 B — O L E D真空 镀膜 机 ( 沈 阳四达真 空技术 应用 研究 所 ) ; MB 2 0 0 G手套 箱 ( E t e l u x 公 司) .
模板 真 空蒸镀 银膜 制备 的金属 粗糙 表面 会 由于褶 皱和 纳米纤 维 的周期 性 以及银 膜 的粗糙度 共 同作用 使 入射 光在 表 面产生局 域 电场增 强
2 . 2 试纸 S E R S检 测
, 从 而使 拉曼 信号 得 到增强 .
为 了验证 滤纸 的多级 纤维 结构 对表 面增强 拉曼 信号 的 贡献 ,在 S E R S试 纸 与玻 璃 片上 分 别用 P V D
表 面 增 强 拉 曼 试 纸 的 制 备 及 保 质 性
张文译 ,肖鑫泽 , 刘学青 , 张 然, 徐 颖
( 吉林 大学电子科学与工程学院 , 集成光 电子学 国家重点联合 实验 室 , 长春 1 3 0 0 1 2 )
摘要
以滤纸的多级纤维 结构 为基底 , 通过物理气 相沉积 ( P V D) 方法蒸 镀一定 厚度 的银 膜 ,制备 了表 面增
2 结果 与 讨 论
2 . 1 滤 纸表 面形 貌分 析
由滤纸 的 S E M 照片 ( 图1 ) 可见 ,其多 级 纤维 结 构 包 括 2 0~1 0 0 m 的微 米 尺 度纤 维 [ 图 1 ( A) ] 、
异质结构-NaGdF_(4)Yb,Er纳米棒负载在金属有机框架上以调节上转换光致发光
第40卷第2期2021年4月红外与毫米波学报J.Infrared Millim.Waves Vol.40,No.2 April,2021文章编号:1001-9014(2021)02-0166-06DOI:10.11972/j.issn.1001-9014.2021.02.005The heterostructure NaGdF4:Yb,Er nanorods loaded on metal-organicframeworks for tuning upconversion photoluminescenceLIU Yi,JIAO Ji-Qing*,LYU Bai-Ze,WANG Jiu-Xing(College of Materials Science and Engineering,National Center of International Joint Research for Hybrid Materials Technology,National Base of International Sci.&Tech.Cooperation,Qingdao University,Qingdao266071,China)Abstract:Multi-component heterostructure nanocomposites can not only inherit the original properties of eachcomponent,but also induce new chemical and electronic properties through the interaction between the compo⁃nents.The heterostructure zeolitic imidazolate framework/NaGdF4:Yb,Er(ZIF-67/NaGdF4:Yb,Er)was pre⁃pared by a stepwise synthesis strategy.And it avoided agglomeration and quenching of upconversion(UC)nanoparticles,and displayed better stability.In the heterostructure nanocomposites,ZIF-67is employed as an en⁃ergy transmission platform under980nm pared to pure NaGdF4:Yb,Er nanorods,the UC photo⁃luminescence of heterostructure ZIF-67/NaGdF4:Yb,Er is tuned from green to red owing to the synergistic effect of each component.Key words:heterostructure,controllable synthesis,nanocomposite,luminescence,upconversionPACS:42异质结构—NaGdF4:Yb,Er纳米棒负载在金属有机框架上以调节上转换光致发光刘毅,焦吉庆*,吕柏泽,王久兴(青岛大学材料科学与工程学院国家杂化材料技术国际联合研究中心国际科学技术合作国家基地,山东青岛266071)摘要:多组分异质结构纳米复合材料不仅可以继承每个组分原有的性能,而且还可以通过组分之间的相互作用诱导出新的化学、电子性能。
人参皂苷治疗骨性关节炎的研究进展

特产研究163Special Wild Economic Animal and Plant ResearchDOI:10.16720/ki.tcyj.2023.093人参皂苷治疗骨性关节炎的研究进展郭校妍1,张伟东1,张扬1※(吉林大学药学院,吉林长春130021)摘要:人参在防治关节软骨损伤退变及参与体外培养软骨细胞修复关节软骨缺损中具有较好治疗前景。
人参皂苷作为人参的主要药理活性成分,在治疗骨性关节炎的进程中发挥关键作用。
人参皂苷根据不同的结构被分为不同的类型,各类型均含有多种人参皂苷单体成分,其治疗骨性关节炎的机制也各不相同。
本文对不同人参皂苷单体治疗骨性关节炎的研究进行梳理和总结,探讨其治疗骨性关节炎的潜在可能性和作用机制,为后期临床应用提供依据。
关键词:骨性关节炎;人参皂苷;信号通路中图分类号:R285文献标识码:A文章编号:1001-4721(2023)03-0163-06Research Progress of Ginsenosides in the Treatment of OsteoarthritisGUO Xiaoyan1,ZHANG Weidong1,ZHANG Yang1※(School of Pharmaceutical Sciences,Jilin University,Changchun130021,China)Abstract:Ginseng has pharmacological effects such as anti-inflammatory,antioxidant,antidepressant,anti-Alzheimer's and anti-athero-sclerosis.Current studies have found that it has good therapeutic prospects in preventing degeneration of articular cartilage damage and parti-cipating in in vitro culture of chondrocytes to repair articular cartilage defects.Ginsenosides,as the main pharmacological active component of ginseng,also play an important role in the process of treating osteoarthritis.Ginsenosides can be classified into different types because of their different structures,and each type contains a variety of ginsenoside monomer components with different mechanisms for the treatment of osteoarthritis.In this paper,we review the research progress of different ginsenoside monomers in the treatment of osteoarthritis,and ex-plore their potential possibilities and mechanisms for the treatment of osteoarthritis,so as to provide a basis for later clinical application. Key words:osteoarthritis;ginsenosides;signaling pathway骨性关节炎(Osteoarthritis,OA)是一种退行性病变,系由于增龄、肥胖、遗传、劳损、创伤、关节先天性异常和关节畸形等诸多因素引起的关节软骨退化损伤、关节边缘和软骨下骨反应性增生。
ZnWO4∶Er 3+,Yb 3+纳米棒的制备及发光性能
无 Hale Waihona Puke 机 化 学
学
报
C HI N ES E J OUR NAL OF I NORGANI C C HEMI S T RY
Vo 1 . 2 6 N o . 6 l 0 7 8 . 1 0 8 2
Z n WO 4 : E P, Y b 纳米 棒 的 制备及 发 光 性 能
Ab s t r a c t :Z n WO d n a n o r o d s C O . d o p e d E r 3 a n d Yb i o n s we r e s y n t h e s i z e d b y h y d r o t h e r ma l me t h o d u s i n g p o l y e — t h y l e n e g l y c o l a s d i s p e r s a n t .X— r a y d i f f r a c t i o n ,t r a n s mi s s i o n e l e c t r o n mi c r o s c o p e c h a r a c t e r i z a t i o n s s h o w t h a t t h e o b t a i n e d p r o d u c t s a r e h o mo g e n e o u s Z n WO 4 n a n o r o d s wi t h d i a me t e r s o f a b o u t 2 0 n m. T h e u p — c o n v e r s i o n s p e c t r u m wa s me a s u r e d w i t h s p e c t r o p h o t o me t e r ,u n d e r 9 8 0 n m d i o d e l a s e r e x c i t a t i o n . T h e r e s u l t s i n d i c a t e t h e r e a r e t h r e e
β-NaYF4:Yb,Er复合丝素荧光薄膜的制备与表征

β-NaYF4:Yb,Er复合丝素荧光薄膜的制备与表征祁宁;赵兵【摘要】采用高温热分解法合成β-NaYF4:Yb,Er纳米晶体,然后将丝素薄膜作为柔性基底材料与β-NaYF4:Yb,Er复合制备了一种丝素基荧光薄膜.使用透射电镜(TEM)、高分辨透射电镜(HRTEM)、X-射线衍射仪(XRD)、傅立叶红外光谱仪(FT-IR)、紫外可见分光光度计、荧光光谱仪对β-NaYF4:Yb,Er和丝素基荧光薄膜进行表征.结果表明:β-NaYF4:Yb,Er纳米晶体平均粒径35 nm,分散性良好,六方相,表面包覆油酸.β-NaYF4:Yb,Er纳米晶体质量浓度对丝素基荧光薄膜的透光率有重要影响,随β-NaYF4:Yb,Er质量浓度的提高,丝素基荧光薄膜的透光率不断减小.丝素基荧光薄膜在980 nm激光器激发下荧光光谱图中有3个发射峰,分别对应于Er3+离子2H1/2→4I15/2(520 nm)、4S3/2→4I15/2(540 nm)、4F9/2→4I15/2(660 nm)能级跃迁,其主要的发光机制是能量传递上转换.%β-NaYF4:Yb,Er nanocrystals were firstly prepared by thermal decomposition and then spin-coated on silk fibroin film substrate to obtain fluorescence silk fibroin film. β-NaYF4:Yb,Er nanocrystals and fluorescence silk fibroin film were characterized by transmission electron microscopy (TEM), high resolution transmission electron microscopy (HRTEM), X-ray diffraction (XRD), Fourier transform infrared spectroscopy (FT-IR), fluorescence spectra and optical transmittance spectra. It could be seen that the as-prepared β-NaYF4:Yb,Er nanocrystals with the average size of 35 nm were well dispersed, hexagonal-phase and coated with oleic acid. The concentration of β-NaYF4:Yb,Er nanocrystals had a major impact on transmittance of fluorescence silk fibroin film. The transmittance decreased withconce ntration increasing of β-NaYF4:Yb,Er nanocrystals. The UC emission spectrum of fluorescence silk fibroin film under 980 nm laser excitation showed three emissions located around 520, 540 and 660 nm, which arose from the 4f configuration transitions of Er3+ from 2H11/2 to 4I15/2, 4S3/2 to 4I15/2 and 4F9/2 to 4I15/2, respectively. The main upconversion luminescence mechanism was energy transfer upconversion (ETU).【期刊名称】《印染助剂》【年(卷),期】2017(034)008【总页数】5页(P15-19)【关键词】丝素;β-NaYF4:Yb,Er;纳米晶体;荧光;薄膜【作者】祁宁;赵兵【作者单位】苏州大学纺织与服装工程学院,江苏苏州 215000;现代丝绸国家工程实验室,江苏苏州 215000;苏州大学纺织与服装工程学院,江苏苏州 215000;现代丝绸国家工程实验室,江苏苏州 215000【正文语种】中文【中图分类】O484.4柔性发光薄膜在太阳能电池、显示器、LED、可植入设备中有重要的应用价值[1]。
反应物浓度对NaYF4∶yb3+,Tm3+晶相的影响

反应物浓度对NaYF4∶yb3+,Tm3+晶相的影响陈喆;刘真育;赵丹;秦伟平【摘要】利用水热法,制备了具有不同形貌的NaYF4:20% Yb3+,1%Tm3+上转换发光粒子.利用扫描电子显微镜、X射线衍射分析、发光光谱测量等手段对样品进行了形貌、晶相和发光性质的表征.结果表明,通过调控反应物的浓度,可以实现NaYF4基质从立方相到六角相的晶相转变.在980 nm红外光的激发下,六角相的NaYF4∶ 20% Yb3+,1% Tm3+上转换发光粒子发出蓝紫色可见光.通过分析反应物浓度对产物晶相的影响,为制备晶相可控的上转换发光材料提供了新的实验依据.%A series of NaYF4: 20% Yb3 +, 1 % Tm3 + upconversion particles( UCPs ) with different morphology were prepared by the facile hydrothermal approach. The morphology, crystalline phase and optical properties were characterized by scanning electron microscopy ( SEM) , X-ray diffraction (XRD) and luminescent spectra. XRD patterns and SEM images showed that the UCPs crystalline phase tansformed from cubic phase to hexagonal phase by controlling the reactants concentration. Pumped with 980 nm diode laser, the UCPs emitted bright violet/blue upconversion luminescence. By analyzing the effect of reactants concentration on the products crystalline phase, the crystal growth mechanism of NaYF4 was studied in detail. Significantly, our research work would provide more experimental data for controlling the crystalline phase of the upconversion luminescent materials.【期刊名称】《发光学报》【年(卷),期】2011(032)009【总页数】5页(P853-857)【关键词】NaYF4;稀土;反应物浓度;晶相;上转换发光【作者】陈喆;刘真育;赵丹;秦伟平【作者单位】吉林大学电子科学与工程学院集成光电子国家重点联合实验室,吉林长春130012;吉林大学电子科学与工程学院集成光电子国家重点联合实验室,吉林长春130012;吉林大学电子科学与工程学院集成光电子国家重点联合实验室,吉林长春130012;吉林大学电子科学与工程学院集成光电子国家重点联合实验室,吉林长春130012【正文语种】中文【中图分类】O482.31近年来,稀土离子掺杂的上转换发光材料在激光、光学通信、平板显示以及医学成像等领域的应用日益广泛,受到了人们越来越多的关注与研究。
注射用泮托拉唑钠中依地酸二钠含量分析方法的建立

注射用泮托拉唑钠中依地酸二钠含量分析方法的建立雷小平杨明亮姚吉勰陈青连(杭州澳亚生物技术股份有限公司杭州 310018)摘要目的:建立高效液相色谱法测定注射用泮托拉唑钠中依地酸二钠的含量。
方法:采用十八烷基硅烷键合硅胶为填充剂的C18色谱柱(4.6 mm×250 mm,5 m m),以磷酸盐缓冲液-乙腈(90∶10)、乙腈进行梯度洗脱,流速为1.0 mL/min,检测波长为254 nm,柱温为35 ℃,进样体积为20 m L。
结果:依地酸二钠的检测不受其他成分干扰,不同浓度依地酸二钠的回收率均在98.0%~102.0%之间,回收率RSD为0.39%,浓度在27.52~64.20 m g/mL范围内线性良好(r=1.000 0)。
结论:本方法简便、迅速、专属性及重现性好,可用于注射用泮托拉唑钠中依地酸二钠含量的测定。
关键词依地酸二钠注射用泮托拉唑钠含量高效液相色谱法中图分类号:O657.72; R975.2 文献标志码:A 文章编号:1006-1533(2022)05-0077-04引用本文雷小平, 杨明亮, 姚吉勰, 等. 注射用泮托拉唑钠中依地酸二钠含量分析方法的建立[J]. 上海医药, 2022, 43(5): 77-80.Establishment of method for disodium edetate in pantoprazole sodium for injectionLEI Xiaoping, YANG Mingliang, YAO Jixie, CHEN Qinglian(Hangzhou Ausia Biological Tech. Co., Ltd., Hangzhou 310018, China)ABSTRACT Objective: To establish a high performance liquid chromatography (HPLC) method for the determination of disodium edetate in pantoprazole sodium for injection. Methods: HPLC was performed using C18 column (4.6 mm×250 mm, 5 μm) with gradient elution containing phosphate buffer-acetonitrile (90:10) (A) and acetonitrile (B) at a flow rate of 1.0 mL/min, detection wavelength 254 nm, column temperature 35 ℃ and sample volume 20 m L. Results: The determination of disodium edetate was not interfered by other components in the injection. The recovery rates of different concentrations of disodium edetate were between 98.0%-102.0% with RSD 0.39%. Standard curve of disodium edetate showed good linearity over the range of27.52-64.20 m g/mL with r=1.000 0. Conclusion: This method is simple, rapid, specific and reproduceable and can be used for thedetermination of disodium edetate in pantoprazole sodium for injection.KEy WORDS disodium edetate; pantoprazole sodium for injection; assay; HPLC依地酸和依地酸盐在药物制剂、化妆品和食品中被用作螯合剂,它们与碱土金属和重金属离子形成稳定的水溶性络合物(螯合剂)。
美国ISP公司推出新型乳液聚丁二烯橡胶产品

的 极性, 从而使得该改性剂于其他的极性树脂具有很好的
相容 性 。这种 新 的改 性剂 可 以溶于 甲苯 、丁酮 、丙酮 和 其
该聚 合物 在轮胎 应 用 中可替 代 1 % 以 上的 天然 橡胶 而不 5
影响 轮胎 性能 。 的聚 合物 生产 技术 已被 授 予专 利权 , 新 虽
维普资讯
” 百~ f …
该项目 将在20 :3 08 ̄ 月起正式投产, f E 扩能后东丽集 住友 3 开发出 00 rm 极薄 电磁噪音吸收膜 M .a 8
团 的 AB S总产 能将 达到 4 . 吨 /年 。与此 同 时 ,该 子 0 2万
该产品采用向超薄柔软的树脂层中高密度填充磁性
填 充剂 、 分层 涂覆 丙烯 酸 类粘 接剂 的结构 , 可吸 收 1 M~ 0
3 GHz的大泛 围 电磁 噪音 , 将其 转化 为微 小热 量 ,从 而 并 确保 流经 柔 性电路 板 的信号 传输 质 量。 这种 新 型 电磁 噪音 吸 收片 以超薄 为 卖点 ,预计 在 超 小 、 薄 以及 多功 能 和高 性能 、高密度 设计 的设 备领 域 存 超 在很 大需 求 。
他胶 粘 剂和 涂料 系统 常用 的溶 剂 中。
然 际 在实 应用中 不减 原 成本, 举可 该公 并 少总 材料 但此 使 美国 IP 司推出新型乳液聚丁二烯橡胶产 品 S 公
司在 天然橡胶 价格 上升或供应 紧缺 时在轮胎 生产 中具备 更 大 的经 营 灵活 性和 更强 的竞 争 力。 目前 世界最 大的乳 聚 丁苯橡胶 厂家 美 国IP 司近期 S 公 向市 场推 出了该公 司 新开 发 的乳 液 聚 丁二烯 橡胶 产 品。
视黄醇结合蛋白测定试剂盒(胶乳免疫比浊法)产品技术要求新创源生物

视黄醇结合蛋白测定试剂盒(胶乳免疫比浊法)1.1规格具体产品规格见下表:1.2组成成分1.2.1试剂的组成试剂1:Tris缓冲液≥50mmol/LPEG6000≥15g/L试剂2:Tris缓冲液≥100mmol/LRBP抗体胶乳颗粒≥2g/L1.2.2校准品的组成(选配)测定血清时:单水平:牛血清白蛋白20g/L视黄醇结合蛋白(80.0~125.0)mg/L多水平:牛血清白蛋白20g/L视黄醇结合蛋白水平1:0.0mg/L水平2:(10.0~20.0)mg/L水平3:(20.0~40.0)mg/L水平4:(40.0~80.0)mg/L水平5:(80.0~125.0)mg/L测定尿液时:单水平:视黄醇结合蛋白(8.00~12.00)mg/L多水平:视黄醇结合蛋白水平1:0.00mg/L水平2:(1.00~2.00)mg/L水平3:(2.00~4.00)mg/L水平4:(4.00~8.00)mg/L水平5:(8.00~12.00)mg/L1.2.3质控品的组成(选配)测定血清时:牛血清白蛋白20g/L视黄醇结合蛋白水平1:(30.0~80.0)mg/L水平2:(80.1~120.0)mg/L测定尿液时:视黄醇结合蛋白水平1:(0.50~2.00)mg/L水平2:(2.00~4.00)mg/L校准品、质控品有批间差异,具体浓度见靶值表。
2.1外观试剂1:无色透明液体,无沉淀及絮状悬浮物;试剂2:乳白色液体,无沉淀及絮状悬浮物;校准品:无色或淡黄色澄清液体,无沉淀及絮状悬浮物;质控品:无色或淡黄色澄清液体,无沉淀及絮状悬浮物;试剂盒外包装完整无破损。
2.2装量液体试剂装量应不低于标示值。
2.3试剂空白吸光度在波长570nm/800nm、37℃条件下,试剂空白吸光度不大于2.0。
2.4分析灵敏度2.4.1血清检测浓度为50.0mg/L的样本时,吸光度变化不小于0.05。
2.4.2尿液检测浓度为1.00mg/L的样本时,吸光度变化不小于0.01。
WHO International Standard 1st WHO International Standard for Human Papillomavirus (HPV) Type 16 DNA

WHO International Standard1st WHO International Standard for Human Papillomavirus (HPV)Type 16 DNA NIBSC code: 06/202 Instructions for use(Version 2.0, Dated 10/11/2010)1. INTENDED USEThe 1st International Standard for HPV Type 16 (HPV-16) DNA Nucleic Acid Amplification Techniques consists of a freeze-dried preparation of recombinant plasmid containing full-length HPV-16 DNA cloned via its unique BamH1 site (Quint et al., 2006). The standard has been formulated in a background of purified human genomic DNA, lyophilized in 0.5 ml aliquots and stored at -20 °C. The material was calibrated in an international collaborative study involving 19 laboratories (Wilkinson et al., 2008). The International Standard contains material that is proprietory to third parties and should be used for the sole purpose of calibrating in-house or working standards for the amplification and detection of HPV-16 DNA. The International Standard should not be used for any other purpose and should be discarded after use. 2. CAUTIONThis preparation is not for administration to humans .This material contains DNA derived from C33A cells. As with all materials of biological origin, this preparation should be regarded as potentially hazardous to health. It should be used and discarded according to your own laboratory's safety procedures. Such safety procedures should include the wearing of protective gloves and avoiding the generation of aerosols. Care should be exercised in opening ampoules or vials, to avoid cuts.3. UNITAGEThe 1st International Standard for HPV-16 DNA Nucleic Acid Amplification Techniques has been assigned a unitage of 5 x 10⁶ International Units (IU) per ampoule.Traceability statement:It was proposed at a WHO meeting in January 2008 (WHO Meeting Report, 2008) that the instructions for use of the International Standard for HPV-16 DNA include the calculations and assumptions used in determining the theoretical HPV-16 qenome equivalents (GEq) of the bulk material used in formulating the International Standard, thus demonstrating that 1 IU is equivalent to 1 GEq for HPV-16 DNA . The definitive unitage of the 1st WHO International Standard for HPV-16 DNA therefore remains as IU while the traceability statement would allow users to equate IU with GEq.Assays for DNA concentration of the recombinant HPV-16 plasmid stock preparation were performed in Dr Cosette Wheeler‟s laboratory, University of New Mexico (UNM). DNA concentrations were determined by absorbance at 260 nm as well as spectrofluorometrically using the Picogreen assay (Invitrogen Corporation, USA). A correlation coefficient of 0.95 or higher was obtained between the two DNA measurements. 10 ng HPV-16 plasmid DNA/μl was supplied to NIBSC for formulating the bulk material for subsequent freeze-drying. The UNM laboratory also provided NIBSC with a statement indicating that 1.0 x 10¹¹ GEq/ml for HPV-16 is equal to 1.17 ng/μl. 10 ng HPV-16 plasmid DNA/μl plasmid stock preparation is therefore equivalent to 8.547 x 10¹¹ HPV-16 GEq/ml. NIBSC used this data in formulating the 1st International Standard for HPV Type 16 DNA.Formulation of bulk material for the 1st International Standard for HPV Type 16 DNA (NIBSC code 06/202):At NIBSC, the bulk HPV-16 plasmid DNA material was prepared according to the formula:HPV GEq/ml of bulk material = (HPV GEq/ml of plasmid stock x volume plasmid stock) / volume bulk material.Therefore,HPV-16 GEq/ml of bulk material = (8.547 x 10¹¹ HPV-16 GEq/ml plasmid stock) x (0.02223 ml HPV-16 plasmid stock) / 1900 ml HPV-16 bulk material = 1.0 x 10⁷ HPV-16 GEq/ml bulk materialThe HPV-16 DNA bulk material was subsequently freeze-dried in 0.5 ml aliquots.Certain assumptions are required for equating IU to GEq for the 1st International Standard for HPV-16 DNA: 1) 1.0 x 10¹¹ GEq/ml for HPV-16 is equal to 1.17 ng/μl. 2) There is no loss in activity of the HPV-16 DNA upon lyophilization. 3) The recombinant HPV-16 plasmid DNA accurately mimics the activity of HPV-16 viral DNA in biological samples.Independent calculation of GEq/ml for recombinant HPV-16 plasmid DNA.NIBSC also independently calculated the genome equivalence of the HPV-16 plasmid stock preparation and bulk preparation in which the molecular weights of the full-length HPV-16 genome and pBR322 DNA were based on sequence content using BioEdit Sequence Alignment Editor v7.0.5.3 (Tom Hall, Isis Pharmaceuticals Inc., USA). The sequences used for determining the molecular weights are GenBank Accession number J01749.1 for pBR322 and the reference sequence for HPV16 (Accession K02718).BioEdit dataDNA molecule: HPV16 Accession K02718 Length = 7904 base pairsMW= 4786756.00 Daltons, double strandedDNA molecule: cloning vector pBR322 Length = 4361 base pairsMW= 2653867.00 Daltons, double strandedFormulaeGEq/ml of the HPV plasmid stock was calculated according to the formula: GEq/ml of the HPV plasmid stock = (DNA concentration of HPV plasmid stock) x (MW of HPV DNA + MW of pBR322)-1 x (Avogadro‟s Number) where Avogadro‟s Number = 6.022x10²³ molecules/molGEq/ml of the bulk HPV DNA materials was calculated according to the formula:HPV GEq/ml of bulk material = (HPV GEq/ml of plasmid stock x volume plasmid stock) / volume bulk material.CalculationThe recombinant HPV-16 plasmid stock preparation was supplied to NIBSC at a concentration of 10 ng/μl. Using the MW determinations shown above, the GEq/ml of the HPV-16 plasmid stock is:= (10 x 10-9 g/μl) x (mol/(7440623 g) x (6.022x10²³ molecules/mol) = 8.093 x 10⁸ molecules/μl = 8.093 x 10¹¹molecules/ml = 8.093 x 10¹¹ HPV-16 GEq/ml22.23μl of the recombinant HPV-16 plasmid stock was diluted to a final volume of 1900ml, therefore,HPV-16 GEq/ml of bulk material = (8.093 x 10¹¹ HPV-16 GEq/ml plasmid stock) x (0.02223 ml HPV-16 plasmid stock) / 1900 ml HPV-16 bulk material = 0.947 x 10⁷ HPV-16 GEq/ml bulk material4. CONTENTSCountry of origin of biological material: United Kingdom.Each ampoule contains the lyophilized equivalent of 0.5 ml HPV-16 plasmid DNA in 10mM Tris buffer pH7.4 containing 1mM EDTA, 5 mg/ml trehalose and ~1 x 10⁶ human GEq/ml derived from C33a cells.5. STORAGEThe ampoule should be stored at -20 °C or below on receipt.Please note: because of the inherent stability of lyophilized material, NIBSC may ship these materials at ambient temperature.6. DIRECTIONS FOR OPENINGDIN ampoules have an …easy -open‟ coloured stress point, where the narrow ampoule stem joins the wider ampoule body.Tap the ampoule gently to collect the material at the bottom (labeled) end. Ensure that the disposable ampoule safety breaker provided is pushed down on the stem of the ampoule and against the shoulder of the ampoule body. Hold the body of the ampoule in one hand and the disposable ampoule breaker covering the ampoule stem between the thumb and first finger of the other hand. Apply a bending force to open the ampoule at the coloured stress point, primarily using the hand holding the plastic collar.Care should be taken to avoid cuts and projectile glass fragments that might enter the eyes, for example, by the use of suitable gloves and an eye shield. Take care that no material is lost from the ampoule and no glass falls into the ampoule. Within the ampoule is dry nitrogen gas at slightly less than atmospheric pressure. A new disposable ampoule breaker is provided with each DIN ampoule.7. USE OF MATERIALNo attempt should be made to weigh out any portion of the freeze-dried material prior to reconstitution.The 1st International Standard for HPV-16 DNA contains high copy number template. There is a high risk of HPV-16 plasmid DNA contamination via aerosolization upon opening of the glass ampoule. The material must be opened and handled in a separate laboratory environment, away from other pre-amplification components such as reagents, labware and samples.The material is supplied lyophilized and, before use, should be reconstituted in 0.5 ml sterile nuclease-free water. Ensure that the inside surface of the ampoule is wetted with the added water so that any particles of freeze-dried material adhering to the glass are reconstituted. The reconstituted material has a final concentration of 1 X 10⁷ IU/ml. The reconstituted material is suitable for calibration of in-house or working standards for the amplification and detection of HPV-16 DNA.. The material is not suitable for calibrating or assessing extraction, precipitation or centrifugation procedures. The material has NOT been calibrated for human DNA nucleic acid amplification techniques.8. STABILITYReference materials are held at NIBSC within assured, temperature-controlled storage facilities. The 1st International Standard for HPV-16 DNA should be stored at -20 °C or below on receipt.Studies on the stability of reconstituted standard are underway. Users should determine the stability of the reconstituted material according to their own method of preparation, storage and use.NIBSC follows the policy of WHO with respect to its reference materials.9. REFERENCESQuint, W. G. V., Pagliusi, S. R., Lelie, N., de Villiers, E. M., Wheeler, C. M. and the World Health Organization Human Papillomavirus DNA International Collaborative Study Group. (2006). Results of the First WorldHealth Organization International Collaborative Study of Detection of Human Papillomavirus DNA. J. Clin. Microbiol. 44: 571-579.Wilkinson, D.E., Baylis, S.A., Padley, D., Heath, A.B., Ferguson, M., Pagliusi, S.R., et al. Establishment of the 1st World Health Organization international standards for human papillomavirus type 16 DNA and type 18 DNA. Int J Cancer 2010 Jun 15;126(12):2969-83.WHO meeting report, on “Standardization of HPV assays and the role of HPV LabNet in supporting vaccine introduction” Geneva, Switzerland, 23-25 January 2008, in preparation.10. ACKNOWLEDGEMENTS11. FURTHER INFORMATIONFurther information can be obtained as follows; This material: enquiries@ WHO Biological Standards:http://www.who.int/biologicals/en/JCTLM Higher order reference materials: /en/committees/jc/jctlm/ Derivation of International Units:/products/biological_reference_materials/frequently _asked_questions/how_are_international_units.aspx Ordering standards from NIBSC:/products/ordering_information/frequently_asked_q uestions.aspxNIBSC Terms & Conditions:/terms_and_conditions.aspx12. CUSTOMER FEEDBACKCustomers are encouraged to provide feedback on the suitability or use of the material provided or other aspects of our service. Please send any comments to enquiries@13. CITATIONIn all publications, including data sheets, in which this material is referenced, it is important that the preparation's title, its status, the NIBSC code number, and the name and address of NIBSC are cited and cited correctly.15. LIABILITY AND LOSSInformation provided by the Institute is given after the exercise of all reasonable care and skill in its compilation, preparation and issue, but it is provided without liability to the Recipient in its application and use. It is the responsibility of the Recipient to determine the appropriateness of the standards or reference materials supplied by the Institute to the Recip ient (“the Goods”) for the proposed application and ensure that it has the necessary technical skills to determine that they are appropriate. Results obtained from the Goods are likely to be dependant on conditions of use by the Recipient and the variability of materials beyond the control of the Institute.All warranties are excluded to the fullest extent permitted by law, including without limitation that the Goods are free from infectious agents or that the supply of Goods will not infringe any rights of any third party.The Institute shall not be liable to the Recipient for any economic loss whether direct or indirect, which arise in connection with this agreement.The total liability of the Institute in connection with this agreement, whether for negligence or breach of contract or otherwise, shall in no event exceed 120% of any price paid or payable by the Recipient for the supply of the Goods.If any of the Goods supplied by the Institute should prove not to meet their specification when stored and used correctly (and provided that the Recipient has returned the Goods to the Institute together with written notification of such alleged defect within seven days of the time when the Recipient discovers or ought to have discovered the defect), the Institute shall either replace the Goods or, at its sole option, refund the handling charge provided that performance of either one of the above options shall constitute an entire discharge of the Institute‟s liability under this Condition.。
NaGdF4纳米晶的制备条件对发光性能的影响
DOI :10.15913/ki.kjycx.2024.02.015NaGdF 4纳米晶的制备条件对发光性能的影响*邹家欣,周海芳(福州大学物理与信息工程学院,福建 福州 350108)摘 要:以乙二胺四乙酸(EDTA )和油酸(OA )为络合剂进行对比,利用溶剂热法制备出结晶度高、发光性能强的小尺寸六方相NaGdF 4:Er 3+/Yb 3+/Al 3+纳米晶。
研究发现,OA 比EDTA 具有更强的络合能力和表面修饰作用,更容易制备出发光性能强的小尺寸纳米晶,当OA 体积为17 mL 时纳米晶具有最强的发光强度。
氟源提供过量的F -可以减少吸附在纳米晶表面的OH -以降低能量共振损耗,进而提高了上转换纳米晶的发光性能,为生物医学成像方面提供了很好的应用。
关键词:NaGdF 4纳米晶;上转换发光;制备条件;稀土中图分类号:TB34 文献标志码:A 文章编号:2095-6835(2024)02-0056-04——————————————————————————*[基金项目]福建省自然科学基金(编号:2021J01582)镧系稀土上转换材料可以利用反斯托克斯现象将不可见的近红外光转换为可见光,并被成功应用于太阳能电池、生物医学成像、温度传感等领域[1-4] 。
NaGdF 4纳米材料由于其低声子能量、高化学稳定性的优点,也逐渐被广泛研究,相比于大尺寸颗粒,小尺寸的NaGdF 4纳米晶更容易进入生物组织,在活体成像技术方面有巨大的应用场景,并且表现出优异的发光特性[5]。
国内外学者对增强NaGdF 4纳米晶的发光性能已经做出了许多卓越的研究,包括但不限于利用核壳结构减少纳米核表面与吸附基团的接触,从而降低荧光猝灭[6];掺杂替位式或间隙式离子以改变晶格结构,产生杂质能级并造成上转换发光的增强[7]等。
但络合剂和氟源作为影响NaGdF 4纳米晶的形貌结构和发光性能的重要因素,却鲜有研究报道。
本文采用溶剂热法成功合成了发光性能优异、直径约25 nm 的小尺寸六方相NaGdF 4纳米晶,研究了不同的络合剂种类与氟离子浓度对NaGdF 4纳米晶发光特性的影响,具有十分重要的研究意义。
ABSPA6复合材料的力学性能影响研究

广东化工2021年第2期· 36 · 第48卷总第436期ABS/PA6复合材料的力学性能影响研究罗鹏1,2*,胡志华1,2,汪海1,2,李诚1,2(1.金发科技股份有限公司,广东广州510000;2.广东金发科技有限公司,广东清远511500) [摘要]制备了一系列ABS/PA6复合材料,并探讨了不同增容剂、不同种类ABS以及不同增韧剂对ABS/PA6复合材料力学性能的影响。
结果表明,马来酰亚胺(MS-NB)对ABS/PA6的增容效果最佳,当添加量为5 %时,缺口冲击强度由4.4 kJ/m2提高到7.8 kJ/m2,提升幅度为77 %。
在缺口冲击强度表现上,具有核壳结构的MBS增韧剂明显优于高胶粉;不同ABS种类的ABS在该体系中力学性能差异很大,高胶含量的ABS 树脂能显著提高复合材料的缺口冲击强度,但弯曲强度,弯曲模量等性能有一定程度下降。
[关键词]ABS;PA6;缺口冲击强度;增容剂[中图分类号]TQ325.2 [文献标识码]A [文章编号]1007-1865(2021)02-0036-02The Study on the Influence of ABS/PA6 Mechanical PropertiesLuo Peng1,2*, Hu Zhihua1,2, Wang Hai1,2, Li Cheng1,2(1. Kingfa Technology Co., Ltd., Guangzhou 510000;2. Guangdong Kingfa Technology Co., Ltd., Qingyuan 511500, China)Abstract: A series of ABS/PA6 composites were prepared. The influence of different compatibilizers, different types of ABS and different toughening agents on the mechanical properties of ABS/PA6 composites were discussed. The results showed that MS-NB is a kind of effective compatibilizer for ABS/PA6 composites. When the addition amount is 5 %, the notched impact strength increases from 4.4 kJ/m2to 7.8 kJ/m2. In the performance of notched impact strength, MBS toughening agent with core-shell structure is obviously better than high rubber powder.Different ABS types have great differences in mechanical properties in this system, and ABS resin with high rubber content can significantly improve the notched impact strength of the composite material. Flexural strength and flexural modulus have decreased.Keywords: ABS;PA6;Notched impact strength;Compatibilizer聚己内酰胺(PA6)其具有优异的机械性能,良好的抗腐蚀能力以及加工流动性,被广泛应用于汽车、电子电器、家用电器,医疗及体育用品等领域;但其具有较强的吸水性且尺寸稳定性较差,需要对其进行改性处理以满足更多的使用要求。
高效液相色谱-串联质谱法检测泮托拉唑钠原料药中的水合肼
·药物研发·高效液相色谱-串联质谱法检测泮托拉唑钠原料药中的水合肼赵会明 张振洋 樊华军[英格尔检测技术服务(上海)有限公司 上海 201100]摘要建立了泮托拉唑钠原料药中的基因毒性杂质水合肼的高效液相色谱-串联质谱(LC-MSMS)检测方法。
采用反相色谱,以水-乙腈(含0.1%甲酸)为流动相,梯度洗脱,流速0.5 mL/min,以ESI正离子多反应监测(MRM)模式进行质谱检测。
结果显示,水合肼的检测限和定量限可达到0.23、0.47 ng/mL,其在0.47~9.37 ng/mL浓度范围内线性关系良好(r=0.999 9),准确度试验中低、中、高浓度回收率均在81.6%~90.9%之间。
在3批次泮托拉唑钠原料药中均未检出水合肼。
关键词高效液相色谱-串联质谱法基因毒性杂质泮托拉唑钠水合肼痕量检测中图分类号:R917; O657 文献标志码:A 文章编号:1006-1533(2022)11-0072-04引用本文 赵会明, 张振洋, 樊华军. 高效液相色谱-串联质谱法检测泮托拉唑钠原料药中的水合肼[J]. 上海医药, 2022, 43(11): 72-75.Determination of hydrazine hydrate in pantoprazole sodium by high performance liquid chromatography-tandem mass spectrometryZHAO Huiming, ZHANG Zhenyang, FAN Huajun[ICAS Testing Technology Service (Shanghai) CO., LTD., Shanghai 201100, China]ABSTRACT To establish a high-performance liquid chromatography-tandem mass spectrometry (LC-MSMS) method for the determination of hydrazine hydrate in active pharmaceutical ingredient (API) pantoprazole sodium. HPLC was carried out by reverse chromatography using water-acetonitrile containing 0.1% formic acid as flow phase and gradient elution at a flow rate of 0.5 mL/min. Mass spectrometry was performed with multi-reaction monitoring (MRM) in positive ESI mode. The detection and quantitative limits of hydrazine hydrate reached 0.23, 0.47 ng/mL and hydrazine hydrate showed good linear relationship in the range of 0.47-9.37 ng/mL (r=0.999 9). The recoveries of samples at low, medium and high-level concentrations reached81.6% to 90.9% in the accuracy experiment. No hydrazine hydrate was detected in 3 batches of pantoprazole sodium.KEY WORDS HPLC-tandem mass spectrometry; genotoxic impurities; pantoprazole sodium; hydrazine hydrate; trace determination上消化道出血是近年的临床疾病中常见且多发的一种疾病,其临床表现为呕血、黑便等,如得不到及时有效治疗,可能引发失血性休克。
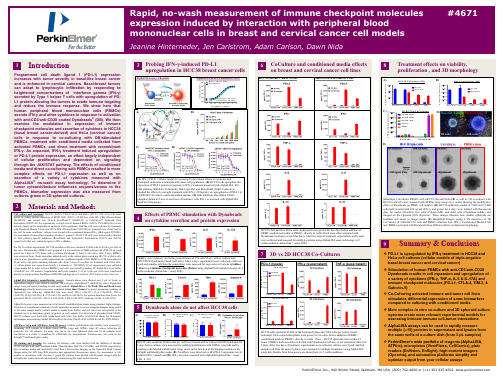
Incucyte
Product Information Presentation, Storage and StabilityThe Incucyte® Fabfluor-pH Antibody Labeling Reagents for antibody internalization are supplied as lyophilized solids in sufficient quantity to label 50 μg of test antibody, when used at the suggested molar ratio (1:3 of test antibody to labeling Fab). The lyophilized solid can be stored at 2-8° C for one year. Once re-hydrated, any unused reagent should be aliquoted and stored at -80° C for up to one year. Avoid repeated freeze-thaw cycles.Incucyte® Fabfluor-pH Antibody Labeling ReagentsFor Antibody Internalization AssaysAntibody Labeling Reagent Rehydrated: -80° C *Excitation and Emission maxima were determined at a pH of 4.5.Fabfluor_quick_guideBackgroundIncucyte ® Fabfluor-pH Antibody Labeling Reagents are designed for quick, easy labeling of Fc-containing test antibodies with a Fab fragment-conjugated pH-sensitive fluorophore. The pH-sensitive dye based system exploits the acidic environment of the lysosomes to quantify in-ternalization of the labeled antibody. As Fabfluor labeled antibodies reside in the neutral extracellular solution (pH 7.4), they interact with cell surface specific antigens and are internalized. Once in the lysosomes, they enter an acidic environment (pH 4.5–5.5) and a substantial in-crease in fluorescence is observed. In the absence of ex-pression of the specific antigen, no internalization occurs and the fluorescence intensity of the labeled antibodies remains low. With the Incucyte ® integrated analysis soft-ware, background fluorescence is minimized. These reagents have been validated for use with a number of different antibodies in a range of cell types. The Incucyte ® Live-Cell Analysis System enables real-time, kinetic eval -uation of antibody internalization.Recommended UseWe recommend that the Incucyte ® Fabfluor-pH Antibody Labeling Reagents are prepared at a stock concentration of 0.5 mg/mL by the addition of 100 μL of sterile water and triturated (centrifuge if solution not clear). The reagent may then be diluted directly into the labeling mixture with test antibody. Do NOT sonicate the solution.Additional InformationThe Fab antibody was purified from antisera by a combination of papain digestion and immunoaffinity chromatography using antigens coupled to agarose beads. Fc fragments and whole IgG molecules have been removed.Human Red (Cat. No. 4722) or Human Orange (Cat. No. 4812)—Based on immunoelectrophoresis and/ or ELISA, the antibody reacts with the Fc portion of human IgG heavy chain but not the Fab portion of human IgG. No antibody was detected against human IgM, IgA or against non-immunoglobulin serum proteins. The anti-body may cross-react with other immunoglobulins from other species.Mouse IgG1 (Cat. No. 4723), IgG2a (Cat. No. 4750) or IgG2b (Cat. No. 4751)—Based on antigen-binding assay and/or ELISA, the antibody reacts with the Fc portion of mouse IgG, IgG2a or IgG2b, respectively, but not the Fab portion of mouse immunoglobulins. No antibody was detected against mouse IgM or against non–immunoglobulin serum proteins. The antibody may cross-react with other mouse IgG subclasses or with immunoglobulins from other species.Rat (Cat. No. 4737)—Based on immunoelectrophoresis and/or ELISA, the antibody reacts with the Fc portion of rat IgG heavy chain but not the Fab portion of rat IgG. No antibody was detected against rat IgM, IgA or against non-immunoglobulin serum proteins. The antibody may cross-react with other immunoglobulins from other species.A.B.C.D.R e d O b j e c t A r e a (x 105 μm 2 p e r w e l l )Time (hours)A U C x 106 (0–12 h )log [α–CD71] (g/mL)Example DataFigure 1: Concentration-dependent increase in antibody internalization of Incucyte ® Fabfluor labeled-α-CD71 in HT1080 cells. α-CD71 and mouse IgG1 isotype control were labeled with Incucyte ® Mouse IgG1 Fabfluor-pH Red Antibody Labeling Reagent. HT1080 cells were treated with either Fabfluor-α-CD71 or Fabfluor-IgG1 (4 μg/mL); HD phase and red fluorescence images were captured every 30 minutes over 12 hours using a 10X magnification. (A) Images of cells treated with Fabfluor-α-CD71 display red fluorescence in the cytoplasm (images shown at 6 h). (B) Cells treated with labeled isotype control display no cellular fluorescence. (C) Time-course of Fabfluor-α-CD71 internalization with increasing concentrations of Fabfluor-α-CD71 (progressively darker symbols). Internalization has been quantified as the red object area for each time-point. (D) Concentration response curve to Fabfluor-α-CD71. Area under the curve (AUC) values have been determined from the time-course shown in panel C (0-12 hours) and are presented as the mean ± SEM, n=3 wells.CD71-FabfluorIgG-FabfluorProtocols and ProceduresMaterialsIncucyte® Fabfluor-pH Antibody Labeling ReagentTest antibody of interest containing human, mouse, or rat IgG Fc region (at known concentration)Target cells of interestTarget cell growth mediaSterile distilled water96-well flat bottom microplate (e.g. Corning Cat. No. 3595) for imaging96-well round black round bottom ULA plate (e.g. Corning Cat. No. 45913799) or amber microtube (e.g. Cole Parmer Cat. No. MCT-150-X, autoclaved) for conjugation step0.01% Poly-L-Ornithine (PLO) solution (e.g. Sigma Cat. No. P4957), optional for non-adherent cells Recommended control antibodiesIt is strongly recommended that a positive and negative control is run alongside test antibodies and cell lines. For example, CD71, which is a mouse anti-human antibody, is recommended as a positive control for the mouse Fab.Anti-CD71, clone MEM-189, IgG1 e.g. Sigma Cat. No. SAB4700520-100UGAnti-CD71, clone CYG4, IgG2a e.g. BioLegend Cat. No. 334102Isotype controls, depending on isotype being studied—Mouse IgG1, e.g. BioLegend Cat. No. 400124, Mouse IgG2a e.g. BioLegend Cat. No. 401501Preparation of Incucyte® Antibody Internalization Assay 1. Seed target cells of interest1.1 Harvest cells of interest and determine cell concentra-tion (e.g. trypan blue + hemocytometer).1.2 Prepare cell seeding stock in target cell growth mediawith a cell density to achieve 40–50% confluence be-fore the addition of labeled antibodies. The suggested starting range is 5,000–30,000 cells/well, although the seeding density will need to be optimized for each cell type.Note: For non-adherent cell types, a well coating may be required to maintain even cell distribution in the well. For a 96-well flat bottom plate, we recommend coating with 50 μL of either 0.01% Poly-L-Or-nithine (PLO) solution or 5 μg/mL fibronectin diluted in 0.1% BSA.Coat plates for 1 hour at ambient temperature, remove solution from wells and then allow the plates to dry for 30-60 minutes prior to cell addition.1.3 Using a multi-channel pipette, seed cells (50 µL perwell) into a 96-well flat bottom microplate. Lightly tapplate side to ensure even liquid distribution in well. Toensure uniform distribution of cells in each well, allowthe covered plate sit on a level surface undisturbed at room temperature in the tissue culture hood for 30minutes. After cells are settled, place the plate insidethe Incucyte® Live-Cell Analysis System to monitor cell confluence.Note: Depending on cell type, plates can be used in assay once cells have adhered to plastic and achieved normal cell morphology e.g.2-3 hours for HT1080 or 1-2 hours for non-adherent cell types. Some cell types may require overnight incubation.2. Label Test Antibody2.1 Rehydrate the Incucyte® Fabfluor-pH Antibody Label-ing Reagent with 100 µL sterile water to result in a final concentration of 0.5 mg/mL. Triturate to mix (centrifuge if solution is not clear).Note: The reagent is light sensitive and should be protected fromlight. Rehydrated reagent can be aliquoted into amber or foilwrapped tubes and stored at -80° C for up to 1 year (avoid freezing and thawing).2.2 Mix test antibody with rehydrated Incucyte® Fabfluor–pH Antibody Labeling Reagent and target cell growth media in a black round bottom microplate or ambertube to protect from light (50 µL/well).a. Add test antibody and Incucyte® Fabfluor–pH Anti-body Labeling Reagent at 2X the final concentration.We suggest optimizing the assay by starting with afinal concentration of 4 µg/mL of test antibody or theFabfluor-pH Antibody Labeling Reagent (i.e. 2Xworking concentration = 8 µg/mL).Note: A 1:3 molar ratio of test antibody to Incucyte® Fabfluor-pHAntibody Labeling Reagent is recommended. The labeling re-agent is a third of the size of a standard antibody (50 and 150KDa, respectively). Therefore, labeling equal quantities will pro-duce a 1:3 molar ratio of test antibody to labeling Fab.b. Make sufficient volume of 2X labeling solution for50 µL/well for each sample. Triturate to mix.c. Incubate at 37° C for 15 minutes protected from light.Note: If performing a range of concentrations of test antibody,e.g. concentration response-curve, it is recommended to createthe dilution series post the conjugation step to ensure consistentmolar ratio. We strongly recommend the use of both a negativeand positive control antibody in the same plate.3. Add labeled antibody to cells3.1 Remove cell plate from incubator.3.2 Using a multi-channel pipette, add 50 µL of 2X labeledantibody and control solutions to designated wells.Remove any bubbles and immediately place plate in the Incucyte® Live-Cell Analysis System and start scanning.Note: To reduce the risk of condensation formation on the lid priorto first image acquisition, maintain all reagents at 37° C prior toplate addition.4. Acquire images and analyze4.1 In the Incucyte® Software, schedule to image every15-30 minutes, depending on the speed of the specific antibody internalization.a Scan on schedule, standard. If the Incucyte® Cell-by-Cell Analysis Software Module (Cat. No. 9600-0031)is available, adherent cell-by-cell or non-adherentcell-by-cell scan types can be selected.b Channel selection: select “phase” and “red” or“phase” and "orange” (depending on reagent used).c Objective: 10X or 20X depending on cell types used,generally 10X is recommended for adherent cells,and 20X for non-adherent or smaller cells.NOTE: The optional Incucyte® Cell-by-Cell Analysis SoftwareModule enables the classification of cells into sub-populationsbased on properties including fluorescence intensity, size andshape. For further details on this analysis module and its appli-cation, please see: /cell-by-cell.4.2 To generate the metrics, user must create an AnalysisDefinition suited to the cell type, assay conditions andmagnification selected.4.3 Select images from a well containing a positiveinternalization signal and an isotype control well(negative signal) at a time point where internalizationis visible.4.4 In the Analysis Definition:Basic Analyzer:a. Set up the mask for the phase confluence measurewith fluorescence channel turned off.b. Once the phase mask is determined, turn the fluores-cence channel on: Exclude background fluorescencefrom the mask using the background subtractionfeature. The feature “Top-Hat” will subtract localbackground from brightly fluorescent objects withina given radius; this is a useful tool for analyzing ob-jects which change in fluorescence intensity overtime.i The radius chosen should reflect the size of thefluorescent object but contain enough backgroundto reliably estimate background fluorescence inthe image; 20-30 μm is often a useful startingpoint.ii The threshold chosen will ensure that objectsbelow a fluorescence threshold will not bemasked.iii Choose a threshold in which red or orange objectsare masked in the positive response image but lownumbers in the isotype control, negative responsewell. For a very sensitive measurement, for example,if interested in early responses, we suggest athreshold of 0.2.NOTE: The Adaptive feature can be used for analysis but maynot be as sensitive and may miss early responses. If interestedin rate of response, Top-Hat may be preferable.Cell-by-Cell (if available):a. Create a Cell-by-Cell mask following the softwaremanual.b. There is no need to separate phase and fluorescencemasks. The default setting of Top-Hat No Mask forthe fluorescence channel will enable backgroundsubtraction without generation of a mask. Ensurethat the Top-Hat radius is set to a value higher thanthe radius of the larger clusters to avoid excess back-ground subtraction.c. The threshold of fluorescence can be determined inCell-by-Cell Classification.Specifications subject to change without notice.© 2020. All rights reserved. Incucyte, Essen BioScience, and all names of Essen BioScience prod -ucts are registered trademarks and the property of Essen BioScience unless otherwise specified. Essen BioScience is a Sartorius Company. Publication No.: 8000-0728-A00Version 1 | 2020 | 04Sales and Service ContactsFor further contacts, visit Essen BioScience, A Sartorius Company /incucyte Sartorius Lab Instruments GmbH & Co. KGOtto-Brenner-Strasse 20 37079 Goettingen, Germany Phone +49 551 308 0North AmericaEssen BioScience Inc. 300 West Morgan Road Ann Arbor, Michigan, 48108USATelephone +1 734 769 1600E-Mail:***************************EuropeEssen BioScience Ltd.Units 2 & 3 The Quadrant Newark CloseRoyston Hertfordshire SG8 5HLUnited KingdomTelephone +44 (0) 1763 227400E-Mail:***************************APACEssen BioScience K.K.4th floor Daiwa Shinagawa North Bldg.1-8-11 Kita-Shinagawa Shinagawa-ku, Tokyo 140-0001 JapanTelephone: +81 3 6478 5202E-Mail:*************************5. Analysis GuidelinesAs the labeled antibody is internalized into the acidic environment of the lysosome, the area of fluorescence intensity inside the cells increases.This can be reported in two ways:Ways to Report Basic AnalyzerCell-by-Cell Analysis* To correct for cell proliferation, it is advisable to normalize the fluorescence area to the total cell area using User Defined Metrics.For Research Use Only. Not For Therapeutic or Diagnostic Use.LicensesFor non-commercial research use only. Not for therapeutic or in vivo applications. Other license needs contact Essen BioS cience.Fabfluor-pH Red Antibody Labeling Reagent: This product or portions thereof is manufactured under license from Carnegie Mellon University and U.S. patent numbers 7615646 and 8044203 and related patents. This product is licensed for sale only for research. It is not licensed for any other use. There is no implied license hereunder for any commercial use.Fabfluor-pH Orange Antibody Labeling Reagent: This product or portions thereof is manufactured under a license from Tokyo University and is covered by issued patents EP2098529B1, JP5636080B2, US8258171, and US9784732 and related patent applications. This product and related products are trademarks of Goryo Chemical. Any application of above mentioned technology for commercial purpose requires a separate li -cense from: Goryo Chemical, EAREE Bldg., SF Kita 8 Nishi 18-35-100, Chuo-Ku, Sapporo, 060-0008 Japan.SupportA complete suite of cell health applications is available to fit your experimental needs. Find more information at /incucyte Foradditionalproductortechnicalinformation,************************************************************/incucyte。
PerkinElmer产品说明书
III型前胶原N端肽化学发光免疫分析定量测定试剂盒及其制备方法[发明专利]
![III型前胶原N端肽化学发光免疫分析定量测定试剂盒及其制备方法[发明专利]](https://img.taocdn.com/s3/m/007efad643323968001c926a.png)
专利名称:III型前胶原N端肽化学发光免疫分析定量测定试剂盒及其制备方法
专利类型:发明专利
发明人:高鹏,应希堂,宋胜利,胡国茂,郑金来,于尚永
申请号:CN200810102020.4
申请日:20080314
公开号:CN101377509A
公开日:
20090304
专利内容由知识产权出版社提供
摘要:本发明涉及免疫分析医学领域,具体地,本发明提供了一种III型前胶原N端肽(PIIINP)化学发光免疫分析定量测定试剂盒及其制备方法。
根据本发明的试剂盒包括:1)III型前胶原N端肽校准品;2)包被有III型前胶原N端肽的单克隆抗体的固相载体;3)III型前胶原N端肽的单克隆抗体酶标记物;4)化学发光底物;以及5)浓缩洗涤液。
进一步,根据本发明制备上述试剂盒的方法包括以下步骤:1)以III型前胶原N端肽纯品配制III型前胶原N端肽校准品;2)以III型前胶原N端肽的单克隆抗体包被载体;3)以酶标记III型前胶原N端肽的单克隆抗体;4)配制化学发光底物;5)配制浓缩洗涤液6)分装上述III型前胶原N端肽校准品、酶标记物、化学发光底物和浓缩洗涤液;以及7)组装为成品。
本发明的试剂盒具有简便、快速、灵敏、稳定等优点。
申请人:北京科美东雅生物技术有限公司
地址:100094 北京市海淀区永丰基地丰贤中路7号北科园
国籍:CN
更多信息请下载全文后查看。
大鼠 III 型胶原定量 EIA 试剂盒 使用说明

大鼠III型胶原定量EIA试剂盒使用说明Catalog NO:MRK0027试剂盒组1.96孔微孔板:一块 6.洗涤液(20×):一瓶2.标准品稀释液:一瓶 7.标准品(200ng∕ml):一管3.酶标抗体稀释液:一瓶 8.酶标抗体(1:50)4.终止液:一瓶 9.TMB底物工作液:一瓶5.封板纸:一张 10.坐标纸:一张准备试剂与收集血样洗涤液:用重蒸水1:20稀释。
收集血液标本:采集血清或体液尽早检测,2-8℃保存一天;需更长时间须冷冻(-20℃)保存,避免反复冻融。
检测程序1.建立标准曲线:设标准孔8孔,每孔中各加入样品稀释液100ul,第一孔加标准品100ul,混匀后用加样器吸出100ul移至第二孔,如此反复作对倍稀释至第七孔,最后,从第七孔中吸出100ul弃去,使之体积均为100ul。
第八孔为空白对照。
2.加样:待测样品孔每孔各加入标本100ul。
3.将反应板充分混匀后置37℃60分钟。
4.洗涤:用洗涤液将反应板充分洗涤4-6次,向滤纸上印干。
5.每孔中加酶标抗体(用酶标抗体稀释液1:50稀释,用多少配多少)100ul,6.将反应板置37℃30分钟。
7.洗涤:同前。
8.每孔加入TMB底物工作液100ul,37℃避光显色10-15分钟。
9.每孔加入100ul终止液混匀。
10.在450nm处测吸光值。
结果计算与判断所有OD值都应减除空白值后再行计算。
以标准品100、50、25、12.5、6.25、3.12、1.56、0ng∕ml之OD值在半对数纸上作图,画出标准曲线。
根据样品OD值在该曲线图上查出相应大鼠III型胶原含量。
注意事项★如需分次使用,请将试剂保持在4℃条件下取用,以减少次间差异。
1.以上标准孔及待查样品均建议做复孔,每次测定应同时制作标准曲线。
2.本试剂盒宜置于-20℃冰箱保存。
标准品避免反复冻融。
3.本试剂盒取出的试剂在室温条件下使用,溶液应轻轻摇匀后使用。
4.本试剂盒含2M硫酸,不要将它与含叠氮化钠的废物混在一起。
超氧化物歧化酶(SOD)测定试剂盒(邻苯三酚法)产品技术要求深圳上泰生物
超氧化物歧化酶(SOD)测定试剂盒(邻苯三酚法)1.性能指标1.1外观外观应符合以下要求:a)试剂盒各组分应齐全、完整,液体无渗漏;包装标签文字符号清晰;b)R1:无色澄清液体,无沉淀及絮状悬浮物;c)R2:无色澄清液体,无沉淀及絮状悬浮物;d)校准品、质控品:无色澄清液体。
1.2装量液体试剂装量要求不少于标示量。
1.3试剂空白吸光度试剂空白吸光度应≤1.50。
1.4分析灵敏度测试130 U/mL样本时,吸光度差值(△A)应≥0.05。
1.5线性范围1.5.1 在[10,250] U/mL 区间内,线性回归的相关系数r≥0.990。
1.5.2 在[10,100] U/mL 区间内,线性绝对偏差不超过±10 U/mL;在(100,250]U/mL 区间内,线性相对偏差应不超过±10 %。
1.6精密度1.6.1重复性变异系数CV≤10 %。
1.6.2批间差相对极差(R)≤15 %。
1.7准确度相对偏差应不超过±10 %。
1.8分析特异性抗坏血酸≤50 mg/dL、胆红素≤15 mg/dL、血红蛋白≤400 mg/dL、脂肪乳剂≤0.5 % 时,对试剂检测结果的偏差影响在±10 % 以内。
1.9量值溯源应明确分析物的量值溯源。
1.10校准品赋值结果及其不确定度的表示方式应使用规范的表示方式,主要表示方式可选择:a)赋值结果±扩展不确定度;b)赋值结果,扩展不确定度。
1.11校准品正确度量值传递的正确度应符合E≤1。
n1.12质控品可接受区间应给出建议的可接受区间及其确定的程序,应符合下列要求:a)可接受区间宜考虑医学决定水平或测量区间内适宜的浓度点;b)可接受区间应随规定的测量系统(试剂和仪器)一并给出;c)估计可接受区间所进行的实验次数,重复次数及评估的时限;d)估计可接受区间所用的统计方法,包括包含概率;e)可接受区间估计时的平均值与标称值(目标值)之间偏差应不超过±10%;f)在声称测量系统上的测量结果应在其可接受区间内。
- 1、下载文档前请自行甄别文档内容的完整性,平台不提供额外的编辑、内容补充、找答案等附加服务。
- 2、"仅部分预览"的文档,不可在线预览部分如存在完整性等问题,可反馈申请退款(可完整预览的文档不适用该条件!)。
- 3、如文档侵犯您的权益,请联系客服反馈,我们会尽快为您处理(人工客服工作时间:9:00-18:30)。
JOURNAL OF RARE EARTHS, Vol. 28, No. 6, Dec. 2010, p. 903Foundation item: Project supported by China Postdoctoral Science Foundation funded project (20080430216), National Natural Science Foundation of China(60508014), Program for New Century Excellent Talents in University (NCET-07-0786) and Zhejiang Provincial Natural Science Foundation of China (Z4100030) Corresponding author: ZHAO Shilong (E-mail: shilong_zhao@; Tel.: +86-571-86835781) DOI: 10.1016/S1002-0721(09)60220-9Intense upconversion luminescence of Er 3+/Yb 3+ codoped oxyfluoride borosilicate glass ceramics containing Ba 2GdF 7 nanocrystalsZHAO Shilong (赵士龙)1,2, XU Shiqing (徐时清)1, DENG Degang (邓德刚)1, FAN Xianping (樊先平)2(1. College of Materials Science and Engineering, China Jiliang University, Hangzhou 310018, China; 2.Department of Materials Science and Engineering, Zhejiang University, Hangzhou 310027, China)Received 31 August 2010; revised 3 November 2010Abstract: Er 3+/Yb 3+-codoped transparent oxyfluoride borosilicate glass ceramics containing Ba 2GdF 7 nanocrystals were prepared and spec-troscopic properties of rare earth ions were investigated. Fluoride nanocrystals Ba 2GdF 7 were successfully precipitated in glass matrix, which was confirmed by X-ray diffraction (XRD) and transmission electron microscopy (TEM) results. In comparison with the as-made precursor, significant enhancement of upconversion luminescence was observed in the Er 3+/Yb 3+ codoped oxyfluoride glass ceramics, which may be due to the variation of coordination environment around Er 3+ and Yb 3+ ions after crystallization. The transition mechanisms of the green and red upconversion luminescence were ascribed to a two-photon process, and that of the blue upconversion luminescence was a three-photon process. Keywords: oxyfluoride glass ceramics; Er 3+/Yb 3+ codoped; spectroscopic properties; rare earthsNowadays, Er 3+ doped optical materials have attracted great interest due to their possible application as media for the upconversion laser, waveguide laser and Er 3+-doped fiber amplifier (EDFA), which is one of key elements used in the wavelength division multiplexing (WDM) network system for optical communication [1–4]. Since oxyfluoride glass ce-ramics were firstly reported by Wang and Ohwaki [5], oxy-fluoride glass ceramics doped with rare earth ions have been researched widely in the past few decades, because they possess not only higher chemical and mechanical stability than fluoride glass but also lower phonon energy than oxide glass [6,7]. By thermal treatment close to the crystallization temperature for the oxyfluoride glasses, transparent oxy-fluoride glass ceramics can be obtained, in which fluoride crystallites are dispersed in the oxide glass matrix. If the rare earth ions can be successfully incorporated into the fluoride crystals which can provide a low phonon environment, rare earth ion doped glass ceramics will exhibit excellent lumi-nescence properties.Currently, oxyfluoride glass ceramics mainly concentrate on aluminosilicate glass ceramics [8,9], oxyfluoride borosili-cate glass ceramics is seldom reported. In fact, borosilicate glasses possess lower melting temperature and easy forma-tion of fibers compared to aluminosilicate glass. Recently, Środa have successfully prepared oxyfluoride borosilicate glass ceramics containing LaOF and LaF 3 nanocrystals by heat treatment of SiO 2-B 2O 3-Na 2O-LaF 3 glass [10]. In this pa-per, a new Er 3+/Yb 3+ co-doped oxyfluoride borosilicate glass ceramics containing Ba 2GdF 7 nanocrystals was successfullyprepared and the change of upconversion luminescence were also discussed.1 Experimental1.1 Preparation of Er 3+/Yb 3+-codoped oxyfluoride boro-silicate glass ceramics The oxyfluoride borosilicate glass was prepared with the composition in mol.% of 56SiO 2-12B 2O 3-18Na 2O-8BaF 2- 4.5GdF 3-0.1ErF 3-0.5YbF 3. The mixed materials were melted in a covered alumina crucible at 1350 ºC for about 40 min. Then the glass was quenched onto a preheated brass mold. The quenched sample was annealed at 450 ºC for 2 h and cooled slowly down to room temperature. The glass sample was cut and polished into 10 mm×5 mm×2 mm size. The polished samples were then heat treated at 650, 670 and 690 ºC, chosen from the different thermal analysis (DTA) measurements, for 2 h to form transparent glass ceramics (denoted as GC-650, GC-670 and GC-690, respectively) through crystallization.1.2 Characterization of Er 3+/Yb 3+-codoped oxyfluorideborosilicate glass ceramics The DTA experiment of the as-made precursor sample was carried out on Netzsch DTA 404PC in N 2 atmosphere at a heating rate of 10 K/min. X-ray diffraction (XRD) measure-ments were performed on a powder diffractometer (Rigaku D/max2550V/PC) with Cu K α radiation (λ=0.154 nm). The904 JOURNAL OF RARE EARTHS, Vol. 28, No. 6, Dec. 2010microstructure of GC-670 was analyzed by a transmission electron microscope (TEM, Philips-FEI-Tecnai G2 F30) equipped with the energy dispersive X-ray spectroscopy (EDX). Upconversion luminescence was taken with a Jobin- Yvon Frolog3 fluorescence spectrophotometer using 980 nm light from a laser diode. All measurements were carried out at room temperature.2 Results and discussionThe DTA curve of the as-made precursor is presented in Fig. 1. The glass transition temperature is about 490 ºC, and two exothermic peaks are observed at around 670 and 730 °C respectively. XRD analysis demonstrates that the former peak is ascribed to the precipitation of Ba 2GdF 7 phase [11] and the latter corresponded to the bulk crystallization of the glass matrix. Therefore, the as-made precursor was heat-treated at 650, 670 and 690 ºC for 2 h to form transparent glass ceramics. Due to its distortion for the sample GC-690 after heat treat-ment, the sample GC-670 was selected as the object of study. The XRD patterns of the as-made precursor and glass ce-ramics heat-treated at different temperatures are shown in Fig. 2. For the as-made precursor, besides the amorphous diffuse humps, several diffraction peaks corresponding to Ba 2GdF 7 phase also appear, indicating the precipitation of Ba 2GdF 7 during the glass-melt quenching. With the increaseFig. 1 DTA curve of the as-made precursor recorded at a heatingrate of 10 K/minFig. 2 XRD patterns of the as-made precursor and glass ceramicsin heat-treatment temperature, the Ba 2GdF 7 diffraction peaks tend to be sharper, which indicates the gradual formation of Ba 2GdF 7 nanocrystals. Based on the peak widths, the mean crystallite size is evaluated by the Scherrer equation: D hkl =cos K λβθ(1)where D hkl is the crystal size at the vertical direction of (hkl ), λ is the wavelength of X-ray, θ is the angle of (hkl) diffrac-tion, β is the full width at half-maximum of the peak (FWHM) of the diffraction peak and the constant K =0.90. The determined mean crystallite sizes are 22.1, 27.9 and 32.3 nm for GC-650, GC-670 and GC-690 samples, respectively. Fig. 3(a) shows the TEM image of Er 3+/Yb 3+ codoped GC-670, which demonstrates that the precipitated spherical nanoparticles sized 25–35 nm are distributed homogenously among the glass matrix. The EDX spectra taken from the glass matrix and a selected nanoparticle are shown in Fig. 3 (b) and (c), respectively. The spectrum from the glassy matrix shows strong signals from Si and O elements and weak signals from Ba, Gd and F elements (the presence of Cu is due to the use of copper grid supporting TEM specimen). In contrast, the spectrum from the selected nanoparticle gives strong signal Ba, Gd, F, Si and O elements and weak signals from Er and Yb elements, which indicates that Er 3+ and Yb 3+ ions concentratedmainly inside or on the surfaces of the crystallites.Fig. 3 TEM image of Er 3+/Yb 3+codoped GC-670 (a), EDX curve taken from glass matrix (b) and EDX curve taken from a selectednanoparticle (c)ZHAO Shilong et al., Intense upconversion luminescence of Er3+/Yb3+ codoped oxyfluoride borosilicate glass ceramics (905)Fig. 4 presents the upconversion spectra of 0.1 mol.% Er3+ and 0.5 mol.% YbF3 codoped glass and GC-670 excited at 980 nm with the power of 200 mW. The emission bands can be assigned to 2H9/2→4I15/2 (404 nm), 2H11/2→4I15/2 (520 nm), 4S3/2→4I15/2 (538 nm), and 4F9/2→4I15/2 (644 nm) transitions, respectively. Only weak upconversion luminescence of Er3+ is observed in the as-made precursor. However, intense green and red upconversion luminescence of Er3+ was obvi-ously observed in GC-670 by naked eyes. Especially, in the ultraviolet and visible region, besides the emission band at 404 nm, weak emission bands centered at 379 nm and 490 nm are recorded, which correspond to 4G11/2→4I15/2 and2H11/2→4I15/2 transitions of Er3+ ions, respectively. As far as we know, the 379 nm upconversion band was only reported in a low phonon energy crystal Cs3Er2Br9[12] and Er3+-doped tellurium-germanate oxyfluoride glass ceramics[13]. It is well known that the intensity of upconversion luminescence of rare earth ions is very sensitive to the multiphonon relaxation rate, which strongly depends on the phonon energy of the host matrix. Usually, the lower the phonon energy of host matrix is, the smaller the multiphonon relaxation probability is. The approximate frequencies of the highest-energy pho-nons in the borate and silicate glasses are 1400 and 1100 cm–1, respectively. However, the phonon frequency of BaF2 crystal is 346 cm–1 [14] and that of GdF3 crystal is 400 cm–1 [15]. Due to much smaller phonon energy of Ba2GdF7 nanocrystals than the oxide glass, the upconversion luminescence of Er3+ in the Ba2GdF7 nanocrystals would be stronger than that in the as-made precursor. Furthermore, the upconversion lumi-nescence intensity of the glass ceramics increased signifi-cantly with increasing crystallization temperature[8].The fluorescence decay curves and fitted curves of Er3+ for 540 nm emission corresponding to Er3+:4S3/2→4I15/2 transition in the as-made precursor and GC-670 are shown in Fig. 5, which provides important information to evaluate the Er3+ ions surroundings. When the excitation is produced in an excited state of higher energy than the emitting level, the fluorescence decay would not be purely exponential. The fluorescence decay curve could be described by a mean de-cay lifetime (τm ) given by(2)Fig. 4 Upconversion luminescence of Er3+ ions in the as-made precursor and GC-670where I(t) is the dependence of photoluminescence intensity on the time t, and I max is the maximum of I(t) and I(t0)= I max[16]. On the basis of Eq. (2), the mean lifetime of Er3+ in the as-made precursor and GC-670 are calculated to be about 175.02 μs and 265.66 μs, respectively. The results clearly show that fluoride nanocrystals are precipitated in the glass host which leads to much longer 4S3/2 lifetime[17].In the upconversion processes, there is the following rela-tion between the emission intensity I em and the infrared (IR) excitation intensity I ex:I em∝(I ex)n(3) where n is the number of IR photons absorbed per visible photon emitted. Therefore, a plot of lg(I em) versus lg(I ex) should yield a straight line with the slope n[18], shown in Fig. 6. The slopes of 404, 520, 538 and 644 nm emissions are 2.65, 1.98, 1.90 and 1.88, respectively. These results indicate that green and red emission mechanisms can be described as a two-photon mechanism. The blue emission at 404 nm can beattributed to a three-photon mechanism.Fig. 5 Fluorescence decay curves of 4S3/2 level of the Er3+ in the as-made precursor and GC-670Fig. 6 Power dependence of Ba2GdF7: Er3+, Yb3+ upconversion in-tensity for GC-6703 ConclusionsEr3+/Yb3+-doped transparent oxyfluoride glass ceramics containing Ba2GdF7 nanocrystals were prepared by heat treatment of 56SiO2-12B2O3-18Na2O-8BaF2-4.5GdF3-0.1ErF3- 0.5YbF3 glasses. The results indicated that Ba2GdF7906 JOURNAL OF RARE EARTHS, Vol. 28, No. 6, Dec. 2010nanocrystals were formed in the glass matrix and a part of Er3+ and Yb3+ ions were incorporated into the precipitated fluoride nanocrystals after heat treatment. In comparison with the as-made precursor, an increased upconversion lu-minescence of Er3+ ions in ultraviolet and visible region was observed in the transparent glass ceramics. The increased upconversion luminescence intensity was mainly due to the significantly reduced effective phonon energy when Er3+ and Yb3+ ions were incorporated in the fluoride nanocrystals. Due to the high transparency and strong upconversion lumi-nescence, the novel Er3+/Yb3+ codoped oxyfluoride borosili-cate glass ceramics containing Ba2GdF7 nanocrystals may be a promising candidate host matrix for the compact solid short-wavelength laser.References:[1] Kani J, Hattori K, Jinno M, Aisawa S, Sakamoto T, Oguchi K.Trinal-wavelength-band WDM transmission over dispersion- shifted fibre. Electronics Letters, 1999, 35: 321.[2] Tick P A, Borrelli N F, Cornelius L K, Newhouse M A. Trans-parent glass ceramics for 1300 nm amplifier applications.Journal of Applied Physics, 1995, 78: 6367.[3] Li C, Quan Z, Yang P, Yang J, Lian H, Lin J. Shape controlla-ble synthesis and upconversion properties of NaYbF4/NaYbF4: Er3+ and YbF3/YbF3: Er3+ microstructures. Journal of Materi-als Chemistry, 2008, 18: 1353.[4] Li C, Quan Z, Yang J, Yang P, Lin J. Highly uniform andmonodisperse β-NaYF4:Ln3+(Ln=Eu, Tb, Yb/Er, and Yb/Tm) hexagonal microprism crystals: hydrothermal synthesis and luminescent properties. Inorganic Chemistry, 2007, 46: 6329.[5] Wang Y, Ohwaki J. New transparent vitroceramics codopedwith Er3+ and Yb3+ for efficient frequency upconversion. Ap-plied Physics Letters, 1993, 63: 3268.[6] Qiao X, Fan X, Wang J, Wang M. Judd-Ofelt analysis and lu-minescence behavior of Er3+ ions in glass ceramics containing SrF2 nanocrystals. Journal of Applied Physics, 2006, 99: 074302.[7] Xu L, Song B, Xiao S, Lü J. Up-conversion luminescence ofTm3+/Yb3+ co-doped oxy-fluoride glasses. Journal of Rare Earths, 2010, 28: 194.[8] Qiao X, Fan X, Wang M. Spectroscopic properties of Er3+ dopedglass ceramics containing Sr2GdF7 nanocrystals. Applied Physics Letters, 2006, 89: 111919.[9] Chen D, Wang Y, Yu Y, Huang P. Intense ultraviolet upconversionluminescence from Tm3+/Yb3+:β-YF3 nanocrystals embedded glass ceramic. Applied Physics Letters, 2007, 91: 051920. [10] Środa M. Effect of LaF3 admixture on thermal stability ofborosilicate glasses. Journal of Thermal Analysis Calorimetry, 2007, 88: 245.[11] Tyagi A K, Rao U R K, Iyer R M, Nagarajan R. On thepreparation and characterization of REBa2F7-type compounds.Journal of Materials Science Letters, 1993, 12: 1663.[12] Hehlen M P, Frei G, Gü H. Dynamics of infrared-to-visibleupconversion in Cs3Lu2Br9:1%Er3+. Physical Review B, 1994, 50: 16264.[13] Pan Z, Ueda A, Mu R, Morgan S H. Upconversion luminescencein Er3+-doped germanate-oxyfluoride and tellurium-germanate- oxyfluoride transparent glass-ceramics. Journal of Luminescence, 2007, 126: 251.[14] Pollack S A, Chang D B. Ion-pair upconversion pumped laseremission in Er3+ ions in YAG, YLF, SrF2, and CaF2 crystals.Journal of Applied Physics, 1988, 64: 2885.[15] Bijvank E J, Hartog H W Andriessen J. EPR of Gd3+-metal-ion complexes in CaF2, BaF2, and SrCl2. Physics Reviews B, 1977, 16: 1008.[16] Kanoun A, Jaba N, Brenier A. Time-resolved up-convertedluminescence in Er3+-doped TeO2-ZnO glass. Optical Materials, 2004, 26: 79.[17] Fan X, Wang J, Qiao X, Wang M, Adam J L, Zhang X.Preparation process and upconversion luminescence of Er3+-doped glass ceramics containing Ba2LaF7 nanocrystals.Journal of Physics Chemistry B, 2006, 110: 5950.[18] Lin H, Meredith G, Jiang S, Peng X, Luo T, Peyghambarian N,Pun E Y B. Optical transitions and visible upconversion in Er3+doped niobic tellurite glass. Journal of Applied Physics,2003, 93: 186.。