数据科学导论-GitHub
数据科学导论教学课件(共8章)-第3章大数据生态系统

记录
心的传输网络。
汇集
预处理
转换
数据需要我们根据业务模型与应用
需求进行筛选,之后通过传具主要是前端的各类数据
2
采集装置。
原始数据存在着多种可用性不强的
问题,比如缺失值、异常值等问题,
需要在处理之前进行必要的预处理。
从该阶段开始,数据信息进入数据
4
中心,为应对实时海量数据,需要
An Example of OpenMP
#include <stdio.h> #include <stdlib.h> #include <omp.h>
int main(int argc, char* argv[]) { // 编译原语 # pragma omp parallel for for(int i = 0; i < 10; ++i)
5
分析
底层处理上,数据以二进制信息的 形式参与,而模拟形式更适合人类 理解。该阶段便将分析结果以图表 形式展现出来,形象且直观。可视 化工作的运行依赖计算、存储与网 络资源,依赖可跨平台使用的专用 软件。
展现
它主要利用前期数据进行有监督或
无监督学习器的训练与优化,以让
数据“说话”,为后续工作提供智
慧支持。此阶段需综合运用计算资
数据科学 导论
Chapter 3
大数据生态系统
目录
CONTENTS
01 数据生态 02 并行与分布式处理 03 Hadoop, Spark, Storm
数据生态(数据是生命)
鉴于其海量、多样、高速与价值稀疏性,如何有效发现隐藏在数据背后的知识,或者“让数据说话”,是这个时代的 鲜明主题。把数据比作生命,我们可以根据其衍生、传播、转储、运行、展现与回收等不同阶段,兼顾数据特征与业务要求, 分别研发处理工具,对其进行有多级反馈的流水处理。该系统内含多个模块,模块间相互影响、彼此制约,在平衡中完成数 据治理,可谓大数据生态系统。
《数据科学导论》:数据科学概论

•什么是数据科学(家)?
•说什么的都有
-A data scientist is o data analyst wb。
lives M California
-A data scientist is someone who is better at statistics than any software
engineer and better at software engineering than any statistician -Data Science is statistics on a Mac.
•没有人真的知道什么是数据科学(家)……
-数据科学方兴未艾,概念内涵在不断地变化发展
-人们对数据科学还没有明确地形成统一的定义
一个公认却很宽泛的定义Data science is an inter¬disciplinary field that uses
scientific methods,
processes,algorithms and systems to extract knowledge and insights from many structural and unstructured data.
Traditional
Research Software
Development
课程考核•期末成绩:40%
-期末考试(笔试)
•平时成绩:60%
-期中考试:15%
-平时作业与课程项目:80%
-课堂表现:5%
总结
・1.数据科学是如何兴起的・2.数据科学家应具备什么能力・3.教学计划与考核要求
谢谢!。
数据科学导论
数据科学导论数据科学的崛起和发展源于当今数字化时代的到来。
随着互联网、物联网以及社交媒体等大数据信息的爆炸式增长,需要有一种方法来处理、分析和利用这些海量的数据。
数据科学应运而生,成为一门多学科交叉的领域,融合了统计学、数学、计算机科学和领域知识。
一、数据科学的定义和意义数据科学可以被定义为通过使用统计学、机器学习和数据挖掘等技术,从数据中发现模式、提取信息并做出预测的过程。
它的意义在于帮助我们更好地理解和解决实际问题,做出明智的决策。
数据科学在各个领域都有着广泛的应用,包括商业、医疗、金融、社交媒体等。
例如,在商业领域,数据科学可以帮助企业做市场分析、客户行为预测以及销售预测,从而提升营销策略和商业决策的准确性和效率。
二、数据科学的基本原理和技术1. 数据收集与清洗:数据科学家需要从不同的来源收集数据,并对数据进行清洗、处理和转换,以便后续的分析和建模。
2. 数据探索与可视化:为了更好地理解数据,数据科学家会使用统计方法和可视化工具来探索数据的特征、分布和关联性。
3. 数据分析与建模:通过应用统计学和机器学习算法,数据科学家可以对数据进行建模和预测。
这些模型可以帮助我们发现隐藏在数据中的规律,并做出相应的决策。
4. 数据解释与传达:数据科学不仅仅是关于技术和分析,它也需要将分析结果解释给非专业人士。
因此,数据科学家需要具备良好的沟通能力,能够将复杂的数据分析结果转化为简单明了的表达方式。
三、数据科学的发展趋势与挑战数据科学领域正处于快速发展的阶段,不断涌现出新的技术和方法。
以下是数据科学未来发展的趋势和挑战:1. 非结构化数据的挖掘:随着社交媒体、传感器和其他物联网设备的普及,非结构化数据的挖掘和分析将成为数据科学的一个重要方向。
2. 数据隐私和安全性:由于大数据的应用涉及到用户隐私和数据安全等问题,数据科学家需要在挖掘数据的同时注重保护用户的隐私和数据的安全。
3. 数据伦理与道德:数据科学的应用需要遵守一定的伦理和道德原则,确保数据的合法使用,防止数据滥用和偏见。
数据科学导论 lesson3
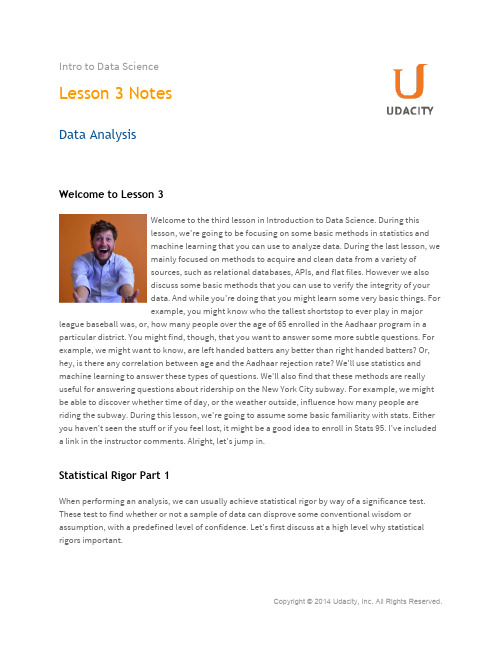
Intro to Data ScienceLesson 3 NotesData AnalysisWelcome to Lesson 3Welcome to the third lesson in Introduction to Data Science. During thislesson, we're going to be focusing on some basic methods in statistics andmachine learning that you can use to analyze data. During the last lesson, wemainly focused on methods to acquire and clean data from a variety ofsources, such as relational databases, APIs, and flat files. However we alsodiscuss some basic methods that you can use to verify the integrity of yourdata. And while you're doing that you might learn some very basic things. Forexample, you might know who the tallest shortstop to ever play in major league baseball was, or, how many people over the age of 65 enrolled in the Aadhaar program in a particular district. You might find, though, that you want to answer some more subtle questions. For example, we might want to know, are left handed batters any better than right handed batters? Or, hey, is there any correlation between age and the Aadhaar rejection rate? We'll use statistics and machine learning to answer these types of questions. We'll also find that these methods are really useful for answering questions about ridership on the New York City subway. For example, we might be able to discover whether time of day, or the weather outside, influence how many people are riding the subway. During this lesson, we're going to assume some basic familiarity with stats. Either you haven't seen the stuff or if you feel lost, it might be a good idea to enroll in Stats 95. I've included a link in the instructor comments. Alright, let's jump in.Statistical Rigor Part 1When performing an analysis, we can usually achieve statistical rigor by way of a significance test. These test to find whether or not a sample of data can disprove some conventional wisdom or assumption, with a predefined level of confidence. Let's first discuss at a high level why statistical rigors important.Let's say that you worked in an office of 1000 people, and you wanted to find out what the most popular favorite color in your office was. It would be a lot of work to ask all to get a pretty good idea of the office's favorite color. When you ask these 10 people, each one says "blue." With that statistic, you might say," Well, since these color, blue must be everyone in the office's favorite color." Of course both you and I have some intuitive idea that this probably isn't true. We just happened to come across ten people who all liked blue. Statistics formalizes this kind of logic. So we can assess the feasibility of a result that we get with a smaller sample when trying to say something about a larger population.Statistical Rigor Part 2You can also imagine a case where at first glance, our results might suggest that there's no significant difference but it turns out that there is. For example, say a website was running an AB test between two different versions of our landing page. They're trying to see which version of the page converts more visits to clicks. Say they run a test for weeks and weeks, placing 500,000 visitors into each test group. One strategy had a conversion rate of 50%, another had a conversion rate of 50.5%. If we run a significance test on this data, we can say with a significant, albeit small difference between the two strategies.Kurt IntroductionSo my name's Kurt Smith, I'm a data scientist on the Analytics team hereat Twitter. Been here about two and a half years right now and I took, youknow, a somewhat long and windy path to getting here. I actually startedout in college studying chemical engineering and then ended up doing aPhD in computational fluid dynamics and molecular modeling And spentquite a while working in academia doing computational research I wentfrom there I moved to San Francisco several years back, and I initially started working in the chemicals industry doing a lot of molecular modeling. And from there the first big leap I would, I may that I would say brought me more to the data science direction was, moving to a startup in the healthcare space, that was doing a lot of data analysis on a risk modeling around chronic disease. And that really was the opportunity, or gave me the opportunity to take a lot of my mathematical background, and apply it to data driven problems. After working in that area for a few years, I started to look around in other fields with interesting data challenges. And that brought me to moving to social media and Twitter.Why Is Stats UsefulOkay, why is statistics useful in data science? There's a lot of reasons, obviously. The, the, the first reason, I would say, is, the most basic one and this goes back to why statistics was, you know, developed a hundred or so years ago. And it really is to make sure that you're making reasonable inferences from data. So you hear a lot of people talk about big data and the value of big data and how we can you know, have data on just about everything nowadays. And it's easy to get caught up in that and it's important to remember, that anytime, you're looking at any sort of data whether it's observational or experimental. You want to make sure that you're making valid inferences, right? You want to do things like check for statistical significance, understand confidence intervals. Make sure that you're not pointing you're working with in, in certain conc, wrong direction because you've over interpreted some data so I think that's the first, probably most important reasons why statistics is important to data science there's a lot more just working with data, day in and day out there's a lot of what I would call. Sort of, you know very fine-grain technical skill, to just make sure, you're doing the right thing, and you're extracting the most information you can out of data.Quiz: Statistical Rigor ExerciseAlright, so just to recap, why are statistical significance test useful? Check all that apply. They provide a formalized framework for comparing, and evaluating data. They can make a bad result look good. They enable us to evaluate whether perceived effects in our dataset, reflect differences across the entire population.[x] They provide a formalized framework for comparing and evaluating data[ ] They can make a bad result look good[x] They enable us to evaluate whether perceived effects in our dataset reflectdifferences across the whole populationAnswer:Alright. So, why are statistical significance tests useful? So, they do provide a formalized framework for comparing and evaluating data. And they do enable us to evaluate whether perceived effectsin our data set reflect differences across the whole population. They do not make a bad result look good. Significant sets are useful because they provide a formalized framework for comparing and evaluating data. Different tests have different assumptions and rules that they incorporate, and using a particular test ensures that everyone is on the same page in so far as what we're assuming about our data. Significance tests also enable us to evaluate whether perceived effects in our data set reflect differences across the whole population. As was the case with our company, where ten out of ten people polled preferred the color blue. Sometimes an effect that we seen in a small sample does not reflect what might be true across the entire population. A statistical significance test let's us formally determine whether or not this might be the case. Unfortunately, a bad result is not going to look any better or worse as a result of using a statistical significance test. If our data's bad, or there's really no difference between our two samples. We're not going to be able to undo that with a test. It is possible though that different tests might give us different results. The really important thing and we'll go into this a bit more is that you need to use the right test in the right situations. Why don't we talk a little bit about how we might actually run a statistical significance test.Quiz: Statistical TestLet's say that we wanted to compare the batting averages of left handed and right handed hitters in major league baseball. So we're curious in answering the question, is there any difference between the batting averages of lefties and righties? We could just look at the data and try to answer this question without a significance test. But then we really couldn't trust our answer very much. It's a much better idea to answer thisquestion using a statistical test. Manystatistical tests that you might use toanalyze data make an assumptionabout the probability distribution thatyour data will follow. There are manydifferent probability distributions outthere, but one of the most commonand the one that I want to discuss isthe normal distribution, which is alsosometimes referred to as the Gaussiandistribution or a Bell curve. If you've taken an introduction to statistics course, the normal distribution should be familiar. Which of the images below depicts a normal distribution? Check the box below the correct one.Answer:Normal distributions generally looklike this. Although their width andcenter can change based on thedistribution's parameters. There aretwo parameters associated with anormal distribution. The mean, mu.And the standard deviation, sigma.These two parameters plug in to thefollowing probability density function, which describes a Gaussian distribution. The expected value of a variable described by a Gaussian distribution is the mean, mu. and the variance is the standard deviation, sigma squared. Normal distributions are also symmetric about their mean. If you've taken an introduction to stats course, the normal distribution should be a familiar tool.Introduction to Normal DistributionThere are two parameters associated with a normal distribution. Themean, mu, and the standard deviation, sigma. These two parametersplug in to the following probability density function, which describes aGaussian distribution. The expected value of a variable described by aGaussian distribution is the mean, mu, and the variance is thestandard deviation, sigma squared. Normal distributions are alsosymmetric about their mean. If you've taken an introduction to statscourse, the normal distribution should be a familiar tool.Quiz: Normal DistributionHere are the equations for a few different normal distributions. Can you determine from their probability distributions, the mean, standard deviation, and variance? Fill in your answers in these boxes below. So, mean would go in these. Standard deviation would go in here, and variance in these guys.Answer:Recall that the equation for a normal distribution is minus x minus mu quantity squared, over 2 sigma squared, where mu is the mean and sigma is the standard deviation. Sigma squared is the variance.If we know the form of this equation. It's not hard to look at all of these equations and figure out the values for the mean. Standard deviation and variance. They are five, and 25. Eight, one, and one. And zero, one, and one.T TestNow that we've familiarizeourselves with the normaldistribution, let's discuss one ofthe most common parametrictest that we might use tocompare two sets of data. Suchas our samples of left handedand right handed batters, thatwould be the t-test. The t-testlike many statistical tests aimsat accepting or rejecting a nullhypothesis. A null hypothesis is generally a statement that we're trying to disprove by running our test. For example, that two samples came from the same population. This might mean that left-handed and right-handed batters show no real difference in their batting average, or that a certain sample is drawn from a particular probability distribution. For example, if we had a sample of 20 heights and weights of Arbitrary baseball players, we might want to test how likely it is that those 20 people are drawn from the known MLB player population. A hypothesis test such as the t-test is usually specified in terms of a test statistic. The test statistic reduces your data set to one number that helps to accept or reject the null hypothesis. When performing a T-test, we compute a test statistic called T. Depending on the value of the test statistic T, we can determine whether or not or null hypothesis is true. In the case of the one sample T-test, our null hypothesis would be that thepopulation mean, mu, is equal toour sample mean, mu not. In theT sample case, which we'll bemore concerned about for thepurposes of our example, Thenull hypothesis would be aboutour population means, m0 andm1 are equal.Welch T TestLet's talk more about the two sample t-test, since we'll want to compare two different samples in our class project. There are a few different versions of the t-test that one might employ ,and they depend on really on what assumptions we make about the data. So we might want to ask questions suchas ,do our samples have the same size ?,and do they have the same variance? . Let's discuss a variant of the t-test called Welch's t-test in more depth. Since it's the most general. It doesn't assume equal sample size ,or equal variance. In Welch's t-test ,we compute a t-statistic using following equation. T equals mu1 minus mu2, divided by the square root of sigma1 squared over n1. Plus sigma 2 squared over n2. Where mu I ,is the sample mean for the Ith sample. Sigma squared I is the sample variance for the Ith sample. And NI is the sample size for the Ith sample. We'll also want to estimate the number of degrees of freedom, nu, using the following equation. Nu is approximately equal to. Quantity sigma1 squared ,over n1 ,plus sigma2 squared over n2 ,squared over sigma1 of the Where mu I is equal tomi minus one ,and this is the degrees of freedom associated with the Ith variance estimate. If you're unfamiliar with degrees of freedom again it might be a good idea to brush up on your stats concepts with the audacity's intro to stats course. A link is provided in the instructor comments. Alright so once we have these two values, we can estimate the P value. Conceptually, the P-value is the probability of obtaining the test statistic at least as extreme as the one that was actually observed ,assuming that the null hypothesis was true. The P value is not the probability of the null hypothesis is true given the data. So again, just as a thought experiment. Say we were testing whether left handed or right handed baseball players. Were better batters by looking at their average batting average. If the P value is .05, this would mean that ,even if there is no difference between left handed and right handed batters, since that's our null hypothesis. So, even if this was true, we would see a value of t ,equal or greaterto the one that we saw 5% of the time. When performing a statistical test like this, we usually set some critical value of P. Let's call it P critical. If P falls below P critical, then we would reject the null hypothesis. In the two sample case, this is equivalent to stating that the mean for our two samplesis not equal. Calculating this P value for a given set of data can be kind of of tedious. Thankfully, we seldom have to perform this calculation explicitly.Programming Quiz: Calculating T And NuAll right. Why don't we try computing these two quantities, t and nu, given some example batting average data. So, let's say that I had two samples. One with 150 data points, a mean batting average of 0.299, and a variance of of 0.307, and a variance of 0.08. What are the values of t and nu given this data? Fill in your answers in these boxes below, and round them to three decimal places.Answer:We can just plug the information provided into our equations for t and new. If we look at the equations for t, t is 0.307 minus 0.299 over the square root of 0.05 over 150 plus 0.08 over the quantity 0.05 over 150 plus 0.08 over 165 squared. Over 0.05 squared over 150 squared times 149 plus is going to be 307.199. The t statistic here, again is sort of some idea of, you know, how extreme is our result and how likely is it to disprove our null hypothesis? Meanwhile, the nu here is kind of some idea of how many independent variables went into calculating this t-value?Programming Quiz: Welch T Test in PythonAlright, so we've established that we can do this t-test and compute these t-values and nu values and, and p-values in the abstract mathematical sense, but you might be wondering how do I do this in python? Is there a simple way to do this? Well, the answer is yes, this can be done in the following way. First you simply import scipy.stats. And then you call scipy.stats.ttest_ind and then supply as arguments two lists, which are your two sets of data, and then an optional argument, equal_var=false. This indicates whether or not we think the variance of our two samples is equal. This equal_var=false argument makes this particular call of the t-test equal to Welch's t-test. This function will return a tuple. The first value is the t-value for your data. And the second value is the corresponding p-value for a two-tailed test. The values returned by scipy.stats.ttest_ind assumes that you are performing a two-sided t-test where we're only testing for whether the means of our two samples are different. Say we wanted to do a one-sided t-test, that is, we're interested in testing whether one mean in particular is greater than or less than the other. How might we do this given the output that this function produces? Write your answer in the text box below. Here's a hint. We can still use the t value and p value that this function returns. Don't worry. This won't be graded.Answer:Alright, so with the symmetric distributions like our normal distribution, the one sided p-value is simply going to be half of our two sided p-value. Remember that the p-value is the probability that given the null hypothesis is true, we would observe a test statistic at least as extreme as what we saw. So instead of having both sides of this distribution, we're really only going to have one side of the distribution. So we have a one-sided t-test where we're checking whether the mean of sample one is greater than the mean of sample two. We still want p over two to be less than our p critical, maybe that's 0.05, but we want our t value to be greater than zero. Whereas for a less than one-sided t-test, where we're testing whether the mean of sample one is less than the mean of sample two, we want p over 2 to be less than p critical, but we want our t value to be less than 0.Programming Quiz: Welch T Test ExerciseOkay, why don't we work through an example. Let's say we had a CSV file located at this directory, and that it contained a number of columns. Among them are a player's name. We call that column, name. There's also a column called handedness, L for left-handed R for right-handed, and a column for the player's career batting average, called avg. Write a function that will read that data into a Pandas dataframe, and then run Welch's t-test on the two cohorts defined by handedness. With a significance level of 95%, if there is no difference between the two cohorts, return a tuple consisting of true, and then the tuple returned by scipy.stats.ttest. If there is a difference, return a tuple consisting of false, and then the tuple returned by scipy.stats.ttest. So an example of what your output might look like is false and then the tuple 0.405, 0.006. Your code should go here. Since we're using Welch's t-test, we're assuming our data is sampled at random and that both samples follow a normal distribution. We don't make any assumptions about the variance of both samples. They may be the same, but they also may be different.Answer:Alright, why don't we walk through our solution function compare_averages. Remember that we're performing a t-test on two sets of baseball data, left-handed and right-handed hitters. We want to perform a Welch's t-test and determine with 95% confidence whether or not the average batting average of the two cohorts is different. In other words the left handed hitters have a statistically significant different average batting average than right handed hitters. First, we read our data intoa panda's data frame. So baseball date equals pandas.read_csv and then the location of our csv file. Then we're going to split the data into two data frames, one for left handed hitters and onefor right handed hitters. We do this by saying baseball_data_left equals baseball_data, and then index on baseball_data handedness equals L. We can do the same thing for right-handed hitters. Then we'll use scipy.stats.ttest_ind to perform a Welch's t-test on these two data frames. So results equals scipi.stats.ttest_ind and then we pass in baseball data left average, baseball data right average, and we say equal_var equals false. Now we're going to produce an output in the desired format. So if result one is less than or equal to .05, that is if our p value is less than or equal to .05, will return false and then the output of scipy.stats.ttest_ind. Else will return true, and then the result of scipy.stats.ttest_ind. So this is a basic implementation of how we can do Welch's t-test using Python.Non Parametric TestAll right. So let's say that we look at our data and it's clearly non-normal. Or we use a statistical test like the Shapiro-Wilk Test and find that our data's non-normal that way. Is there anything that we can do? Well, first off there's some math that says that we have enough data. That we have, you know, a large enough sample size we can actually use tests that assume normality. For example, the t test. Even when our data is not normal. But there also exists nonparametric tests that we can useto compare two samples. A non-parametric test is a statistical test that does not assume our datais drawn from any particular underlying probability distribution. One such test is the Mann-WhitneyU Test which is also sometimes referred to as the Mann-Whitney Wilcoxon Test. This is a test of the null hypothesis that two populations are the same. Again I don't want to go to in depth into the theory of how this test works, but I did want to tell you that things like this exist and show you that this test can also easily be implemented in Python using Scipy. We'd simply say U and P are equal to scipy.stats.mannwhitneyu. And provides as arguments are two samples which we'll call here X and Y. This function will return U, the Mann-Whitney test statistic. As well as P, which is the one sided P value for this test. The P value here again acts as it did for the T test. Note that the Mann-Whitney U test simply tests whether or not these samples came from the same population. But not necessarily which one has a higher mean or a higher median or anything like that. Because of this it's usually useful to report Mann-Whitney U test results along with some other information. Like, the two sample means, or the sample medians, or something like that.Non Normal DataWhen performing a t-test, we assume that our data is normal. In the wild, you'll often encounter probability distributions. They're distinctly not normal. They might look like this, or like this, or completely different. As you'd imagine, there are still statistical tests that we can utilize when ourdata is not normal. Why don't webriefly discuss what you might do insituations like this. First off, weshould have some machinery inplace for determining whether ornot our data is Gaussian in the firstplace. A crude, inaccurate way ofdetermining whether or not ourdata is normal is simply to plot ahistogram of our data and ask, doesthis look like a bell curve? In both ofthese cases, the answer woulddefinitely be no. But, we can do a little bit better than that. There are some statistical tests that we can use to measure the likelihood that a sample is drawn from a normally distributed population. One such test is the shapiro-wilk test. I don't want to go into great depth with regards to the theory behind this test, but I do want to let you know that it's implemented in scipy. You can call it really easily like this. W and P are going to be equal to scipy.stats.shapiro data, where our data here is just an array, or list containing all of our data points. This function's going to return these two values. The first, W is the Shapiro-Wilk Test statistic. The second value in this two-pole is going to be our P value, which should be interpreted in the same way that we would interpret the p-value for our t-test. That is, given the null hypothesis that this datais drawn from a normal distribution, what is the likelihood that we would observe a value of W that was at least as extreme as the one that we see?Quiz: Definition of NonParametric TestJust to quickly recap, what is thedefinition of a non-parametric test?A non-parametric test is a statisticaltest that assumes the data is drawnfrom a non-parametric probabilitydistribution? Assumes the data isdrawn from a non-Gaussianprobability distribution? Does notassume the data is drawn from any particular underlying probability distribution? Or is the same as Welch's t-test? Check the correct answer.[ ] Assumes the data is drawn from a non-parametric probability distribution[ ] Assumes the data is drawn from a non-Gaussian probability distribution[x] Does not assume the data is drawn from any particular underlying probabilitydistribution[ ] Is the same as Welch’s t-testDefinition of Non Parametric TestThe correct answer is that a non-parametric test does not assume the data is not drawn from any particular probability distribution. There's not really any such thing as a non-parametric probability distribution. This terminology non parametric really describes test types or statistical methods. Assuming a non-Gaussian probability distribution would still assume some probability distribution. And finally, Welch's t-test is definitely not a non-parametric test, since it assumes a certain underlying probability distribution so there's no way that the non-parametric test is the same as Welch's t-test.Just the Tip of the IcebergThese have just been some of the methods that we can use when performing statistical tests on data. As you can imagine, there are a number of additional ways to handle data from different probability distributions or data that looks like it came from no probability distribution whatsoever. Data scientists can perform many statistical procedures. But it's vital to understand the underlyingstructure of the data set and consequently, which statistical tests are appropriate given the datathat we have. There are many different types of statistical tests and even many different schoolsof thought within statistics regarding the correct way to analyze data. This has really just been an opportunity to get your feet wet with statistical analysis. It's just the tip of the iceberg.Quiz: Predicting Future DataNow we know how to analyze existing data. However, is there any way we can make predictions about data we'll collect in the future, using data we've collected in the past? Write some ideas on waysto do this, in the text box below. Try to think about methods we used to predict Titanic survivors in Assignment number one.Answer:In addition to statistics, many data scientists are well versed in machine learning. You mightbe wondering what exactly is machine learning. Well, machine learning is a branch of artificial intelligence that's focused on constructing systems that learn from large amounts of data to make predictions. Machine learning could also be useful to predict which movies you might like on Netflix. Or how many home runs a batter may hit over the course of his career. These are all potential applications of machine learning.Why Is Machine Learning UsefulOkay, why is machine learning useful? So that's, that, that's a great question and, and it, you know, I, I think it touches on this, this sort of classic question, or this long running discussion, on what isthe difference between statistics and machine learning. there's, there, there's a lot of great papers. There's one classic paper, I, I forget the name exactly, but it's something along the lines of the two cultures, and talking about why these two different approaches developed. So I think, if you lookat machine learning, it, it grew out more of a computer science direction, and, and it grew out ofa lot of areas where people had very practical hands on questions, right? How can we build thebest recommendation system? How can we make the best predictions or classifiers for, for a given problem? And machine learning has developed a lot of really, really good techniques for doingthat, for doing things that work very well in practice. And so I, I think that's there, there are a lot of applications where that's really what you're getting at particularly when you have the opportunity to build a product that will you know, take some action based on, based on some algorithms. Those are areas where machine learning is really at the cutting edge of coming up with the most effective ways of making decisions in real time based on data. I see.。
数据科学导论 lesson1
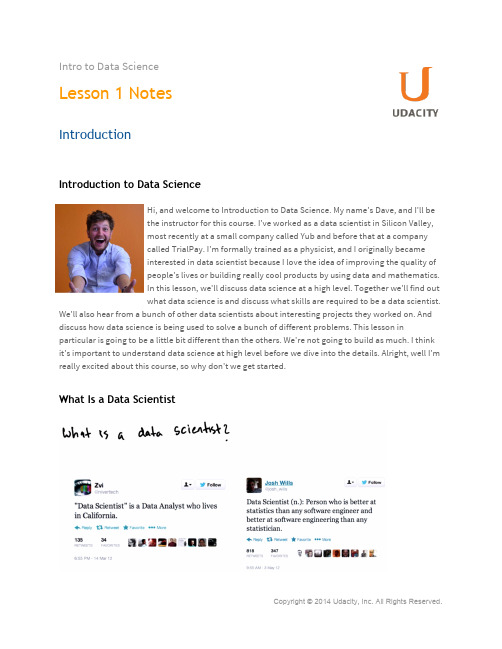
Intro to Data ScienceLesson 1 NotesIntroductionIntroduction to Data ScienceHi, and welcome to Introduction to Data Science. My name's Dave, and I'll bethe instructor for this course. I've worked as a data scientist in Silicon Valley,most recently at a small company called Yub and before that at a companycalled TrialPay. I'm formally trained as a physicist, and I originally becameinterested in data scientist because I love the idea of improving the quality ofpeople's lives or building really cool products by using data and mathematics.In this lesson, we'll discuss data science at a high level. Together we'll find outwhat data science is and discuss what skills are required to be a data scientist. We'll also hear from a bunch of other data scientists about interesting projects they worked on. And discuss how data science is being used to solve a bunch of different problems. This lesson in particular is going to be a little bit different than the others. We're not going to build as much. I think it's important to understand data science at high level before we dive into the details. Alright, well I'm really excited about this course, so why don't we get started.What Is a Data ScientistPeople have many different conceptions of what data scientists do. Some might say that a data scientist is just a data analyst who lives in California. While others might say that a data scientist is a person who's better at statistics than any software engineer, and better at software engineering than any statistician. As you can see, definitions vary wildly from place to place, and from person to person.Quiz: What Is a Data ScientistSo before we get started, let me ask you a question. What do you think data scientists do in theirday-to-day work? Type your thoughts in the text box below. Don't worry, there are no right or wrong answers and this quiz will not be graded.Answer:Let me tell you my perspective. From personal experience, data scientists today are people who have a blend of many different skills. This Venn diagram shows a definition of a data scientist that I like a lot. A data scientist is someone who knows mathematics and statistics, which allows them to identify interesting insights in a sea of data. They also have theprogramming skills to code up statistical models and getdata from a variety of different data sources. Furthermore,a data scientist is someone who knows how to ask theright questions and translate those questions into a soundanalysis. After doing the analysis, they have thecommunication skills to report their findings in a way thatpeople can easily understand. In other words, datascientists have the ability to perform complicated analysison huge data sets. Once they've done this, they also havethe ability to write and make informative graphs tocommunicate their findings to others.What Does a Data Scientist DoHere are some things that a data scientist may do in his or her daily work. They mightwrangle data. That is, collect data from the real world, process it, and create a data setthat can be analyzed. Once they have a data set, they may analyze trends in the existingdata or try to make data driven predictions about the future using the data at hand.Based on this models or predictions, they cannot only build data driven products but also communicate their findings to those other data scientists and the general public. File visualizations, reports or blog posts. But hey, this is my point of view. Why don't we talk to some other data scientists and hear their thoughts.Pi Chuan IntroductionMy name is Pi-Chaun Chang. My background, so I've been doing Computer Science ever since college.I did a PhD CS PhD at Stanford, and I worked at Google for four years. Now I'm in a startup called AltSchool.Pi Chuan - What Is Data Sciencenow I think about it, I have been doing data science since the day I was at inTaiwan doing a Masters in speech recognition. The way we wouldunderstand speech is to collect a lot of data and understand how to modelthings like a phoneme in speech. And how to understand people's languageprocessing requires a lot of data collection as well. And at Google, which isa company that collects a lot of data, I also did personalization there which requires a lot of data to understanding a person's behavior. So, that to me is data science. Using data to build a useful model or to understand a particular pattern that is useful, then later on, for othersoftware applications.Gabor IntroductionSo my name is Gabe Savo, I work at Twitter, and I am data scientist. Iactually come from a background that's towards natural sciences. I didstatistical physics, and I have a PhD in statistical physics. And anything thatgoes with that. Obviously, I was looking at like a lot of big, big systems as aninteraction of, of very small very small entities composing of these systems.And and later on I did complex network research. So that means that wehave interactions again. Imagine like a big gas composed of molecules. Butinstead here we have like, the humans interacting with, with each other through social networks. Through mobile communication networks. So that was the main focus of my research all year.Gabor - What is Data ScienceThat's a great question. So what do data scientists do? I think it's it's really hard to to pinpoint exactly what they do because it's going to be tailored to their actual application area that they work. But in general, what they do is they take data and they find meaning in the data. And what the meaningis going to be really geared towards what they would like to explain. So it could be that a particular company, if they are looking at a company or, or the project. If they are looking for some, some particular signal or something. I think in general in my mind what data science does is use is usethis data. Data sciences uses data to essentially explain and perhaps predict behavior be it human behavior or even the behavior of a more machine generated system, anything could be like that.Quiz: Basic Data Scientist SkillsJust to recap, let me ask you a quick question. What does it mean for adata scientist to have substantive expertise and why is it important? Typeyour answer in the box below. Don't worry, your response won't be graded.Answer:As we discussed earlier in this lesson, a data scientist needs to have substantive expertise. What does that mean? Well typically it means that a data scientist knows which questions to ask, can interpret the data well and understands the structure of the data. You can imagine that a data scientistneeds to know about the problem that solving. For example, if you are solving an online advertising problem, you want to make sure you understand what types of people are coming to your website. How they are interacting with the website and what different data means that can help you ask the right questions like, Are people falling off and not completing our ads at a certain point in the flow,or do people complete more ads at a certain time of the day? You would also, then, be very familiar with how the data is stored and structured. And that could help you work more efficiently and more effectively. This is why it's important for a data scientist to have substantive expertise. It's important to note that data scientists usually work in teams. So it's normal for data scientists to be stronger in some areas and weaker in others. So even if you, as a data scientist, don't have a tons of substantive expertise, if you have great hacking skills or know a lot of statistics you can still be a valuable member of a data science team.Problems Solved by Data ScienceNow that you have a better Ideaof what data science is, and whatdata scientist do, let's talk abouthow data science can be appliedacross a wide spectrum ofindustries. You might havesigned up for this class under thenotion that if you become a datascientist, you'll end up workingfor a Silicon Valley startup. Wellit's true that most techcompanies do employ datascientists. Data science can alsobe used to solve problems in many different fields. What are some examples of the types of problems being solved using data science? Well for one, Netflix uses collaborative filtering algorithms to recommend movies to users based on things they've previously watched. Also, elements of many popular social media websites are powered by data science. Things like recommending new connections on Linkedin, constructing your Facebook newsfeed or suggesting new people to follow on Twitter. Many other online services or apps such as dating websites like OKCupid or ride sharing services like Uber uses the vast amount of user data available to them, not only need to customize and improve the user experience but also to publish interesting anthropological findings regarding people's behavior in the offline world on their blogs.Okay, so I know what you're thinking. So far, all of these seem like problems data scientists are expected to solve, but data scientists work in many domains. Data science concepts are integral in processing and modeling data in the field bioinformatics where scientists are working on projects like annotating genomes and analyzing data sequences. This past summer, data science for social good fellows in Chicago worked on a project attempting to solve Chicago's bus crowding issues using data. In addition, physicists use data science concepts when building a 100 terabyte database of astronomical data collected by the Sloan digital sky server. This one's cool. Analyzing electronic medical records allowed the city of Camden, New Jersey to save enormous amounts of money by targeting their efforts towards specific buildings accounting for a majority of emergency admission. Finally, NBA teams like the Toronto Raptors are installing a new technology, sports view cameras, on the basketball courts. They collect huge amounts of data on players movement and playing styles. This helps teams to better analyze game trends and improve coaching decisions. You've probably noticed by now that data science is making an impact in areas far and wide. Data science isn't simply a trendy new way to think about tech problems. It's a tool that can be used to solve problems in a variety of fields. Data scientists are working at Silicon Valley start-ups to enrich our online experiences, but they're also doing important work in our cities, in our laboratories and in our sports stadiums.PandasAs you can imagine, since data science is being deployed in such a wide range of fields. Data scientists use many different tools. Depending on the task at hand. One of the most versatile and ubiquitous is a Python package called Pandas. Which we'll use in order to handle and manipulate data during this course. You might wonder why we'll beusing Pandas as opposed to anothertool. Pandas allows us to structure andmanipulate our data in ways that areparticularly well suited for dataanalysis. If you happen to be familiarwith the scripting language R, Pandastakes a lot of the best elements from Rand implements them in python.DataframesFirst of all, data in Pandas is often contained in a structure called a dataframe. A dataframe is atwo-dimensional labeled data structure with columns which can be different types if necessary. Forexample types like string, int, float, and Boolean. You can think of a dataframe as being similar to an Excel spreadsheet. We'll talk about making dataframes in a bit. For now, here's what an example dataframe might look like. Using data describing passengers on the Titanic, and whether or not they survived the Titanic's tragic collision with an iceberg. Note that there are numerous columns. Name,age, fare, and survived? Thesecolumns have different data-types. There are also some Not-a-Number entries which happenwhen we don't specify a value.There are a bunch of cool thingswe can do with this data frame.Let's jump to the command line.Say that I had already loaded thisdata into a data frame called DF.We can operate on specific columns by calling on them as if they were keys in a dictionary. For example, DFH and we can call on specific rows by calling a data frame objects loc method, and passing the row index as an argument, for example, df.loc('a').Create a New DataframePanda also allows us to operate on your data frame in a vectorized item by item way. What does it mean to operate on a data frame in a vectorized way? Well first let's create a new data frame. Note that first I want to create a dictionary where the keys are going to be my column names and the values are series corresponding to their values and then the indexes for the rows where these values should appear. In order to make a data frame, I can simply say df equals data frame of this dictionary d. Let's see what this data frame looks like. We can call dataframe.apply and pass in some arbitrary function. In this case, numpy.mean to perform that function on every single column in the data frame. So when we df.apply numpy.mean, what we get back is the mean of each column in our data frame df. There are also some operations that simply cannot be vectorized in this way, that is, take a numpy.meanas their input, and then return an array or a value. So we can also call map on particular columns or apply map on entire data frames. These methods also accept functions, but functions that take in a single value and return a single value. For example, if I were to type df1.map lambda x, x greater than or equal to 1, what I get back here is whether or not every single value in the column 1 is greater than or equal to 1. Now say that I were to call df.applymap lambda x, x greater than or equal to 1, whatthis function returns is whether or not every single value in the data frame df is greater than or equal to 1. This is just the tip of the iceberg when it comes to Panda's functionality. If you're interested to read more about what the library can do, you should check out the full documentation at the URLcontained in the instructor notes. Now, we know some of the very basics when it comes to handling the data, but how do we acquire the data that we wish to handle and analyze?Lesson Project - Titanic DataAlright. Before we get started on the class project, this lesson's assignment will allow you to get comfortable with the type of work that data scientists do using a small and classic data set. This data set describes the riders on the Titanic and a bunch of information about them. For example, what class they were in, whether they were male or female, how old they were, etcetera. Over the courseof the assignment, you'll build a few different models. The models will start out simple, but they'll get increasingly complex. To see if using data science, we can predict who will survive and who won't survive the Titanic tragedy. This may sound complicated, but don't worry. We'll give you plenty of help. This assignment is meant to get you in the habit of thinking like a data scientist.Class ProjectThrough the class project, you'll investigate New York City subway ridership as a data scientist might. First, you'll pull some publicly available data on subway ridership, and also on New York weather conditions, using the New York MTA website and the Weather Underground API. Then, you'll answer some questions about subway ridership using statistics and machine learning. Does the weather influence how many people ride the subway? Is the subway busier at certain times than others? Can we predict subway ridership? Finally,you'll develop some charts andgraphics that communicate yourfindings, and synthesize everythinginto a cohesive write-up that yourfriends or family might find usefuland informative. This may sounddaunting, but we'll be going throughthis step by step, and learning how touse the necessary tools as we goalong.Pi Chuans Advice for Aspiring StudentsSo for me, the reason why I even come into this field of data science is my passion for something specific, which is natural language. Right, so I observe the people who work around me who knows about data science. I think one thing that's very important is they either have a passion for the particular data they're looking at. Like, you know, natural language, or like speech recognition kind ofdata. Or some people are just very interested in patterns in data. Like when they see some data they would try to calculate the mean of the data, the variance of data. It comes natural to them because they want to find patterns to the data. So I think for anyone who wants to become a data scientist, it's good to think about, what kind of data you are interested in doing, and start with that. And then later on when you have this skill of analyzing data, you can apply it to any other kind of thing.Gabors Advice for Aspiring Data ScientistI think the, the most important thing that, that inspired me to start to start keep In mind is that they should have a very curious mind. They should have the ability to ask questions, to formulate these questions as it pertains to them, as they would see these questions being raised in their own lives.So if, if there's a problem they see with the pieces that they are working with or with the project that they're working with, they should try to ask these questions in terms of and how they can understand for themselves. And once they understand, once they know what is the gist of the question is, then they can go and use algorithms. Obviously it helps tremendously if you have experience about allthe arguments that are out there to attack these questions. But I think the most important ability is that you should have the mindset as a data scientist, and you could obviously improve throughout your career in this if you have this inquisitive mindset, where you are trying to ask the right questions. While you are trying to, to see what is important, you should also have an overview of what kind of data can support your conclusions and draw conclusions with the help of these algorithms that you are going to use to solve these problems.Recap of Lesson 1To recap today's lesson, data science is a discipline that incorporates methods and expertise froma variety of different fields, to glean insights from large data sets, and then use those insights to build data driven products, or to create action items. There's no cookie cutter way to become a data scientist, but a lot of data scientists have a very strong background in mathematics and statistics, and also have the programming skills to handle these data sets and also to perform analysis. Currently, data science is most closely associated with the tech field, but more and more data science is being used all over the world in a variety of different fields. In order to solve new and old problems, more efficiently and effectively. Now I know what you're thinking. This sounds awesome, data science sounds really cool, I want to work on a project get me some data. Unfortunately, data seldom comes in formats that we want. It might be in a format we've never seen, it might come from a weird source. There might be missing or erroneous values. Because of this, any data scientist worth their salt is skilled at acquiring data. And then massaging it into a workable format. That's what we're going to be covering in the next lesson.。
数据库系统原理,github
数据库系统原理,github1.数据库系统原理是数据库技术的基础理论。
Database system principle is the fundamental theory of database technology.2.通过学习数据库系统原理,可以深入了解数据库的存储、管理和优化。
Studying the principles of database system can help us understand the storage, management and optimization of databases in depth.3.数据库系统原理涉及到数据结构、算法、操作系统等多方面知识。
The principles of database system involve various knowledge such as data structure, algorithms, and operating systems.4.学习数据库系统原理可以帮助我们设计高效的数据库系统。
Studying the principles of database system can help us design efficient database systems.5.了解数据库系统原理能够提升我们在数据库领域的专业能力。
Understanding the principles of database system can enhance our professional skills in the field of databases.6. 《数据库系统原理》是一本经典的数据库教材。
"Database System Principles" is a classic textbook on databases.7.该书详细介绍了数据库系统的各个方面。
The book provides a detailed introduction to various aspects of database systems.8.通过阅读该书,可以系统地学习数据库系统原理。
数据科学导论

数据科学导论
数据科学导论作为数据科学领域的导读,应该被认为是这个领域的基石。
它主
要给出数据科学的基本概念,核心知识,研究方法,数据分析的技术,和常见的应用实际,其中包括了各个重要组件的系统性介绍,例如用于解决概率问题的概率论和派生的知识,以及用于检验数据的正确性的统计学知识。
数据科学导论不仅涉及到理论知识的介绍,还涉及到数据科学领域中实践技能
的指导,包括机器学习算法和数据挖掘算法的使用,以及相关的数据说明等。
此外,还有一些论文话题信息,以及与数据处理有关的技巧。
通过这些数据科学导论,读者可以熟悉数据科学的研究与应用情况,掌握数据分析的技巧,以及相关的程序技术,最终实现更好的研究成果。
因此,数据科学导论是一本极其重要的参考书,利用它可以系统地学习数据科
学领域的基本概念,研究方法和数据分析的技术应用。
这能帮助读者全面掌握数据科学的基本知识结构,并帮助他们深入研究该领域相关的议题,提出行之有效的解决方案。
进而帮助提高数据科学领域的应用技能和研究结果,从而实现真正的数据挖掘和机器学习等技术的进步。
数据科学导论

数据科学导论•内容简介:•《数据科学导论(面向新工科专业建设计算机系列教材)》主要介绍数据科学的通识入门知识,可以作为高等院校数据科学与大数据专业的专业基础课程教材。
该书以“建立知识体系、掌握基本原理、学会初级实践、了解前沿技术”为原则,为数据科学与大数据及相关专业的学生深入学习数据科学和大数据技术奠定基础。
该书系统讲授数据科学的基本概念和知识体系、数据分析的基本流程和方法(包括数据预处理、回归、聚类、分类等智能分析技术)、大数据分析的基本T具,并以Python语言为例,通过大量实例和练习讲授初级的数据分析技术。
该书通过系统全面的理论介绍与丰富翔实的程序实践相结合,帮助数据科学与大数据及相关专业的学生树立大数据意识,学习数据科学的知识体系,掌握基本的数据处理方法。
《数据科学导论(面向新工科专业建设计算机系列教材)》适合作为数据科学与大数据及相关专业学生的教材,也可作为大数据开发工程师的参考书。
•作者简介:•石川,北京邮电大学教授、博士生导师。
长期从事计算机专业基础课程教学工作,参与多项教改项目。
主要研究方向为数据挖掘和机器学习,发表高水平学术论文100余篇,中英文专著3部,成果应用于IT企业。
研究成果获得省部级奖励3项,本人获得北京市高等学校青年英才和师德先锋等称号。
王啸,北京邮电大学讲师、硕士生导师。
天津大学博士,圣路易斯华盛顿大学联培博士,清华大学博士后,主要研究方向为数据挖掘与机器学习,曾主持国家自然科学基金项目,发表高水平论文50余篇,获得微软亚洲研究院“铸星计划”支持。
胡琳梅,北京邮电大学副教授,硕士生导师。
清华大学博士,北京市优秀毕业生。
主要研究方向为自然语言处理与知识图谱,获2019年微软亚洲研究院“铸星计划”支持。
•目录:•第1章数据科学概论•1.1 数据和大数据•1.1.1 数据•1.1.2 数据化进程•1.1.3 大数据•1.2 数据科学理论基础•1.2.1 数据科学发展历程•1.2.2 数据科学的概念•1.2.3 数据科学的主要内容•1.3 数据科学应用实践•1.3.1 数据科学家•1.3.2 数据科学工作流程•1.3.3 数据科学实践案例•1.4 小结•1.4.1 本章总结•1.4.2 扩展阅读材料•1.5 习题•1.6 参考资料••第2章数学基础•2.1 线性代数•2.1.1 向量•2.1.2 矩阵•2.1.3 矩阵导数•2.1.4 实例:利用SVD进行评分预测•2.2 概率统计•2.2.1 随机事件与概率•2.2.2 条件概率与事件独立性•2.2.3 随机变量及其数字特征•2.2.4 数理统计•2.2.5 信息论•2.2.6 实例:利用朴素贝叶斯算法进行文本分类•2.3 优化理论•2.3.1 基本概念•2.3.2 优化问题的一般形式•2.3.3 优化方法•2.3.4 实例:SVM分类器•2.4 图论基础•2.4.1 图的定义•2.4.2 图的概念•2.4.3 图的矩阵表示•2.4.4 拉普拉斯矩阵与谱•2.4.5 实例:谱聚类算法•2.5 小结•2.5.1 本章总结•2.5.2 扩展阅读材料•2.6 习题•2.7 参考资料••第3章 Python语言初步•3.1 Python语言概述•3.1.1 Python语言简介•3.1.2 Python语言环境搭建•3.2 Python的基本用法•3.2.1 列表与元组•3.2.2 字符串•3.2.3 字典•3.2.4 条件与循环语句•3.2.5 函数•3.2.6 文件•3.2.7 综合实例•3.3 重要库的使用方法与案例•3.3.1 NumPy•3.3.2 Pandas•3.3.3 SciPy•3.3.4 Matplotlib•……•第4章数据预处理•第5章分析方法初步•第6章数据科学实践•第7章数据科学的重要研究领域•第8章大数据处理技术简介。
数据科学-课程简介

《数据科学导论》课程简介
课程名称:数据科学导论
学分/学时:2/32—4/64
适用专业:数据科学与大数据技术、计算机科学与技术
先修课程:计算导论与程序设计、数据结构,计算机系统基础
内容提要:200-300字左右。
(中文宋体/五号,数字及英文Times New Roman/五号)
本课程是数据科学的通识入门课程,以“建立知识体系、掌握基本原理、学会初级实践、了解前沿技术”为原则,为学生深入学习数据科学和大数据技术奠定基础。
课程包含如下内容:(1)数据科学的基本概念和知识体系;(2)数据分析的基本流程和方法,包括数据预处理方法,数据智能分析技术,数据可视化;(3)大数据分析的基本方法和工具。
此外,本课程以Python语言为例,通过大量实例和实践讲授初级的数据分析技术。
本课程通过理论与实践相结合,树立学生的大数据意识、了解本学科的知识体系,掌握基本的数据分析方法。
——————————————————————————————————————————。
《数据科学导论》复习资料

《数据科学导论》复习资料本页仅作为文档封面,使用时可以删除This document is for reference only-rar21year.March《数据科学》课程期末复习资料《数据科学》课程讲稿章节目录:第一章导论第一节了解数据科学的基本概念第二节了解数据科学的应用第三节了解数据科学的过程第四节掌握数据科学的方法第二章数据获取及预处理第一节了解获取数据的途径和方法第二节掌握数据质量检验的方法第三节掌握数据清洗第四节掌握数据集成第五节掌握数据规约第六节掌握数据变换第三章数据分析第一节了解探索性数据分析的概念第二节掌握单变量分析方法第三节掌握多变量分析方法第四节掌握样本相似性与相异性分析的方法第四章特征工程第一节了解特征的介绍和创建过程第二节了解降维的基本概念第三节掌握主成分分析-PCA第四节掌握奇异值分解-SVD第五节了解特征选择的基本概念第六节掌握过滤式方法第七节了解产生特征子集的搜索策略第八节了解封装式方法第九节了解嵌入式方法第五章关联规则算法第一节了解关联规则的基本概念第二节掌握频繁项集的产生过程第三节掌握Apriori算法第六章分类算法第一节了解分类问题基本概念第二节掌握k近邻算法第三节了解贝叶斯定理第四节掌握朴素贝叶斯第五节了解决策树的基本概念第六节了解决策树-特征选择第七节了解决策树-剪枝算法第七章线性回归算法第一节了解线性回归的基本概念第二节掌握一元线性回归第三节掌握多元线性回归第八章人工神经网络第一节了解神经网络的基本概念第二节掌握感知机的学习算法第三节掌握多层感知机-反向传播算法第九章聚类算法第一节了解聚类问题的介绍第二节掌握层次聚类第三节掌握K-means聚类第四节了解BFR聚类一、客观部分:(单项选择、判断)(一)、选择部分1、通过构造新的指标-线损率,当超出线损率的正常范围,则可以判断这条线路的用户可能存在窃漏电等异常行为属于数据变换中的(C)A.简单函数变换B.规范化C.属性构造D.连续属性离散化★考核知识点: 数据变换参见讲稿章节:2-6附(考核知识点解释):数据变换是对数据进行规范化处理,将数据转换成“适当的”形式,更适用于任务及算法需要。
本科课程教学大纲《数据科学导论》

数据科学导论》教学大纲、课程及教师基本信息注1:平时考核(100%)=15%平时作业+15%projectl流数据处理/结构化数据分析+15%project2文本分析+15%project3图数据分析;2:平时考核应占总成绩的40-70%。
考核办法说明:本课程的考核分为三个方面,包括平时上机实践、3个大作业(即流数据处理/结构化数据分析、文本分析、图数据分析)和期末闭卷考试。
平时上机实践,学生必须完成上机练习题目,并提交上机实验报告;大作业锻炼学生综合运用所学知识、解决复杂问题的能力;期末考试考查学生对知识点的掌握和灵活运用能力。
最终成绩的计算按照平时成绩:大作业1:大作业2:大作业3:期末成绩=15:15:15:15:4的0比例产生。
二、任课教师简介三、课程简介课程简介“数据科学导论”是一门入门课程,同时也是“数据科学”课程群统领式的课程, 把学生引进数据科学的大门。
它的目标有两个:一个是扩展学生在数据科学方面的视野培养兴趣,另一个是为学习后续课程打下坚实的基础,培养数据科学家。
教学内容分为四大模块,分别是基础(base)模块、关系数据/流数据处理(relational&stream)模块、文本数据处理和分析(text)模块、图数据处理和分析(graph)模块。
基础模块为后续的3个实践模块的基础,内容包括:•概念:数据科学概论,主要介绍数据科学的基本概念、大数据及其价值、数据处理的全生命周期,包括数据的采集和获取、数据预处理/清洗和集成、数据管理、数据分析、可视化和解释等;•方法:包括各种数据模型、数据处理的不同模式(批处理和流式处理)、通用的数据分析方法、数据可视化等;•平台和工具:包括分布式计算与大数据平台(Hadoop&Spark)以及Python 语言。
其中Python语言部分,包括对Python语言基础以及Python的几个重要的库(数据预处理库pandas、机器学习库Scikit-Leam、可视化库Matplotlib)的介绍。
数据科学导论期末总结

数据科学导论期末总结数据科学是一门复杂而又多样化的学科,涉及到数据的收集、处理、分析和解释等多个方面。
这门课程对于我的学习和未来的职业发展具有重要的意义。
在这门课程中,我学到了很多有关数据科学的基础知识和技能,并且也对数据科学领域的发展趋势有了更深入的了解。
首先,我们学习了数据科学的基础概念和原理。
数据科学是一门跨学科的科学,它涉及到统计学、数学、计算机科学等多个领域。
我了解了数据科学的定义、目标和应用,并了解了数据科学家的角色和职责。
我也学习了数据科学方法论,包括数据收集、数据清洗、数据分析和可视化等方面的方法。
其次,我们学习了数据科学的编程技能。
数据科学涉及到大量的数据处理和分析工作,需要使用编程语言来完成这些任务。
在课程中,我们学习了Python编程语言和常用的数据科学库,如NumPy、Pandas和Matplotlib等。
我学会了使用Python进行数据处理、数据分析和数据可视化,并且掌握了一些高级的编程技巧和工具。
此外,我们还学习了统计学和机器学习的基本概念和方法。
数据科学是从数据中提取知识的科学,统计学和机器学习是数据科学的核心工具和方法。
在课程中,我们学习了统计学的基本知识,如概率、假设检验和回归分析等。
我们还学习了监督学习和无监督学习的基本概念和方法,并使用机器学习算法对实际数据进行建模和预测。
最后,我们还学习了数据科学的实践项目和案例。
在课程中,我们完成了几个数据科学的项目,从数据采集到数据分析再到结果解释,全面了解了数据科学的工作流程。
我们还学习了一些数据科学实践的案例和应用,如推荐系统、金融市场分析和社交网络分析等。
这些实践项目和案例不仅加强了我们的实际操作能力,还培养了我们解决实际问题的能力。
通过这门课程的学习,我对数据科学有了更深入的理解和认识。
数据科学是一个开放和快速发展的学科,具有广泛的应用领域和巨大的潜力。
数据科学不仅可以用于商业和科学研究,还可以用于社会问题的解决和决策的支持。
数据科学导论实验报告
数据科学导论实验报告实验报告:数据科学导论实验实验目的:本实验旨在运用数据科学的基本概念和技术,以及常用的数据科学工具,完成一个数据科学项目。
实验内容:本实验选择了一个具体的数据科学项目——房价预测。
通过分析房屋的各种特征,如面积、卧室数量、位置等,来预测房屋的售价。
1. 数据收集和观察:首先,从公开的数据源或其他渠道获取与房价相关的数据。
通过查看数据集的结构和内容,了解数据的基本信息。
2. 数据清洗和处理:对数据集进行预处理,包括处理缺失值、异常值、重复值等。
根据实际需求,可能还需要进行特征工程,提取和选择合适的特征。
3. 数据可视化和探索:通过绘制各种图表,如直方图、散点图等,来探索数据的分布和关系。
根据可视化的结果,了解数据的特点和规律。
4. 模型训练和评估:选择合适的算法模型,如线性回归、决策树等,对数据进行训练,并评估模型的性能。
可以使用交叉验证等方法,评估模型的泛化能力。
5. 模型调优和预测:根据模型评估的结果,对模型进行调优,如调整模型参数、尝试不同的特征组合等。
最终,使用优化后的模型,对新的数据进行预测。
实验结果:根据实验的具体情况和数据集的特点,得出房价预测的模型和结果。
通过对实验过程和结果的总结,深入理解数据科学的基本原理和方法,并掌握数据科学项目的基本流程和技巧。
实验总结:通过本实验,我对数据科学的基本概念和技术有了更深入的了解,并学会了如何运用数据科学的方法和工具来解决实际问题。
同时,我也发现了数据科学项目的一些挑战和注意事项,如数据质量、特征选择和模型的选择与调优等。
通过实践和总结,我相信我会在数据科学领域的学习和实践中不断进步。
- 1、下载文档前请自行甄别文档内容的完整性,平台不提供额外的编辑、内容补充、找答案等附加服务。
- 2、"仅部分预览"的文档,不可在线预览部分如存在完整性等问题,可反馈申请退款(可完整预览的文档不适用该条件!)。
- 3、如文档侵犯您的权益,请联系客服反馈,我们会尽快为您处理(人工客服工作时间:9:00-18:30)。
数据科学导论Introduction to Data Science 第四章数据挖掘基础10/21/20171An Introduction to Data Science 刘淇Email: qiliuql@课程主页:/~qiliuql/DS2017.html基本概念——数据挖掘是什么?现今与未来:Data is everything and everything is data 从最不可能的地方获得数据2人的坐姿千差万别,这是数据吗?怎么获得?日本先进工业技术研究所的教授越水重臣基本概念——数据挖掘是什么?现今与未来:Data is everything and everything is data当一个人坐着的时候,他的身形、姿势和重量分布都可以量化和数据化3在汽车座椅下部安装360个压力传感器测量人对椅子施加的压力,用0~256的数值量化•把人体屁股特征转化成了数据,产生独属于每个乘坐者的精确数据资料。
•汽车可以准确的识别乘坐者的身份:汽车防盗系统基本概念——数据挖掘是什么?数据挖掘:从大量的数据中挖掘哪些令人感兴趣的、有用的、隐含的、先前未知的和可能有用的模式或知识,并据此更好的服务人们的生活。
4基本概念——数据挖掘是什么?数据挖掘的近义词从数据中挖掘知识知识提炼数据/模式分析数据考古 数据捕捞、信息收获、资料勘探等。
数据中的知识发现(KDD :Knowledge Discovery in Data )5统计学数据库机器学习可视化高性能人工智能数据挖掘参考书数据挖掘导论(Pang-Ning Tan, Michael Steinbach, Vipin Kumar, Addison Wesley )6四个任务——数据挖掘有哪些任务?7DataClustering ClassificationAssociationAnalysisAnomalyDetection8四个任务——聚类(Clustering):铁路票价制定如何制定合适的票价提高上座率?将旅客进行聚类分析,根据旅客乘坐高铁频率的不同提供不同的优惠政策。
合适的定价是提高高铁上座率的保障。
Clustering四个任务——聚类(Clustering):Query clustering“USTC”, “中科大”,“中国科大”,“中国科学技术大学” “长城”,“颐和园”,“故宫”9长城汽车?万里长城?搜索情境颐和园理解当前搜索意图10四个任务——Association Rule(关联规则)“啤酒与尿布”在一次圣诞节的顾客消费行为分析中,沃尔玛意外发现跟尿布一起购买最多的商品竟然是啤酒。
经过深入分析后,卖场立即对两类商品的空间距离与价格都进行了调整,结果尿布与啤酒销量双双大增。
萨姆·沃尔顿,沃尔玛公司创始人轰动一时的啤酒与尿布关联规则11四个任务——Association Rule(关联规则)四个任务——Association Rule (关联规则)向林彪同志学习数据挖掘:不打无把握之仗找到最有价值用户,俘获“廖耀湘”类的VIP1948年10月东北野战军先克锦州再战辽西一个普通战报的数据引起林彪注意–胡家窝棚“为什么那里缴获的短枪与长枪的比例比其它战斗略高?”“为什么那里缴获和击毁的小车与大车的比例比其它战斗略高?”“为什么在那里俘虏和击毙的军官与士兵的比例比其它战斗略高?”12短枪小车军官13四个任务Find a model for class attribute as a function of the values of other attributes四个任务——Predictive Modeling: Classification(分类)Predicting tumor cells as benign or malignant(良性还是恶性) 邮件分类(垃圾邮件)Classifying credit card transactions as legitimate or fraudulent (欺诈)Classifying secondary structures of protein as alpha-helix, beta-sheet, or random coilCategorizing news stories as finance, weather, entertainment, sports, etcIdentifying intruders in the cyberspace1415四个任务——Anomaly Detection(异常检测)Detect significant deviations from normal behaviorApplications: ArrayCredit Card Fraud DetectionNetwork Intrusion Detection16四个任务——Anomaly Detection(异常检测)电力行业--盗电检测由于盗电用户行为特征与普通用户不同(电费与人员、产值、税收等形成反差),通过对用户用电数据的聚类分析,反窃电的业务人员就能对锁定的目标重点侦察,既能提高窃电客户的识别率,还能节省电力部门人力资源,为反窃电提供了另一种思路。
箭头所示样本点即为可能的盗电用户常用方法——关于四个任务有哪些常用方法?17DataClustering ClassificationAssociationAnalysisAnomalyDetection18分类分类的直观解释---买芒果19颜色 大小 重量 形状 产地… …数据特征 甜度 汁水 成熟度 … …指标(标签)分类模型测试集不甜 汁水多 成熟… …预测指标数据建模预测数据样本训练集20判断西瓜是否熟了21建立分类模型的一般流程模型训练过程LearnModel22建立分类模型的一般流程测试LearnModel23分类模型的评价24分类模型的评价25常用方法——分类基本分类决策树规则方法贝叶斯方法最近邻方法支持向量机(SVM)神经网络集成分类Boosting, Bagging, 随机森林模型评估方法Class Imbalance Problem(类不平衡问题)26分类27Home OwnerMarStIncomeYESNO NONOYesNoMarried Single, Divorced< 80K> 80K分类——决策树28分类决策树29Apply Learn Model30决策树31决策树32决策树33决策树34决策树35决策树36决策树LearnModel37决策树Let Dt be the set of training records38决策树初始节点包含所有的数据样本,39决策树——如何决策?训练记录如何分裂?选择测试条件的方法依赖属性类型评价测试条件分裂过程何时停止?停止分类如果所有记录属于同一类或者所有数据有相同的属性值提前终止40决策树Multi-way split:41决策树42决策树决策树——连续属性的分裂不同处理方式离散化地处理有序的分类属性Static (静态)–discretize once at the beginning Dynamic (动态)–ranges can be found by equal interval bucketing, equal frequency bucketing (percentiles), or clustering. (二值划分)Binary Decision: (A < v) or (A v)consider all possible splits and finds the best cut (考虑所有情况,找出最好的划分)can be more compute-intensive 4344决策树Before Splitting: 10 records of class 0,Which test condition is the best?45决策树贪心(决策树——不纯性程度计算Gini Index (基尼指数) Entropy (熵) Misclassification error 46 jt j p t GINI 2)]|([1)( j t j p t j p t Entropy )|(log )|()()|(max 1)(t i P t Error i决策树——找到最好的分裂分裂前计算不纯性(P) 分裂后计算不纯性(M)Compute impurity measure of each child node Compute the average impurity of the children (M) 选择能获得最高增益的属性作为测试条件或者是分裂后最小的不纯性(M) 47Gain = P –M48决策树——找到最好的分裂49决策树Gini Index for a given node t :50决策树。