各类图表英文描述
图表的英文描述

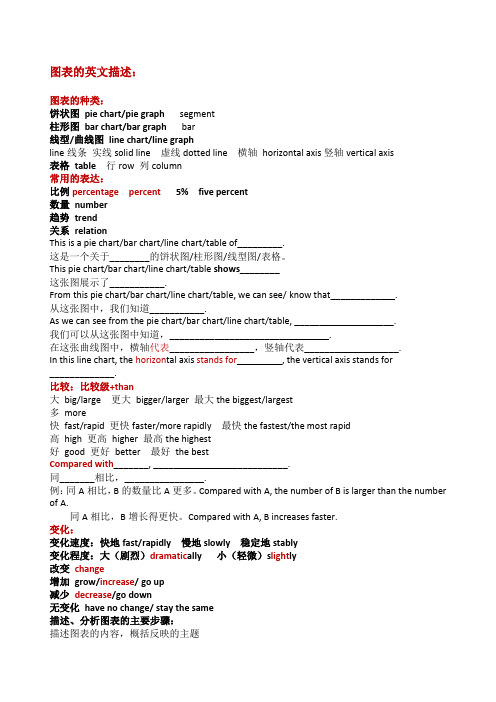
图表的英文描述:图表的种类:饼状图 pie chart/pie graph segment柱形图 bar chart/bar graph bar线型/曲线图 line chart/line graphline线条实线solid line 虚线dotted line 横轴 horizontal axis竖轴vertical axis表格 table行row 列column常用的表达:比例percentage percent 5% five percent数量 number趋势 trend关系 relationThis is a pie chart/bar chart/line chart/table of_________.这是一个关于________的饼状图/柱形图/线型图/表格;This pie chart/bar chart/line chart/table shows________这张图展示了___________.From this pie chart/bar chart/line chart/table, we can see/ know that_____________.从这张图中,我们知道___________.As we can see from the pie chart/bar chart/line chart/table, ____________________.我们可以从这张图中知道,________________________________.在这张曲线图中,横轴代表_________________,竖轴代表___________________. In this line chart, the horizon tal axis stands for_________, the vertical axis stands for _____________.比较:比较级+than大 big/large 更大 bigger/larger 最大the biggest/largest多 more快 fast/rapid 更快faster/more rapidly 最快the fastest/the most rapid 高 high 更高 higher 最高the highest好 good 更好 better 最好 the bestCompared with_______, ___________________________.同_______相比,________________.例:同A相比,B的数量比A更多;Compared with A, the number of B is larger than the number of A.同A相比,B增长得更快;Compared with A, B increases faster.变化:变化速度:快地fast/rapidly 慢地slowly 稳定地stably变化程度:大剧烈dramatic ally 小轻微s light ly改变change增加 grow/increase/ go up减少decrease/go down无变化 have no change/ stay the same描述、分析图表的主要步骤:描述图表的内容,概括反映的主题分析产生的原因The reason of this is...../ i think it is because.... 提出方法或建议My advice is....season季节This is a graph about....From the graph, we can see..... 内容... I think it is because.... my advice is....The highest 最高The lowest 最低The fastest 最快The slowest 最慢Peak 高峰 n.The most/ the number is the highest 最多the least/The number is the lowest 最少与...比较 compared with...We have service for our customers.Product 产品 we have products for our customers.Service n.Serve vt.We serve everyone.。
各种图表的英文表达
1.Map(地图、天体图、布局图、专用图、图谱)Battle map 作战地图Highway map 公路图Genetic map 基因图谱2.Figure(图形、平面图)Geometric(al) figure 几何图形Dimension figure 尺寸图Plane figure 平面图3.Pattern(图案、图型、图样)Checkboard pattern 棋盘型图案Recording pattern 录像图型Circular pattern 圆形图样4.Sketch(草图、略图、简图)Eye sketch 目测草图Topographic sketch 地形略图Dimensional sketch 尺寸简图5.Scheme/shematic(图解、示意图、流程图、电路图)Flow scheme 流程图Induction scheme 感应电路图6.Draft(草图)Chisel draft 雕刻前在石头上画出边缘轮廓草图7.Curve(曲线图表)Algebraic curve 代数曲线Comfort curve 湿度舒适曲线8.Graph(曲线图表)Funtional graph 函数图(亦称plot)Bar graph 条形图(也称chart)9.View(视图)Plane view 平面视图10.Geometry(几何图)Plane geometry 平面几何Solid geometry 立体几何图11.Chart(航海图、图表)Aeronautical chart 领航图Demographic data chart 人口统计图表Pie chart 饼图Bar chart 柱图12.Drawing(工程图、插图)Drawing 建筑图Explanatory drawing 说明(插)图yout(布局图、规划图)。
如何用英文分析各种图表

Frankly speaking, the user of the fixed telephone is decreasing. On contrast, the user of mobile phone is creasing .It shows that the devolpment of our country and the addition of our income. At the same time, it makes our life more convenient.
This is a pie diagram about ”Typical Lone Noble Spending Proportion”, one of the largest proportion is “Personal life basic expenses “ which reached 40 percent ,when ” Housing “ account for 30 percent , ” Other Expenses “ take up 20 percent and ”Savings and Investment “ and “Support Their Parents” each only account for five percent .To our surprise , children education expenses is zero .
The common used phrase in graph analysis
• • • • • • • • • • As we can see from the graph/charts As is indicated in the bar chart/diagram Generally speaking A much higher percentage Take up a much larger percentage in Show a trend of Reveal a trend of dramatic increase Have a significant impact on Much better than that of Cover a much wider range of
如何用英语描述图表
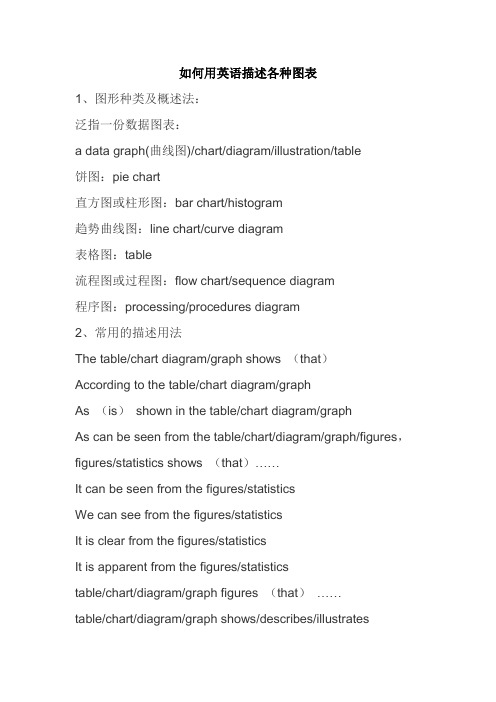
1、图形种类及概述法:泛指一份数据图表:a data graph(曲线图)/chart/diagram/illustration/table饼图:pie chart直方图或柱形图:bar chart/histogram趋势曲线图:line chart/curve diagram表格图:table流程图或过程图:flow chart/sequence diagram程序图:processing/procedures diagram2、常用的描述用法The table/chart diagram/graph shows (that)According to the table/chart diagram/graphAs (is) shown in the table/chart diagram/graphAs can be seen from the table/chart/diagram/graph/figures,figures/statistics shows (that)……It can be seen from the figures/statisticsWe can see from the figures/statisticsIt is clear from the figures/statisticsIt is apparent from the figures/statisticstable/chart/diagram/graph figures (that)……table/chart/diagram/graph shows/describes/illustrates 3、图表中的数据(Data)具体表达法数据(Data)在某一个时间段固定不变:fixed in time在一系列的时间段中转变:changes over time持续变化的data在不同情况下:增加:increase/raise/rise/go up ……减少:decrease/grow down/drop/fall ……波动:fluctuate/rebound/undulate/wave ……稳定:remain stable/stabilize/level off ……二、相关常用词组1、主章开头图表类型:table(表格)、chart(图表)、diagram(图标)、graph(多指曲线图)、column chart(柱状图)、pie graph(饼图)、tree diagram(树形图)描述:show、describe、illustrate、can be seen from、clear、apparent、reveal、represent内容:figure、statistic、number、percentage、proportion2、表示数据变化的单词或者词组rapid/rapidly 迅速的,飞快的,险峻的dramatic/dramatically 戏剧性的,生动的significant/significantly 有意义的,重大的,重要的sharp/sharply 锐利的,明显的,急剧的steep/steeply 急剧升降的steady/steadily 稳固的,坚定不移的gradual/gradually 渐进的,逐渐的slow/slowly 缓慢的,不活跃的slight/slightly 稍微的、略微地stable/stably 稳定的3、其它在描述中的常用到的词significant changes 图中一些较大变化noticeable trend 明显趋势during the same period 在同一时期grow/grew 增长distribute 分布unequally 不相等地in the case of 在……的情况下in terms of/in respect of/regarding 在……方面in contrast 相反,大不相同government policy 政府政策market forces 市场力量measuren n.尺寸,方法,措施v.估量,调节forecast n.先见,预见v.猜测三、图表描述套句精选1.the table shows the changes in the number of……over the period from……to……该表格描述了在……年之……年间……数量的变化。
如何用英文分析各种图表【精选】
小组成员: 刘颖 蒋媛媛 李彩云 何欢欢
无变化(No change) • To remain constant/stable • To stay the same/ at the same level • To maintain/hold/keep
变化的程度(Degree of change) • Dramatically/considerably/significantly/
children education expenses is zero .
From those data we can learn that most single noble don’t develop an healthy spending habits , what they care is how to enjoy themselves ,but almost forget to care their parents.What’s more ,they even have no idea about their future ,their kids .Though they are single ,It is important to learn financial management.
From the graph, we can see the number of phone subscribers from 2006 to 2011.In 2011, the year also saw 285.12 million fixed telephone subscribers, the number is 22.5% lower than that in 2006. Mobile phone users numbered 986.25 million by the end of 2011, with 127.25 million new subscribers in the year. In total, the number of fixed and mobile phone users reached 1,271.37 million, an increase of 118.02 million as compared with that at the end of 2010. Phone coverage is 94.9 sets per 100 persons.
各类图表英文描述

各类图表英文描述1.Map(地图、天体图、布局图、专用图、图谱)Battle map 作战地图Highway map 公路图Genetic map 基因图谱2.Figure(图形、平面图)Geometric(al) figure 几何图形Dimension figure 尺寸图Plane figure 平面图3.Pattern(图案、图型、图样)Checkboard pattern 棋盘型图案Recording pattern 录像图型Circular pattern 圆形图样4.Sketch(草图、略图、简图)Eye sketch 目测草图Topographic sketch 地形略图Dimensional sketch 尺寸简图5.Scheme/shematic(图解、示意图、流程图、电路图)Flow scheme 流程图Induction scheme 感应电路图6.Draft(草图)Chisel draft 雕刻前在石头上画出边缘轮廓草图7.Curve(曲线图表)Algebraic curve 代数曲线Comfort curve 湿度舒适曲线8.Graph(曲线图表)Funtional graph 函数图(亦称plot)Bar graph 条形图(也称chart)9.View(视图)Plane view 平面视图10.Geometry(几何图)Plane geometry 平面几何Solid geometry 立体几何图11.Chart(航海图、图表)Aeronautical chart 领航图Demographic data chart 人口统计图表Pie chart 饼图Bar chart 柱图12.Drawing(工程图、插图)Drawing 建筑图Explanatory drawing 说明(插)图/doc/ec18558506.html,yout(布局图、规划图)1、图形种类及概述法:泛指一份数据图表:a data graph(曲线图)/chart/diagram/illustration/table饼图:pie chart直方图或柱形图:bar chart/histogram趋势曲线图:line chart/curve diagram表格图:table流程图或过程图:flow chart/sequence diagram程序图:processing/procedures diagram2、常用的描述用法The table/chart diagram/graph shows (that)According to the table/chart diagram/graphAs (is)shown in the table/chart diagram/graphAs can be seen from the table/chart/diagram/graph/figures,figures/statistics shows (that)……It can be seen from the figures/statisticsWe can see from the figures/statisticsIt is clear from the figures/statisticsIt is apparent from the figures/statisticstable/chart/diagram/graph figures (that)……table/chart/diagram/graph shows/describes/illustrates3、图表中的数据(Data)具体表达法数据(Data)在某一个时间段固定不变:fixed in time在一系列的时间段中转变:changes over time持续变化的data在不同情况下:增加:increase/raise/rise/go up ……减少:decrease/grow down/drop/fall ……波动:fluctuate/rebound/undulate/wave ……稳定:remain stable/stabilize/level off ……二、相关常用词组1、主章开头图表类型:table(表格)、chart(图表)、diagram(图标)、graph (多指曲线图)、column chart(柱状图)、pie graph(饼图)、tree diagram(树形图)描述:show、describe、illustrate、can be seen from、clear、apparent、reveal、represent内容:figure、statistic、number、percentage、proportion 2、表示数据变化的单词或者词组rapid/rapidly 迅速的,飞快的,险峻的dramatic/dramatically 戏剧性的,生动的significant/significantly 有意义的,重大的,重要的sharp/sharply 锐利的,明显的,急剧的steep/steeply 急剧升降的steady/steadily 稳固的,坚定不移的gradual/gradually 渐进的,逐渐的。
如何用英语描述各种图表

如何用英语描述各种图表1、图形种类及概述法:泛指一份数据图表:a data graph(曲线图)/chart/diagram/illustration/table饼图:pie chart直方图或柱形图:bar chart/histogram趋势曲线图:line chart/curve diagram表格图:table流程图或过程图:flow chart/sequence diagram程序图:processing/procedures diagram2、常用的描述用法The table/chart diagram/graph shows (that)According to the table/chart diagram/graphAs (is)shown in the table/chart diagram/graphAs can be seen from the table/chart/diagram/graph/figures,figures/statistics shows (that)……It can be seen from the figures/statisticsWe can see from the figures/statisticsIt is clear from the figures/statisticsIt is apparent from the figures/statisticstable/chart/diagram/graph figures (that)……table/chart/diagram/graph shows/describes/illustrates3、图表中的数据(Data)具体表达法数据(Data)在某一个时间段固定不变:fixed in time在一系列的时间段中转变:changes over time持续变化的data在不同情况下:增加:increase/raise/rise/go up ……减少:decrease/grow down/drop/fall ……波动:fluctuate/rebound/undulate/wave ……稳定:remain stable/stabilize/level off ……二、相关常用词组1、主章开头图表类型:table(表格)、chart(图表)、diagram(图标)、graph(多指曲线图)、column chart(柱状图)、pie graph(饼图)、tree diagram(树形图)描述:show、describe、illustrate、can be seen from、clear、apparent、reveal、represent内容:figure、statistic、number、percentage、proportion2、表示数据变化的单词或者词组rapid/rapidly 迅速的,飞快的,险峻的dramatic/dramatically 戏剧性的,生动的significant/significantly 有意义的,重大的,重要的sharp/sharply 锐利的,明显的,急剧的steep/steeply 急剧升降的steady/steadily 稳固的,坚定不移的gradual/gradually 渐进的,逐渐的slow/slowly 缓慢的,不活跃的slight/slightly 稍微的、略微地stable/stably 稳定的3、其它在描述中的常用到的词significant changes 图中一些较大变化noticeable trend 明显趋势during the same period 在同一时期grow/grew 增长distribute 分布unequally 不相等地in the case of 在……的情况下in terms of/in respect of/regarding 在……方面in contrast 相反,大不相同government policy 政府政策market forces 市场力量measuren n.尺寸,方法,措施v.估量,调节forecast n.先见,预见v.猜测三、图表描述套句精选1.the table shows the changes in the number of……over the period from……to……该表格描述了在……年之……年间……数量的变化。
各类图表英文描述
:(地图、天体图、布局图、专用图、图谱)Battle map 作战地图Highway map 公路图Genetic map 基因图谱(图形、平面图)Geometric(al) figure 几何图形Dimension figure 尺寸图Plane figure 平面图)(图案、图型、图样)Checkboard pattern 棋盘型图案Recording pattern 录像图型Circular pattern 圆形图样(草图、略图、简图)Eye sketch 目测草图Topographic sketch 地形略图Dimensional sketch 尺寸简图&shematic(图解、示意图、流程图、电路图)Flow scheme 流程图Induction scheme 感应电路图(草图)Chisel draft 雕刻前在石头上画出边缘轮廓草图(曲线图表)Algebraic curve 代数曲线Comfort curve 湿度舒适曲线《(曲线图表)Funtional graph 函数图(亦称plot)Bar graph 条形图(也称chart)(视图)Plane view 平面视图(几何图)Plane geometry 平面几何Solid geometry 立体几何图<(航海图、图表)Aeronautical chart 领航图Demographic data chart 人口统计图表Pie chart 饼图Bar chart 柱图(工程图、插图)Drawing 建筑图Explanatory drawing 说明(插)图*(布局图、规划图)1、图形种类及概述法:泛指一份数据图表:a data graph(曲线图)/chart/diagram/illustration/table饼图:pie chart直方图或柱形图:bar chart/histogram趋势曲线图:line chart/curve diagram、表格图:table流程图或过程图:flow chart/sequence diagram程序图:processing/procedures diagram2、常用的描述用法The table/chart diagram/graph shows (that)According to the table/chart diagram/graphAs (is) shown in the table/chart diagram/graphAs can be seen from the table/chart/diagram/graph/figures,;figures/statistics shows (that)……It can be seen from the figures/statisticsWe can see from the figures/statisticsIt is clear from the figures/statisticsIt is apparent from the figures/statisticstable/chart/diagram/graph figures (that)……table/chart/diagram/graph shows/describes/illustrates3、图表中的数据(Data)具体表达法《数据(Data)在某一个时间段固定不变:fixed in time在一系列的时间段中转变:changes over time持续变化的data在不同情况下:增加:increase/raise/rise/go up ……减少:decrease/grow down/drop/fall ……波动:fluctuate/rebound/undulate/wave ……稳定:remain stable/stabilize/level off ……}二、相关常用词组1、主章开头图表类型:table(表格)、chart(图表)、diagram(图标)、graph(多指曲线图)、column chart(柱状图)、pie graph(饼图)、tree diagram(树形图)描述:show、describe、illustrate、can be seen from、clear、apparent、reveal、represent 内容:figure、statistic、number、percentage、proportion2、表示数据变化的单词或者词组rapid/rapidly 迅速的,飞快的,险峻的dramatic/dramatically 戏剧性的,生动的/significant/significantly 有意义的,重大的,重要的sharp/sharply 锐利的,明显的,急剧的steep/steeply 急剧升降的steady/steadily 稳固的,坚定不移的gradual/gradually 渐进的,逐渐的slow/slowly 缓慢的,不活跃的slight/slightly 稍微的、略微地stable/stably 稳定的,3、其它在描述中的常用到的词significant changes 图中一些较大变化noticeable trend 明显趋势during the same period 在同一时期grow/grew 增长distribute 分布unequally 不相等地in the case of 在……的情况下【in terms of/in respect of/regarding 在……方面in contrast 相反,大不相同government policy 政府政策market forces 市场力量measuren n.尺寸,方法,措施v.估量,调节forecast n.先见,预见v.猜测?三、图表描述套句精选table shows the changes in the number of……over the period from……to……该表格描述了在……年之……年间……数量的变化。
图表的英文描述

图表的英文描述Document number:NOCG-YUNOO-BUYTT-UU986-1986UT图表的英文描述:图表的种类:饼状图 pie chart/pie graph segment柱形图 bar chart/bar graph bar线型/曲线图 line chart/line graphline线条实线solid line 虚线dotted line 横轴 horizontal axis竖轴vertical axis表格 table行row 列column常用的表达:比例percentage percent 5% five percent数量 number趋势 trend关系 relationThis is a pie chart/bar chart/line chart/table of_________.这是一个关于________的饼状图/柱形图/线型图/表格。
This pie chart/bar chart/line chart/table shows________这张图展示了___________.From this pie chart/bar chart/line chart/table, we can see/ know that_____________.从这张图中,我们知道___________.As we can see from the pie chart/bar chart/line chart/table, ____________________.我们可以从这张图中知道,________________________________.在这张曲线图中,横轴代表_________________,竖轴代表___________________.In this line chart, the horizon tal axis stands for_________, the vertical axis stands for _____________. 比较:比较级+than大 big/large 更大 bigger/larger 最大the biggest/largest多 more快 fast/rapid 更快faster/more rapidly 最快the fastest/the most rapid高 high 更高 higher 最高the highest好 good 更好 better 最好 the bestCompared with_______, ___________________________.同_______相比,________________.例:同A相比,B的数量比A更多。
用英语描述图表之欧阳文创编

如何用英语描述各种图表1、图形种类及概述法:泛指一份数据图表:a data graph(曲线图)/chart/diagram/illustration/table饼图:pie chart直方图或柱形图:bar chart/histogram趋势曲线图:line chart/curve diagram表格图:table流程图或过程图:flow chart/sequence diagram程序图:processing/procedures diagram2、常用的描述用法The table/chart diagram/graph shows (that)According to the table/chart diagram/graphAs (is) shown in the table/chart diagram/graph As can be seen from thetable/chart/diagram/graph/figures,figures/statistics shows (that)……It can be seen from the figures/statisticsWe can see from the figures/statisticsIt is clear from the figures/statisticsIt is apparent from the figures/statisticstable/chart/diagram/graph figures (that)……table/chart/diagram/graphshows/describes/illustrates3、图表中的数据(Data)具体表达法数据(Data)在某一个时间段固定不变:fixed in time 在一系列的时间段中转变:changes over time持续变化的data在不同情况下:增加:increase/raise/rise/go up ……减少:decrease/grow down/drop/fall ……波动:fluctuate/rebound/undulate/wave ……稳定:remain stable/stabilize/level off ……二、相关常用词组1、主章开头图表类型:table(表格)、chart(图表)、diagram(图标)、graph(多指曲线图)、column chart(柱状图)、pie graph(饼图)、tree diagram(树形图)描述:show、describe、illustrate、can be seen from、clear、apparent、reveal、represent内容:figure、statistic、number、percentage、proportion2、表示数据变化的单词或者词组rapid/rapidly 迅速的,飞快的,险峻的dramatic/dramatically 戏剧性的,生动的significant/significantly 有意义的,重大的,重要的sharp/sharply 锐利的,明显的,急剧的steep/steeply 急剧升降的steady/steadily 稳固的,坚定不移的gradual/gradually 渐进的,逐渐的slow/slowly 缓慢的,不活跃的slight/slightly 稍微的、略微地stable/stably 稳定的3、其它在描述中的常用到的词significant changes 图中一些较大变化noticeable trend 明显趋势during the same period 在同一时期grow/grew 增长distribute 分布unequally 不相等地in the case of 在……的情况下in terms of/in respect of/regarding 在……方面in contrast 相反,大不相同government policy 政府政策market forces 市场力量measuren n.尺寸,方法,措施v.估量,调节forecast n.先见,预见v.猜测三、图表描述套句精选1.the table shows the changes in the number of……over the period from……to……该表格描述了在……年之……年间……数量的变化。
如何用英语描述图表范文
如何用英语描述图表2.the bar chart illustrates that……该柱状图展示了……3.the graph provides some interesting data regarding……该图为我们提供了有关……有趣数据。
4.the diagram shows (that)……该图向我们展示了……5.the pie graph depicts (that)……该圆形图揭示了……6.this is a cure graph which describes the trend of……这个曲线图描述了……的趋势。
18.the graph,presented in a pie chart,shows the general trend in……该图以圆形图形式描述了……总的趋势。
19.this is a column chart showing……这是个柱型图,描述了……20.as can be seen from the graph,the two curves show the flutuation of……如图所示,两条曲线描述了……的波动情况。
……月(年)至……月(年)……的数量基本不变。
26.the number sharply went up to……数字急剧上升至……27.the percentage of……stayed the same between……and…………至……期间……的。
如何用英语描述图表2.the bar chart illustrates that……该柱状图展示了……3.the graph provides some interesting data regarding……该图为我们提供了有关……有趣数据。
4.the diagram shows (that)……该图向我们展示了……5.the pie graph depicts (that)……该圆形图揭示了……6.this is a cure graph which describes the trend of……这个曲线图描述了……的趋势。
如何用英语描述图表

1、图形种类及概述法:泛指一份数据图表:a data graph(曲线图)/chart/diagram/illustration/table饼图:pie chart直方图或柱形图:bar chart/histogram趋势曲线图:line chart/curve diagram表格图:table流程图或过程图:flow chart/sequence diagram程序图:processing/procedures diagram2、常用的描述用法The table/chart diagram/graph shows (that)According to the table/chart diagram/graphAs (is) shown in the table/chart diagram/graphAs can be seen from the table/chart/diagram/graph/figures,figures/statistics shows (that)……It can be seen from the figures/statisticsWe can see from the figures/statisticsIt is clear from the figures/statisticsIt is apparent from the figures/statisticstable/chart/diagram/graph figures (that)……table/chart/diagram/graph shows/describes/illustrates 3、图表中的数据(Data)具体表达法数据(Data)在某一个时间段固定不变:fixed in time在一系列的时间段中转变:changes over time持续变化的data在不同情况下:增加:increase/raise/rise/go up ……减少:decrease/grow down/drop/fall ……波动:fluctuate/rebound/undulate/wave ……稳定:remain stable/stabilize/level off ……二、相关常用词组1、主章开头图表类型:table(表格)、chart(图表)、diagram(图标)、graph(多指曲线图)、column chart(柱状图)、pie graph(饼图)、tree diagram(树形图)描述:show、describe、illustrate、can be seen from、clear、apparent、reveal、represent内容:figure、statistic、number、percentage、proportion2、表示数据变化的单词或者词组rapid/rapidly 迅速的,飞快的,险峻的dramatic/dramatically 戏剧性的,生动的significant/significantly 有意义的,重大的,重要的sharp/sharply 锐利的,明显的,急剧的steep/steeply 急剧升降的steady/steadily 稳固的,坚定不移的gradual/gradually 渐进的,逐渐的slow/slowly 缓慢的,不活跃的slight/slightly 稍微的、略微地stable/stably 稳定的3、其它在描述中的常用到的词significant changes 图中一些较大变化noticeable trend 明显趋势during the same period 在同一时期grow/grew 增长distribute 分布unequally 不相等地in the case of 在……的情况下in terms of/in respect of/regarding 在……方面in contrast 相反,大不相同government policy 政府政策market forces 市场力量measuren n.尺寸,方法,措施v.估量,调节forecast n.先见,预见v.猜测三、图表描述套句精选1.the table shows the changes in the number of……over the period from……to……该表格描述了在……年之……年间……数量的变化。
图表的英文描述
图表的英文描述:图表的种类:饼状图pie chart/pie graph segment柱形图bar chart/bar graph bar线型/曲线图line chart/line graphline线条实线solid line 虚线dotted line 横轴horizontal axis竖轴vertical axis表格table行row 列column常用的表达:比例percentage percent5% five percent数量number趋势trend关系relationThis is a pie chart/bar chart/line chart/table of_________.这是一个关于________的饼状图/柱形图/线型图/表格。
This pie chart/bar chart/line chart/table shows________这张图展示了___________.From this pie chart/bar chart/line chart/table, we can see/ know that_____________.从这张图中,我们知道___________.As we can see from the pie chart/bar chart/line chart/table, ____________________.我们可以从这张图中知道,________________________________.在这张曲线图中,横轴代表_________________,竖轴代表___________________.In this line chart, the horizon tal axis stands for_________, the vertical axis stands for_____________.比较:比较级+than大big/large 更大bigger/larger 最大the biggest/largest多more快fast/rapid 更快faster/more rapidly 最快the fastest/the most rapid高high 更高higher 最高the highest好good 更好better 最好the bestCompared with_______, ___________________________.同_______相比,________________.例:同A相比,B的数量比A更多。
考研如何用英语描述各种图表
如何用英语描述各种图表1、图形种类及概述法:泛指一份数据图表:a data graph(曲线图)/chart/diagram/illustration/table饼图:pie chart直方图或柱形图:bar chart/histogram趋势曲线图:line chart/curve diagram表格图:table流程图或过程图:flow chart/sequence diagram程序图:processing/procedures diagram2、常用的描述用法The table/chart diagram/graph shows (that)According to the table/chart diagram/graphAs (is)shown in the table/chart diagram/graphAs can be seen from the table/chart/diagram/graph/figures,figures/statistics shows (that)……It can be seen from the figures/statisticsWe can see from the figures/statisticsIt is clear from the figures/statisticsIt is apparent from the figures/statisticstable/chart/diagram/graph figures (that)……table/chart/diagram/graph shows/describes/illustrates3、图表中的数据(Data)具体表达法数据(Data)在某一个时间段固定不变:fixed in time在一系列的时间段中转变:changes over time持续变化的data在不同情况下:增加:increase/raise/rise/go up ……减少:decrease/grow down/drop/fall ……波动:fluctuate/rebound/undulate/wave ……稳定:remain stable/stabilize/level off ……二、相关常用词组1、主章开头图表类型:table(表格)、chart(图表)、diagram(图标)、graph(多指曲线图)、column chart(柱状图)、pie graph(饼图)、tree diagram(树形图)描述:show、describe、illustrate、can be seen from、clear、apparent、reveal、represent内容:figure、statistic、number、percentage、proportion2、表示数据变化的单词或者词组rapid/rapidly 迅速的,飞快的,险峻的dramatic/dramatically 戏剧性的,生动的significant/significantly 有意义的,重大的,重要的sharp/sharply 锐利的,明显的,急剧的steep/steeply 急剧升降的steady/steadily 稳固的,坚定不移的gradual/gradually 渐进的,逐渐的slow/slowly 缓慢的,不活跃的slight/slightly 稍微的、略微地stable/stably 稳定的3、其它在描述中的常用到的词significant changes 图中一些较大变化noticeable trend 明显趋势during the same period 在同一时期grow/grew 增长distribute 分布unequally 不相等地in the case of 在……的情况下in terms of/in respect of/regarding 在……方面in contrast 相反,大不相同government policy 政府政策market forces 市场力量measure n.尺寸,方法,措施v.估量,调节measure英[ˈmeʒə(r)]美[ˈmɛʒɚ]n.措施; 测量,测度; 程度; 尺寸;vt.测量; 估量;vi.测量; 测量(大小,容量,尺寸等);[例句]I continued to measure his progress against the charts in the doctor's office我继续比照医生办公室里的图表来判断他病情的发展。
图表描述词汇

图标描述资料1.各种图表的名称(Types of chart)饼状图(Pie chart):饼状图内部分成一块一块,用于表示所占分量,那一块一块就叫"segment"。
线形图(Line graph):柱状图(Bar chart):每一个矩形就叫一个bar表格(Table):表的“行”是“row”,“列”是“column”流程图(Flow chart)组织结构图(organigram)2.描述变化时(Describing Change)(1)向上的趋势(Upward movement):To increase/rise/go upTo grow/expandTo rocket/boom/soare.g. We increased sales。
We expanded our workforce。
We raised our prices。
(注意:Raise是及物动词)(2)向下的趋势(Downward movement)To decrease/fall/drop/decline/go downTo slump/collapse/plummet/crash注意:decrease和drop是及物动词(3)不再变动(an end to movement)To flatten out/ level off(4)无变化(No change)To remain constant/stableTo stay the same/ at the same levelTo maintain/hold/keepe.g. We need to hold our costs down。
我们需要保持低成本3.变化的程度(Degree of change)Dramatically/considerably/significantly/moderately/slightlye.g. Sales have fallen considerably。
如何用英文分析各种图表
From the graph, we can see the number of phone subscribers from 2006 to 2011.In 2011, the year also saw 285.12 million fixed telephone subscribers, the number is 22.5% lower than that in 2006. Mobile phone users numbered 986.25 million by the end of 2011, with 127.25 million new subscribers in the year. In total, the number of fixed and mobile phone users reached 1,271.37 million, an increase of 118.02 million as compared with that at the end of 2010. Phone coverage is 94.9 sets per 100 persons.
变化的程度(Degree of change)
• Dramatically/considerably/significantly/ moderately/slightly 变化速度(Speed of change)
• Rapidly/quickly/suddenly/gradually/stea dily/slowly
不再变动(an end to movement) • To flatten out/ level off 无变化(No change) • To remain constant/stable • To stay the same/ at the same level • To maintain/hold/keep
图表描述词汇

图标描述资料1.各种图表的名称(Types of chart)饼状图(Pie chart):饼状图内部分成一块一块,用于表示所占分量,那一块一块就叫"segment"。
线形图(Line graph):柱状图(Bar chart):每一个矩形就叫一个bar表格(Table):表的“行”是“row”,“列”是“column”流程图(Flow chart)组织结构图(organigram)2.描述变化时(Describing Change)(1)向上的趋势(Upward movement):To increase/rise/go upTo grow/expandTo rocket/boom/soare.g. We increased sales。
We expanded our workforce。
We raised our prices。
(注意:Raise是及物动词)(2)向下的趋势(Downward movement)To decrease/fall/drop/decline/go downTo slump/collapse/plummet/crash注意:decrease和drop是及物动词(3)不再变动(an end to movement)To flatten out/ level off(4)无变化(No change)To remain constant/stableTo stay the same/ at the same levelTo maintain/hold/keepe.g. We need to hold our costs down。
我们需要保持低成本3.变化的程度(Degree of change)Dramatically/considerably/significantly/moderately/slightlye.g. Sales have fallen considerably。
- 1、下载文档前请自行甄别文档内容的完整性,平台不提供额外的编辑、内容补充、找答案等附加服务。
- 2、"仅部分预览"的文档,不可在线预览部分如存在完整性等问题,可反馈申请退款(可完整预览的文档不适用该条件!)。
- 3、如文档侵犯您的权益,请联系客服反馈,我们会尽快为您处理(人工客服工作时间:9:00-18:30)。
1.Map(地图、天体图、布局图、专用图、图谱)Battle map 作战地图Highway map 公路图Genetic map 基因图谱2.Figure(图形、平面图)Geometric(al) figure 几何图形Dimension figure 尺寸图Plane figure 平面图3.Pattern(图案、图型、图样)Checkboard pattern 棋盘型图案Recording pattern 录像图型Circular pattern 圆形图样4.Sketch(草图、略图、简图)Eye sketch 目测草图Topographic sketch 地形略图Dimensional sketch 尺寸简图5.Scheme/shematic(图解、示意图、流程图、电路图)Flow scheme 流程图Induction scheme 感应电路图6.Draft(草图)Chisel draft 雕刻前在石头上画出边缘轮廓草图7.Curve(曲线图表)Algebraic curve 代数曲线Comfort curve 湿度舒适曲线8.Graph(曲线图表)Funtional graph 函数图(亦称plot)Bar graph 条形图(也称chart)9.View(视图)Plane view 平面视图10.Geometry(几何图)Plane geometry 平面几何Solid geometry 立体几何图11.Chart(航海图、图表)Aeronautical chart 领航图Demographic data chart 人口统计图表Pie chart 饼图Bar chart 柱图12.Drawing(工程图、插图)Drawing 建筑图Explanatory drawing 说明(插)图yout(布局图、规划图)1、图形种类及概述法:泛指一份数据图表:a data graph(曲线图)/chart/diagram/illustration/table饼图:pie chart直方图或柱形图:bar chart/histogram趋势曲线图:line chart/curve diagram表格图:table流程图或过程图:flow chart/sequence diagram程序图:processing/procedures diagram2、常用的描述用法The table/chart diagram/graph shows (that)According to the table/chart diagram/graphAs (is)shown in the table/chart diagram/graphAs can be seen from the table/chart/diagram/graph/figures,figures/statistics shows (that)……It can be seen from the figures/statisticsWe can see from the figures/statisticsIt is clear from the figures/statisticsIt is apparent from the figures/statisticstable/chart/diagram/graph figures (that)……table/chart/diagram/graph shows/describes/illustrates3、图表中的数据(Data)具体表达法数据(Data)在某一个时间段固定不变:fixed in time在一系列的时间段中转变:changes over time持续变化的data在不同情况下:增加:increase/raise/rise/go up ……减少:decrease/grow down/drop/fall ……波动:fluctuate/rebound/undulate/wave ……稳定:remain stable/stabilize/level off ……二、相关常用词组1、主章开头图表类型:table(表格)、chart(图表)、diagram(图标)、graph(多指曲线图)、column chart (柱状图)、pie graph(饼图)、tree diagram(树形图)描述:show、describe、illustrate、can be seen from、clear、apparent、reveal、represent内容:figure、statistic、number、percentage、proportion2、表示数据变化的单词或者词组rapid/rapidly 迅速的,飞快的,险峻的dramatic/dramatically 戏剧性的,生动的significant/significantly 有意义的,重大的,重要的sharp/sharply 锐利的,明显的,急剧的steep/steeply 急剧升降的steady/steadily 稳固的,坚定不移的gradual/gradually 渐进的,逐渐的slow/slowly 缓慢的,不活跃的slight/slightly 稍微的、略微地stable/stably 稳定的3、其它在描述中的常用到的词significant changes 图中一些较大变化noticeable trend 明显趋势during the same period 在同一时期grow/grew 增长distribute 分布unequally 不相等地in the case of 在……的情况下in terms of/in respect of/regarding 在……方面in contrast 相反,大不相同government policy 政府政策market forces 市场力量measuren n.尺寸,方法,措施v.估量,调节forecast n.先见,预见v.猜测三、图表描述套句精选1.the table shows the changes in the number of……over the period from……to……该表格描述了在……年之……年间……数量的变化。
2.the bar chart illustrates that……该柱状图展示了……3.the graph provides some interesting data regarding……该图为我们提供了有关……有趣数据。
4.the diagram shows (that)……该图向我们展示了……5.the pie graph depicts (that)……该圆形图揭示了……6.this is a cure graph which describes the trend of……这个曲线图描述了……的趋势。
7.the figures/statistics show (that)……数据(字)表明……8.the tree diagram reveals how……该树型图向我们揭示了如何……9.the data/statistics show (that)……该数据(字)可以这样理解……10.the data/statistics/figures lead us to the conclusion that……这些数据资料令我们得出结论……11.as is shown/demonstrated/exhibited in the diagram/graph/chart/table……如图所示……12.according to the chart/figures……根据这些表(数字)……13.as is shown in the table……如表格所示……14.as can be seen from the diagram,great changes have taken place in……从图中可以看出,……发生了巨大变化。
15.from the table/chart/diagram/figure,we can see clearly that……or it is clear/apparent from the chart that……从图表我们可以很清楚(明显)看到……16.this is a graph which illustrates……这个图表向我们展示了……17.this table shows the changing proportion of a & b from……to……该表格描述了……年到……年间a与b的比例关系。
18.the graph,presented in a pie chart,shows the general trend in……该图以圆形图形式描述了……总的趋势。
19.this is a column chart showing……这是个柱型图,描述了……20.as can be seen from the graph,the two curves show the flutuation of……如图所示,两条曲线描述了……的波动情况。
21.over the period from……to……, the……remained level.在……至……期间,……基本不变。
22.in the year between……and……在……年到……期间……23.in the 3 years spanning from 1995 through 1998……1995年至1998三年里……24.from then on/from this time onwards……从那时起……25.the number of……remained steady/stable from (month/year)to (month/year)。
……月(年)至……月(年)……的数量基本不变。
26.the number sharply went up to……数字急剧上升至……27.the percentage of……stayed the same between……and…………至……期间……的比率维持不变。
28.the figures peaked at……in(month/year)……的数目在……月(年)达到顶点,为……29.the percentage remained steady at……比率维持在……30.the percentage of……is sightly larger/smaller than that of…………的比例比……的比例略高(低)。