第八章_Project quality management项目管理知识体系(PMBOK)英文第六版
project quality management(项目品质管理)

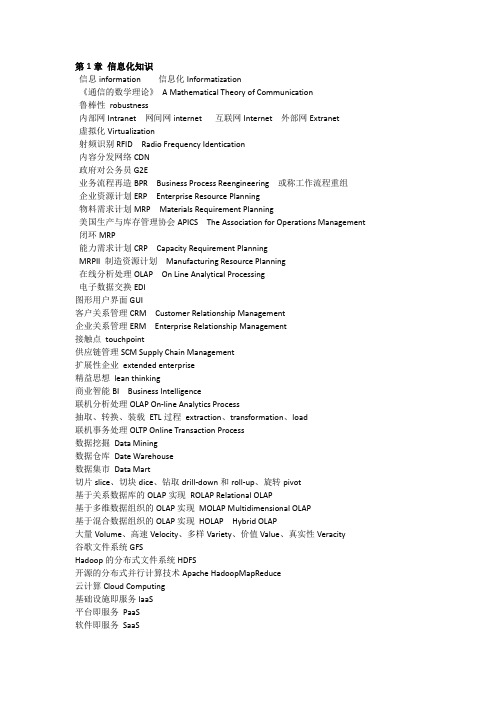
Project Quality ManagementThe project Quality Management knowledge area assures that the project meets the requirements that the project was undertaken to produce. These processes measure overall performance, and monitor projects results and compare them to the quality standards set out in the project planning process to assure that the customer will receive the product or service they thought they purchased. Project Quality Management is composed of the following three processes: Quality Planning, Quality Assurance, and Quality Control. The PMBOK defines quality as the totality of characteristics of an entity that bear on its ability to satisfy stated or implied needs. Stated and implied needs are the inputs to developing project requirements. A critical aspect of quality management in the project context is turning implied needs into requirements through Project Scope Management. It is important to recognize the difference between quality and grade. Grade is defined by the PMBOK as a category or rank given to entities having the same functional use but different technical characteristics. Low quality is always a problem, but low grade may not be. The project manager and team must determine and deliver the required levels of quality and grade. One important area that the PMBOK emphasizes is the growing attention to customer requirements as the basis for managing quality. Much of this discussion is similar to what is covered in contemporary course offerings. Another concept that may appear on the test, which is not specifically mentioned in the PMBOK, is "gold-plating." Simply defined, gold-plating is giving the customer more than what was required. Exceeding the specified requirements is a waste of time and money, with no value added to the project. The customer should expect and receive exactly what was specified. This is the underlying philosophy of project quality management espoused by PMI; it is the process required to ensure that the project will satisfy the needs for which it was undertaken. Quality Management The PMBOK definition is similar to Crosby's definition in Quality is Free. According to the PMBOK, quality management includes all activities of the overall management function that determine the quality policy, objectives, and responsibilities, and implements them by means such as quality planning, quality assurance, quality control, and quality improvement within the quality system. Quality management involves carrying out a project through itsPMPTOOLS e-book – All rights reserved 2002PMP EXAMCRAMphases (for example, concept, development, implementation, and finish) with zero deviations from the project specifications. Policies, plans, procedures, specifications, and requirements are attained through the sub functions of quality assurance and quality control.Quality PlanningThe PMBOKdefines quality planning as "identifying which quality standards are relevant to the project and determining how to satisfy them". Also remember a fundamental tenet of modern thinking about project quality management-quality should be planned in, not inspected in! Therefore, although inspection is certainly part of project quality management, increased inspection is not generally considered the best path to improved quality. So hiring more inspectors would not be the correct answer to the question, "What is the best way to improve quality?"Quality PolicyPMI stresses the importance of having a quality policy for the project. Quality policy is defined as the overall intentions and direction of an organization with regard to quality as formally expressed by top management. If the performing organization lacks a formal quality policy or if the project has multiple organizations involved, the project team must develop a quality policy for the project.Quality Planning Tools and TechniquesPMI discusses five quality planning tools and techniques. Benefit/cost analysis: Benefit/cost analysis must be considered in the quality planning process. The primary benefit of meeting quality requirements is less rework; the primary cost is the expense associated with project quality management activities. Benchmarking. Benchmarking involves comparing actual or planned project activities to those of other projects to generate ideas for improvement and to provide a standard by which to measure performance. Some people have described this process as a search for "best practices." Flowcharting: Flowcharts are diagrams that show how various elements of a system relate. (See the description of the types of flowcharts in the quality control tools section). Here, PMI also includese-book – All rights reserved 2002-2-PMP EXAMCRAMoCause-and-effect diagrams (also called Ishikawa diagrams or fishbone diagrams), which illustrate how various causes and subcauses relate to create potential problems or effects(Cause and Effect Diagram) System or process flowcharts, which show the interrelated elements Design of experiments: This is an analytical technique that helps identify which variables have the most influence on the overall outcome. For example, designers might want to determine which combination of suspension and tires will produce the most desirable ride characteristics at a reasonable cost. Or, project planners could design experiments to determine the optimal combination of senior and junior level staff given cost and time constraints. Cost of quality: One major area of emphasis is the concept of cost of quality, which refers to the total cost of all efforts to achieve product/service quality. It is defined as the cost of conformance-the cost of proactive quality processes-and the cost of nonconformance the cost of a quality failure. In either form, cost of quality is a results oriented approach to measuring and assessing the effectiveness and/or benefit of an organization's project quality management process. It is a useful means of bringing management's attention to the need for quality, but it provides little meaningful capability to manage quality proactively. oTypes of CostsThere are three types of costs incurred. Be able to recognize examples of each: prevention costs and appraisal costs, which are the cost of conformance, and failure costs, which are the cost of nonconformance.e-book – All rights reserved 2002-3-PMP EXAMCRAMCost of Conformance Prevention costs: Up-front costs oriented toward the satisfaction of customer requirements: o Design reviews o Training and indoctrination o Planning o Vendor, supplier, and subcontractor surveys o Process studies Appraisal costs: Costs associated with the evaluation of the product or the process to see whether customer requirements were met: o Product inspections o Lab tests o Vendor controls o In-process testing o Internal/external design reviewsCost of Nonconformance (Failure Costs) Internal failure costs: Costs associated with the failure of the processes to make the products acceptable to the customer before the products leave the control of the organization: o Scrap o Rework o Repair o Downtime o Defect evaluation o Corrective actions External failure costs: Costs associated with the determination by the customer that requirements have not been satisfied: o Customer returns o Customer complaints o Customer inspections o Customer visits to resolve quality complaints o Corrective actionsKey Quality Planning Outputs The quality management plan describes the quality management system: the organizational structure, responsibilities, procedures, processes, and resources needed to implement quality management. Operational definitions describe what something is and how the quality control process measures it. They may also be called metrics.e-book – All rights reserved 2002-4-PMP EXAMCRAMChecklists are outputs of quality planning that are used to verify that a set of required steps has been performed. Completed checklists (an output of quality control) should be part of the project's records.Quality AssuranceQuality assurance is a managerial function that addresses all the planned and systematic activities implemented within the quality system to provide confidence that the project will satisfy the relevant quality standards. As defined by the PMBOK, quality assurance is fundamentally a reactive process. The following issues and concepts fall under quality assurance: Formative Quality Evaluation (Quality Audit): This is a process of reviewing specific data at key points of the project's life cycle. The quality audit is a quality assurance tool and technique that serves as a structured review of quality management activities. Its objective is to identify lessons learned that can be used to improve performance on this project or on other projects in the organization. Quality Improvement: Quality improvement is the output of quality assurance and includes taking actions to increase the effectiveness and efficiency of the project to provide added benefit to the project stakeholders. This may require the use of change requests or corrective action. Ownership of Quality Responsibility: The individual employee performing the task has ultimate responsibility. Self-Inspection: The individual performing a given task also performs measurements to ensure that conformance is continually achieved. Quality ControlQuality control is a technical function that involves establishing the technical baseline for the project and then collecting specific data by which to measure conformance to that baseline. Specifically, the PMBOK defines quality control as "monitoring specific project results to determine if they comply with relevant quality standards and identifying ways to eliminate causes of unsatisfactory performance". Included below are some important terms and concepts associated with quality control. Variable: A quality characteristic that is measurable in increments. Examples are diameter measured in inches, cooking time measured in minutes, and weight measured in pounds. Attribute: A quality characteristic that is classified as either conforming or nonconforming to specifications or requirements. It results in a go or no-go decision. Probability. An important concept in quality control is that of probability. In its simplest form, probability refers to the chance that something will happen.e-book – All rights reserved 2002-5-PMP EXAMCRAMFor attributes, this is easily segregated into a "yes-no" outcome. As an example, in flipping a coin there is a 50 percent probability of getting "heads" on any single flip. For variables, probability is a more complicated concept. We measure the occurrences of an event or characteristic, and distribute them over the entire range of the characteristic. Such a distribution is formally called a probability distribution. The most common probability distribution has a bell shape and is symmetric about its mean; it is known as a normal distribution or a bell curve. A population is the entire group of items or occurrences that we might wish to measure. Because populations can be very large, however, we often sample the population, using a smaller group to get a picture of the larger group. Standard Deviation: In measuring samples and comparing them to their overall population, one important concept is that of standard deviation. Simply defined, the standard deviation is the amount on either side of the mean of a normal distribution that will contain approximately 68.3 percent of the total population. The amount within two standard deviations will include 95.5 percent, and within three standard deviations will include 99.7 percent of the population. We use the character sigma, a, to denote the standard deviation of an entire population. Calculating standard deviation is complex. Most automated quality control packages include the provision to calculate standard deviation and other statistically important values. In fact, most pocket calculators available today can also provide this value for a series of discrete observations of a variable characteristic. Process Control: Building on the statistical concepts we have just discussed, the PMBOK emphasizes process control as an important means of managing quality. Key to this concept is the idea of statistical process control (SPC) and its main tool, control charts, commonly called SPC charts. A SPC chart will show you the current capability of the process-what is called voice of the process in some courses and recent publications. The important point to remember about SPC charts is that there are many different types you may use, depending on the characteristic you are measuring and its variability. Sampling: Sampling is a useful means of assessing the value of a characteristic when examining an entire population is not feasible. There are two main types of sampling.e-book – All rights reserved 2002-6-PMP EXAMCRAMooAttribute sampling is the examination of one or more attributes in a lot. A limit of acceptability is established for the entire lot. For example, we may consider a "lot" of 10,000 parts. A random sample of 150 is selected for examination. For that sample, the acceptance number is 3, meaning that if more than 3 parts are found to be defective; the entire lot of 10,000 will be rejected. You can conduct single-attribute sampling, double-attribute sampling, multipleattribute sampling, or sequential attribute sampling (singleattribute sampling performed sequentially on the same lot for different attributes). Variable sampling provides a more dynamic approach to sampling. This is the basis for creating control charts, where a process variable is measured and charted to determine process capability. Variable sampling may also be used to estimate the fraction of a lot that is nonconforming, and thus to make decisions about further inspection or use of the lot.Quality Control ToolsThere are seven main quality control tools (often called the basic seven tools). Flowcharts and Diagrams (Tools 1 and 2) Flowcharts permit you to examine and understand relationships in a process or project. They show how various elements of a system interrelate. They provide a step-by-step schematic or picture that serves to create a common language, ensure common understanding about sequence, and focus collective attention on shared concerns. Flowcharts are used in all three of the quality management processes. Several different types of flowcharts are particularly useful in the continuous improvement process. Three frequently used charts are the top-down flowchart, the detailed flowchart, and the work-flow diagram. The top-down flowchart presents only the major or most fundamental steps in a process or project. It helps you or your team to easily visualize the process in a single, simple flow diagram. Key value-added actions associated with each major activity are listed below their respective flow diagram steps. You can construct a top-down flowchart fairly quickly and easily. You generally do so before attempting to produce detailed flowcharts for a process. By limiting the top-down flowchart to significant value-added activity, you reduce the likelihood of becoming bogged down in the detail.e-book – All rights reserved 2002-7-PMP EXAMCRAM(Top-Down Flowchart) The detailed flowchart provides very specific information about process flow. At its most detailed level, every decision point, feedback loop, and process step is represented. Detailed flowcharts should be used only when the level of detail provided by the top-down or other simpler flowcharts is insufficient to support understanding, analysis, and improvement activity. The detailed flowchart may also be useful and appropriate for critical processes where precisely following a specific procedure is essential.(Detailed Flowchart) The work-flow diagram is a graphic representation of how work actually flows through a physical space or facility. It is very useful for analyzing flow processes, illustrating flow inefficiency, and planning process flow improvement.e-book – All rights reserved 2002-8-PMP EXAMCRAM(Work Flow Diagram) Scatter diagrams organize data using an independent variable and a dependent variable. Scatter diagrams are used to determine the relationship between two or more pieces of corresponding data. Data are plotted on an XY chart to determine correlation. Scatter diagrams are used to show the effect or no effect on one variable when the other variable is changed.e-book – All rights reserved 2002-9-PMP EXAMCRAMPareto Charts (Tool 3) In the late 1800s, Vilfredo Pareto, an Italian economist, found that typically 80 percent of the wealth in a region was concentrated in less than 20 percent of the population. Later, Dr. Joseph Juran formulated what he called the Pareto Principle of problems: only a "vital few" elements (20 percent) account for the majority (80 percent) of the problems. For example, in a manufacturing facility, 20 percent of the equipment problems account for 80 percent of the downtime. Because the Pareto principle has proven to be valid in numerous situations, it is useful to examine data carefully to identify the vital few items that most deserve attention.A Pareto Chart is a bar chart in which the data are arranged in descending order of their importance, generally by magnitude of frequency, cost, time, or a similar parameter. The chart presents the information being examined in its order of priority and focuses attention on the most critical issues. The chart aids the decision-making process because it puts issues into an easily understood framework in which relationships and relative contributions are clearly evident. The cause-and-effect diagram is a graphic representation of the relationships among a list of items or factors. It is a useful tool in brainstorming, examining processes, and planning activities. The process of constructing a cause-andeffect diagram helps stimulate thinking about an issue, helps organize thoughts into a rational whole, and generates discussion and the airing of viewpoints. The diagram documents the level of understanding about an issue and provides a framework from which to begin expanding that understanding. Cause-and-effect diagrams can be used to explore a wide variety of topics including the relationships between an existing problem and the factors that might bear on it; a desired future outcome and the factors that relate to it; or any event past, present, or future, and its causal factors.e-book – All rights reserved 2002- 10 -NOTE. The cause-and-effect diagram was developed by Kaoru Ishikawa. It may also be referred to on the exam as the Ishikawa diagram and/or "fishbone" diagram because of its shape.(Cause and effect Diagram)Graphs (Tool 5)Many different types of graphs are available and useful to the improvement process. Some of the most common include a simple line graph (time plots or trend chart), pie chart, and bar chart, or histogram. Graphs are useful for presenting data in a simple pictorial form that is quickly and easily understood. Graphs serve as powerful communication tools and should be employed liberally in the workplace to describe performance, support analyses, and document the improvement process.Control Charts (Tool 6)A control chart is a graph that displays data taken over time and computed variations of those data. Control charts are used to show the variation on a variety of variables including average (X) and range (R) and also the number of defects (PN), percent defective (P), defects per variable unit (U), and defects per fixed unit (C). The control chart allows you to distinguish between measurements that are predictably within the inherent capability of the process (normal causes of variation that are to be expected) and measurements that are unpredictable and produced by special causes.(Control Chart Diagram)The upper and lower control limits (UCL and LCL) must not be confused withspecification limits. Control limits describe the natural variation of the processsuch that points within the limits are generally indicative of normal andexpected variation. Points outside the limits signal that something has occurred that requires special attention because it is outside of the built-insystemic causes of variation in the process. Note that the circled point onthe X-bar chart means that the process is out of control and should beinvestigated. These points outside the control limits are referred to as specialevents having either assignable causes or random causes. The occurrence ofassignable causes may be the result of unwanted, external effects such as thefollowing:•An equipment problem•An employee problem (poor training, understaffed, and so on)•Defective materialsThere is another important guideline, known as the Rule of Seven, which should be observed whenever interpreting control charts. This rule of thumb (heuristic) states that if seven or more observations in a row occur on the same side of the mean (or if they trend in the same direction), even though they may be within the control limit, they should be investigated as if they had an assignable cause. (The lower part of Figure 5-10 illustrates such an occurrence.) It is extremely unlikely that seven observations in a row would be on the same side of the mean if the process is operating normally.Why is this so? If a process is operating normally, the observations will follow a random pattern with some of the points falling above the line and some below the line. In fact, the probability that any single point will fall above or below the line is 50-50 (like a coin toss). Further, the probability that seven points in a row would be on the same side of the line would be calculated as .5 to the 7th power, which is equal to 0.0078 (or less than 1 percent). Again, this rule provides a guideline that alerts you that something unlikely is happening and you should check it out.These charts will help you understand the following:•Understand the inherent capability of your processes•Bring your processes under control by eliminating the special causes of variation•Reduce tampering with processes that are under statistical control•Monitor the effects of process changes aimed at improvementTwo additional concepts are important in the use of control charts. Both concepts involve the idea of standard deviation, often referred to as "sigma." For the exam, you need to understand only the concepts (no formulas or complex calculations are required).The first concept involves the use by some companies of what is known as the Six Sigma Rule for setting control limits. You are already aware that three standard deviations (sigma) either side of the mean accounts for approximately 99.7 percent of the possible outcomes. Historically, many companies have used plus or minus three sigma’s as their standard for setting control limits. In recent years, some companies have chosen to use plus or minus six sigmas as a guide for setting control limits. The use of this more stringent rule means that even fewer actual outcomes might fall outside the control limits.The second concept involves the effect of sample size on the control limits. Again, you do not need to memorize any formulas, but it helps to know the following information about how the formula for setting control limits works. First, the standard deviation is part of the formula for establishing control limits. The larger the standard deviation, the wider the control limits will be. That much is fairly intuitive. In other words, the greater the natural variations in the process, the wider the control limits need to be. Now, how does sample size affect the control limits? Sample size affects control limits by its effect on the standard deviation. Sample size is in the denominator of the formula for variance from which standard deviation is computed; so whenever sample size is increased, the standard deviation will be smaller. Conversely, if the sample size is decreased, the standard deviation will be larger. Therefore, larger sample sizes will result in more narrow control limits, and smaller sample sizes will result in wider control limits.Checksheets (Tool 7)A checksheet is a list of check-off items that permit data to be collected quickly and easily in a simple standardized format that lends itself to quantitative analysis. A check sheet frequently contains a graphic representation of an object and is used to record such information as where specific damage was located. Check sheets are intended to make data collection fast and easy. They should be carefully designed so that the data are useful and have a clear purpose. Check sheets are frequently used to collect data on numbers of defective items, defect locations, and defect causes.Continuous Improvement and KaizenThe Japanese word for continuous improvement is kaizen. The key idea here isthat improving quality is not a discrete, one-time event. Managers andworkers alike join in the responsibility to constantly watch for opportunities toimprove processes as well as products.Just-in-time (JIT)JIT is an inventory control approach that attempts to reduce work-in-processinventory to zero stock. Thus, there is no extra or "buffer" stock kept in reserve in such a process. Numerous companies have adopted JIT, which waspopularized in Japan at Toyota, because the company believed JIT and highquality go together naturally. The philosophy is that with no safety stock inthe system, defective parts or processes will grind the system to a halt. Zeroworking-process inventory, therefore, forces a company to find and fix qualityproblems, or it will constantly miss its schedule commitments.Impact of Motivation on QualityIt is generally believed that increased quality is likely to be associated withprojects whose team members display pride, commitment, and an interest inworkmanship. It is also believed that one way to harm this culture is byallowing frequent turnover of the people assigned to the project.Priority of Quality versus Cost and ScheduleQuality used to receive lip service in many companies, but it was in reality lessimportant than meeting schedules or containing costs. Such a situation was often tipped off by such signals as the quality manager reporting to the production manager (who often cared more about schedule pressures than quality). Although lip service has probably not been eliminated entirely, modern thinking emphasizes that quality should share equal priority with cost and schedule. In works such as Crosby's Quality Is Free, many people maintain that improvements in quality are likely to lead to better cost and schedule performance in the long run.Impact of Poor QualityThe following effects on a project are possible results of poor quality: •Increased project costs as a result of costs of nonconformance (for example, rework, scrap, product recalls, and so on)•Decreased productivity•Increased risk and uncertainty (less predictability in cost, schedule, and technical outcomes)•Increased costs of monitoring (if conformance to specifications is low, increased monitoring will probably become necessary)InspectionsInspections are a quality control tool. As stated in the scope verification section, inspection includes activities such as measuring, examining, and testing undertaken to determine whether results conform to requirements.They may be conducted at any level.Trend AnalysisAnother quality control tool is trend analysis, which uses mathematical techniques to forecast future outcomes based on historical results. It is used to monitor•Technical performance: How many errors or defects have been identified; how many remain uncorrected•Cost and schedule performance: How many activities per period were completed with significant variancesDesign and Quality•Quality should be designed in, not inspected in (worth repeating).•More specifically, careful design of a product or service is believed to increase reliability and maintainability (two important measures ofquality).•The primary responsibility for developing design and test specifications rests with the project engineers (they have the expertise needed to performthis vital task).•Rework is any action taken to bring a defective or nonconforming item into compliance with requirements or specifications. The project team shouldmake every effort to minimize rework.。
项目管理知识体系指南
第一部分项目管理框架第一章绪论[Introduction]The Project Management Body of Knowledge (PMBOK©) is an inclusive term that describes the sum of knowledge within the profession of project management. As with other professions such as law, medicine, and accounting, the body of knowledge rests with the practitioners and academics that apply and advance it. The full project management body of knowledge includes knowledge of proven traditional practices that are widely applied, as well as knowledge of innovative and advanced practices that have seen more limited use, and includes both published and unpublished material.This chapter defines and explains several key terms and provides an overview of the rest of the document. It includes the following major sections:1.1 Purpose of This Guide1.2 What Is a Project?1.3 What Is Project Management?1.4 Relationship to Other Management Disciplines1.5 Related Endeavors项目管理知识体系(PMBOK)是描述项目管理专业知识的专业术语。
《项目管理》课程教学大纲
《项目管理基础》课程教学大纲第一章项目管理概念与范畴第一节项目和项目管理1、项目及其基本属性2、项目管理及其关键要素3、项目管理知识体系第三节项目的战略管理1、组织的项目管理战略2、项目的战略选择3、项目的战略管理过程第二章项目生命期和管理过程第一节项目生命期1、项目生命期特征2、项目阶段的性质3、项目的生命期模型4、项目生命期的里程碑管理第二节项目过程管理1、项目过程2、项目管理过程3、项目管理过程组第三节项目管理过程组1、启动过程组2、计划过程组3、执行过程组4、监控过程组5、收尾过程组第四节过程组的相互关系1、过程组的相互关系2、知识领域在过程组之间的分布第三章项目综合管理第一节开发项目章程1、项目章程2、开发项目章程开发过程的输入3、开发项目章程开发的技术和工具4、项目章程开发过程的输出第二节开发项目范围说明书(初步)1、项目范围说明书2、开发项目范围说明书(初步)过程输入3、开发项目范围说明书(初步)的技术与工具4、开发项目范围说明书(初步)输出第三节开发项目管理计划1、项目管理计划2、开发项目管理计划的输入3、开发项目管理计划的技术与工具4、开发项目管理计划输出第四节指挥和管理项目执行1、指挥和管理项目执行2、指挥和管理项目执行输入3、指挥和管理项目执行的技术和工具4、指挥和管理项目执行输出第五节监控项目工作1、监控项目工作2、监控项目工作过程的输入3、监控项目工作过程的技术与工具4、监控项目工作过程的输出第六节综合变更控制1、综合变更控制2、综合变更控制过程输入3、综合变更控制过程的技术与工具4、综合变更控制过程输入第七节项目收尾1、项目收尾2、项目收尾过程输入3、项目收尾过程的技术与方法4、项目收尾过程输出第四章项目范围管理第一节项目范围计划1、范围计划2、范围计划过程的输入3、范围计划的技术与工具4、范围计划的输出第二节项目范围定义1、项目范围定义2、范围定义过程输入3、范围定义过程的技术和工具4、范围定义过程的输出第三节创建工作分解结构(WBS)1、工作分解结构2、创建工作分解结构过程3、工作分解结构的作用和实际应用第四节项目范围验证1、范围验证2、范围验证过程输入3、范围验证过程的技术和工具4、范围验证过程输出第五节项目范围控制1、范围控制2、范围控制过程的输入3、范围控制过程的技术和工具4、范围控制过程的输出第五章项目时间管理第一节项目活动定义1、项目活动定义2、项目活动定义过程第二节项目活动排序1、项目活动排序2、项目活动排序的技术与工具3、绘制项目网络图的规则与步骤4、项目网络图绘制实例第三节活动资源估计1、项目活动资源2、资源估计过程第四节活动持续时间估计1、活动持续时间2、活动持续时间估计技术和工具第五节开发进度计划1、进度的时间参数2、网络计划技术:关键路线法和计划评审技术3、其他的开发进度计划的技术和工具4、项目进度计划的输出形式第六节进度控制1、进度控制2、进度控制过程3、进度控制的优化方法第六章项目成本管理1、项目直接成本2、项目管理成本3、期间成本第一节项目成估计1、成本估算2、成本估算内容3、成本估算方法4、成本估算过程的输出第二节项目成本预算1、成本估算和预算的区别与联系2、成本分解结构3、成本预算方法4、成本预算调整第三节项目成本控制1、项目成本控制2、项目成本控制过程的技术和工具3、项目成本控制过程的输出第七章项目质量管理第一节质量计划1、质量计划2、质量计划过程3、质量计划过程的技术和工具4、质量管理计划过程输出第二节执行质量保证1、质量保证2、执行质量保证过程输入3、执行质量保证过程的技术和工具4、执行质量保证过程输出第三节质量控制1、质量控制2、项目质量控制的机理3、质量控制流程4、质量控制技术和方法第八章项目人力资源管理第一节人力资源计划1、人力资源计划的输入2、人力资源计划的技术和工具3、人力资源计划的输出第二节获取项目团队1、获取项目团队2、获取项目团队过程3、获取高效的项目团队4、获取成功的项目经理第三节开发项目团队1、项目团队有效工作的障碍2、有成效的项目团队3、建设一个高效的团队4、项目团队开发建设过程5、团队激励第四节管理项目团队1、管理项目团队2、管理项目团队的九个关键要素3、管理虚拟项目团队第九章项目沟通管理第一节沟通计划1、项目沟通计划2、沟通管理过程输入3、沟通管理过程的技术与工具4、沟通管理过程的输出第二节信息发布1、信息发布2、沟通基本模型3、沟通的技术和工具4、信息发布的输出第三节绩效报告1、绩效报告2、绩效报告的内容3、绩效报告的工具和技术4、绩效报告的输出第四节管理项目干系人1、管理项目干系人过程输入2、管理项目干系人过程技术和方法3、管理项目干系人过程的输出第十章项目风险管理第一节风险管理计划1、风险管理计划过程的输入2、风险管理计划过程的技术和工具3、风险管理计划过程的输出第二节风险识别1、收集风险资料2、风险形势估计3、风险识别过程的技术与工具4、风险识别过程输出第三节定性风险分析1、定性风险分析的输入2、定性风险分析的技术与工具3、定性风险分析输出第四节定量风险分析1、定量风险分析过程输入2、定量风险分析过程的技术与工具3、定量风险分析过程输出第五节风险应对计划1、风险应对计划2、风险应对策略3、风险应对计划的输出第六节风险监控1、风险监控过程2、风险监视与控制3、风险监控过程的技术和工具4、风险监控的输出第十一章项目收尾管理一、项目验收二、项目后评价(一)项目后评价的定义1、项目跟踪评价2、项目实施效果评价3、项目影响评价(二)、项目后评价的种类1、项目跟踪评价2、项目实施效果评价3、项目影响评价(三)项目后评价的内容1、立项决策评价2、工程实施评价3、运营管理评价4、效益评价5、项目影响评价6、项目持续性评价(四)、项目后评价的方法1、调查统计预测2、对比法(前后对比,有无对比)3、逻辑框架法三、项目终止(一)项目终止的因素1、项目目标已经实现2、项目下一步进展已经很难或不可能获得3、项目被无限期的延长4、项目所必需的资源被转移出项目5、项目的关键成员离开项目组(二)项目终止的过程1、保证涉及项目终止的所有任务完成;2、通知情况,达成协议;3、理清最终帐目;4、保存员工文档;5、人员安置、物资设备和其他资源的处理;6、保证完成有关文档,如项目终止报告等。
pmbok的知识体系 项目管理结构
pmbok的知识体系项目管理结构
PMBOK(ProjectManagementBodyofKnowledge,项目管理知识体系)是一套由国际项目管理协会(PMI)制定的标准,旨在为项目管理提供指导和规范。
PMBOK的知识体系包括10个知识领域,分别是:
1. 项目整体管理:包括项目计划、项目执行、项目监控和项目收尾等方面。
2. 项目范围管理:确定项目的范围、编制WBS(工作分解结构)、变更控制等。
3. 项目时间管理:制定项目进度计划、控制项目进度、识别和应对项目进度风险等。
4. 项目成本管理:制定项目预算、控制项目成本、识别和应对项目成本风险等。
5. 项目质量管理:制定项目质量计划、质量保证、质量控制等。
6. 项目资源管理:规划项目团队、管理项目团队、识别和应对项目资源风险等。
7. 项目沟通管理:制定项目沟通计划、管理项目沟通、监督项目沟通等。
8. 项目风险管理:识别项目风险、规划应对策略、实施风险应对、监督风险等。
9. 项目采购管理:规划采购、实施采购、控制采购、收尾采购等。
10. 项目相关方管理:识别相关方、规划相关方管理、实施相关方管理、监督相关方管理等。
在PMBOK中,这10个知识领域被组织成了5个过程组,即启动、规划、执行、监控和收尾。
这些过程组构成了项目管理的结构,为项目管理提供了一个完整的框架。
项目管理人员可以通过学习PMBOK的知识体系和过程组,了解项目管理的标准和最佳实践,提高项目管理的能力和水平,从而更好地完成项目目标。
项目管理知识体系总览

Project Schedule Supporting Detail Schedule Mgmt Plan Resource ReqmtsUpdates
Project Plan Development
Quality Planning
Comm
Risk
Planning Identification
Quality Mgmt Plan Commun Sources of Risk
Operational Defn Mgmt Plan Potential RiskEvents
Checklists
Risk Symptoms
WBS
Resource Planning
Resource Requirements
Planning
Activity Sequencing
Project Network Diagram Activity List Updates
Schedule Development
Activity Duration Estimation
Closing
Project Management Processes Groups
Initiating
Facilitating
Executing
Planning
Information
Quality Planning
Comm
Risk
Planning Identification
Risk Quantification
Performance Reporting
项目管理知识体系pmbok指南

项目管理知识体系PMBOK指南介绍项目管理知识体系PMBOK指南(Project Management Body of Knowledge)是由项目管理学会(Project Management Institute,简称PMI)制定的一套全球通用的项目管理标准。
该指南提供了项目管理的最佳实践,涵盖了项目管理的各个方面,包括项目启动、规划、执行、监控和收尾等阶段。
本文将全面、详细、完整地探讨PMBOK指南的内容和应用。
项目管理知识体系概述PMBOK指南是项目管理的权威指南,它由五大过程组和十个知识领域组成。
五大过程组包括启动、规划、执行、监控和控制、收尾。
十个知识领域包括整体项目管理、范围管理、时间管理、成本管理、质量管理、人力资源管理、沟通管理、风险管理、采购管理和干系人管理。
这些过程组和知识领域相互关联、相互影响,共同构成了项目管理的知识体系。
启动过程组启动过程组是项目管理的第一个过程组,它确定项目的目标、范围和可行性,制定项目章程和项目管理计划。
启动过程组的关键活动包括项目目标的明确、项目干系人的识别和分析、项目可行性研究和项目章程的编制。
规划过程组规划过程组是项目管理的核心过程组,它制定项目的详细计划,包括范围、时间、成本、质量、人力资源、沟通、风险、采购和干系人管理计划。
规划过程组的关键活动包括需求收集和分析、工作分解结构(WBS)的制定、进度计划和资源计划的编制、风险评估和应对计划的制定等。
执行过程组执行过程组是项目管理的实施过程组,它按照项目计划进行工作的执行和控制。
执行过程组的关键活动包括项目团队的组建和管理、项目工作的分配和执行、沟通和沟通管理、质量控制和变更管理等。
监控和控制过程组监控和控制过程组是项目管理的监督和控制过程组,它对项目的进展和绩效进行监控和控制,及时发现和解决问题,确保项目按计划顺利进行。
监控和控制过程组的关键活动包括项目绩效的测量和分析、问题和变更的跟踪和解决、风险的监控和控制、合同和采购的管理等。
系统集成项目管理工程师软考中级专业术语中英汇总
第1章信息化知识信息information 信息化Informatization《通信的数学理论》A Mathematical Theory of Communication鲁棒性robustness内部网Intranet 网间网internet 互联网Internet 外部网Extranet虚拟化Virtualization射频识别RFID Radio Frequency Identication内容分发网络CDN政府对公务员G2E业务流程再造BPR Business Process Reengineering 或称工作流程重组企业资源计划ERP Enterprise Resource Planning物料需求计划MRP Materials Requirement Planning美国生产与库存管理协会APICS The Association for Operations Management 闭环MRP能力需求计划CRP Capacity Requirement PlanningMRPII 制造资源计划Manufacturing Resource Planning在线分析处理OLAP On Line Analytical Processing电子数据交换EDI图形用户界面GUI客户关系管理CRM Customer Relationship Management企业关系管理ERM Enterprise Relationship Management接触点touchpoint供应链管理SCM Supply Chain Management扩展性企业extended enterprise精益思想lean thinking商业智能BI Business Intelligence联机分析处理OLAP On-line Analytics Process抽取、转换、装载ETL过程extraction、transformation、load联机事务处理OLTP Online Transaction Process数据挖掘Data Mining数据仓库Date Warehouse数据集市Data Mart切片slice、切块dice、钻取drill-down和roll-up、旋转pivot基于关系数据库的OLAP实现ROLAP Relational OLAP基于多维数据组织的OLAP实现MOLAP Multidimensional OLAP基于混合数据组织的OLAP实现HOLAP Hybrid OLAP大量Volume、高速Velocity、多样Variety、价值Value、真实性Veracity谷歌文件系统GFSHadoop的分布式文件系统HDFS开源的分布式并行计算技术Apache HadoopMapReduce云计算Cloud Computing基础设施即服务IaaS平台即服务PaaS软件即服务SaaS能源利用效率PUE互联网金融ITFIN 国际电工委员会IEC面向服务的体系架构SOA第2章信息系统集成及服务管理信息技术服务标准(ITSS )评估IT服务管理体系(ITSMS)认证信息安全管理体系(ISMS)认证信息技术基础架构库ITIL Information Technology Infrastructure Library英国国家计算机和电信局CCTAIT服务管理ITSM IT Service Management服务级别协议SLA信息技术服务标准ITSS Information Technology Service Standards人员People、流程Process、技术Technology、资源Resource 简称PPTR规划设计(Planning&Design)、部署实施(Implementing)、服务运营(Operation)、持续改进(Improvement)、监督管理(Supervision),简称PIOIS信息系统审计(IS audit)EDI审计计算机辅助审计技术CAATs系统审计SYSTEM AUDIT电子数据处理审计协会(EDPAA后更名为ISACA)IT控制的开放式标准COBIT (Control Objectives for Information and Related Technology ,信息及相关技术控制目标)信息系统审计认证CISA Certified Information System Auditor基于控制(Control-Based)基于风险(Risk-Based)第3章信息系统集成专业技术知识抛弃型原型Throw-It-Away Prototype进化型原型Evolutionary Prototype面向对象方法Object Oriented,OO统一建模语言Unified Modeling Language,UML用例图(Use Case Diagram)、类图(Class Diagram)、对象图(Object Diagram)、组件图(Component Diagram)、部署图(Deployment Diagram)、状态图(State Diagram)、序列图(Sequence Diagram)、协作图(Collaboration Diagram)、活动图(Activity Diagram)RUP(Rational Unified Process)是使用面向对象技术进行软件开发的最佳实践之一面向对象模式的典型应用:基于组件的软件开发Component-Based Development,CBD分层模式典型应用是分层通信协议如ISO/OSI的七层网络模型客户/服务器模式Client/Service,C/S中间件Middleware数据库访问中间件远程过程调用中间件Remote Procedure Call,RPC面向消息中间件Message-Oriented Middle,MOM分布式对象中间件事务中间件也称事务处理监控器Transaction Process Monitor,TPM对象事务监控器Object Transaction Monitor,OTM数据仓库Data Warehouse面向主题Subject-OrientedWeb服务Wed ServicesWeb服务的典型技术包括:用于传递信息的简单对象访问协议(Simple Object Access Protocal,SOAP)、用于描述服务的Web服务描述语言(Web Services Description Language,WSDL)、用于Web服务注册的统一描述、发现及集成(Universal Description Discovery and Integration,UDDI)、用于数据交换的XMLJavaEE Java Platform Enterprise Edition 是最早由Sun公司(已被IBM公司收购)提出、各厂商共同制定并得到广泛认可的工业标准JavaEE应用服务器运行环境主要包括组件Component、容器Container、服务Services通用语言运行环境Common Language Runtime公共对象请求代理架构Common Object Request Broker Architecture ,CORBA)国际标准化组织ISO国际电报电话咨询委员会CCITT开放系统互连参考模型Open System Interconnect,OSIOSI采用了分层的结构化技术:物理层,具体标准有RS232、V.35、RJ-45、FDDI数据链路层,常见协议IEEE802.3/.2、HDLC、PPP、ATM网络层:在TCP/IP协议中,网络层具体协议有IP、ICMP、IGMP、IPX、ARP等传输层:在TCP/IP协议中,具体协议有TCP、UDP、SPX会话层,常见协议有RPC、SQL、NFS表示层,常见协议有JPEG、ASCII、GIF、DES、MPEG应用层:在TCP/IP协议中,具体协议有HTTP、Telnet、FTP、SMTP第4章项目管理一般知识SMART原则项目的目标要求具体的Specific 可测量的Measurable、可达到的Attainable、有相关性的Relevant、有明确时限的Time-bound地理信息系统Geographic Information System,GIS工作分解结构Work Breakdown Structure WBS国际标准化组织International Organization for standardization ISO关键路径法Critical Path Method CPM计划评审技术Program Evaluation and Review Technique PERT工作分解结构Work Breakdown Structure WBS挣值Earned Value EV国际项目管理协会International Project Management Association ,IPMA国际项目管理资质标准IPMA Competence Baseline ICB国际项目管理专业资质认证International Project Management Professional,IPMP美国项目管理学会Project Management PMI项目管理的知识体系Project Management Body of Knowledge PMBOK项目管理专业人员资格认证Project Management Professional,PMP项目管理办公室Project Management Office ,PMO基于项目的组织Project-based Organizations,PBORUP(Rational Unified Process)软件统一过程是一种“过程方法”,它就是迭代模型的一种开发过程的动态结构,周期Cycle、阶段Phase、迭代Iteration和里程碑Milestone开发过程的静态结构,包括活动Activity、产物Artifact、工作者Worker、工作流Workflow RUP中的软件生命周期在时间上被分解为4个顺序的阶段,初始阶段Inception、细化阶段Elaboration、构建阶段Construction和交付阶段TransitionPDCA循环Plan-Do-Check-Act cycle合同文件/工作说明书Statement of Work ,SOW第5章项目立项管理项目建议书Request for Proposal,RFP第6章项目整体管理谅解备忘录MOUs服务品质协议SLA主题专家SME变更控制委员会CCB开踢会议,也称开工会议kick-off meeting完工尚需时间估算ETC进度偏差SV进度绩效指数SPI成本偏差CV成本绩效指数CPI完工估算EAC完工预算BAC根本原因分析RCA失效模式与影响分析FMEA故障树分析FTA第7章项目范围管理联合应用设计/开发JAD质量功能展开QFD第8章项目进度管理挣值管理EVM项目管理信息系统PMIS前导图法Precedence Diagramming Method,PDM 也称紧前关系绘图法活动节点图Active On Node,AON最早开始时间Earliest Start time,ES最迟开始时间Latest Start time,LS最早完成时间Earliest Finish time,EF最迟完成时间Latest Finish time,LF箭线图法Arrow Diagramming Method,ADM 也称双代号网络图或活动箭线图(Active On the Arrow,AOA)活动的紧前事件precede event活动的紧后事件successor event资源分解结构Resource Breakdown Structure,RBSOBS计划评审技术Program Evaluation And Review Technique,PERT 贝塔分布Beta distribution关键路径法CPM Critical Path Method关键链法CCM Critical Chain Method资源平衡Resource Leveling资源平滑Resource Smoothing第9章项目成本管理会计科目表Chart of Accounts质量成本COQ软件编制成本的参数估算COCOMO模型计划值Planned Value ,PVPV的总和有时被称为绩效测量基准PMB项目的总计划值又被称为完工预算BAC实际成本Actual Cost,AC进度偏差Schedule Variance,SV成本偏差Cost Variance,CV进度绩效指数Schedule Performance Index,SPI成本绩效指数Cost Performance Index,CPI完工尚需估算Estimate To Complete,ETC完工尚需绩效指数To-Complete Performance Index,TCPI第10章项目质量管理质量管理Quality Management过程控制(SPC)理论全面质量管理理论TQM全面质量控制TQC准时化生产JIT看板生产Kanben质量改进Kaizen质量功能展开QFD并行工程CE企业流程再造BPR标杆对照BenchMarking实验设计DOE过程决策程序图PDPC活动箭线图AOA 活动节点图AON计划评审技术PERT关键路径法CPM紧前关系绘图法PDM平均故障间隔时间MTBF平均修复时间MTTR第11章项目人力资源管理任务分配矩阵或责任分配矩阵Responsibility Allocation Matrix,RAM工作分解结构WBS组织分解结构OBS资源分解结构Resolution Breakdown Structure,RBSRACI图(Responsible负责-Accountable参与-Consult征求意见-Inform通知)塔克曼Tuckman阶梯理论:形成阶段Forming、震荡阶段Storming、规范阶段Norming、发挥阶段Performing、结束阶段Adjourning冲突管理的6种方法:问题解决Problem Solving/Confrontation,合作Collaboration,强制Forcing,妥协Compromising,求同存异Smoothing/Accommodating,撤退Withdrawing/Avoiding赫茨伯格的双因素理论:保健因素Hygiene Factor;激励因素Motivator第12章项目沟通管理和干系人管理符号Symbol具体符号Concrete Symbol抽象符号Abstract Symbol渠道Channel反馈Feedback噪音Noise环境Environment第13章项目合同管理合同Contract第14章项目采购管理总价加激励合同FPIF总价加经济价格调整合同FP-EPA固定总价合同FFP成本补偿合同:成本加固定费用合同CPFF、成本加激励费用合同CPIF、成本加奖励费用合同CPAF成本加成本百分比,也叫成本加酬金合同CPF工料合同T&M采购文件:方案邀请书Request For Proposal,RFP;报价邀请书Request For Quoting,RFQ;征求供应商意见书Request For Information,RFI;投标邀请书Invitation For Bid,IFB第15章信息(文档)和配置管理配置管理员Configuration management Officer ,CMO配置基线Configuration Baseline里程碑Milestone发行基线Release Baseline构造基线Build Baseline配置库Configuration Library开发库Development Library受控库Controlled Library产品库Product Library配置控制委员会Configuration Control Board,CCB配置标识Configuration Identification配置状态报告Configuration Status Reporting,也称配置状态统计(Configuration Status Accounting)配置审计Configuration Audit功能配置审计Functional Configuration Audit物理配置审计Physical Configuration Audit第16章变更管理变更控制委员会Configuration Control Board,CCB第17章信息系统安全管理保密性Confidentiality完整性Integrity可用性Availability平均故障间隔时间Mean Time Between Failure,MTBF第18章项目风险管理风险分解结构Risk Breakdown Structure第19章项目收尾管理第20章知识产权管理第21章法律法规和标准规范英美法系Common Law国际标准化组织International Organization Standardization,ISO国际电工委员会International Electro technical Commission,IEC国际电信联盟International Telecommunication Union,ITU电气电子工程师学会Institute Electrical and Electronics Engineers,IEEEInternet协会:理事会IAB,工程常务组IESG,工程任务组IETF国际Web联盟(W3C)国际标准化管理委员会Standardization Administration of China,SAC。
project-quality-management工程质量管理

Project Quality Management includes the processes required to ensure that the project will satisfy the needs for which it was undertaken. It includes “all activities of the overall management function that determine the quality policy,objectives,and responsibilities and implements them by means such as quality planning,quality control,quality assurance, and quality improvement, within the quality system”. Figure 8-l provides an overview of the following major project quality management processes:项目质量管理包括项目满足其需求所需的过程。
它包括“确定质量方针、目标和职责并在质量体系中通过诸如质量计划、质量保证和质量改进等方法实施的整个管理职能的全部活动”.图8-1为项目质量管理过程提供了一个概述:8。
l Quality Planning—identifying which quality standards are relevant to the project and determining how to satisfy them。
质量计划-确定项目相关的质量标准并决定如何满足它们。
8.2 Quality Assurance-evaluating overall project performance on a regular basis to provide confidence that the project will satisfy the relevant quality standards.质量保证-定期评价整个项目的执行情况,提供项目满足相关质量标准的信心。
项目管理知识体系
项目管理知识体系项目管理知识体系(Project Management the Body of Knowledge,简称PMBOK)项目管理知识体系的简介项目管理知识体系是项目管理专业领域知识的总称,它是20世纪80年代由美国项目管理协会(PMI)总结了项目管理实践中成熟的理论、方法、工具和技术所提出的。
其后经过数次修订,目前最新版是PMBOK2004。
PMBOK定义了为44个基本的项目管理过程,从过程输入、输出以及采用的工具和技术的角度给出了项目管理过程的详细描述。
这44个项目管理过程基本覆盖了项目管理实践中的基本管理过程,但是,这些项目管理过程必须和产品实现过程结合起来,才能完成整个项目活动。
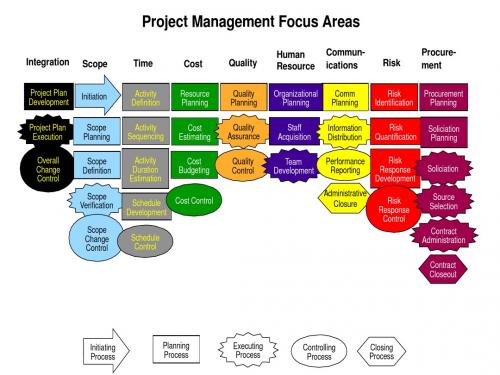
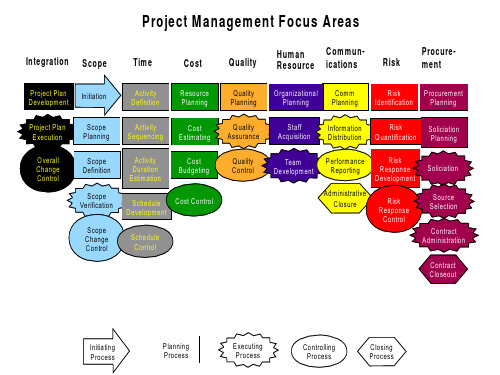
PMBOK重点从知识领域的角度将项目管理过程组成九个项目管理知识领域:项目范围管理、项目时间管理, 项目成本管理, 项目质量管理, 项目人力资源管理, 项目沟通管理, 项目采购管理, 项目风险管理和项目综合管理,每个知识领域包括数量不等的项目管理过程。
项目管理知识体系的形成目前有两大项目管理的研究体系, 即: 以欧洲为首的体系—国际项目管理协会( IPMA International Project Management Association) 和以美国为首的体系—美国项目管理协会(PMI Project Management Institute) 。
IPMA 有自己的知识体系标准《IPMA Competence Baseline,ICB》即《国际项目管理专业资质标准》,其对项目管理者的素质要求大约有40个方面.。
PMI 卓有成效的贡献是开发了一套项目管理知识体系, 简称为PMBOK ( Project Management Body of Knowledge) 。
在这个知识体系中, 把项目管理划分为9个知识领域(范围管理、时间管理, 成本管理, 质量管理, 人力资源管理, 沟通管理, 采购管理, 风险管理和综合管理)。
pmbok项目管理知识体系
pmbok项目管理知识体系
PMBOK是指项目管理知识体系指南(Project Management Body of Knowledge),是由美国项目管理协会(PMI)发布的一本权威指南,用于规范和指导项目管理领域的实践。
PMBOK包含了项目管理的五大过程组和十个知识领域,这些知识领域包括整合管理、范围管理、时间管理、成本管理、质量管理、沟通管理、风险管理、采购管理、干系人管理和人力资源管理。
在PMBOK中,项目管理的五大过程组包括启动、规划、执行、监控与控制以及收尾。
这些过程组涵盖了项目管理的全过程,从项目立项到项目结束的各个阶段,涉及到项目的各个方面,包括项目范围的确定、时间和成本的控制、风险管理、质量保障、沟通与干系人管理等方面。
PMBOK还强调了项目管理中的一些重要概念,比如项目干系人管理、团队管理、沟通管理、风险管理、质量管理等。
这些概念都是项目管理中不可或缺的部分,通过PMBOK的指导,项目经理和团队能够更好地理解和应用这些概念,从而提升项目管理的效率和成功率。
总的来说,PMBOK是一部系统全面的项目管理知识体系指南,通过学习和遵循PMBOK,项目管理人员能够更好地理解项目管理的理论和实践,提高项目管理能力,确保项目顺利完成并达到预期目标。
项目管理知识体系概览.
Organizational Planning
Role/Respons Assignments Staffing Mgmt Plan Organization Chart Supporting Detail
Core
Initiating
Initiation
Project Charter Project Mgr ID'd/Assigned Constraints / Assumptions
Planning
Scope Planning
Scope Statement Supporting Detail Scope Mgmt Pla n
Initiating Process
Planning Process
Executing Process
Controlling Process
Closing Process
Project Management Processes Groups
Initiating Planning
Activity Sequencing Initiation Scope Planning Scope Definition Activity Definition Activity Duration Estimation Cost Estimating Project Plan Development core facilitating Quality Planning Comm Planning Risk Identification Procurement Planning Organizational Planning Risk Quantification Soliciation Planning Staff Acquisition Source Selection Risk Response Development Information Distribution Team Development Quality Assurance Scope Verification Soliciation Contract Administration Scope Change Control Schedule Control
项目管理知识体系总览
A c tiv ity D u ra tio n Estim ation
Activity Duration Estim ates Basis of Estim ates Activitly List Updates
Project Schedule Supporting Detail Schedule M gm t Plan Resource Reqm tsUpdates
c o re fa c ilita tin g
Comm P lanning
R isk Id e n tific a tio n
Procurem ent P lanning
R isk Q uantification
R isk Response D evelopm ent
S oliciation P lanning
Schedule Control
Q u a lity Control
Te a m D e ve lo p m e n t
P e rform a n ce
Risk
Reporting Response
D e ve lo p m e n t
Soliciation
A d m in istra tive C lo su re
Risk Response
Control
Source Selection
Contract A d m in is tra tio n
Contract C lo se o u t
Initiating Process
Planning Process
Executing Process
Controlling Process
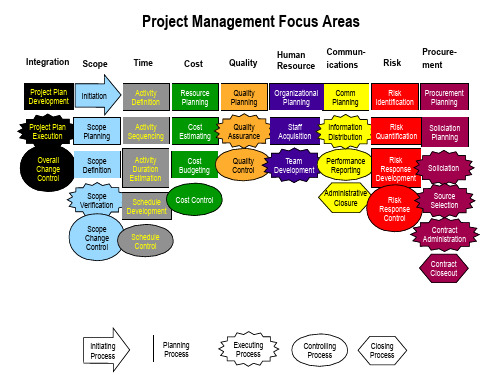
Project Management Focus Aห้องสมุดไป่ตู้eas
项目管理知识体系概览--资料
Performance Reporting
Risk Response Development
Soliciation
Administrative Closure
Risk Response
Control
Source Selection
Contract Administration
Contract Closeout
Team Development
Performance Improvements Input to Performance Appraisals
Organizational Planning
Role/Respons Assignments Staffing Mgmt Plan
Staff Acquisition
Activity Duration Estimates Basis of Estimates Activitly List Updates
Project Schedule Supporting Detail Schedule Mgmt Plan Resource ReqmtsUpdates
Project Plan Development
Procurement Planning
Soliciation Planning
Project staff assigned Procurement Mgmt Plan
Cost
Sequencing Estimating
Quality Assurance
Staff Acquisition
Information
Risk
Soliciation
Distribution Quantification Planning
- 1、下载文档前请自行甄别文档内容的完整性,平台不提供额外的编辑、内容补充、找答案等附加服务。
- 2、"仅部分预览"的文档,不可在线预览部分如存在完整性等问题,可反馈申请退款(可完整预览的文档不适用该条件!)。
- 3、如文档侵犯您的权益,请联系客服反馈,我们会尽快为您处理(人工客服工作时间:9:00-18:30)。
• The Project Quality Management processes are:
• Quality assurance is about using project processes effectively.
16
The Manage Quality process
• The Manage Quality process implements a set of planned and systematic acts and processes defined within the project’s quality management plan that helps to:
• Trends in Project Quality Management include but are not limited to:
– Customer satisfaction. Understand, evaluate, define, and manage requirements so that customer expectations
6
The cost of quality (COQ)
• The cost of quality (COQ) includes all costs incurred over the life of the product by investment in preventing nonconformance to requirements, appraising the product or service for conformance to requirements, and failing to meet requirements (rework).
17
Cause-and-Effect Diagram
18
Design for X (DfX)
• Design for X (DfX) is a set of technical guidelines that may be applied during the design of a product for the optimization of a specific aspect of the design.
– are met. – Continual improvement. The plan-do-check-act (PDCA) cycle is
the basis for quality improvement as defined by Shewhart and modified by Deming. – Management responsibility. Success requires the participation of all members of the project team. – Mutually beneficial partnership with suppliers. An organization and its suppliers are interdependent.
project; – Quality tools that will be used for the project; and – Major procedures relevant for the project, such as dealing with
nonconformance, corrective actions procedures, and continuous improvement procedures.
4
Project Quality Management
• Project Quality Management addresses the management of the project and the deliverables of the project.
• It applies to all projects, regardless of the nature of their deliverables.
7
Modern quality management approaches
• Modern quality management approaches seek to minimize variation and to deliver results that meet defined stakeholder requirements.
• Failure costs are often categorized into internal (found by the project team) and external (found by the customer).
• Failure costs are also called the cost of poor quality.
• For example:
– Meeting customer requirements by overworking the project team may result in decreased profits and increased levels of overall project risks, employee attrition, errors, or rework.
• Quality measures and techniques are specific to the type of deliverables being produced by the project.
5
Failure to meet the quality requirements
• Failure to meet the quality requirements can have serious negative consequences for any or all of the project’s stakeholders.
– Design an optimal and mature product by implementing specific design guidelines that address specific aspects of the product,
– Build confidence that a future output will be completed in a manner that meets the specified requirements and expectations through quality assurance tools and techniques such as quality audits and failure analysis,
– Quality standards that will be used by the project; – Quality objectives of the project; – Quality roles and responsibilities; – Project deliverables and processes subject to quality review; – Quality control and quality management activities planned for the
• DfX can control or even improve the product’s final characteristics.
• The X in DfX can be different aspects of product development, such as reliability, deployment, assembly, manufacturing, cost, service, usability, safety, and quality.
8
Plan Quality Management
9
Plan Quality Management: Data Flow Diagram
10
Cost of Quality
11
The SIPOC Model
12
The quality management plan
• The quality management plan is a component of the project management plan that describes how applicable policies, procedures, and guidelines will be implemented to achieve the quality objectives. The quality management plan may include but is not limited to the following components:
Software Project Management
Project quality management
Project Quality Management
• Project Quality Management includes the processes for incorporating the organization’s quality policy regarding planning, managing, and controlling project and product quality requirements in order to meet stakeholders’ objectives.