财务报表分析英文课件讲义资料
财务报表分析 英文ppt课件
By ledger, complete P&L and B/S forecast by month
Includes Cost of Quality, Cost Savings and Economics projections
Final Results
Versus Versus Versus Versus While While
Current Profit Increase Current Profit Increase Increase Of Return On Investment Increase Liquidity Minimizing Capital Expenditures The Day-to-day Business Needs
($0.2) $0.5 $0.0 $0.5 $0.8 -0.8%
Other Inc/Exp Admin / Cap Charge
($2.0) ($4.0)
($1.8) ($4.0)
($0.2) $0.0
Operating Profit ROS %
$39.0 15.6%
$37.1 15.3%
$1.9 0.3%
N Tax Manager
North Asia
O Tax Manager
India
P Director of Finance North Asia (Team of 5)
Q Country Controller
India (Team of 5)
R Finance Manager (20%)
Taiwan
S Tax Manager Asia Pacific
(2023)财务分析报告英文版课件(一)

(2023)财务分析报告英文版课件(一)2023财务分析报告英文版课件Introduction•Overview of the company•Financial highlights of the yearAnalysis of Income Statement•Revenue growth•Gross profit margin•Operating expenses•Net incomeAnalysis of Balance Sheet•Current assets and liabilities•Long-term assets and liabilities•Debt to equity ratio•Working capitalAnalysis of Cash Flow Statement•Operating cash flow•Investing cash flow•Financing cash flow•Free cash flowKey Performance Indicators (KPIs)•Return on Investment (ROI)•Return on Equity (ROE)•Earnings per Share (EPS)•Debt to Asset RatioConclusion•Summary of analysis•Recommendations for future improvement•Outlook for the company’s financial performance in the coming year.Analysis of Income StatementRevenue growth•Analysis of revenue growth in comparison to previous years•Analysis of revenue growth in comparison to industry standards•Factors that contributed to the change in revenueGross profit margin•Analysis of the company’s gross profit margin in comparison to previous years•Analysis of the company’s gross profit margin in comparison to industry standards•Examination of factors that contributed to changes in gross profit marginOperating expenses•Analysis of operating expenses and how they have changed over time•Comparison of operating expenses with industry standards •Examination of factors that contributed to changes in operating expensesNet income•Analysis of the company’s net income over time •Comparison of net income with industry standards •Examination of factors that contributed to changes in net incomeAnalysis of Balance SheetCurrent assets and liabilities•Analysis of the company’s current assets and how they have changed over time•Examination of the company’s current liabilities and how they have changed•Calculation of the current ratio and analysis of what it signifiesLong-term assets and liabilities•Analysis of the company’s long-term assets and how they have changed over time•Examination of the company’s long-term liabilities and how they have changed•Calculation of the debt to equity ratio and analysis of what it signifiesWorking capital•Analysis of the company’s working capital and how it has changed over time•Comparison of the company’s working capital with industry standards•Examination of factors that contributed to changes in working capitalAnalysis of Cash Flow StatementOperating cash flow•Analysis of the company’s operating cash flow over time •Comparison of the operating cash flow with industry standards•Examination of factors that contributed to changes in operating cash flowInvesting cash flow•Analysis of the company’s investing cash flow over time •Comparison of the investing cash flow with industry standards•Examination of factors that contributed to changes in investing cash flowFinancing cash flow•Analysis of the company’s financing cash flow over time •Comparison of the financing cash flow with industry standards•Examination of factors that contributed to changes in financing cash flowFree cash flow•Calculation of the company’s free cash flow and analysis of what it signifies•Analysis of the company’s free cash flow over time •Comparison of the company’s free cash flow with industry standardsKey Performance Indicators (KPIs)Return on Investment (ROI)•Calculation of ROI and analysis of what it signifies •Analysis of the company’s ROI over time•Comparison of the company’s ROI with industry standardsReturn on Equity (ROE)•Calculation of ROE and analysis of what it signifies •Analysis of the company’s ROE over time•Comparison of the company’s ROE with industry standardsEarnings per Share (EPS)•Calculation of EPS and analysis of what it signifies •Analysis of the company’s EPS over time•Comparison o f the company’s EPS with industry standardsDebt to Asset Ratio•Calculation of debt to asset ratio and analysis of what it signifies•Analysis of the company’s debt to asset ratio over time •Comparison of the company’s debt to asset ratio with industry standardsConclusionSummary of analysis•Overview of the company’s financial performance•Key findings from the analysis of the income statement, balance sheet, and cash flow statement•Analysis of the company’s KPIs and what they signifyRecommendations for future improvement•Suggestions for how the company can improve its financial performance•Recommendations for changes in strategy or investmentsOutlook for the company’s financial performance in the coming year.•Analysis of expected changes in the company’s financial performance•Evaluation of factors that could impact the company’s financial performance in the coming year.。
财务报表分析英文课件 (12)

CHAPTER
11
11-3
Earnings Persistence
• Earnings persistence is a key to effective equity analysis and valuation • Analyzing earnings persistence is a main analysis objective • Attributes of earnings persistence include:
Recasting and Adjusting
• Information for Recasting and Adjusting
– Income statement, including its subdivisions:
• Income from continuing operations • Income from discontinued operations • Extraordinary gains and losses • Cumulative effect of changes in accounting principles – Other financial statements and notes – Management’s Discussion and Analysis – Others: product-mix changes, technological innovations, work stoppages, and raw material constraints
财务报表介绍与分析讲义bpdc

其他資產 (Other Assets)
如遞延資產、出租資產、閒置資產、存出保證金。
(續前表)
負債及股東權益 流動負債
短期借款 應付票據及帳款 預收貨款 應付費用 其他流動負債 流動負債合計 長期負債 負債合計 股東權益 股本─普通股 資本公積 法定盈餘公積 未分配盈餘 股東權益合計
• 短期投資。 • 應收票據、應收帳款、應收關係人款項。 • 存貨。 • 預付費用。
資產 流動資產 現金 短期投資 應收票據及帳款 存貨 預付款項 其他流動資產 流動資產合計 長期投資 固定資產 成本:土地
建築物 機器設備 減:累計折舊 固定資產淨額
其他資產
資產合計
俊明公司資產負債表
93年12月31日
第一節 資產負債表 第二節 損益表 第三節 股東權益變動表與現金流量表 第四節 財務比率分析 第五節 經濟附加價值與市場附加價值
第一節 資產負債表
資產=負債 + 股東權益
流動資產 (Current Assets) 一年或一個營業週期內變現或耗用的資產。
• 現金與約當現金 (約當現金係指具高度流動性的資產, 例如三個月期的商業本票) 。
「股東權益變動表」之科目變化: 當年度稅後淨利。
當年度盈餘分配:法定盈餘公積、發放現金及股票股利。 當年度固定資產出售利益。 當年度轉列資本公積。
九十二年度 92年1月1日餘額 92年度盈餘分配: 提列法定盈餘公積 發放現金股利 92年度稅後淨利 固定資產出售利益 轉列資本公積
92年12月31日餘額
600,000 12.0
(續前表)
營業外收入 利息收入 投資收入 兌換盈益 處分固定資產利益 出租資產收入 其他收入 營業外收入合計
财务分析报告英文版ppt课件

Total current assets Non-current assets: Equity investment-long term Investment Property
Fixed assets Construction in process
整理版课件
9
Balance Sheet Crosswise Common-size
Current Assets: Monetary capital Notes receivable Accounts receivable Advance payment Accounts receivable-others
整理版课件
3
Company profile
Stock name: CHINT ELECTRICS Stock code: 601877
Is China's leading company in the field of low voltage electrical appliances
Adhere to the independent innovation, research and development a series of with independent intellectual property rights, reach the international advanced level of low voltage electric products
100.00% 100.00% 100.00% 100.00% 100.00% 100.00% 100.00% 100.00% 100.00%
5.09% 0.04% 4.58% 2.48% 1.97%
财务报表分析英文课件Chap5
Disaggregating ROA ROA = Profit Margin ratio * Asset turnover ratio
ATO measures the firm’s Ability to generate sales
At a given level of Investment in assets
Year 4 $ 475
280 53 22 18 16 - 16 389 - 16 = 373 86 + 16 = 102 26 + 4.8 = 30.8 60 + 16 – 4.8 = 71.2
Horrigan Corporation ROA
Average total assets of this company in year 4 (520+650)/2 = 585,
ROCE: return to common
Shareholders only
Return on Assets (ROA)
ROA presents profitability independent of the source of financing – Does not consider leverage – Measure of how well the firm uses its assets to generate income – As if the firm is financed by equity alone
How to increase ROA?-2
The evolution of ROA in the U.S.
the graphs in the next few slides are from Penman and Nissim Review of Accounting Studies, 2001
财务分析报告英文版ppt课件
可编辑课件PPT
2
CHINT ELECTRICS Is China's largest production of
low voltage electric appliance manufacturing enterprise, the specialty is engaged in distribution appliances, control electric appliances, terminal apparatus, and power electronic and electric power supply low-voltage products development, production and sales. Chint is recognized for a famous Chinese trademark, chint brand universal type circuit breaker, plastic shell type breaker series product has been awarded "China famous brand product" title. The company in 2004 won the Chinese quality management of the highest award, the national quality management award
17.83% 0.48% 0.09% 18.41% 43.10%
12.03% 28.24% 2.98% 11.83% 55.06% 1.84% 56.90% 100.00%
Balance Sheet Vertical Common-size Analysis
财务报表分析英文课件 (3)
Timeliness - periodic disclosure, not real-time basis Frequency - quarterly and annually Forward Looking - limited prospective information
o o
2-17
Accruals-The Cornerstone
2-2
CHAPTER
2
2-3
Statutory Financial Reports
Form 10-K (Annual Report)
10-Q (Quarterly Report)
20-F (Registration Statement/ Annual Report [Foreign]) 8-K (Current Report) 14-A (Proxy Statement/Prospectus) Other SEC Filings
Illustration - Case Facts
Establish company and invest $700 equity o Purchase plain T-shirts for $5 each o Fixed screen cost of $100 o Variable print cost of $0.75 per T-shirt o Sold 25 T-shirts at $10 each for cash o Sold 25 T-shirts at $10 each on credit
$250
Assets Cash
$275
$(675) $(425)
Equity Beginning Equity $700 Less net cash outflow (425) Total equity $275
财务报表分析英文课件Chap5

RNOA: Return on net operating assets Regression to the mean (回归到平均值)
Profit margin
Asset turnover
Revenue growth
Disaggregate PM
PM = (sales – COGS – SGA – depreciation ….)/Sales
2. But increased sales increases ATO while decreases PM
3. A dilemma!
4. So one has to increase sales and at the same time hold down costs and expenses, i.e., hold PM at certain level.
Accounts receivable turnover
• Measures how quickly a firm collects cash. • If A.R. turn over twice a year, then they average one half of a year in
collection. • Less time is preferred to more. • A high turnover is preferred to a low one. • The days of outstanding for account receivables: 365 days/accounts
Year 4 $ 475
280 53 22 18 16 389 86 26 60
Horrigan Corporation-assuming no debts
财务报表分析英文课件 (1)

– –
Case-6
Specialization in Financial Statement Analysis
• Analysis usually viewed from the perspective of a “typical” company • Recognizing the existence of several distinct factors
Case-5
Reporting on Financial Statement Analysis
•
– – –
A good analysis report typically contains at least six sections devoted to:
Executive summary. Brief summary focused on important analysis results; it launches the analysis report. Analysis overview. Background material on the company, its industry, and its economic environment. Evidential matter. Financial statements and information used in the analysis. Assumptions. Identification of important assumptions regarding a company’s industry and business environment, and other important assumptions for estimates and forecasts, including its business strategy. Crucial factors. Listing of important favorable and unfavorable factors, both quantitative and qualitative. Inferences. Includes forecasts, estimates, interpretations, and conclusions drawing on all prior sections of the report.
财务报表分析英文PPT课件

6-4
Examples of Internal Uses of Statement Analysis
Plan -- Focus on assessing the current financial position and evaluating potential firm opportunities. Control -- Focus on return on investment for various assets and asset efficiency. Understand -- Focus on understanding how suppliers of funds analyze the firm.
6-1
Carroll College, Waukesha, WI
After studying Chapter 6,
you should be able to:
Understand the purpose of basic financial statements and their contents.
6-3
Examples of External Uses of Statement Analysis
Trade Creditors -- Focus on the liquidity of the firm.
Bondholders -- Focus on the long-term cash flow of the firm.
Analyze a firm’s return on investment (i.e., “earning power”) and return on equity using a DuPont approach.
财务报表分析英文课件:ch4 Foundations of Ratio and Financial
2000
Sales Cost of goods sold
Gross profit Selling, general and administrative expenses Research and development costs Restructuring Costs Earnings from operations Interest expense and other costs (credits) Earnings before income taxes Provision for income taxes Net earnings
4
CHAPTER
Foundations of Ratio and Financial Analysis
1. Introduction
Financial statements users
Equity investor
Creditor
Long term earning power
short term long term
solvency analysis
ability of the firm to satisfy its longer-term debt and investment obligations
Profitability analysis
measures the income of the firm relative to its revenues and invested capital.
Pfizer
4 19 19 8 5 54% 8 26 4
100%
Takeda
24 17 17 8 3 69% 9 17 0
100%
P 115
财务报表分析英文课件Chap5
ROCE: return to common
Shareholders only
Return on Assets (ROA)
ROA presents profitability independent of the source of financing – Does not consider leverage – Measure of how well the firm uses its assets to generate income – As if the firm is financed by equity alone
risk of investment alternatives, and the role of analysis in providing risk and return information.
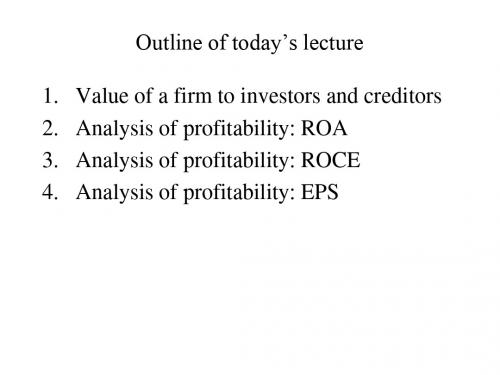
2. Understand the usefulness of the rate of return on assets (ROA) as a measure of a firm’s operating profitability.
3. Understand the usefulness of the rate of return on common shareholders’ equity (ROCE) as a measure of profitability.
4. Understand the strengths and weaknesses of earnings per common share as a measure of profitability.
The value of a firm to equity investors
risk
- 1、下载文档前请自行甄别文档内容的完整性,平台不提供额外的编辑、内容补充、找答案等附加服务。
- 2、"仅部分预览"的文档,不可在线预览部分如存在完整性等问题,可反馈申请退款(可完整预览的文档不适用该条件!)。
- 3、如文档侵犯您的权益,请联系客服反馈,我们会尽快为您处理(人工客服工作时间:9:00-18:30)。
Define, calculate, and categorize (according to liquidity, financial leverage, coverage, activity, and profitability) the major financial ratios and understand what they can tell us about the firm.
Prepaid Exp d
5 c. Amounts owed by
Accum Tax Prepay
10 customers.
Current Assetse $1,195 d. Future expense items
Fixed Assets (@Cost)f 1030 already paid.
Less: Acc. Depr. g
(329) e. Cash/likely convertible
Net Fix. Assets $ 701 to cash within 1 year.
Investment, LT
50 f. Original amount paid.
Other Assets, LT
223 g. Acc. deductions for
Use trend analysis, common-size analysis, and index analysis to 6-2 gain additional insights into a firm's performance.
Financial Statement Analysis
Financial Statements A Possible Framework for Analysis Balance Sheet Ratios Income Statement and Income Statement/Balance Sheet Ratios Trend Analysis Common-Size and Index Analysis
Define, calculate, and discuss a firm’s operating cycle and cash cycle.
Use ratios to analyze a firm's health and then recommend reasonable alternative courses of action to improve the health of the firm.
Basket Wonders Balance Sheet (thousands) Dec. 31, 2007a
Cash and C.E.
$ 90 a. How the firm stands on
Acct. Rec.c
394 a specific date.
Inventories
696 b. What BW owned.
6-7
Total Assets b $2,169 wear and tear.
Basket Wonders’ Balance Sheet (Liability Side)
Analyze a firm’s return on investment (i.e., “earning power”) and return on equity using a DuPont approach.
Understand the limitations of financial ratio analysis.
Chapter 6
Financial Statement Analysis
© Pearson Education Limited 2004
Fundamentals of Financial Management, 12/e
Created by: Gregory A. Kuhlemeyer, Ph.D.
6-1
Carroll College, Waukesha, WI
After studying Chapter 6,
you should be able to:
Understand the purpose of basic financial statements and their contents.
6-5
Primary Types of Financial Statements
Balance Sheet
A summary of a firm’s financial position on a given date that shows total assets = total liabilities + owners’ equity.
6-3
6-4
Examples of Internal Uses of Statement Analysis
Plan -- Focus on assessing the current financial position and evaluating potential firm opportunities. Control -- Focus on return on investment for various assets and asset efficiency. Understand -- Focus on understanding how suppliers oபைடு நூலகம் funds analyze the firm.
Income Statement
A summary of a firm’s revenues and expenses over a specified period, ending with net income or loss for the period.
6-6
Basket Wonders’ Balance Sheet (Asset Side)