配克鲁格曼国际经济学教程习题指导International Monetary Theory and Policyimoney10x
《国际经济学》教师手册及课后习题答案(克鲁格曼,第六版)imch13
HAPTER 13EXCHANGE RATES AND THE FOREIGN EXCHANGE MARKET: AN ASSET APPROACHChapter OrganizationExchange Rates and International TransactionsDomestic and Foreign PricesExchange Rates and Relative PricesBox: A Tale of Two DollarsThe Foreign Exchange MarketThe ActorsCharacteristics of the MarketSpot Rates and Forward RatesForeign Exchange SwapsFutures and OptionsThe Demand for Foreign Currency AssetsAssets and Asset ReturnsRisk and LiquidityInterest RatesExchange Rates and Asset ReturnsA Simple RuleReturn, Risk, and Liquidity in the Foreign Exchange MarketEquilibrium in the Foreign Exchange MarketInterest Parity: The Basic Equilibrium ConditionHow Changes in the Current Exchange Rate Affect Expected ReturnsThe Equilibrium Exchange RateInterest Rates, Expectations, and EquilibriumThe Effect of Changing Interest Rates on the Current Exchange RateThe Effect of Changing Expectations on the Current Exchange RateBox: The Perils of Forecasting Exchange RatesSummaryAppendix: Forward Exchange Rates and Covered Interest ParityCHAPTER OVERVIEWThe purpose of this chapter is to show the importance of the exchange rate in translating foreign prices into domestic values as well as to begin the presentation of exchange-rate determination. Central to the treatment of exchange-rate determination is the insight that exchange rates are determined in the same way as other asset prices. The chapter begins by describing how the relative prices of different countries' goods are affected by exchange rate changes. This discussion illustrates the central importance of exchange rates for cross-border economic linkages. The determination of the level of the exchange rate is modeled in the context of the exchange rate's role as the relative price of foreign and domestic currencies, using the uncovered interest parity relationship.The euro is used often in examples. Some students may not be familiar with the currency or aware of which countries use it; a brief discussion may be warranted. A full treatment of EMU and the theories surrounding currency unification appears in Chapter 20.The description of the foreign-exchange market stresses the involvement of large organizations (commercial banks, corporations, nonbank financial institutions, and central banks) and the highly integrated nature of the market. The nature of the foreign-exchange market ensures that arbitrage occurs quickly, so that common rates are offered worldwide. Forward foreign-exchange trading, foreign-exchange futures contracts and foreign-exchange options play an important part in currency market activity. The use of these financial instruments to eliminate short-run exchange-rate risk is described.The explanation of exchange-rate determination in this chapter emphasizes the modern view that exchange rates move to equilibrate asset markets. The foreign-exchange demand and supply curves that introduce exchange-rate determination in most undergraduate texts are not found here. Instead, there is a discussion of asset pricing and the determination of expected rates of return on assets denominated in different currencies.Students may already be familiar with the distinction between real and nominal returns. The text demonstrates that nominal returns are sufficient for comparing the attractiveness of different assets. There is a brief description of the role played by risk and liquidity in asset demand, but these considerations are not pursued in this chapter. (The role of risk is taken up again in Chapter 17.)Substantial space is devoted to the topic of comparing expected returns on assets denominated in domestic and foreign currency. The text identifies two parts of the expected return on a foreign-currency asset (measured in domestic-currency terms): the interest payment and the change in the value of the foreign currency relative to the domestic currency over the period in which the asset is held. The expected return on a foreign asset is calculated as a function of the current exchange rate for given expected values of the future exchange rate and the foreign interest rate.The absence of risk and liquidity considerations implies that the expected returns on all assets traded in the foreign-exchange market must be equal. It is thus a short step from calculations of expected returns on foreign assets to the interest parity condition. The foreign-exchange market is shown to be in equilibrium only when the interest parity condition holds. Thus, for given interest rates and given expectations about future exchange rates, interest parity determines the current equilibrium exchange rate. The interest parity diagram introduced here is instrumental in later chapters in which a more general model is presented. Since a command of this interest parity diagram is an important building block for future work, we recommend drills that employ this diagram.The result that a dollar appreciation makes foreign currency assets more attractive may appear counterintuitive to students -- why does a stronger dollar reduce the expected return on dollar assets? The key to explaining this point is that, under the static expectations and constant interest rates assumptions, a dollar appreciation today implies a greater future dollar depreciation; so, an American investor can expect to gain not only the foreign interest payment but also the extra return due to the dollar's additional future depreciation. The following diagram illustrates this point. In this diagram, the exchange rate at time t+1 is expected to be equal to E. If the exchange rate at time t is also E then expected depreciation is 0. If, however, the exchange rate depreciates at time t to E' then it must appreciate to reach E at time t+1. If the exchange rate appreciates today to E" then it must depreciate to reach E at time t+1. Thus, under static expectations, a depreciation today implies an expected appreciation and conversely.D om estic C urrencyF oreign C urrency E 'EE "Figure 13-1This pedagogic tool can be employed to provide some further intuition behind the interest parity relationship. Suppose that the domestic and foreign interest rates are equal. Interest parity then requires that expected depreciation is equal to zero and that the exchange rate today and next period is equal to E. If the domestic interest rate rises, people will want to hold more domestic-currency deposits. The resulting increased demand for domestic currency drives up the price of domestic currency, causing the exchange rate to appreciate. How long will this continue? The answer is that the appreciation of the domestic currency continues until the expected depreciation that is a consequence of the domestic currency's appreciation today just offsets the interest differential.The text presents exercises on the effects of changes in interest rates and of changes in expectations of the future exchange rate. These exercises can help develop students' intuition. For example, the initial result of a rise in U.S. interest rates is a higher demand for dollar-denominated assets and thus an increase in the price of the dollar. This dollar appreciation is large enough that the subsequent expected dollar depreciation just equalizes the expected return on foreign-currency assets (measured in dollar terms) and the higher dollar interest rate.The appendix describes the covered interest parity relationship and applies it to explain the determination of forward rates under risk neutrality as well as the high correlation between movements in spot and forward rates.ANSWERS TO TEXTBOOK PROBLEMS1. At an exchange rate of $1.50 per euro, the price of a bratwurst in terms of hot dogs is 3hot dogs per bratwurst. After a dollar appreciation to $1.25 per euro, the relative price of a bratwurst falls to 2.5 hot dogs per bratwurst.2. The Norwegian krone/Swiss franc cross rate must be 6 Norwegian krone per Swissfranc.3. The dollar rates of return are as follows:a. ($250,000 - $200,000)/$200,000 = 0.25.b. ($216 - $180)/$180 = 0.20.c. There are two parts of this return. One is the loss involved due to the appreciation ofthe dollar; the dollar appreciation is ($1.38 - $1.50)/$1.50 = -0.08. The other part of the return is the interest paid by the London bank on the deposit, 10 percent. (The size of the deposit is immaterial to the calculation of the rate of return.) In terms of dollars, the realized return on the London deposit is thus 2 percent per year.4. Note here that the ordering of the returns of the three assets is the same whether wecalculate real or nominal returns.a. The real return on the house would be 25% - 10% = 15%. This return could also becalculated by first finding the portion of the $50,000 nominal increase in the house's price due to inflation ($20,000), then finding the portion of the nominal increase due to real appreciation ($30,000), and finally finding the appropriate real rate of return ($30,000/$200,000 = 0.15).b. Again, subtracting the inflation rate from the nominal return we get 20%- 10% = 10%.c. 2% - 10% = -8%.5. The current equilibrium exchange rate must equal its expected future level since, withequality of nominal interest rates, there can be no expected increase or decrease in the dollar/pound exchange rate in equilibrium. If the expected exchange rate remains at $1.52 per pound and the pound interest rate rises to 10 percent, then interest parity is satisfied only if the current exchange rate changes such that there is an expected appreciation of the dollar equal to 5 percent. This will occur when the exchange rate rises to $1.60 per pound (a depreciation of the dollar against the pound).6. If market traders learn that the dollar interest rate will soon fall, they also reviseupward their expectation of the dollar's future depreciation in the foreign-exchange market. Given the current exchange rate and interest rates, there is thus a rise in the expected dollar return on euro deposits. The downward-sloping curve in the diagram below shifts to the right and there is an immediate dollar depreciation, as shown in the figure below where a shift in the interest-parity curve from II to I'I' leads to a depreciation of the dollar from E 0 to E 1.E($/euro i E 0 E 1Figure 13-2 7. The analysis will be parallel to that in the text. As shown in the accompanyingdiagrams, a movement down the vertical axis in the new graph, however, is interpreted as a euro appreciation and dollar depreciation rather than the reverse. Also, the horizontal axis now measures the euro interest rate. Figure 13-3 demonstrates that, given the expected future exchange rate, a rise in the euro interest rate from R 0 to R 1 will lead to a euro appreciation from E 0 to E 1.Figure 13-4 shows that, given the euro interest rate of i, the expectation of a stronger euro in the future leads to a leftward shift of the downward-sloping curve from II to I'I' and a euro appreciation (dollar depreciation) from E to E'. A rise in the dollar interest rate causes the same curve to shift rightward, so the euro depreciates against the dollar. This simply reverses the movement in figure 13-4, with a shift from I'I' to II, and a depreciation of the euro from E' to E. All of these results are the same as in the text when using the diagram for the dollar rather than the euro.EE 0rates o f return (in euro s) (euroE 101Figure 13-3Ei E (euro/$)E ’Figure 13-48. a. If the Federal Reserve pushed interest rates down, with an unchanged expected futureexchange rate, the dollar would depreciate (note that the article uses the term "downward pressure" to mean pressure for the dollar to depreciate). In terms of the analysis developed in this chapter, a move by the Federal Reserve to lower interest rates would be reflected in a movement from R to R' in figure 13.5, and a depreciation of the exchange rate from E to E'.If there is a "soft landing", and the Federal Reserve does not lower interest rates, thenthis dollar depreciation will not occur. Even if the Federal Reserve does lower interest rates a little, say from R to R", this may be a smaller decrease then what peopleinitially believed would occur. In this case, the expected future value of the exchange rate will be more appreciated than before, causing the interest-parity curve to shift in from II to I'I' (as shown in figure 13.6). The shift in the curve reflects the "optimism sparked by the expectation of a soft landing" and this change in expectations means that, with a fall in interest rates from R to R", the exchange rate depreciates from E to E", rather than from E to E *, which would occur in the absence of a change in expectations.ER ’ EE*Rrates of return (in dollars)EE Rrates of return (in dollars) E ”E *R ”Figure 13-6b.The "disruptive" effects of a recession make dollar holdings more risky. Risky assetsmust offer some extra compensation such that people willingly hold them as opposed to other, less risky assets. This extra compensation may be in the form of a bigger expected appreciation of the currency in which the asset is held. Given the expected future value of the exchange rate, a bigger expected appreciation is obtained by a more depreciated exchange rate today. Thus, a recession that is disruptive and makes dollar assets more risky will cause a depreciation of the dollar.9. The euro is less risky for you. When the rest of your wealth falls, the euro tends toappreciate, cushioning your losses by giving you a relatively high payoff in terms of dollars. Losses on your euro assets, on the other hand, tend to occur when they are least painful, that is, when the rest of your wealth is unexpectedly high. Holding the euro therefore reduces the variability of your total wealth.10. The chapter states that most foreign-exchange transactions between banks (whichaccounts for the vast majority of foreign-exchange transactions) involve exchanges of foreign currencies for U.S. dollars, even when the ultimate transaction involves the sale of one nondollar currency for another nondollar currency. This central role of the dollar makes it a vehicle currency in international transactions. The reason the dollar serves as a vehicle currency is that it is the most liquid of currencies since it is easy to find people willing to trade foreign currencies for dollars. The greater liquidity of the dollar as compared to, say, the Mexican peso, means that people are more willing to hold the dollar than the peso, and thus, dollar deposits can offer a lower interest rate, for any expected rate of depreciation against a third currency, than peso deposits for the same rate of depreciation against that third currency. As the world capital market becomes increasingly integrated, the liquidity advantages of holding dollar deposits as opposed to yen deposits will probably diminish. The euro represents an economy as large as the United States, so it is possible that it will assume some of that vehicle role of the dollar, reducing the liquidity advantages to as far as zero. Since the euro has no history as a currency, though, some investors may be leary of holding it until it has established a track record. Thus, the advantage may fade slowly.11. Greater fluctuations in the dollar interest rate lead directly to greater fluctuations in theexchange rate using the model described here. The movements in the interest rate can be investigated by shifting the vertical interest rate curve. As shown in figure 13.7,these movements lead directly to movements in the exchange rate. For example, an increase in the interest rate from i to i' leads to a dollar appreciation from E to E'. A decrease in the interest rate from i to i" leads to a dollar depreciation from E to E". This diagram demonstrates the direct link between interest rate volatility and exchange rate volatility, given that the expected future exchange rate does not change.EE($/foreign currency)rates of return (in dollars)iE ’i"i'E ”Figure 13-712. A tax on interest earnings and capital gains leaves the interest parity condition thesame, since all its components are multiplied by one less the tax rate to obtain after-tax returns. If capital gains are untaxed, the expected depreciation term in the interest parity condition must be divided by 1 less the tax rate. The component of the foreign return due to capital gains is now valued more highly than interest payments because it is untaxed.13. The forward premium can be calculated as described in the appendix. In this case, wefind the forward premium on euro to be (1.26 – 1.20)/1.20 = 0.05. The interest-rate difference between one-year dollar deposits and one-year euro deposits will be 5 percent because the interest difference must equal the forward premium on euro against dollars when covered interest parity holds.FURTHER READINGSJ. Orlin Grabbe. International Financial Markets, 3rd Edition. Englewood Cliffs: Prentice-Hall, 1996.Philipp Hartmann. Currency Competition and Foreign Exchange Rate Markets: The Dollar, the Yen, and the Euro. Cambridge: Cambridge University Press, 1999.John Maynard Keynes. A Tract on Monetary Reform. Chapter 3. London: Macmillan, 1923.Paul R. Krugman. "The International Role of the Dollar: Theory and Prospect." in John F.O. Bilson and Richard C. Marston, eds. Exchange Rate Theory and Practice. Chicago: University of Chicago Press, 1984, pp. 261-278.Richard Levich. International Financial Markets: Prices and Policies. Boston: Irwin McGraw-Hill, 1998.Richard K. Lyons. The Microstructure Approach to Exchange Rates. Cambridge: MIT Press, 2001.Ronald I. McKinnon. Money in International Exchange: The Convertible Currency System. New York: Oxford University Press, 1979.Michael Mussa. "Empirical Regularities in the Behavior of Exchange-rates and Theories of the Foreign-Exchange Market." in Karl Brunner and Allan H. Meltzer eds., Policies for Employment Prices and Exchange-Rates. Carnegie-Rochester Conference Series on Public Policy 11. Amsterdam: North-Holland Press, 1979.Julian Walmsley. The Foreign Exchange and Money Markets Guide. New York: John Wiley & Sons, 1992.99。
克鲁格曼《国际经济学》第八版课后答案(英文)-Ch18
Chapter 18The International Monetary System, 1870–1973Chapter OrganizationMacroeconomic Policy Goals in an Open EconomyInternal Balance: Full Employment and Price-Level StabilityExternal Balance: The Optimal Level of the Current Account International Macroeconomic Policy under the Gold Standard, 1870–1914 Origins of the Gold StandardExternal Balance under the Gold StandardThe Price-Specie-Flow MechanismThe Gold Standard “Rules of the Game”: Myth and RealityBox: Hume v. the MercantilistsInternal Balance under the Gold StandardCase Study: The Political Economy of Exchange Rate Regimes:Conflict over America’s Monetary Standard During the 1890s The Interwar Years, 1918–1939The Fleeting Return to GoldInternational Economic DisintegrationCase Study: The International Gold Standard and the Great DepressionThe Bretton Woods System and the International Monetary Fund Goals and Structure of the IMFConvertibility and the Expansion of Private Capital FlowsSpeculative Capital Flows and CrisesAnalyzing Policy Options under the Bretton Woods System Maintaining Internal BalanceMaintaining External BalanceExpenditure-Changing and Expenditure-Switching PoliciesThe External-Balance Problem of the United StatesCase Study: The Decline and Fall of the Bretton Woods System Worldwide Inflation and the Transition to Floating Rates SummaryChapter OverviewThis is the first of five international monetary policy chapters. These chapters complement the preceding theory chapters in several ways. They provide the historical and institutional background students require to place their theoretical knowledge in a useful context. The chapters also allow students, through study of historical and current events, to sharpen their grasp of the theoretical models and to develop the intuition those models can provide. (Application of the theory to events of current interest will hopefully motivate students to return to earlier chapters and master points that may have been missed on the first pass.)Chapter 18 chronicles the evolution of the international monetary system from the gold standard of1870–1914, through the interwar years, and up to and including the post-World War II Bretton Woods regime that ended in March 1973. The central focus of the chapter is the manner in which each system addressed, or failed to address, the requirements of internal and external balance for its participants.A country is in internal balance when its resources are fully employed and there is price level stability. External balance implies an optimal time path of the current account subject to its being balanced over the long run. Other factors have been important in the definition of external balance at various times, and these are discussed in the text. The basic definition of external balance as an appropriate current-account level, however, seems to capture a goal that most policy-makers share regardless of the particular circumstances.The price-specie-flow mechanism described by David Hume shows how the gold standard could ensure convergence to external balance. You may want to present the following model of the price-specie-flow mechanism. This model is based upon three equations: 1. The balance sheet of the central bank. At the most simple level, this is justgold holdings equals the money supply: G M.2. The quantity theory. With velocity and output assumed constant and bothnormalized to 1, this yields the simple equation M P.3. A balance of payments equation where the current account is a function of thereal exchange rate and there are no private capital flows: CA f(E P*/P)These equations can be combined in a figure like the one below. The 45 line represents the quantity theory, and the vertical line is the price level where the real exchange rate results in a balanced current account. The economy moves along the 45 line back towards the equilibrium Point 0 whenever it is out of equilibrium. For example, the loss of four-fifths of a country’s gold would put that country at Point a with lower prices and a lower money supply. The resulting real exchange rate depreciation causes a current account surplus which restores money balances as the country proceeds up the 45 line froma to 0.FigureThe automatic adjustment process described by the price-specie-flow mechanism is expedited by following “rules of the game” under which governments contract the domestic source components oftheir monetary bases when gold reserves are falling (corresponding to a current-account deficit) and expand when gold reserves are rising (the surplus case).In practice, there was little incentive for countries with expanding gold reserves to follow the “rules of the game.” This increased the contractionary burden shouldered by countries with persistent current account deficits. The gold standard also subjugated internal balance to the demands of external balance. Research suggests price-level stability and high employment were attained less consistently under the gold standard than in the post-1945 period.The interwar years were marked by severe economic instability. The monetization of war debt and of reparation payments led to episodes of hyperinflation in Europe. Anill-fated attempt to return to thepre-war gold parity for the pound led to stagnation in Britain. Competitive devaluations and protectionism were pursued in a futile effort to stimulate domestic economic growth during the Great Depression.These beggar-thy-neighbor policies provoked foreign retaliation and led to the disintegration of the world economy. As one of the case studies shows, strict adherence to the Gold Standard appears to have hurt many countries during the Great Depression.Determined to avoid repeating the mistakes of the interwar years, Allied economic policy-makers metat Bretton Woods in 1944 to forge a new international monetary system for the postwar world. The exchange-rate regime that emerged from this conference had at its center the . dollar. All other currencies had fixed exchange rates against the dollar, which itself had a fixed value in terms of gold.An International Monetary Fund was set up to oversee the system and facilitate its functioning by lending to countries with temporary balance of payments problems.A formal discussion of internal and external balance introduces the concepts of expenditure-switching and expenditure-changing policies. The Bretton Woods system, with its emphasis on infrequent adjustmentof fixed parities, restricted the use of expenditure-switching policies. Increases in U.S. monetary growth to finance fiscal expenditures after the mid-1960s led to a loss of confidence in the dollar and the termination of the dollar’s convertibility into gold. The analysis presented in the text demonstrateshow the Bretton Woods system forced countries to “import” inflation from the United States and shows that the breakdown of the system occurred when countries were no longer willing to accept this burden.Answers to Textbook Problems1. a. Since it takes considerable investment to develop uranium mines, you wouldwant a larger current account deficit to allow your country to finance some of the investment with foreign savings.b. A permanent increase in the world price of copper would cause a short-termcurrent account deficit if the price rise leads you to invest more in coppermining. If there are no investment effects, you would not change yourexternal balance target because it would be optimal simply to spend youradditional income.c. A temporary increase in the world price of copper would cause a currentaccount surplus. You would want to smooth out your country’s consumption bysaving some of its temporarily higher income.d. A temporary rise in the world price of oil would cause a current accountdeficit if you were an importer of oil, but a surplus if you were an exporter of oil.2. Because the marginal propensity to consume out of income is less than 1, atransfer of income from B to A increases savings in A and decreases savings in B.Therefore, A has a current account surplus and B has a corresponding deficit.This corresponds to a balance of payments disequilibrium in Hume’s world, which must be financed by gold flows from B to A. These gold flows increase A’s money supply and decrease B’s money supply, pushing up prices in A and depressingprices in B. These price changes cease once balance of payments equilibrium has been restored.3. Changes in parities reflected both initial misalignments and balance of paymentscrises. Attempts to return to the parities of the prewar period after the war ignored the changes in underlying economic fundamentals that the war caused. This made some exchange rates less than fully credible and encouraged balance ofpayments crises. Central bank commitments to the gold parities were also less than credible after the wartime suspension of the gold standard, and as a result of the increasing concern of governments with internal economic conditions.4. A monetary contraction, under the gold standard, will lead to an increase in thegold holdings of the contracting country’s central bank if other countries do not pursue a similar policy. All countries cannot succeed in doing thissimultaneously since the total stock of gold reserves is fixed in the short run.Under a reserve currency system, however, a monetary contraction causes anincipient rise in the domestic interest rate, which attracts foreign capital. The central bank must accommodate the inflow of foreign capital to preserve theexchange rate parity. There is thus an increase in the central bank’s holdings of foreign reserves equal to the fall in its holdings of domestic assets. There is no obstacle to a simultaneous increase in reserves by all central banksbecause central banks acquire more claims on the reserve currency country while their citizens end up with correspondingly greater liabilities.5. The increase in domestic prices makes home exports less attractive and causes acurrent account deficit. This diminishes the money supply and causescontractionary pressures in the economywhich serve to mitigate and ultimately reverse wage demands and price increases.6. A “demand determined” increase in dollar reserve holdings would not affect theworld supply of money as central banks merely attempt to trade their holdings of domestic assets for dollar rese rves. A “supply determined” increase in reserve holdings, however, would result from expansionary monetary policy in the United States (the reserve center). At least at the end of the Bretton Woods era the increase in world dollar reserves arose in part because of an expansionarymonetary policyin the United States rather than a desire by other central banks to increasetheir holdings of dollar assets. Only the “supply determined” increase indollar reserves is relevant for analyzing the relationship between world holdings of dollar reserves by central banks and inflation.7. An increase in the world interest rate leads to a fall in a central bank’sholdings of foreign reserves as domestic residents trade in their cash forforeign bonds. This leads to a d ecline in the home country’s money supply. The central bank of a “small” country cannot offset these effects sinceit cannot alter the world interest rate. An attempt to sterilize the reserve loss through open market purchases would fail unless bonds are imperfect substitutes.8. Capital account restrictions insulate the domestic interest rate from the worldinterest rate. Monetary policy, as well as fiscal policy, can be used to achieve internal balance. Because there are no offsetting capital flows, monetary policy, as well as fiscal policy, can be used to achieve internal balance. The costs of capital controls include the inefficiency which is introduced when the domestic interest rate differs from the world rate and the high costs of enforcing the controls.9. Yes, it does seem that the external balance problem of a deficit country is moresevere. While the macroeconomic imbalance may be equally problematic in the long run regardless of whether it is a deficit or surplus, large external deficits involve the risk that the market will fix the problem quickly by ceasing to fund the external deficit. In this case, there may have to be rapid adjustment that could be disruptive. Surplus countries are rarely forced into rapid adjustments, making the problems less risky.10. An inflow attack is different from capital flight, but many parallels exist. Inan “outflow” attack, speculators sell the home currency and drain the central bank of its foreign assets. The central bank could always defend if it so chooses (they can raise interest rates to improbably high levels), but if it is unwilling to cripple the economy with tight monetary policy, it must relent. An “inflow”attack is similar in that the central bank can always maintain the peg, it is just that the consequences of doing so may be more unpalatable than breaking the peg. If money flows in, the central bank must buy foreign assets to keep thecurrency from appreciating. If the central bank cannot sterilize all the inflows (eventually they may run out of domestic assets to sell to sterilize thetransactions where they are buying foreign assets), it will have to either let the currency appreciate or let the money supply rise. If it is unwilling to allow and increase in inflation due to a rising money supply, breaking the peg may be preferable.11. a. We know that China has a very large current account surplus, placing them highabove the XX line. They also have moderate inflationary pressures (describedas “gathering” in the question, implying they are not yet very strong). This suggests that China is above the II line, but not too far above it. It wouldbe placed in Zone 1 (see below).b. China needs to appreciate the exchange rate to move down on the graph towardsbalance. (Shown on the graph with the dashed line down)c. China would need to expand government spending to move to the right and hitthe overall balance point. Such a policy would help cushion the negative aggregate demand pressurethat the appreciation might generate.。
国际经济学克鲁格曼课后习题答案章完整版

国际经济学克鲁格曼课后习题答案章集团标准化办公室:[VV986T-J682P28-JP266L8-68PNN]第一章练习与答案1.为什么说在决定生产和消费时,相对价格比绝对价格更重要?答案提示:当生产处于生产边界线上,资源则得到了充分利用,这时,要想增加某一产品的生产,必须降低另一产品的生产,也就是说,增加某一产品的生产是有机会机本(或社会成本)的。
生产可能性边界上任何一点都表示生产效率和充分就业得以实现,但究竟选择哪一点,则还要看两个商品的相对价格,即它们在市场上的交换比率。
相对价格等于机会成本时,生产点在生产可能性边界上的位置也就确定了。
所以,在决定生产和消费时,相对价格比绝对价格更重要。
2.仿效图1—6和图1—7,试推导出Y商品的国民供给曲线和国民需求曲线。
答案提示:3.在只有两种商品的情况下,当一个商品达到均衡时,另外一个商品是否也同时达到均衡?试解释原因。
答案提示:4.如果生产可能性边界是一条直线,试确定过剩供给(或需求)曲线。
答案提示:5.如果改用Y商品的过剩供给曲线(B国)和过剩需求曲线(A国)来确定国际均衡价格,那么所得出的结果与图1—13中的结果是否一致?6.答案提示:国际均衡价格将依旧处于贸易前两国相对价格的中间某点。
7.说明贸易条件变化如何影响国际贸易利益在两国间的分配。
答案提示:一国出口产品价格的相对上升意味着此国可以用较少的出口换得较多的进口产品,有利于此国贸易利益的获得,不过,出口价格上升将不利于出口数量的增加,有损于出口国的贸易利益;与此类似,出口商品价格的下降有利于出口商品数量的增加,但是这意味着此国用较多的出口换得较少的进口产品。
对于进口国来讲,贸易条件变化对国际贸易利益的影响是相反的。
8.如果国际贸易发生在一个大国和一个小国之间,那么贸易后,国际相对价格更接近于哪一个国家在封闭下的相对价格水平?答案提示:贸易后,国际相对价格将更接近于大国在封闭下的相对价格水平。
克鲁格曼国际经济学第八版答案
克鲁格曼国际经济学第八版答案【篇一:克鲁格曼国际经济学课后答案英语版】labor productivity and comparative advantage: the ricardian modelanswers to textbook problems1. a. the production possibility curve is a straight line that intercepts the apple axis at 400(1200/3) and the banana axis at 600 (1200/2).b. the opportunity cost of apples in terms of bananas is 3/2. it takes three units of labor to harvest an apple but only two units of labor to harvest a banana. if one foregoes harvesting an apple, this frees up three units of labor. these 3 units of labor could then be used to harvest 1.5 bananas.c. labor mobility ensures a common wage in each sector and competition ensures the price of goods equals their cost of production. thus, the relative price equals the relative costs, which equals the wage times the unit labor requirement for apples divided by the wage times the unit labor requirement for bananas. since wages are equal across sectors, the price ratio equals the ratio of the unit labor requirement, which is 3 apples per 2 bananas.2. a. the production possibility curve is linear, with the intercept on the apple axis equal to160 (800/5) and the intercept on the banana axis equal to 800 (800/1).b. the world relative supply curve is constructed by determining the supply of apples relative to the supply of bananas at each relative price. the lowest relative price at which apples are harvested is 3 apples per 2 bananas. the relative supply curve is flat at this price. the maximum number of apples supplied at the price of 3/2 is 400 supplied by home while, at this price, foreign harvests 800 bananas and no apples, giving a maximum relative supply at this price of 1/2. this relative supply holds for any price between 3/2 and 5. at the price of 5, both countries would harvest apples. the relative supply curve is again flat at 5. thus, the relative supply curve is step shaped, flat at the price 3/2 from the relativesupply of 0 to 1/2, vertical at the relative quantity 1/2 risingfrom 3/2 to 5, and then flat again from 1/2 to infinity.3. a. the relative demand curve includes the points (1/5, 5), (1/2, 2), (1,1), (2,1/2).b. the equilibrium relative price of apples is found at the intersection of the relative demand and relative supply curves. this is the point (1/2, 2), where the relativedemand curve intersects the vertical section of the relative supply curve. thus the equilibrium relative price is 2.c. home produces only apples, foreign produces only bananas, and each country trades some of its product for the product of the other country.d. in the absence of trade, home could gain three bananas by foregoing two apples, and foreign could gain by one apple foregoing five bananas. trade allows each country to trade two bananas for one apple. home could then gain four bananas by foregoing two apples while foreign could gain one apple by foregoing only two bananas. each country is better off with trade.4.the increase in the number of workers at home shifts outthe relative supply schedulesuch that the corner points are at (1, 3/2) and (1, 5) instead of (1/2, 3/2) and (1/2, 5). the intersection of the relative demand and relative supply curves is now in the lower horizontal section, at the point (2/3, 3/2). in this case, foreign still gains from trade but the opportunity cost of bananas in terms of apples for home is the same whether or not there is trade, so home neither gains nor loses from trade.5.this answer is identical to that in 3. the amount of effective labor has not changedsince the doubling of the labor force is accompanied by a halving of the productivity of labor.6.this statement is just an example of the pauper labor argument discussed in the chapter.the point is that relative wage rates do not come out of thin air; they are determined by comparative productivity and the relative demand for goods. the box in the chapter providesdata which shows the strong connection between wages and productivity. koreas low wage presumably reflects the fact that korea is less productive than the united states in mostindustries. as the test example illustrated, a highly productive country that trades with a less productive, low-wage country will raise, not lower, its standard of living.7.the problem with this argument is that it does not use all the information needed fordetermining comparative advantage in production: this calculation involves the four unit labor requirements (for both the industry and service sectors, not just the two for the service sector). it is not enough to compare only services unit labor requirements. if als als*, home labor is more efficient than foreign labor in services. while this demonstrates that the united states has an absolute advantage in services, this is neithera necessary nor a sufficient condition for determining comparative advantage. for this determination, the industry ratios are also required. the competitive advantage of any industry depends on both the relative productivities of the industries and the relative wages across industries.8.while japanese workers may earn the equivalent wages of u.s. workers, the purchasingpower of their income is one-third less. this implies that although w=w* (more or less), pp* (since 3p=p*). since the united states is considerably more productive in services, service prices are relatively low. this benefits and enhances u.s. purchasing power. however, many of these services cannot be transported and hence, are not traded. this implies that the japanese may not benefit from the lower u.s. services costs, and do not face an international price which is lower than their domestic price. likewise, the price of services in united states does not increase with the opening of trade since these services are non-traded. consequently, u.s. purchasing power is higher than that of japan due to its lower prices on non-traded goods.9.gains from trade still exist in the presence of nontraded goods. the gains from tradedecline as the share of nontraded goods increases. in other words, the higher the portion of goods which do not enter international marketplace, the lower the potential gains from trade. if transport costs were high enough so that no goodswere traded then, obviously, there would be no gains from trade.10.the world relative supply curve in this case consists of a step function, with as manysteps (horizontal portions) as there are countries with different unit labor requirement ratios. any countries to the left of the intersection of the relative demand and relative supply curves export the good in which they have a comparative advantage relative to any country to the right of the intersection. if the intersection occurs in a horizontal portion then the country with that price ratio produces both goods.chapter 3specific factors and income distributionanswers to textbook problems1.texas and louisiana are states with large oil-producing sectors. the real wage of oil-producing factors of production in terms of other goods falls when the price of oil falls relative to the price of other goods. this was the source of economic decline in these states in 1986.2.to analyze the economys production possibility frontier, consider how the output mixchanges as labor is shifted between the two sectors.a. the production functions for goods 1 and 2 are standard plots with quantities on the vertical axis, labor on the horizontal axis, and q1= q1(k1,l1) with slope equal to the mpl1, and on another graph, q2= q2(k2,l2) with slope equal to thempl2.figure 3-1b. to graph the production possibilities frontier, combine the production function diagrams with the economys allocation of labor in a four quadrant diagram. the economys ppf is in the upper right hand corner, as is illustrated in the four quadrant diagram above. the ppf is curved due to declining marginal product of labor in each good.3. a. to solve this problem, one can graph the demand curve for labor in sector 1,represented by (w=mpl1=demand for l1) and the demand curve for labor in sector 2, represented by (w=mpl2=demand for l2) . since the total supply of labor is given by the horizontalaxis, the labor allocation between the sectors is approximately l1=27 and l2=73. the wage rate is approximately $0.98.wl127l2figure 3-2 100lb. use the same type of graph as in problem 2b to show that sectoral output is q1=44 and q2=90. (this involves combining the production function diagrams with the economys allocation of labor in a four quadrant diagram. the economys ppf is in the upper right hand corner, as illustrated in the text.)e a graph of labor demands, as in part a, to show that the intersection of the demand curves for labor occurs at a wage rate approximately equal to $0.74. the relative decline in the price of good 2 caused labor to be reallocated: labor is drawn out of production of good 2 and enters production of good 1 (l1=62, l2=38). this also leads【篇二:克鲁格曼《国际经济学》第八版课后答案(英文)-ch18】monetary system, 1870–1973? chapter organizationmacroeconomic policy goals in an open economyinternal balance: full employment and price-level stabilityexternal balance: the optimal level of the current accountinternational macroeconomic policy under the gold standard, 1870–1914origins of the gold standardexternal balance under the gold standardthe price-specie-flow mechanismthe gold standard “rules of the game”: myth and realitybox: hume v. the mercantilistsinternal balance under the gold standardcase study: the political economy of exchange rate regimes: conflict over america’s monetary standard during the 1890sthe interwar years, 1918–1939the fleeting return to goldinternational economic disintegrationcase study: the international gold standard and the great depressionthe bretton woods system and the international monetary fundgoals and structure of the imfconvertibility and the expansion of private capital flowsspeculative capital flows and crisesanalyzing policy options under the bretton woods systemmaintaining internal balancemaintaining external balanceexpenditure-changing and expenditure-switching policiesthe external-balance problem of the united statescase study: the decline and fall of the bretton woods systemworldwide inflation and the transition to floating ratessummarychapter 18 the international monetary system, 1870–1973 95 ? chapter overviewthis is the first of five international monetary policy chapters. these chapters complement the preceding theory chapters in several ways. they provide the historical and institutional background students require to place their theoretical knowledge in a useful context. the chapters also allow students, through study of historical and current events, to sharpen their grasp of the theoretical models and to develop the intuition those models can provide. (application of the theory to events of current interest will hopefully motivate students to return to earlier chapters and master points that may have been missed on the first pass.) chapter 18 chronicles the evolution of the international monetary system from the gold standard of 1870–1914, through the interwar years, andup to and including the post-world war ii bretton woods regime that ended in march 1973. the central focus of the chapter is the manner in which each system addressed, or failed to address, the requirements of internal and external balance for its participants. a country is in internal balance when its resources are fully employed and there is price level stability. external balance implies an optimal time path of the current account subject to its being balanced over the long run. other factors have been important in the definition of external balance at various times, and these are discussed in the text. the basic definition of external balance as an appropriate current-account level, however, seems to capture a goal that most policy-makers share regardless of the particular circumstances. the price-specie-flow mechanism described bydavid hume shows how the gold standard could ensure convergence to external balance. you may want to present the following model of the price-specie-flow mechanism. this model is based upon three equations:1.2.3. the balance sheet of the central bank. at the most simple level, this is just gold holdings equals the money supply: g ? m. the quantity theory. with velocity and output assumed constant and both normalized to 1, this yields the simple equation m ? p.a balance of payments equation where the current account is a function of the real exchange rate andthere are no private capital flows: ca ? f(e ? p*/p)these equations can be combined in a figure like the one below. the 45? line represents the quantity theory, and the vertical line is the price level where the real exchange rate results in a balanced current account. the economy moves along the 45? line back towards the equilibrium point 0 whenever it is out of equilibrium. for example, the loss of four-fifths of a country’s gold would put that country at point a with lower prices and a lower money supply. the resulting real exchange rate depreciation causes a current account surplus which restores money balances as the country proceeds upthe 45? line from ato 0.figure 18.1the automatic adjustment process described by the price-specie-flow mechanism is expedited by following “rules of the game” under which governments contract the domestic source components oftheir monetary bases when gold reserves are falling (corresponding to a current-account deficit) and expand when gold reserves are rising (the surplus case).in practice, there was little incentive for countries with expanding gold reserves to follow the “rules of the game.” this increased the contractionary burden shouldered by countries with persistent current account deficits. the gold standard also subjugated internal balance to the demands of external balance. research suggests price-level stability and highemployment were attained less consistently under the gold standard than in the post-1945 period.the interwar years were marked by severe economic instability. the monetization of war debt and of reparation payments led to episodes of hyperinflation in europe. an ill-fated attempt to return to the pre-war gold parity for the pound led to stagnation in britain. competitive devaluations and protectionism were pursued in a futile effort to stimulate domestic economic growth during the great depression. these beggar-thy-neighbor policies provoked foreign retaliation and led to the disintegration of the world economy. as one of the case studies shows, strict adherence to the gold standard appears to have hurt many countries during the great depression.determined to avoid repeating the mistakes of the interwar years, allied economic policy-makers met at bretton woods in 1944 to forge a new international monetary system for the postwar world. the exchange-rate regime that emerged from this conference had at its center the u.s. dollar. all other currencies had fixed exchange rates against the dollar, which itself had a fixed value in terms of gold. an international monetary fund was set up to oversee the system and facilitate its functioning by lending to countries with temporary balance of payments problems.a formal discussion of internal and external balance introduces the concepts of expenditure-switching and expenditure-changing policies. the bretton woods system, with its emphasis on infrequent adjustment of fixed parities, restricted the use of expenditure-switching policies. increases in u.s. monetary growth to finance fiscal expenditures after the mid-1960s led to a loss of confidence in the dollar and the termination of the dollar’s convertibil ity into gold. the analysis presented in the text demonstrateshow the bretton woods system forced countries to “import” inflation from the united states and shows that the breakdown of the system occurred when countries were no longer willing to accept this burden. ? answers to textbook problems1. a. since it takes considerable investment to develop uranium mines, you would want a larger currentaccount deficit to allow your country to finance some of the investment with foreign savings.b. a permanent increase in the world price of copper would cause a short-term current accountdeficit if the price rise leads you to invest more in copper mining. if there are no investmenteffects, you would not change your external balance target because it would be optimal simply to spend your additional income.c. a temporary increase in the world price of copper would cause a current account surplus. youwould want to smooth out your country’s consumption by saving some of its temporarily higher income.d. a temporary rise in the world price of oil would cause a current account deficit if you were animporter of oil, but a surplus if you were an exporter of oil. chapter 18 the international monetary system, 1870–1973 972. because the marginal propensity to consume out of income is less than 1, a transfer of income from bto a increases savings in a and decreases savings in b. therefore, a has a current account surplus and b has a corresponding deficit. this corresponds to a balance of payments disequilibrium inhume’s world, which must be financed by gold flows from b to a. these gold flows increase a’s money supply and decrease b’s money supply, pushing up prices in a and depressing prices in b.these price changes cease once balance of payments equilibrium has been restored.3. changes in parities reflected both initial misalignments and balance of payments crises. attempts toreturn to the parities of the prewar period after the war ignored the changes in underlying economic fundamentals that the war caused. this made some exchange rates less than fully credible andencouraged balance of payments crises. central bank commitments to the gold parities were also less than credible after the wartime suspension of the gold standard, and as a result of the increasingconcern of governments with internal economic conditions.4. a monetary contraction, under the gold standard, will lead to an increase in the gold holdings of thecontracting country’s central bank if other countries do not pursue a similar policy. all countriescannot succeed in doing this simultaneously since the total stock of gold reserves is fixed in the short run. under a reserve currency system, however, a monetary contraction causes an incipient rise in the domestic interest rate, which attracts foreign capital. the central bank must accommodate the inflow of foreign capital to preserve the exchange rate parity. there is thus an increase in the central bank’s holdings of foreign reserves equal to the fall in its holdings of domestic assets. there is no obstacle to a simultaneous increase in reserves by all central banks because central banks acquire more claims on the reserve currency country while their citizens end up with correspondingly greater liabilities.5. the increase in domestic prices makes home exports less attractive and causes a current accountdeficit. this diminishes the money supply and causes contractionary pressures in the economywhich serve to mitigate and ultimately reverse wage demands and price increases.6. a “demand determined” increase in dollar reserve holdings would not affect the world supply ofmoney as central banks merely attempt to trade their holdings of domestic assets for dollar reserves.a “supply determined” increase in reserve holdings, however, would result from expansionarymonetary policy in the united states (the reserve center). at least at the end of the bretton woods era the increase in world dollar reserves arose in part because of an expansionary monetary policy in the united states rather than a desire by other central banks to increase their holdings of dollar assets. only the “supply determined” increase in dollar reserves is relevant for analyzing therelationship between world holdings of dollar reserves by central banks and inflation.7. an increase in the world interest rate leads to a fall in a central bank’s holdings of foreign reserves asdomestic residents trade in their cash for foreign bonds. this leads to a decline in the home country’s money supply. the central bank of a “small” country cannot offset these effects sinceit cannot alter the world interest rate. an attempt to sterilize the reserve loss through open market purchases would fail unless bonds are imperfect substitutes.8. capital account restrictions insulate the domestic interest rate from the world interest rate. monetarypolicy, as well as fiscal policy, can be used to achieve internal balance. because there are nooffsetting capital flows, monetary policy, as well as fiscal policy, can be used to achieve internalbalance. the costs of capital controls include the inefficiency which is introduced when the domestic interest rate differs from the world rate and the high costs of enforcing the controls.9. yes, it does seem that the external balance problem of a deficit country is more severe. while themacroeconomic imbalance may be equally problematic in the long run regardless of whether it is a deficit or surplus, large external deficits involve the risk that the market will fix the problem quickly by ceasing to fund the external deficit. in this case, there may have to be rapid adjustment that could be disruptive. surplus countries are rarely forced into rapid adjustments, making the problems less risky.10. an inflow attack is different from capital flight, but many parallels exist. in an “outflow” attack,speculators sell the home currency and drain the central bank of its foreign assets. the central bank could always defend if it so chooses (they can raise interest rates to improbably high levels), but if it is unwilling to cripple the economy with tight monetar y policy, it must relent. an “inflow” attack issimilar in that the central bank can always maintain the peg, it is just that the consequences of doing so may be more unpalatable than breaking the peg. if money flows in, the central bank must buy foreign assets to keep the currency from appreciating. if the central bank cannot sterilize all the inflows (eventually they may run out of domestic assets to sell to sterilize the transactions where they are buying foreignassets), it will have to either let the currency appreciate or letthe money supply rise. if it is unwilling to allow and increase in inflation due to a rising money supply, breaking the peg maybe preferable.11. a. we know that china has a very large current account surplus, placing them high above the xxline. they also have moderate inflationary pressures (described as “gathering” in the question, implying they arenot yet very strong). this suggests that china is above the ii line, but not too farabove it. it would be placed in zone 1 (see below).b. china needs to appreciate the exchange rate to move down on the graph towards balance.(shown on the graph with the dashed line down)c. china would need to expand government spending to moveto the right and hit the overall balancepoint. such a policy would help cushion the negativeaggregate demand pressurethat the appreciation might generate.【篇三:克鲁格曼《国际经济学》计算题及答案】0名劳动力,如果生产棉花的话,a国的人均产量是2吨,b国也是2吨;要是生产大米的话,a国的人均产量是10吨,b国则是16吨。
克鲁格曼《国际经济学》(国际金融部分)课后习题答案(英文版)第一章
克鲁格曼《国际经济学》(国际金融部分)课后习题答案(英文版)第一章CHAPTER 1INTRODUCTIONChapter OrganizationWhat is International Economics About?The Gains from TradeThe Pattern of TradeProtectionismThe Balance of PaymentsExchange-Rate DeterminationInternational Policy CoordinationThe International Capital MarketInternational Economics: Trade and MoneyCHAPTER OVERVIEWThe intent of this chapter is to provide both an overview of the subject matter of international economics and to provide a guide to the organization of the text. It is relatively easy for an instructor to motivate the study of international trade and finance. The front pages of newspapers, the covers of magazines, and the lead reports of television news broadcasts herald the interdependence of the U.S. economy with the rest of the world. This interdependence may also be recognized by students through their purchases of imports of all sorts of goods, their personal observations of the effects of dislocations due to international competition, and their experience through travel abroad.The study of the theory of international economics generates an understanding of many key events that shape our domesticand international environment. In recent history, these events include the causes and consequences of the large current account deficits of the United States; the dramatic appreciation of the dollar during the first half of the 1980s followed by its rapid depreciation in the second half of the 1980s; the Latin American debt crisis of the 1980s and the Mexico crisis in late 1994; and the increased pressures for industry protection against foreign competition broadly voiced in the late 1980s and more vocally espoused in the first half of the 1990s. Most recently, the financial crisis that began in East Asia in 1997 andspread to many countries around the globe and the Economic and Monetary Union in Europe have highlighted the way in which various national economies are linked and how important it is for us to understand these connections. At the same time, protests at global economic meetings have highlighted opposition to globalization. The text material will enable students to understand the economic context in which such events occur.Chapter 1 of the text presents data demonstrating the growth in trade and increasing importance of international economics. This chapter also highlights and briefly discusses seven themes which arise throughout the book. These themes include: 1) the gains from trade;2) the pattern of trade; 3) protectionism; 4), the balance of payments; 5) exchange rate determination; 6) international policy coordination; and 7) the international capital market. Students will recognize that many of the central policy debates occurring today come under the rubric of one of these themes. Indeed, it is often a fruitful heuristic to use current events to illustrate the force of the key themes and arguments which are presentedthroughout the text.。
克鲁格曼《国际经济学》(国际金融)习题标准答案要点

克鲁格曼《国际经济学》(国际金融)习题答案要点————————————————————————————————作者:————————————————————————————————日期:23 《国际经济学》(国际金融)习题答案要点第12章 国民收入核算与国际收支1、如问题所述,GNP 仅仅包括最终产品和服务的价值是为了避免重复计算的问题。
在国民收入账户中,如果进口的中间品价值从GNP 中减去,出口的中间品价值加到GNP 中,重复计算的问题将不会发生。
例如:美国分别销售钢材给日本的丰田公司和美国的通用汽车公司。
其中出售给通用公司的钢材,作为中间品其价值不被计算到美国的GNP 中。
出售给日本丰田公司的钢材,钢材价值通过丰田公司进入日本的GNP ,而最终没有进入美国的国民收入账户。
所以这部分由美国生产要素创造的中间品价值应该从日本的GNP 中减去,并加入美国的GNP 。
2、(1)等式12-2可以写成()()p CA S I T G =-+-。
美国更高的进口壁垒对私人储蓄、投资和政府赤字有比较小或没有影响。
(2)既然强制性的关税和配额对这些变量没有影响,所以贸易壁垒不能减少经常账户赤字。
不同情况对经常账户产生不同的影响。
例如,关税保护能提高被保护行业的投资,从而使经常账户恶化。
(当然,使幼稚产业有一个设备现代化机会的关税保护是合理的。
)同时,当对投资中间品实行关税保护时,由于受保护行业成本的提高可能使该行业投资下降,从而改善经常项目。
一般地,永久性和临时性的关税保护有不同的效果。
这个问题的要点是:政策影响经常账户方式需要进行一般均衡、宏观分析。
3、(1)、购买德国股票反映在美国金融项目的借方。
相应地,当美国人通过他的瑞士银行账户用支票支付时,因为他对瑞士请求权减少,故记入美国金融项目的贷方。
这是美国用一个外国资产交易另外一种外国资产的案例。
(2)、同样,购买德国股票反映在美国金融项目的借方。
当德国销售商将美国支票存入德国银行并且银行将这笔资金贷给德国进口商(此时,记入美国经常项目的贷方)或贷给个人或公司购买美国资产(此时,记入美国金融项目的贷方)。
《国际经济学》克鲁格曼(第六版)习题答案imsect3
OVERVIEW OF SECTION III: EXCHANGE RATES AND OPEN ECONOMY MACROECONOMICSSection III of the textbook is comprised of six chapters:Chapter 12 National Income Accounting and the Balance of PaymentsChapter 13 Exchange Rates and the Foreign Exchange Market: An Asset Approach Chapter 14 Money, Interest Rates, and Exchange RatesChapter 15 Price Levels and the Exchange Rate in the Long RunChapter 16 Output and the Exchange Rate in the Short RunChapter 17 Fixed Exchange Rates and Foreign Exchange InterventionSECTION III OVERVIEWThe presentation of international finance theory proceeds by building up an integrated model of exchange rate and output determination. Successive chapters in Part III construct this model step by step so students acquire a firm understanding of each component as well as the manner in which these components fit together. The resulting model presents a single unifying framework admitting the entire range of exchange rate regimes from pure float to managed float to fixed rates. The model may be used to analyze both comparative static and dynamic time path results arising from temporary or permanent policy or exogenous shocks in an open economy.The primacy given to asset markets in the model is reflected in the discussion of national income and balance of payments accounting in the first chapter of this section. Chapter 12 begins with a discussion of the focus of international finance. The discussion then proceeds to national income accounting in an open economy. The chapter points out, in the discussion on the balance of payments account, that current account transactions must be financed by financial account flows from either central bank or noncentral bank transactions. A case study uses national income accounting identities to consider the link between government budget deficits and the current account.Observed behavior of the exchange rate favors modeling it as an asset price rather than as a goods price. Thus, the core relationship for short-run exchange-rate determination in the model developed in Part III is uncovered interest parity. Chapter 13 presents a model inwhich the exchange rate adjusts to equate expected returns on interest-bearing assets denominated in different currencies given expectations about exchange rates, and the domestic and foreign interest rate. This first building block of the model lays the foundation for subsequent chapters that explore the determination of domestic interest rates and output, the basis for expectations of future exchange rates and richer specifications of the foreign-exchange market that include risk. An appendix to this chapter explains the determination of forward exchange rates.Chapter 14 introduces the domestic money market, linking monetary factors to short-run exchange-rate determination through the domestic interest rate. The chapter begins with a discussion of the determination of the domestic interest rate. Interest parity links the domestic interest rate to the exchange rate, a relationship captured in a two-quadrant diagram. Comparative statics employing this diagram demonstrate the effects of monetary expansion and contraction on the exchange rate in the short run. Dynamic considerations are introduced through an appeal to the long run neutrality of money that identifies a long-run steady-state value toward which the exchange rate evolves. The dynamic time path of the model exhibits overshooting of the exchange-rate in response to monetary changes.Chapter 15 develops a model of the long run exchange rate. The long-run exchange rate plays a role in a complete short-run macroeconomic model since one variable in that model is the expected future exchange rate. The chapter begins with a discussion of the law of one price and purchasing power parity. A model of the exchange rate in the long-run based upon purchasing power parity is developed. A review of the empirical evidence, however, casts doubt on this model. The chapter then goes on to develop a general model of exchange rates in the long run in which the neutrality of monetary shocks emerges as a special case. In contrast, shocks to the output market or changes in fiscal policy alter the long run real exchange rate. This chapter also discusses the real interest parity relationship that links the real interest rate differential to the expected change in the real exchange rate. An appendix examines the relationship of the interest rate and exchange rate under a flexible-price monetary approach.Chapter 16 presents a macroeconomic model of output and exchange-rate determination in the short run. The chapter introduces aggregate demand in a setting of short-run price stickiness to construct a model of the goods market. The exchange-rate analysis presented in previous chapters provides a model of the asset market. The resulting model is, in spirit, very close to the classic Mundell-Fleming model. This model is used to examine the effects of avariety of policies. The analysis allows a distinction to be drawn between permanent and temporary policy shifts through the pedagogic device that permanent policy shifts alter long-run expectations while temporary policy shifts do not. This distinction highlights the importance of exchange-rate expectations on macroeconomic outcomes. A case study of U.S. fiscal and monetary policy between 1979 and 1983 utilizes the model to explain notable historical events. The chapter concludes with a discussion of the links between exchange rate and import price movements which focuses on the J-curve and exchange-rate pass-through. An appendix to the chapter compares the IS-LM model to the model developed in this chapter. A second appendix considers intertemporal trade and consumption demand. A third appendix discusses the Marshall-Lerner condition and estimates of trade elasticities.The final chapter of this section discusses intervention by the central bank and the relationship of this policy to the money supply. This analysis is blended with the previous chapter's short-run macroeconomic model to analyze policy under fixed rates. The balance sheet of the central bank is used to keep track of the effects of foreign exchange intervention on the money supply. The model developed in previous chapters is extended by relaxing the interest parity condition and allowing exchange-rate risk to influence agents' decisions. This allows a discussion of sterilized intervention. Another topic discussed in this chapter is capital flight and balance of payments crises with an introduction to different models of how a balance of payments or currency crisis can occur. The analysis also is extended to a two-country framework to discuss alternative systems for fixing the exchange-rate as a prelude to Part IV. An appendix to Chapter 17 develops a model of the foreign-exchange market in which risk factors make domestic-currency and foreign-currency assets imperfect substitutes.A second appendix explores the monetary approach to the balance of payments. The third appendix discusses the timing of a balance of payments crisis.。
克鲁格曼《国际经济学》(第8版)课后习题详解(第16章 产出与短期汇率)【圣才出品】
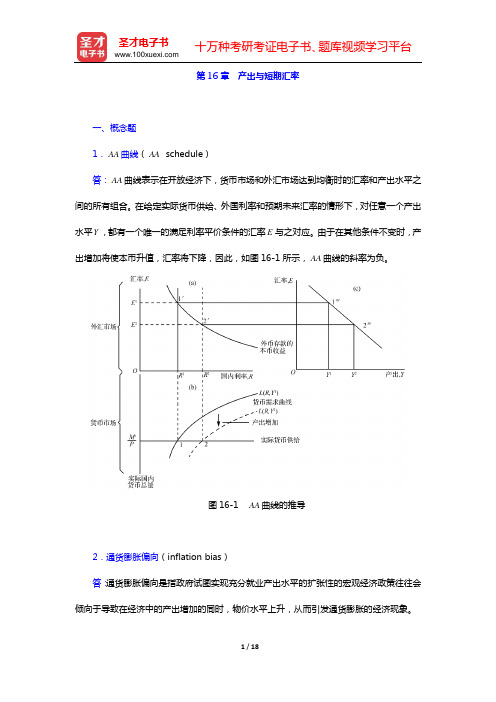
第16章产出与短期汇率一、概念题1.AA曲线(AA schedule)答:AA曲线表示在开放经济下,货币市场和外汇市场达到均衡时的汇率和产出水平之间的所有组合。
在给定实际货币供给、外国利率和预期未来汇率的情形下,对任意一个产出水平Y,都有一个唯一的满足利率平价条件的汇率E与之对应。
由于在其他条件不变时,产出增加将使本币升值,汇率将下降,因此,如图16-1所示,AA曲线的斜率为负。
图16-1 AA曲线的推导2.通货膨胀偏向(inflation bias)答:通货膨胀偏向是指政府试图实现充分就业产出水平的扩张性的宏观经济政策往往会倾向于导致在经济中的产出增加的同时,物价水平上升,从而引发通货膨胀的经济现象。
3.总需求(aggregate demand)答:总需求是“总供给”的对称,是指一个国家的各个市场主体依据一定的收入和价格水平,在一定时期内通过市场反映出来的购买产品和服务的计划支出总量。
总需求通常由四个部分构成,即消费总支出、投资总支出、政府总支出和净出口总额。
在最新的国民核算体系中,政府总支出被分解为政府消费和政府投资,分别归入消费总支出和投资总支出。
因此,总需求的构成又被认为是:总需求=总消费+总投资+净出口。
4.J曲线(J-curve)答:J曲线是描述货币贬值所引起的经常项目净收入变化轨迹的曲线。
J曲线如图16-2所示。
一国货币贬值会引起国际收支中经常项目净收入先降后升,呈J形变化轨迹。
本国货币贬值直接造成对外贸易收入的减少,引起国际收支恶化,甚至会出现赤字。
但另一方面,本国货币贬值也有利于对外贸易,尤其是出口商品的外币价格下降提高了产品的国际竞争力。
因此,经过一个时期的调整之后,赤字将会被消除,经常项目转为盈余。
这种变化隐含的假设是:进出口对本国货币贬值所引起的相对价格变化反应迟缓,因而原有的进出口状况在本国货币贬值之后的一个时期内还将维持。
这时如果出口商和进口商都按调整后的汇率报价,那么出口所得的外汇就会减少,为进口所支付的货币就会增加。
- 1、下载文档前请自行甄别文档内容的完整性,平台不提供额外的编辑、内容补充、找答案等附加服务。
- 2、"仅部分预览"的文档,不可在线预览部分如存在完整性等问题,可反馈申请退款(可完整预览的文档不适用该条件!)。
- 3、如文档侵犯您的权益,请联系客服反馈,我们会尽快为您处理(人工客服工作时间:9:00-18:30)。
• Increase money supply to stimulate output. ⇒ Exchange rate is under depreciation pressure. ⇒ Money supply must be reduced to its original level. Fiscal Policy
´ Xavier Mateos-Planas and Akos Valentinyi 6
International Monetary Theory and Policy, EC247/347
Week 10, Autumn 2003
International Monetary Theory and Policy, EC247/347
´ Xavier Mateos-Planas and Akos Valentinyi 5
Fixing the Exchange Rate to Escape from Liquidity Trap • Liquidity trap ◦ Monetary policy cannot stimulate the economy by incrasing the money supply (liquidity). ◦ Example: nominal interest rate already zero (it cannot be negative) ⇒ Further increase in money supply has no effect on the interest rate. ⇒ If output is lower than its natural level, monetary policy cannot effect it. • Interest parity condition with R = 0 Ee − E ∗ 0=R=R + E e E ⇒ E= 1 − R∗ • Escaping from liquidity trap ◦ Monetary expansion has no effect on output (output is trapped). ◦ Central bank has to peg the exchange rate at a level higher than E e. ⇒ Currency depreciates. ⇒ World demand for domestic goods rises.
3
Y1
1
Y2
2
• Key fact 1: ◦ Monetary policy is an ineffective tool of stabilization whereas fiscal policy is an effective one under fixed exchange rate regime.
AA2
Stabilization Policies with a Fixed Exchange Rate
• How can the government stabilize output and maintain fixed exchange rate at the same time? ◦ Previously we looked at how the government can stabilize output if the exchange rate is flexible.
Week 10, Autumn 2003
International Monetary Theory and Policy, EC247/347
Week 10, Autumn 2003
Monetary Policy
Output, Y
Fiscal Expansion Under Fixed Exchange Rate DD1
International Monetary Theory and Policy, EC247/347
Week 10, Autumn 2003
AA1
Exchange rate, E
E2
´ Xavier Mateos-Planas and Akos Valentinyi
1
´ Xavier Mateos-Planas and Akos Valentinyi
E0
Y1
2
Y2
Output, Y
International Monetary Theory and Policy, EC247/347
Internal Balance: Full Employment and Price-Level Stability • Over- or underemployment of resources are costly. • Inflation is costly. ◦ Predictable changes in prices are less costly. ◦ Unpredictable changes in prices are costly. External Balance: The Optimal Level of Current Account • Gains from trade: ◦ Intertemporal gain ⇒ some times CA deficit and some times CA surplus is desirable. • Problems with excessive CA deficit: ◦ Deficit is financed with borrowing that has to be repaid. • Problems with excessive CA surplus: ◦ Low domestic investment. ◦ Lending risk.
International Monetary Theory and Policy, EC247/347
Week 10, Autumn 2003
International Monetary Theory and Policy, EC247/347
Week 10, Autumn 2003
Monetary Expansion is Ineffective Under a Fixed Exchange Rate DD
Macroeconomic Policy Goals in an Open Economy
• Internal balance: ◦ Full employment of a country’s resources, ◦ Domestic price level stability. • External Balance: ◦ No excessive the current account surplus, ◦ No Excessive the current account deficit.
´ Xavier Mateos-Planas and Akos Valentinyi 9
´ Xavier Mateos-Planas and Akos Valentinyi
10
International Monetary Theory and Policy, EC247/347
Week 10, Autumn 2003
´ Xavier Mateos-Planas and Akos Valentinyi
7
´ Xavier Mateos-Planas and Akos Valentinyi
E 1 − R∗
Ee 1 − R∗
Y1
8
1
1
Yf
2
Output, Y
International Monetary Theory and Policy, EC247/347
Week 10, Autumn 2003
Fixing Exchange Rate to Restore Full Employment
AA1
Output, Y
AA2
A Low-Output Liquidity Trap
DD
Yf
DD
AA1
Y1
Exchange rate, E
Ee 1 − R∗
Exchange rate, E 0
Exchange rate, E
E0
´ Xavier Mateos-Planas and Akos Valentinyi
E2
3
´ Xavier Mateos-Planas and Akos Valentinyi
4
International Monetary Theory and Policy, EC247/347
Week 10, Autumn 2003
International Monetary Theory and Policy, EC247/347
Week 10, Autumn 2003
The International Monetary System, 1870-1973
• Our analysis so far: ◦ How a country’s fiscal and monetary policy can affect its output and employment given the macroeconomic conditions in the rest of the world. • Open economies are interdependent ◦ Channels of interdependence depend on monetary and exchange rate arrangements. ⇒ International Monetary System.
DD2
AA2 AA1
Y3
• Fiscal expansion ⇒ ⇒ ⇒ ⇒ Aggregate demand increases at any E , Output rises, Excess demand for money, Upward pressure on R, and downward pressure on E , ⇒ Central bank increases money supply to keep E = E 0.