NetFlow学习笔记
Netflow网络流量分析手册

Netflow网络流量分析手册作者:聂晓亮(毛蛋哥)目录一、作者简介 (4)二、为什么会有这本书 (5)三、流量分析原理 (6)(一)原始流量分析方式 (6)(二)Netflow分析方式 (6)四、流量采样 (8)(一)在网络设备上开启Netflow功能 (8)(二)网络设备不支持Netflow (9)1.部署方式 (9)2.安装Fprobe (11)3.启动Fprobe (11)4.镜像流量至Fprobe服务器 (12)5.检测是否收到Netflow数据 (12)五、部署服务器 (13)(一)硬件需求 (13)(二)安装FreeBSD (13)(三)安装Nfsen (14)1.安装apache22 (14)2.安装php5 (14)3.安装nfsen (15)(四)安装PortTracker (15)(五)访问Nfsen (16)六、抓贼攻略 (18)(一)了解网络运行状况 (18)(二)什么协议吞了带宽 (22)(三)抓出罪魁祸首 (25)七、感谢 (30)一、作者简介本书作者聂晓亮,网名毛蛋哥。
2004年毕业于北京联合大学信息工程学院,热爱网络相关知识及摄影,机缘巧合参加了Cisco认证培训,并获得了一些成绩。
本书写于2008年10月,作者目前状态工作较为舒适,故有空闲时间完成此书。
聂晓亮(毛蛋哥)拥有自己的Blog及Wiki空间,其中记录了作者的工作、生活、学习。
作者希望通过此书以及Blog、Wiki同全世界的网络爱好者分享其知识与快乐。
聂晓亮(毛蛋哥)的Blog:聂晓亮(毛蛋哥)的Wiki:欢迎交流:pharaohnie@二、为什么会有这本书在工作的几年当中,经常有朋友和一些网友问我一些关于流量分析的问题,诸如:●我们局域网怎么这么慢,是不是有人在下BT?●192.168.0.1也没人用,怎么网卡疯狂闪烁,它在做什么?●老板让我查查服务器为什么总是那么大流量,可我不知道从何下手。
●公司出口带宽不够了,但一时有没那么多带宽预算,我在考虑是不是要关掉一些和公司业务无关的协议,但不知道应该关哪些协议。
s03-流量分析技术-netflow

3-19
Flow tools
IP网络流量分析
3-20
Arbor
• 支持NetFlow V5,V7,V9,probe
• Peakflow SP(最新的arbor主页无法看到DoS和
Traffic,合并了?)
– Peakflow DoS:主要侧重于网络内的异常行为 – Peakflow Traffic:主要侧重于流量和路由行为
期的flow记录以UDP方式导出
IP网络流量分析
3-5
NetFlow原理-2
IP网络流量分析
3-6
支持NetFlow的设备
NE系列
IP网络流量分析
3-7
对于不支持netflow的设备
• • • •
读入流量,生成netflow数据 Nprobe v5/v9/nFlow Probe for IPv4/v6 Packet Size (Bytes): Throughtput (Pkt/sec)
IP网络流量分析
3-29
NetFlow配置-2
• 配置netflow服务器地址和端口号
– config全局状态下: – (config)#ip flow-export destination xxx.xxx.xxx.xxx 55888 – xxx.xxx.xxx.xxx为netflow服务器地址,即运 行netflow版流量监视程序主机的IP地址
IP网络流量分析
3-14
NetFlow实测对比
• CISCO实测
– 某省骨干端口GE口 GSR12416 – CPU前后没有变化2% – 平均入流量在650M,采样 率为500的时候 – 15分钟平均flow条数为 110000万条 – 每秒122条flow – 122*1.4k=171k/sec – 预期:650M的百分之一 6.5兆=6500k
netflow字段解释
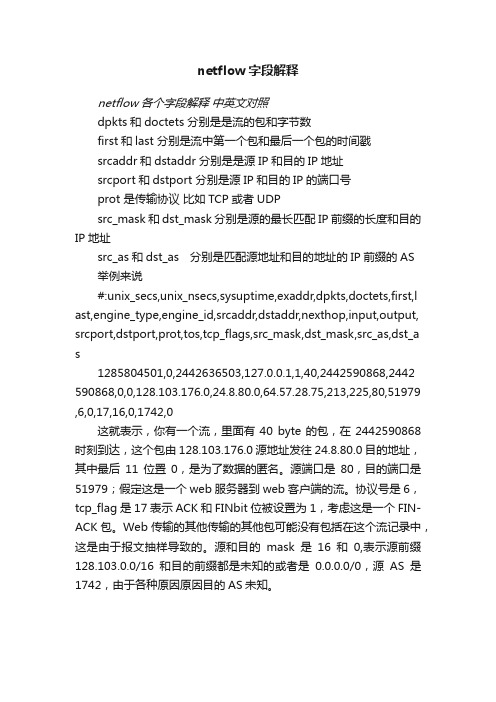
netflow字段解释netflow各个字段解释中英文对照dpkts和doctets 分别是是流的包和字节数first和last 分别是流中第一个包和最后一个包的时间戳srcaddr和dstaddr 分别是是源IP和目的IP地址srcport和dstport 分别是源IP和目的IP的端口号prot 是传输协议比如TCP或者UDPsrc_mask和dst_mask 分别是源的最长匹配IP前缀的长度和目的IP地址src_as和dst_as 分别是匹配源地址和目的地址的IP前缀的AS举例来说#:unix_secs,unix_nsecs,sysuptime,exaddr,dpkts,doctets,first,l ast,engine_type,engine_id,srcaddr,dstaddr,nexthop,input,output, srcport,dstport,prot,tos,tcp_flags,src_mask,dst_mask,src_as,dst_a s1285804501,0,2442636503,127.0.0.1,1,40,2442590868,2442 590868,0,0,128.103.176.0,24.8.80.0,64.57.28.75,213,225,80,51979 ,6,0,17,16,0,1742,0这就表示,你有一个流,里面有40 byte的包,在2442590868时刻到达,这个包由128.103.176.0源地址发往24.8.80.0目的地址,其中最后11位置0,是为了数据的匿名。
源端口是80,目的端口是51979;假定这是一个web服务器到web客户端的流。
协议号是6,tcp_flag是17表示ACK和FINbit位被设置为1,考虑这是一个FIN-ACK包。
Web传输的其他传输的其他包可能没有包括在这个流记录中,这是由于报文抽样导致的。
源和目的mask是16和0,表示源前缀128.103.0.0/16和目的前缀都是未知的或者是0.0.0.0/0,源AS是1742,由于各种原因原因目的AS未知。
6-IPFIX和NetFlow
Address
Source AS Number Source Subnet Mask
Interface Application
Input physical interface Source TCP/UDP port Packet count Byte count
Statistics
Start timestamp End timestamp
因特网是全球性的工具 因特网有统一的基本规则、协议、流程 谁来制订这些统一的标准? 主要组织:IETF
– – –
3
Internet Engineering Task Force 通过发布RFC的形式制订标准
l
l l
4
IPFIX-网络流量监测系统参考模型
详见RFC5470
5
监测系统各个组件
• Observation Points:探针,连接到网络接口,获取流量。 • Metering Process:测量程序,将网络流量转化为流记录。 • Exporter:上报设备,运行一个或多个上报程序 • Exporting Process:上报程序,发送流记录到一个或多个采集程 序,流记录由一个或多个测量程序产生。
–
仅有HP、Foundry和Extreme Networks等厂商的部分型号 的交换机支持sFlow。
主流的流技术
l
J-Flow
–
Juniper开发的网络监测技术,类似于cisco的 Netflow。 目前有版本v5,v8,其中v5最常用。 华为制订的私有技术协议,类似于Cisco公司的 Netflow。 应用于华为、华为3com的部分型号网络设备。
NetFlowV5
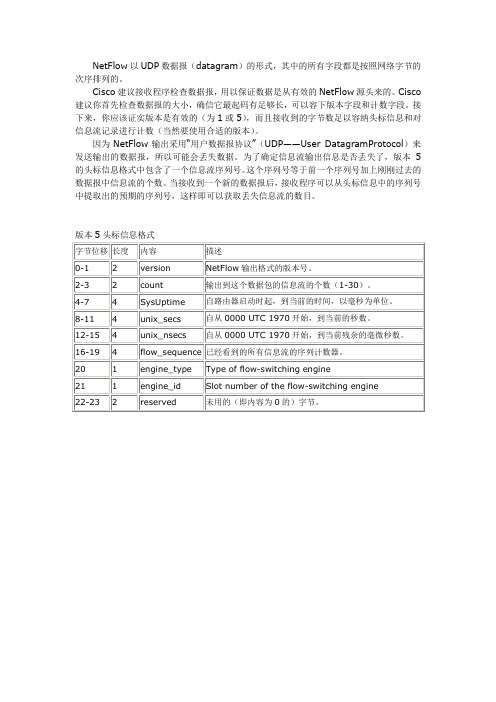
NetFlow以UDP数据报(datagram)的形式,其中的所有字段都是按照网络字节的次序排列的。
Cisco建议接收程序检查数据报,用以保证数据是从有效的NetFlow源头来的。
Cisco 建议你首先检查数据报的大小,确信它最起码有足够长,可以容下版本字段和计数字段。
接下来,你应该证实版本是有效的(为1或5),而且接收到的字节数足以容纳头标信息和对信息流记录进行计数(当然要使用合适的版本)。
因为NetFlow输出采用“用户数据报协议”(UDP——User DatagramProtocol)来发送输出的数据报,所以可能会丢失数据。
为了确定信息流输出信息是否丢失了,版本5的头标信息格式中包含了一个信息流序列号。
这个序列号等于前一个序列号加上刚刚过去的数据报中信息流的个数。
当接收到一个新的数据报后,接收程序可以从头标信息中的序列号中提取出的预期的序列号,这样即可以获取丢失信息流的数目。
版本5头标信息格式
版本5信息流记录格式。
netflow协议的原理

netflow协议的原理宝子!今天咱来好好聊聊Netflow协议这个挺有趣的玩意儿。
Netflow协议啊,就像是网络世界里的一个小侦探呢。
你想啊,在一个超级复杂的网络环境里,就像一个超级大的迷宫,里面有各种各样的数据跑来跑去。
Netflow 协议呢,它的任务就是要搞清楚这些数据是从哪儿来的,要到哪儿去,就像是追踪小怪兽的踪迹一样。
那它是怎么做到的呢?这就很神奇啦。
当网络设备,比如说路由器或者交换机,在处理数据流量的时候,Netflow协议就开始发挥作用了。
它会悄悄地在旁边看着这些数据流动,然后把一些关键的信息给记下来。
比如说,它会记录这个数据流量是哪个源IP地址发出来的,就像是知道是哪个小房子里的人发出了信号一样。
还有目的IP地址,这就好比是这个信号要到达的另外一个小房子。
而且啊,它还会记下这个流量用的是什么端口,这就像知道是从哪个小窗户发出去或者要进入哪个小窗户似的。
这个协议啊,还有个很贴心的地方呢。
它不仅仅是简单地记录这些信息,还会把这些信息按照一定的规则给整理好。
就像把你那些乱七八糟的小物件都分类放在不同的小盒子里一样。
它会把相似的流量信息归为一组,比如说,从同一个源IP地址到同一个目的IP地址,而且端口也相同的流量,就把它们放在一起。
这样做有啥好处呢?这就方便网络管理员去查看和分析啦。
你可以想象一下,如果没有Netflow协议,网络管理员就像是在一个黑暗的房间里找东西,完全不知道数据的流动情况。
但是有了Netflow协议呢,就好像有人给他开了一盏小灯,他可以清楚地看到数据的走向。
比如说,要是发现某个源IP地址总是向一个不正常的目的IP地址发送大量的数据,那管理员就可以怀疑是不是有什么安全问题啦,是不是有小坏蛋在偷偷搞事情呢。
而且啊,Netflow协议还能帮助网络管理员来管理网络的带宽呢。
就像你家里的水管子一样,如果不知道哪里用水多,哪里用水少,可能就会造成一些地方水不够用,一些地方又浪费水。
netflow技术讲解

IP网络承载能力与所提供的应用业务规模向来都是相辅相成的,一方面IP网络的建设将给新应用技术的推广提供有效的实施平台,另一方面应用业务也会随着自身系统发展需要而对现有IP网络提出更高的资源需求,从而推动IP网络基础建设进入新的建设周期。
在这种类似于“鸡生蛋、蛋生鸡”的逻辑悖论中,另外一个问题却是毋庸置疑的凸现了出来,那就是如何把应用业务与其所占用的IP资源(如带宽)清晰、准确的对应起来,如何保证有限的IP资源能够被合理应用的到主要利润业务中。
以NetFlow为代表的Flow技术正是为响应这种挑战而出现的新型解决途径。
什么是Flow在最开始,Flow是网络设备厂商为了在网元设备内部提高路由转发速度而引入的一个技术概念,其本意是将高CPU消耗的路由表软件查询匹配作业部分转移到硬件实现的快速转发模块上(如Cisco的CEF模式)。
在这种功能模式中,数据包将通过几个给定的特征定义归并到特定的集合中,这个集合就是Flow。
每个Flow的第一个数据包除了促使该Flow记录的产生以外,还要驱动网元三层模块完成路由查询并将查询结果同期放入Flow记录中,而该Flow集合的后续数据包将直接在Flow的已有记录中获得路由转发信息,从而提高了网元设备的路由转发效率。
作为网元设备内部路由机制优化的副产物,Flow记录能够提供传统SNMP MIB 无法比拟的丰富信息,因此Flow数据被广泛用于高端网络流量测量技术的支撑,以提供网络监控、流量图式分析、应用业务定位、网络规划、快速排错、安全分析(如DDOS)、域间记帐等数据挖掘功能。
相对于会话(“Session”)而言,“Flow”具备更细致的标识特征,在传统的TCP/IP五元组的基础上增加了一些新的域值,至少包括以下几个字段:源IP地址目的IP地址源端口目的端口IP层协议类型ToS服务类型输入物理端口以上七个字段可以唯一地确定任意一个数据包属于哪个特定的Flow,换而言之任何一个字段出现了差异都意味着一个新Flow的发生。
netflow 解析

netflow 解析
NetFlow是一种网络监测功能,可以收集进入及离开网络界面的IP封包的数量及资讯。
最早由思科公司研发,应用在路由器及交换器等产品上。
经由分析NetFlow收集到的资讯,网络管理人员可以知道封包的来源及目的地,网络服务的种类,以及造成网络拥塞的原因。
NetFlow的版本有:
NetFlow V1:为NetFlow技术的第一个实用版本,在如今的实际网络环境中已经不建议使用。
NetFlow V5:增加了对数据流BGP AS信息的支持,是当前主要的实际应用版本。
NetFlow V7:思科Catalyst交换机设备支持的一个版本,需要利用交换机的MLS或CEF 处理引擎。
NetFlow V8:增加了网络设备对NetFlow统计数据进行自动汇聚的功能,大大降低对数据输出的带宽需求。
NetFlow的IP Flow和NetFlow Cache是两个重要的概念。
IP Flow可以用于网络设备之间的流量信息交换,帮助网络管理人员更好地了解网络流量情况。
而NetFlow Cache则可以用于存储NetFlow收集到的流量信息,以便后续分析和处理。
以上信息仅供参考,如有需要,建议您咨询专业技术人员。
NetFlow技术原理

注: Cisco产品配置命令:snmp ifmib ifindex persist 保证设备重启之后,设备的ifindex号保持不变
NetFlow 配置命令说明
全局配置
设置NetFlow的版本: ip flow-export version 9 设置用于输出数据包的源地址: ip flow-export source <接口> 一般设置为:到达目的地(采集设备SinoBaaS)的最佳路由接口 设置输出的目的地: ip flow-export destination <目标 IP> <目标端口>
NetFlow的用途
利用Netflow技术可以监测网络上的IP Flow信息 IP Flow信息,可以回答用户的下面问题(5W1H) 谁(Who: 源IP地址) 什么时候(When——开始时间、结束时间) 访问路径(Where)
从哪(From:源IP、源端口) 到哪(To:目标IP、目标端口)
老化的Flow信息,采用UDP包发送到采集器 使用NetFlow版本V5,V9,一个UDP包最大可 包括30个流(Flow)
NetFlow 数据记录
使用情况
• Packet Count • Byte Count
• Start Timestamp • End Timestamp
• Source IP Address • Destination IP Address
NetFlow工作原理
Flow Cache老化机制
流设备每秒检查一次cache,对条目做如下老化 (Aging)措施:
netflow_实验指导书

netflow使用技巧

netflow使用技巧NetFlow是一种网络流量监控和分析工具,它可以帮助管理员了解网络中的流量模式以及检测潜在的安全威胁。
以下是一些使用NetFlow的技巧和建议。
1. 配置正确的Flow记录:在启用NetFlow之前,确保正确配置Flow记录。
Flow记录可以包括源IP地址,目标IP地址,源端口,目标端口,传输协议等信息。
根据网络的具体需求,进行灵活的配置。
2. 监控带宽使用率:通过分析NetFlow数据,可以了解网络的实际带宽使用情况。
管理员可以了解哪些应用或设备占用了大量的带宽资源,从而进行合理的带宽分配和优化。
3. 检测DDoS攻击:NetFlow可以检测和识别潜在的DDoS攻击。
通过监测流量模式的异常变化,管理员可以及时采取措施,阻止攻击并保证网络的正常运行。
4. 发现网络访问模式:通过分析NetFlow数据,可以了解哪些用户访问了哪些网站,下载了哪些文件等。
这些信息对于优化网络策略、监测不当使用以及防止信息泄漏等方面都非常有用。
5. 帮助网络规划和优化:NetFlow可以提供详细的网络流量统计和分析报告。
根据这些报告,管理员可以了解每个网络节点的流量情况,帮助进行网络规划和拓扑优化,提高网络的性能和可靠性。
6. 检测安全事件和异常行为:通过定期分析NetFlow数据,可以及时发现可能存在的安全风险和异常行为,例如恶意软件感染、未经授权的访问等。
及时采取相应的安全措施,提高网络的安全性。
7. 实时监控网络流量:使用支持实时流量分析的NetFlow工具,管理员可以实时监控网络中的流量情况。
这对于快速应对网络故障、识别网络拥塞、监测恶意攻击等都非常有帮助。
8. 与其他安全工具结合使用:NetFlow可以与其他安全工具(如入侵检测系统、防火墙等)结合使用,进一步提高网络的安全性和防御能力。
通过分析NetFlow数据,可以帮助检测和识别潜在的安全威胁。
9. 学习网络行为和趋势:通过长期收集和分析NetFlow数据,管理员可以了解网络的行为模式和趋势变化。
NETFLOW技能技术总结介绍

精心整理1.流量流向监测技术1.1概述传统的网络流量监测技术的局限性SNMP采集端口的数据主要是在网元层用来监控网络流量和设备的性能,而且SNMP采集的数据是基于端口的,无法提供端到端的准确的流量信息,因此对流向的统计手段不明确。
成熟稳Netflow2.1流原理netflow的信息单元是flow。
flow是一个单向的带有唯一标识字节组的传输流。
基本的标识为:source-IP-address,source-port,destination-IP-address,destination-port,IP-protocol,TOS,inputinterfaceID。
当路由器接收到一个没有flow入口的数据包时,一个flow的结构将被初始化以保存其状态信息如:交换的字节数、IP地址、端口、自治区域等。
随后所有满足这个flow结构的数据包都将增加flow结构的字节计数和包计数,直至这个flow 中止并输出。
身或其它任何网络设备进行任何外部修改。
Netflow交换中要创建一个信息高速缓存,第一个数据包到来时,路由器利用标准的快速交换处理信息包,同时生成一个Netflow高速缓存,随后到来的数据包即可以依据高速缓存信息被交换,对于所有活动信息流,在Netflow高速缓存中保留相应的信息流信息。
当一定时间内没有相应的数据包通过,则结束这个数据流的交换和统计,并释放高速缓存,数据输出的条件在后续部分描述。
在netflow中到期的flow被绑在UDP数据报中发出。
在V5的版本中最多30个flow记录,V1中25个记录,V8中28个记录。
至少每秒钟发一次flow。
虽然netflow只提供单向的流量统计。
如果希望得到表现双向的统计数据,netflow提供了“canned”的SQL 程序来获得一个IP地址对的流量统计数据。
典型的路由器netflow的资源占用率为8%~30%。
一般情况下一个netflow收集器接收3-5个路由器的netflow输出。
netflow学习笔记
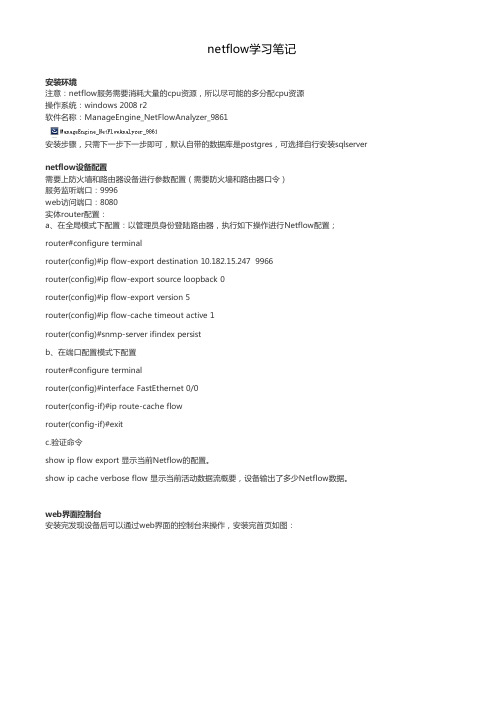
netflow学习笔记安装环境注意:netflow服务需要消耗大量的cpu资源,所以尽可能的多分配cpu资源操作系统:windows 2008 r2软件名称:ManageEngine_NetFlowAnalyzer_9861安装步骤,只需下一步下一步即可,默认自带的数据库是postgres,可选择自行安装sqlserver netflow设备配置需要上防火墙和路由器设备进行参数配置(需要防火墙和路由器口令)服务监听端口:9996web访问端口:8080实体router配置:a、在全局模式下配置:以管理员身份登陆路由器,执行如下操作进行Netflow配置;router#configure terminalrouter(config)#ip flow-export destination 10.182.15.247 9966router(config)#ip flow-export source loopback 0router(config)#ip flow-export version 5router(config)#ip flow-cache timeout active 1router(config)#snmp-server ifindex persistb、在端口配置模式下配置router#configure terminalrouter(config)#interface FastEthernet 0/0router(config-if)#ip route-cache flowrouter(config-if)#exitc.验证命令show ip flow export 显示当前Netflow的配置。
show ip cache verbose flow 显示当前活动数据流概要,设备输出了多少Netflow数据。
web界面控制台安装完发现设备后可以通过web界面的控制台来操作,安装完首页如图:设备接口模块菜单,所有的设备发现都会出现在这个地方,如图:具体的接口模块,每个模块都有单独的意义3rd-1快付通3rd-2信息大厦WLAN与深圳IDC路由相接的harbin哈尔滨银行inside入口outside出口prod是生产的,其网关做在ASA5555DMZ10.27.1.0/24用的,但是这个网段没有服务器staging准生产,其网关做在ASA5555xthy信托花园xthyb信托花园bCT-MSTP-TO-SZHQ太平金融CT-MSTP-TO-WH武汉专线SVI-MSTP-SZIT深圳专线SVI-MSTP-SZ19F新浩E都19楼svi_interconnection_towards_3800nat深圳IDC到电信的专线点击图表按钮会显示如下图的图形界面故障报警器报表模块,可以按需要筛选条件查询,生成报表,但netflow的这个版本的报表模块有点奇怪,就是没有导出功能下图是按条件筛选后生成的数据按接口模块查询报表,主要是以图表的形式展现,如下图配置模块,有邮箱配置、短信配置、代理配置和一些基本项配置。
网络流量分析NetFlow协议详解

网络流量分析NetFlow协议详解网络流量分析一直是网络管理和安全领域的重要任务之一。
通过分析网络流量,我们可以获取有关网络设备、流量模式和潜在威胁的宝贵信息。
而NetFlow协议正是一种流量分析机制,可以帮助我们实现这一目标。
一、NetFlow概述NetFlow是一种网络协议,由思科公司于1996年提出并推广。
它能够实时地收集和分析网络流量数据,帮助网络管理员监测和管理网络的性能、安全和流量负载。
二、NetFlow的工作原理NetFlow的工作原理非常简单,它通过捕获网络设备转发的流量数据,并将其转化为可分析的格式。
具体而言,NetFlow将捕获到的流量数据分为数据包头部和统计信息两部分进行存储和分析。
1. 数据包头部NetFlow会捕获网络数据包的源IP地址、目的IP地址、源端口、目的端口以及协议类型等关键信息。
这些信息对于识别网络中的流量来源、目的地以及协议类型非常重要。
2. 统计信息除了数据包的关键信息外,NetFlow还会统计每个会话的其他关键指标。
比如,数据包数量、传输速率、流量持续时间以及平均数据包大小等。
这些统计信息对于网络管理员来说非常有价值,可以帮助他们识别网络中的异常活动、确定流量瓶颈以及进行容量规划。
三、NetFlow的应用场景NetFlow协议在网络管理和安全领域有着广泛的应用场景。
下面,我们将重点介绍其中的几个方面。
1. 网络容量规划通过分析流量数据,NetFlow可以提供有关网络容量规划的信息。
它可以帮助管理员识别网络中的高峰和低谷时段,进而合理规划网络的带宽和硬件资源。
2. 安全威胁检测网络安全是当今互联网世界中不可忽视的重要问题。
NetFlow可以帮助管理员及时发现和识别网络中的潜在安全威胁,比如DDoS攻击、端口扫描和恶意软件传播等。
通过分析流量数据,管理员可以实时监测网络并采取相应的安全措施。
3. 业务分析和优化除了容量规划和安全威胁检测外,NetFlow还可以用于业务分析和优化。
NETFLOW教程

NetFlow教程1NetFlow介绍1.1 NetFlow的产生原因●由网络设备进行原始统计信息的汇聚可以大大减少网络设备输出的数据量,降低对上层管理服务器的配置要求,提高上层管理系统的扩展性和工作效率。
●虽然SNMP有助于容量规划,但无法提取流量特征,而只有了解了特征,才能保证业务连续性,确定是否需要增加容量才能提高利用率保证,以及评估QoS参数是否符合目标服务水平要求等●流量特征提取遇到的另一个困难是,许多新应用每次使用的端口都不相同,它们每次都动态选择新端口使用。
1.2 NetFlow技术的起源NetFlow技术最早是于1996年由思科公司的Darren Kerr和Barry Bruins发明的,并于同年5月注册为美国专利,专利号为6,243,667。
NetFlow技术首先被用于网络设备对数据交换进行加速,并可同步实现对高速转发的IP数据流(Flow)进行测量和统计。
经过多年的技术演进,NetFlow原来用于数据交换加速的功能已经逐步由网络设备中的专用ASIC芯片实现,而对流经网络设备的IP数据流进行特征分析和测量的功能也已更加成熟,成为了当今互联网领域公认的最主要的IP/MPLS流量分析和计量行业标准,同时也被广泛用于网络安全管理。
利用NetFlow技术能对IP/MPLS网络的通信流量进行详细的行为模式分析和计量,并提供网络运行的准确统计数据,这些功能都是运营商在进行网络安全管理时实现异常通信流量检测和参数定性分析所必需的。
1.3 什么是NetFlow●通过分析网络中不同Flow间的差别,可以发现判断任何两个IP数据包是否属于同一个Flow。
实际上可以通过分析IP数据包的以下7个属性来实现:➢源IP地址(Source IP address)➢目的IP地址(Destination IP address)➢源端口号(Source port number)➢目的端口号(Destination port number)➢协议类型(Protocol type)➢服务类型(Type of service)➢输入/输出接口(Input/Output interface)将路由器的所有数据包分成很多有以上信息的7字段值的单向IP 数据流,称为网流(NetFlow)。
利用思科Netflow技术进行IP网流量和流向分析--深入浅出的巨牛的Netflow资料!!

利用Cisco Netflow技术进行IP网流量和流向分析IP网流量管理面临的挑战随着宽带互联网在中国的迅速发展,中国各大电信运营商的网络规模都在不断扩张且网络结构日渐复杂。
为了更好地服务企业客户,及时了解自身网络的负载状况和重要业务的带宽占用率;准确计量国际国内运营商间、骨干网/城域网间通信流量和业务类型;正确规划和评估网络扩容、升级等目的,电信运营商需要能对网络和其承载的各类业务进行及时、准确的流量和流向分析。
国内电信运营商当前的网络流量管理现状是,绝大多数企业的运维部门还都没有建设一套能够完全满足上述管理需求的网络及业务流量和流向分析系统。
大部分网管系统还只是采用一些通用型的网络链路使用率监视软件,如MRTG,利用SNMP协议对网络的重点链路和互联点进行简单的端口级流量监视和统计;或采用在网络中部分重点POP点加装RMON探针的方式,利用RMON I/II协议对网络中部分端口进行网络流量和上层业务流量的监视和采集。
但是上述两种被普遍采用的网络流量分析系统都有其显著的技术局限性。
∙利用SNMP协议能够对被监视的各个网络端口进出的数据包数和字节数进行采集,但采集到的流量信息较为粗糙,不但包括网络层的客户业务流量信息,还包括链路层的数据帧包头,Hello数据包,出错后重新传送的数据包等流量信息。
而且SNMP协议还无法区分网络层数据流量中各种不同类型客户业务在总流量中的分布状况,也无法对进出的流量进行流向分析。
∙利用RMON协议对运营商网络进行流量和流向管理可以部分弥补SNMP协议的技术局限性,如可以对业务流量进行统计,但同时也暴露出新的技术局限性。
首先,由于RMON协议需要对网络上传送的每个数据帧进行采集和分析,会耗用大量的CPU资源因而不可能由网络设备本身实现,需要额外购买和安装内置式或外置式的RMON探针。
市场上现有的RMON探针处理能力也有限制,还不能支持监控端口速率超过1Gbps的网络端口。
netflow原理

1、Natflow原理:2、输出流信息的格式3、natflow用途a)网络监控b)应用监控c)用户监控d)网络规划e)安全分析f)记账3、netflow网络设备的配置和相关参数Cisco Netflow配置命令a)ip route-cache flow 在接口上配置Netflow采样。
b)ip flow-export destination ip_address port 将Netflow的采样信息输出到Netflow的流量分析系统上,这里2055是NI系统的Netflow默认端口号,如果是其他的Netflow系统可以在下面的命令行里更改端口号,NI系统也可以在全局配置下更改端口号。
c)ip flow-export source interface_name 配置发送Netflow采样信息的源接口,建议使用Loopback接口。
ip flow-export version 5 配置Netflow的版本号为5。
d)ip flow-cache timeout active x 生成告警和显示故障排除数据为x分钟。
snmp-server ifindex persist 全局启用ifIndex持续化(接口名)。
配置举例:router#configure terminalrouter(config)#interface FastEthernet 0/0router(config-if)#ip route-cache flowrouter(config-if)#exitrouter(config)#ip flow-export destination 10.10.10.25 2055router(config)#ip flow-export source loopback 0router(config)#ip flow-export version 5router(config)#ip flow-cache timeout active 1router(config)#snmp-server if验证命令show ip flow export 显示当前Netflow的配置。
NetFlow 简要说明

SolarWinds Orion NetFlow Traffic Analyzer QuickStart GuideOrion NetFlow Traffic Analyzer QuickStart GuideCopyright© 1995-2006 SolarWinds, all rights reserved worldwide. No part of this document may be reproduced by any means nor modified, decompiled, disassembled, published or distributed, in whole or in part, or translated to any electronic medium or other means without the written consent of SolarWinds All right, title and interest in and to the software and documentation are and shall remain the exclusive property of SolarWinds and its licensors. SolarWinds Orion™, SolarWinds Cirrus™, and SolarWinds Toolset™ are trademarks of SolarWinds and ® and the SolarWinds logo are registered trademarks of SolarWinds All other trademarks contained in this document and in the Software are the property of their respective owners.SOLARWINDS DISCLAIMS ALL WARRANTIES, CONDITIONS OR OTHER TERMS, EXPRESS OR IMPLIED, STATUTORY OR OTHERWISE, ON SOFTWARE AND DOCUMENTATION FURNISHED HEREUNDER INCLUDING WITHOUT LIMITATION THE WARRANTIES OF DESIGN, MERCHANTABILITY OR FITNESS FOR A PARTICULAR PURPOSE AND NONINFRINGEMENT. IN NO EVENT SHALL SOLARWINDS, ITS SUPPLIERS OR ITS LICENSORS BE LIABLE FOR ANY DAMAGES, WHETHER ARISING IN TORT, CONTRACT OR ANY OTHER LEGAL THEORY EVEN IF SOLARWINDS HAS BEEN ADVISED OF THE POSSIBILITY OF SUCH DAMAGES.Microsoft® and Windows 2000® are either registered trademarks or trademarks of Microsoft Corporation in the United States and/or other countries.Graph Layout Toolkit and Graph Editor Toolkit © 1992 - 2001 Tom Sawyer Software, Oakland, California. All Rights Reserved.Portions Copyright © ComponentOne, LLC 1991-2002. All Rights Reserved.Orion NetFlow Traffic Analyzer NetFlow Traffic Analyzer QuickStart Guide 12.12.2006 About SolarWindsSolarWinds, Inc develops and markets an array of network management, monitoring, and discovery tools to meet the diverse requirements of today’s network management and consulting professionals. SolarWinds products continue to set benchmarks for quality and performance and have positioned the company as the leader in network management and discovery technology. The SolarWinds customer base includes over 45 percent of the Fortune 500 and customers from over 90 countries. Our global business partner distributor network exceeds 100 distributors and resellers.ii ContentsOrion NetFlow Traffic Analyzer QuickStart GuideContents iii Contacting SolarWindsYou can contact SolarWinds in a number of ways, including the following: Team Contact InformationSales 1.866.530.8100Technical Support /supportUser Forums /support you need a customer accountto access the Customer Support area of the website.ConventionsThe documentation uses consistent conventions to help you identify items throughout the printed and online library. Convention SpecifyingBold Window items, including buttons and fields.Italics Book and CD titles, variable names, new termsFixed font File and directory names, commands and code examples,text typed by youStraight brackets, as in [value ] Optional command parametersCurly braces, as in {value } Required command parametersLogical OR, as in value1|value2Exclusive command parameters where only one of theoptions can be specifiedOrion NetFlow Traffic Analyzer QuickStart Guideiv Contents Orion NetFlow Traffic Analyzer Documentation LibraryThe following documents are included in the Orion NetFlow Traffic Analyzer documentation library: Document PurposeOrion NPM Administrator Guide Provides detailed setup, configuration, andconceptual information.Page Help Provides help for every window in the OrionNetFlow Traffic Analyzer user interfaceQuickStart Guide Provides installation, setup, and common scenariosfor which Orion NetFlow Traffic Analyzer provides asimple, yet powerful, solution.Release Notes Provides late-breaking information, known issues,and updates. The latest Release Notes can befound at .Orion NetFlow Traffic Analyzer QuickStart GuideContentsAbout SolarWinds (ii)Contacting SolarWinds (iii)Conventions (iii)Orion NetFlow Traffic Analyzer Documentation Library (iv)Chapter 1 Introduction (1)Why Install Orion NetFlow Traffic Analyzer (1)Why Use Orion NetFlow Traffic Analyzer (2)How Orion NetFlow Traffic Analyzer Works (3)Chapter 2Installing Orion NetFlow Traffic Analyzer (5)Licensing Orion NetFlow Traffic Analyzer (5)Requirements (5)Installing Orion NetFlow Traffic Analyzer (6)Chapter 3Getting Started (9)Adding Your NetFlow Device Node and Interfaces (9)Configuring Monitored Application and Ports (10)Retaining and Collapsing Data (12)Retaining Data (12)Collapsing Data (13)Launching the Web Console (14)Chapter 4Working with Orion NetFlow Traffic Analyzer (17)Locating and Isolating an Infected Computer (17)Locating and Blocking Unwanted Use (18)Recognizing and Thwarting a DOS Attack (19)Contents vOrion NetFlow Traffic Analyzer QuickStart Guide vi ContentsOrion NetFlow Traffic Analyzer QuickStart GuideChapter 1IntroductionOrion NetFlow Traffic Analyzer provides a simple-to-use, scalable network monitoring solution for IT professionals juggling any size Cisco NetFlow-enabled network.Why Install Orion NetFlow Traffic AnalyzerAs companies and their networks grow, bandwidth needs grow exponentially. All modern connected industries invest a significant amount of time and money ensuring enough bandwidth is available for business-critical activities and applications. When bandwidth needs grow beyond the current capacity or seem to expand past the abilities of your network, understanding how bandwidth is used stops being a novel interest and becomes critical to deciding whether it is necessary to invest in more bandwidth or if imposing stricter usage guidelines would be enough to regain lost bandwidth.With the advent of streaming media, voice over IP (VOIP) technologies, online gaming, and other bandwidth intensive applications, network engineers are faced with more than the question of whether the network is up, but why is the network up and slow. And, once you know why and where the network is delayed, how do you alleviate the issues?If you need to know how and by whom your bandwidth is being used, Orion NetFlow Traffic Analyzer provides a simple, integrated answer. You can quickly trace and monitor the bandwidth usage of a particular application or type of traffic. For example, you see excessive bandwidth use on a particular interface. Using Orion NetFlow Traffic Analyzer, you see that the company meeting, consisting of streaming video, is consuming 80% of the bandwidth available through a particular switch. NetFlow data and the network data provided in the Orion NetFlow Traffic Analyzer solution, unlike many NetFlow analysis products, are not purely extrapolated data, but based on real data collected about the network by the Orion Network Performance Monitor product at the heart of Orion NetFlow Traffic Analyzer.Introduction 1Orion NetFlow Traffic Analyzer NetFlow Traffic Analyzer QuickStart GuideOut of the box, Orion NetFlow Traffic Analyzer offers broad monitoring, and charting capabilities coupled with detail-driven statistics, including the following: •Distribution of bandwidth across traffic types•Usage patterns over time•Identification and tracking of external traffic•Tight integration with detailed interface performance statisticsThese monitoring capabilities, along with a customizable web-based interface, alerting, and reporting engines, make Orion NetFlow Traffic Analyzer the easiest choice you will make involving your NetFlow monitoring needs.Why Use Orion NetFlow Traffic AnalyzerThe following valuable features provided the impetus and are the foundation on which Orion NetFlow Traffic Analyzer is built:Providing improved availability and performanceAllowing you to more quickly detect, diagnose, and resolve networkslowdowns and outages.Enabling analytical capacity planningAllowing you to intelligently anticipate changes in bandwidth to areasexperiencing bottlenecks by highlighting trends in network traffic. Optimizing network resource allocationAllowing you to identify and reassign areas with excess bandwidthcapabilities to areas with limited or stressed connections.Aligning IT resources with enterprise business needsAllowing you to see the needs of the enterprise network both in a high-level overview, and, because Orion NetFlow Traffic Analyzer is built on the proven Orion usage and performance monitoring infrastructure, providing you with the details you need about specific interfaces and nodes.2 IntroductionOrion NetFlow Traffic Analyzer QuickStart Guide Increasing network securityAllowing you to quickly and precisely pinpoint inbound network traffic,exposing curious patterns, unwanted behavior, and anomalous usage that points to possible virus, bot, or spyware infection.Offering a one-stop application for your NetFlow and performance monitoring needsAllowing you to stop switching between programs to get a complete picture of usage, performance, and needs.How Orion NetFlow Traffic Analyzer WorksNetFlow-enabled Cisco routers and switches provide a wealth of IP-related traffic information. Orion NetFlow Traffic Analyzer collects this NetFlow data, correlates the data into a useable format, provides this data along with detailed network performance data collected by SolarWinds Orion as easily read graphs and reports on bandwidth use in and to your network. These reports help you monitor bandwidth, track conversations between internal and external endpoints, analyze traffic, and plan bandwidth capacity needs.Introduction 3Orion NetFlow Traffic Analyzer NetFlow Traffic Analyzer QuickStart Guide 4 IntroductionChapter 2Installing Orion NetFlow Traffic AnalyzerOrion NetFlow Traffic Analyzer provides a simple, wizard-driven installation process. For an enterprise-class product, the requirements are rather nominal. Though, NetFlow data is extensive and can consume a great deal of database space.Licensing Orion NetFlow Traffic AnalyzerOrion NetFlow Traffic Analyzer can collect data from any of your version 5 NetFlow enabled devices and is licensed by the number of interfaces from which you decided to collect data.The following list provides the different types of NetFlow licenses available:•Up to 10 interfaces (SL10)•Up to 25 interfaces (SL25)•Up to 50 interfaces (SL50)•Up to 100 interfaces (SL100)•Up to 250 interfaces (SL250)•Up to 500 interfaces (SL500)Notes:•The size of your database increases with the addition of more NetFlow interfaces. Consider collecting NetFlow data on one or two interfaces for a period of time to understand the space and memory needs required forNetFlow traffic analysis. Then, add your other interfaces, ensuring yourdatabase can grow as needed and your memory needs are understood. •While the license limits the maximum number of monitored interfaces, the effective capacity of your installation may be lower if monitored interfacethroughput is especially high.RequirementsThe computer you use to host your NetFlow solution must support both Orion Network Performance Monitor (Orion NPM) and the Orion NetFlow Traffic Analyzer products. Orion NetFlow Traffic Analyzer is built on the proven technologies and stable foundation of Orion NPM and extends the Orion NPM functionality.Installing Orion NetFlow Traffic Analyzer 5The following requirements are based on a minimum installation of Orion NetFlow Traffic Analyzer with SQL Server on a separate database server. Ensure your SQL Server has enough memory and hard drive space available to absorb the influx of extensive NetFlow data.Hardware or Software Separate SQL Server and Orion: suggestions for the Orion server unless otherwise statedCPU 3GHz or fasterMemory 2GB or moreHard Drive Space 5GB or moreOperating System Windows 2000 Server or Windows 2003 Server with IIS installed.NET Framework Version 2.0 or later with Orion NPM 8. Version 1.1 or later with OrionNPM 7.Orion NPM Version 7.8.5 or laterSQL Server SQL Server Standard Edition 2000 or SQL Server 2005 on a separatedatabase server with 4-8GB of memory and at least 20GB of availablehard drive space.Microsoft InternetExplorerVersion 6 or later for accessing the web consoleNetFlow Devices Cisco NetFlow routers using NetFlow version 5For more information about Orion NPM requirements, see theOrion Administrator Guide.Installing Orion NetFlow Traffic AnalyzerComplete the following procedure to install Orion NetFlow Traffic Analyzer in your evaluation environment. You must know your NetFlow traffic port and ensure it is enabled and sending NetFlow traffic data on that port.To install Orion NetFlow Traffic Analyzer:1. Log on to the Orion NPM server you want to use for NetFlow traffic analysis.The Orion NPM server must be version 7 or later.2. If you downloaded the product from the SolarWinds website, navigate toyour download location and launch the executable.3. If you received physical media, browse to the executable file, and thenlaunch the executable.4. Review the Welcome text, and then click Next.5. Agree to the license agreement on the End User License Agreement window,and then click Yes.6. Provide an installation destination folder on the Choose Destination Locationwindow, and then click Next.7. Click Finish on the Installation Complete window.6 Installing Orion NetFlow Traffic Analyzer8. Provide the appropriate information on the Install Software License Keywindow, and then click Continue. You need your customer ID and password to successfully install the key.9. Click Continue when the license is successfully installed.10. Click Start > All Programs > SolarWinds Network Performance Monitor >Configuration Wizard.11. Click Start on the Welcome tab of the Configuration Wizard.12. If you are prompted to stop services, click Yes to stop the services. Toensure all updates and changes are installed correctly, it is imperative that you stop all services.13. If you are using more than one polling engine to collect networkinformation, ensure you shutdown each of these polling engines beforecontinuing. When you have shutdown any other polling engines, click OK on the dialog.14. To setup your database, click Continue on the Setup Database tab andcomplete the following procedure:a. Specify the SQL Server instance you want to use to store NetFlow dataand the credentials, if necessary, to log into the instance, and then clickContinue.b. Select or type the name of the database. If you are creating a newdatabase, browse to the folder in which you want to store your databasefiles. Click Continue.c. Review the status of your database setup. When the structure validationcompletes, click Continue.d. Specify a SQL account for the polling engine and web site to use toaccess the database, and then click Continue. If you already have aSQL account, you can specify the credentials for that account.15. To setup the web console, click Continue on the Create Website tab, andthen complete the following procedure:a. Specify the IP address of the web server you want to use for the webconsole, the port through which you want to access the console, and thevolume and folder in which you want the web console files installed.Then, click Continue.Note: If you specify any other port than 80, you must specify that port inthe URL used to access the web console. For example, if you specify anIP of 192.168.0.3 and port 8080, your URL is http://192.168.0.3:8080.b. Review the status as your web console is created. When the console hasbeen created, click Continue.Installing Orion NetFlow Traffic Analyzer 716. Check the services you want to install on the Install Services tab. Ensure youcheck the NetFlow Receiver Service and the Flow Correlation Service. Then, click Continue.17. Specify the port on which Orion NetFlow Traffic Analyzer needs to listen forNetFlow traffic, and then click Continue. This port is specified in theconfiguration of your NetFlow enabled Cisco appliance. The following excerpt from a Cisco router configuration file offers an example of where to look for and how to enable NetFlow traffic:!interface GigabitEthernet0/1description link to PIXip address 10.3.1.2 255.255.255.252ip route-cache flow!ip flow-export source GigabitEthernet0/1ip flow-export version 5ip flow-export destination 1.2.0.12 9090!The ip flow-export destination value must reflect the IP address of yourNetFlow enabled Orion NPM server. This value also contains the portnumber (9090) required in this step. The ip route-cache flow, ip flow exportsource, and ip flow-export version values are required to enable NetFlow traffic.For more information, see your Cisco router documentation or the Ciscowebsite at .Note: Orion NetFlow Traffic Analyzer supports NetFlow version 5.18. If you are prompted to select a polling engine, ensure you select the pollingengine collecting NetFlow data.8 Installing Orion NetFlow Traffic AnalyzerChapter 3Getting StartedTo begin analyzing the NetFlow data produced within your network, you must add an interface or monitor a previously added interface generating NetFlow data.Adding Your NetFlow Device Node and InterfacesYour NetFlow device and the relevant interfaces on which you want to monitor NetFlow traffic must be managed by Orion NPM. The following section walks you through adding the device and interfaces to Orion NPM. If you have already set your NetFlow device to send data, after adding your device, Orion begins analyzing NetFlow traffic.To add your device and NetFlow enabled interfaces:1. Log on to the Orion NPM server you want to use for NetFlow traffic analysis.The Orion NPM server must be version 7 or later.2. Click Start > All Programs > SolarWinds Orion Network PerformanceMonitor > System Manager.3. Type the IP address of your NetFlow router in Hostname or IP Address ofServer, Router, etc. field.4. Select the SNMP version you use when communicating with your router.5. Provide the SNMP community string. The community string you provide inthe SNMP Community String field can be the read only string. If you want to use SNMP version 3 to communicate with your router, click EnterCredentials. Provide the appropriate information on the Select/Edit SNMPv3 Credentials window.6. Click Next.Getting Started 97. Check the interfaces you want to monitor on the Resources onRouterIPAddress window, where RouterIPAddress is the IP address of your NetFlow router.8. Click OK.Note: After installing Orion NetFlow Traffic Analyzer, the polling engines create a baseline by collecting status and statistics immediately, and then collecting them again 30 seconds later. You may notice an increased in your CPU usage during this time. After this initial collection, Orion NetFlow Traffic Analyzer collects network information every 10 minutes for nodes, every 9 minutes for interfaces, and 15 minutes for volumes. You should have meaningful data in the NetFlow Traffic Analyzer tab of the web console within 2-3 hours. Before leaving Orion NetFlow Traffic Analyzer to gather data, ensure you are collecting the correct data. For more information, see “Configuring Monitored Application and Ports” on page 11.10 Getting StartedConfiguring Monitored Application and PortsOrion NetFlow Traffic Analyzer provides a list of ports and their associated applications in the NetFlow Traffic Analysis tool. Review this list of ports and applications, checking those that you want to monitor and adding any you do not see and need monitor.To monitor applications and port:1. Log on to the Orion NPM server you want to use for NetFlow traffic analysis.The Orion NPM server must be version 7 or later.2. Click Start > All Programs > SolarWinds Orion Network PerformanceMonitor > NetFlow Traffic Analysis Settings.3. Click the Application & Services Ports tab.4. Check the application, protocols, and services you want to monitor. Ensurethe port associated with the application corresponds to the one you currently use.5. If you do not see a port you want to monitor, click Add New Port, andthen provide the port and description you need. For example, if you route all your VOIP traffic over 3 specific ports, use Add New Port to add these 3ports.6. If an application you need to monitor has an incorrect port assignment,select the port, and then click Delete Selected Ports. After deleting the port assignment, use Add New Port to reassign the port to the appropriateapplication. If Orion NetFlow Traffic Analyzer shipped with the port assigned to another service, you can rename the port assignment by double-clicking the name and typing a replacement.7. Click OK.Note: The number of monitored applications directly affects the amount of NetFlow data stored in the database. The more applications and portsmonitored, the more data is stored. For more information about how to solve database size issues, see “Retaining and Collapsing Data” on page 12.Getting Started 11Retaining and Collapsing DataThe amount of data produced by a NetFlow device can easily become unmanageable in its raw state. Orion NetFlow Traffic Analyzer provides an intelligent, configurable data collapsing schedule and adjustable retention period. Retaining DataComplete the following procedure to adjust the data retention schedule.To adjust or review the retention schedule for NetFlow data:1. Log on to the Orion NPM server you want to use for NetFlow traffic analysis.The Orion NPM server must be version 7 or later.2. Click Start > All Programs > SolarWinds Orion Network PerformanceMonitor > NetFlow Traffic Analysis Settings.3. Click the Data Retention tab.4. Review the current settings and adjust the slider to change the number ofdays to retain data.Note: Consider collecting data for a day before adjusting this slider. After a day, you should have an idea of how much data your network produces with NetFlow enabled.5. Click OK.12 Getting StartedCollapsing DataOrion NetFlow Traffic Analyzer allows you to collapse your NetFlow conversation data in a three step process. A conversation is defined as the transfer of packets between two unique IP addresses. A normal connection contains 2 conversations, the outgoing conversation and the response or incoming conversation.Primary data collapsingCollapses an adjustable amount of statistics into 15 minute intervals. Forexample, if you set this initial collapse to take conversations older than 60 minutes and collapse matching records into 15 minute intervals, aconversation that lasts exactly 60 minutes and is older than the last hour is stored in 4 database records with the amount of packets transferredaggregated.Secondary data collapsingCollapses an adjustable amount of statistics into 60 minute intervals. Forexample, if you set this initial collapse to take conversations older than 24 hours and collapse them into 60 minute intervals, a conversation that lasts exactly 6 hours and is older than 24 hours will be stored in 6 databaserecords with the amount of packets transferred aggregated.Final data collapsingCollapses an adjustable amount of statistics into 24 hour intervals. Forexample, if you set this initial collapse to take conversations older than 7days and collapse them into 24 hour intervals, a conversation that lasts 48 hours is stored in 2 database records with the amount of packets transferred aggregated.If you do not want or need to take advantage of this three step process, you can disable any of the steps in the process independent of the other steps.Warning: Disabling data collapsing will cause all records to be stored independently in the database. Uncollapsed NetFlow data can easily result in many gigabytes of database space.To adjust your data collapsing methodology:1. Log on to the Orion NPM server you want to use for NetFlow traffic analysis.The Orion NPM server must be version 7 or later.2. Click Start > All Programs > SolarWinds Orion Network PerformanceMonitor > NetFlow Traffic Analysis Settings.3. Click the Data Collapsing tab.Getting Started 134. Review the current settings and adjust the sliders to modify your datacollapsing methodology.5. If you want to disable one of the steps in the collapsing process,uncheck the appropriate step.6. Click OK.Launching the Web ConsoleWhen you install Orion NetFlow Traffic Analyzer, the setup program adds a new tab named NetFlow Traffic Analyzer to your existing Orion web console. You can find all your NetFlow data in the web console.To launch the web console:1. Log on to the Orion NPM server you want to use for NetFlow traffic analysis.The Orion NPM server must be version 7 or later.2. Click Start > All Programs > SolarWinds Orion Network PerformanceMonitor > Orion Web Console.3. Click NetFlow Traffic Analyzer.14 Getting StartedOrion NetFlow Traffic Analyzer QuickStart GuideGetting Started 15Orion NetFlow Traffic Analyzer QuickStart GuideChapter 4Working with Orion NetFlow Traffic Analyzer While Orion NPM can tell you the bandwidth usage on a given interface, Orion NetFlow Traffic Analyzer takes that capability one step further, providing who is using the bandwidth and for what applications.The following scenarios help illustrate the value of Orion NetFlow Traffic Analyzer and how it can immediately offer you a significant return on your investment. Locating and Isolating an Infected ComputerYou can use your currently installed Orion instance, with the addition of Orion NetFlow Traffic Analyzer, to quickly pinpoint and respond to the many self-propagating viruses in the wild. Consider the following scenario:1. A local branch of your banking network handling all your credit cardtransactions complains of an extremely sluggish network, causing frequent timeouts during sensitive data transfers.2. You open the Orion web console and see that the link to the net is up at thesite. You consult your Percent Utilization chart and immediately see that your normal utilization is 15-25%, but current utilization is 98% utilization.3. You click the NetFlow Traffic Analyzer tab, and then click the uplink at thatsite.4. Taking a quick look at the top 5 Endpoints, you see that a single computer inthe 10.10.10.0-10.10.10.255 IP range is generating 80% of the load on your link.5. You know that this computer resides in a part of the branch that is accessibleto customers for personal transactions using the web.6. You quickly see that 100% of the last two hours of traffic generated by thiscomputer has been over port 1883.7. Knowing that you don’t have any devices using IBM MQSeries messaging inthe customer accessible location, nor any other services or protocols thatrequire 1883, you recognize this as a virus exploit.8. You quickly use your configuration management tool, for example CirrusConfiguration Manager, to push a new configuration to your firewall thatblocks port 1883.Working with Orion NetFlow Traffic Analyzer 17。
- 1、下载文档前请自行甄别文档内容的完整性,平台不提供额外的编辑、内容补充、找答案等附加服务。
- 2、"仅部分预览"的文档,不可在线预览部分如存在完整性等问题,可反馈申请退款(可完整预览的文档不适用该条件!)。
- 3、如文档侵犯您的权益,请联系客服反馈,我们会尽快为您处理(人工客服工作时间:9:00-18:30)。
NetFlow是一种数据交换方式。
Netflow提供网络流量的会话级视图,记录下每个TCP/IP事务的信息。
也许它不能象tcpdump那样提供网络流量的完整记录,但是当汇集起来时,它更加易于管理和易读。
Netflow由Cisco创造。
工作原理:NetFlow利用标准的交换模式处理数据流的第一个IP包数据,生成NetFlow 缓存,随后同样的数据基于缓存信息在同一个数据流中进行传输,不再匹配相关的访问控制等策略,NetFlow缓存同时包含了随后数据流的统计信息。
NetFlow有两个核心的组件:NetFlow缓存,存储IP流信息;NetFlow的数据导出或传输机制,NetFlow利用此机制将数据发送到网络管理采集器。
概念:一个NetFlow流定义为在一个源IP地址和目的IP地址间传输的单向数据包流,且所有数据包具有共同的传输层源、目的端口号。
确定Flow的标识:SIP+DIP+SPORT+DPORT +Layer 3 protocol type + TOS byte() + Router or switch interface
数据采集格式
NFC(Cisco NetFlow Collector) 可以定制多种NetFlow数据采集格式,下例为NFC2.0采集的一种流量数据实例,本文的分析都基于这种格式。
61.*.*.68|61.*.*.195|64917|Others|9|13|4528|135|6|4|192|1
数据中各字段的含义如下:
源地址|目的地址|源自治域|目的自治域|流入接口号|流出接口号|源端口|目的端口|协议
类型|包数量|字节数|流数量
cache缓存空间
可配置的Cache维护机制
一般情况下Cache空间的占用是与所监控的Flow数量呈正比的,但是当链路中充斥着大量的短连接Session时,
Flow表项数量可能会因为没有得到及时释放而过多占用有限的Cache空间。
为此,NetFlow 提供了一种非常复杂、
高效的算法以快速定位一个数据包在该Cache中的位置或判断是否应新建表项,并且通过管理员给定
的阀值进行各类表项的超时导出,从而及时释放老的表项以容纳新建Flow信息。
Flow Cache表项Timed-Out操作可由以下几项因素进行驱动:
该表项已经空闲了指定的时间长度(Inactive Timer,缺省15 seconds);
长连接会话强制超时(Active Timer,缺省30 minutes);
缓存空间耗尽所触发的强制超时;
TCP FIN/RST触发的超时。
规范的导出报文格式
NetFlow采用了主动式数据推送机制,一般用UDP传送。
NetFlow的封装格式分为1个Header和若干个Record:
Header:主要包括版本号、序列号、后续Record数量、系统启动时间等;
Record:提供对每个Flow的详细数据记录。
下文以NetFlow V9为例,输出报文Header与Record整体结构如下所示:
Template功能:NetFlow V9是首先对Template进行支持的版本,
通过Template功能NetFlow V9获得了前所未有的扩展灵活性。
Template描述了NetFlow输出记录的各字段定义,无需改变现有
规范即可支持将来可能出现的增强功能,从而无需重新编译、
修改流量采集分析系统即可快速支持新增功能特征。
Flow具备详尽的会话描述能力。
在NetFlow V9中,缺省提供了多达89种字段类型,并允许通过Template和
Aggregation机制进行任意组合、汇聚,能够详细描述流量分布的各类特征.
NetFlow与SNMP的不同
无论是MIB还是后来的RMON,SNMP所针对的信息一般都围绕网元设备展开,如Interface吞吐率、
接收到的坏帧数量、CPU/RAM利用率等。
而NetFlow正如同它的名字一样,其所关注的重点在于网络链
路上所传输流量的特征信息,并且这些信息能够更直接的反映出当前网络上访问行为分
布以及合同客户此时所得到的真实的服务质量水平。
NetFlow与SNMP的主要差异可以从以下几点得到说明:
NetFlow关注流量特征,SNMP关注设备状态;
NetFlow直接围绕Session会话连接进行数据提取,而SNMP则以物理接口为基本单位进行数据统计;
从Agent角度来看,NetFlow采用数据主动推送技术,SNMP则主要采取被动轮询机制;
NetFlow数据信息更为丰富、描述能力更强;
NetFlow支持抽样操作,具备良好的扩展弹性,能够更好适应高端网络实际需求;
SNMP功能通常随着设备销售而免费提供,而在很多现有设备中,NetFlow作为增值功能则需要额外
购买许可License或特定软件包。
因此,在网络流量测量及分析系统中,如异常流量分析系统,NetFlow已经成为一个重要的数据提取方式,
为高端网络骨干链路的实时流量采集
分析提供高效、准确的数据摘要提取服务,是网络流量分析阵营不可或缺的基础技术。
限制条件
需要网络设备对NetFlow的支持,需要分析NetFlow数据的工具软件,需要网络管理员准确区分正常流量数据和异常流量数据等。
挑战者SFlow
同NetFlow一样,sFlow是一种向采集器发送报告的推送技术。
所不同的是,NetFlow是一种基于软件的技术,而sFlow则采用内置在硬件中的专用芯片。
这种做法消除了路由器或交换机的CPU和内存的负担。
sFlow系统的基本原理为:分布在网络不同位置的sFlow代理把sFlow数据报源源不断地传送给中央sFlow采集器,采集器对sFlow数据报进行分析并生成丰富的、实时的、全网范围的传输流视图。
sFlow是一种纯数据包采样技术,即每一个被采样的X包的长度被记录下来,而大部分的包则被丢弃,只留下样本被传送给采集器。
由于这项技术是基于样本的,如果没有复杂的算法来尝试推测准确的会话字节量,那么几乎不可能获得每台主机流量100%的准确值。
在使用这项技术时,交换机每隔100个数据包(可配置)对每个接口采一次样,然后将它传送给采集器。
sFlow 的规格也支持1比1的采样率,即对每一个数据包都进行“采样”。
对数据包最大采样频率的限制取决于具体的芯片厂商和sFlow实现情况。
NetFlow更多的是在路由器上得到支持,而sFlow则在交换机上更加流行。
两者都是开放标准,但在非常大的流量传输环境中,sFlow采样架构可能要优于NetFlows汇集方式。
其他Flow。