单服务排队系统MATLAB仿真程序
MATLAB模拟银行单服务台排队模型

MATLAB模拟银行单服务台排队模型银行单服务台排队模型是一种常见的排队模型,主要用于描述在银行等排队服务场所中,只有一个服务员的情况下,客户如何排队等待服务的情况。
1.模型假设在进行银行单服务台排队模型的建模过程中,我们需要进行一些假设,以简化问题的复杂性。
这些假设包括:-客户到达时间服从泊松分布:客户到达时间间隔服从泊松分布,即客户到达服从一个固定的时间间隔。
-服务时间服从指数分布:每个客户的服务时间是独立同分布的,服从指数分布。
-服务台只有一个:我们假设只有一个服务台,客户按照到达的顺序排队等待服务。
-客户不能提前离开:我们不考虑客户在等待期间可能会放弃等待而提前离开的情况。
2.模型参数在建立银行单服务台排队模型时,我们需要定义一些模型参数。
这些参数包括:-平均到达率λ:客户的平均到达率,表示单位时间内到达的客户数量的期望值。
-平均服务率μ:服务员的平均服务率,表示单位时间内服务的客户数量的期望值。
-服务台利用率ρ:服务台的利用率,表示服务台的平均使用率。
-平均等待时间W:客户平均等待服务的时间。
-平均队列长度L:客户平均排队等待的队列长度。
3.模拟过程为了模拟银行单服务台排队模型,我们使用MATLAB编程进行模拟。
以下是一个简单的模拟过程:-生成客户到达时间间隔:使用泊松分布生成客户到达时间间隔。
-生成客户服务时间:使用指数分布生成客户的服务时间。
-计算客户到达时间和服务完成时间:根据客户的到达时间间隔和服务时间,计算客户的到达时间和服务完成时间。
-计算客户的等待时间:根据客户的到达时间和服务完成时间,计算客户的等待时间。
-统计模拟结果:统计客户的等待时间、队列长度等模拟结果。
4.结果分析通过对模拟结果的分析,我们可以得到一些关键的结果,包括:-平均等待时间:通过计算客户的平均等待时间,可以评估服务台的效率和客户的等待体验。
-平均队列长度:通过计算客户的平均排队等待的队列长度,可以评估服务台的负载情况。
基于MatLab的排队系统仿真研究

/(-  ̄ 1p) 一
客户到达
— — — — — — —
— — — 型 H 器 童 f l I — — — 丽辑 —圭 —塑— 1 — —4 — — ~
f ) / c 统 的 数 学 特 性 3 M M, 系 M M/ 的 排 队 系 统 有 c台服 务 器 . 台服 务 器 独 立 / e 每 工 作 . 具 有 相 同分 布 的 服 务 时 间 , 们 假 设 所 有 服 务 且 我
0 引 言
排 队论 是 研 究 系 统 由于 随 机 因 素 的干 扰 而 出 现 排 队现 象 的一 门学 科 排 队是 日常 生 活 中经 常 遇 到 的 现 象 。例 如 : 出行 坐 火 车等 待 检票 进 站 的 排 队 ; 食 堂 打 到 饭所 形成的排 队 ; 校 打预防针 , 检所 形成 的排 队 ; 学 体 看 电影 、 游 时前 往售 票 处 购 票 形 成 的排 队等 。 近 几 旅 最
服 务 效 率 与 最合 理 的 配 置 。应 用 Ma a t b对 M/ c M / / / 等排 队 系 统进 行 仿 真 , 仿 L M/ , M c N 对
真 结 果进 行 评 估 , 果 表 明 , 方 法是 切 实 可行 的。 结 该
关 键 词 :仿 真 ;MaL b¥言 ;排 队 系统 ;马可 夫过 程 ta i
图 1 单 服 务 台 排 队 系 统 的 结构 模 型
台是空 的概率 P, n所有服务 台都在忙 的概率 P , 由下面
12 排 队 系统 的数 学特 性 .
( ) 人记 号 和重 要 度 量 参 数 1引
收 稿 日期 :0 0 7 2 2 1 —0 ~ 0 修 稿 日期 :0 0 0 —1 21— 8 1
排队系统仿真matlab实验报告

M/M/1排队系统实验报告一、实验目的本次实验要求实现M/M/1单窗口无限排队系统的系统仿真,利用事件调度法实现离散事件系统仿真,并统计平均队列长度以及平均等待时间等值,以与理论分析结果进行对比。
二、实验原理根据排队论的知识我们知道,排队系统的分类是根据该系统中的顾客到达模式、服务模式、服务员数量以及服务规则等因素决定的。
1、 顾客到达模式设到达过程是一个参数为λ的Poisson 过程,则长度为t 的时间内到达k 个呼叫的概率 服从Poisson 分布,即e t kk k t t p λλ-=!)()(,⋅⋅⋅⋅⋅⋅⋅⋅⋅=,2,1,0k ,其中λ>0为一常数,表示了平均到达率或Poisson 呼叫流的强度。
2、 服务模式设每个呼叫的持续时间为i τ,服从参数为μ的负指数分布,即其分布函数为{}1,0t P X t e t μ-<=-≥3、 服务规则先进先服务的规则(FIFO )4、 理论分析结果在该M/M/1系统中,设λρμ=,则稳态时的平均等待队长为1Q ρλρ=-,顾客的平均等待时间为T ρμλ=-。
三、实验内容M/M/1排队系统:实现了当顾客到达分布服从负指数分布,系统服务时间也服从负指数分布,单服务台系统,单队排队,按FIFO (先入先出队列)方式服务。
四、采用的语言MatLab 语言源代码:clear;clc;%M/M/1排队系统仿真SimTotal=input('请输入仿真顾客总数SimTotal='); %仿真顾客总数;Lambda=0.4; %到达率Lambda;Mu=0.9; %服务率Mu;t_Arrive=zeros(1,SimTotal);t_Leave=zeros(1,SimTotal);ArriveNum=zeros(1,SimTotal);LeaveNum=zeros(1,SimTotal);Interval_Arrive=-log(rand(1,SimTotal))/Lambda;%到达时间间隔Interval_Serve=-log(rand(1,SimTotal))/Mu;%服务时间t_Arrive(1)=Interval_Arrive(1);%顾客到达时间ArriveNum(1)=1;for i=2:SimTotalt_Arrive(i)=t_Arrive(i-1)+Interval_Arrive(i);ArriveNum(i)=i;endt_Leave(1)=t_Arrive(1)+Interval_Serve(1);%顾客离开时间LeaveNum(1)=1;for i=2:SimTotalif t_Leave(i-1)<t_Arrive(i)t_Leave(i)=t_Arrive(i)+Interval_Serve(i);elset_Leave(i)=t_Leave(i-1)+Interval_Serve(i);endLeaveNum(i)=i;endt_Wait=t_Leave-t_Arrive; %各顾客在系统中的等待时间t_Wait_avg=mean(t_Wait);t_Queue=t_Wait-Interval_Serve;%各顾客在系统中的排队时间t_Queue_avg=mean(t_Queue);Timepoint=[t_Arrive,t_Leave];%系统中顾客数随时间的变化Timepoint=sort(Timepoint);ArriveFlag=zeros(size(Timepoint));%到达时间标志CusNum=zeros(size(Timepoint));temp=2;CusNum(1)=1;for i=2:length(Timepoint)if (temp<=length(t_Arrive))&&(Timepoint(i)==t_Arrive(temp)) CusNum(i)=CusNum(i-1)+1;temp=temp+1;ArriveFlag(i)=1;elseCusNum(i)=CusNum(i-1)-1;endend%系统中平均顾客数计算Time_interval=zeros(size(Timepoint));Time_interval(1)=t_Arrive(1);for i=2:length(Timepoint)Time_interval(i)=Timepoint(i)-Timepoint(i-1);endCusNum_fromStart=[0 CusNum];CusNum_avg=sum(CusNum_fromStart.*[Time_interval 0] )/Timepoint(end);QueLength=zeros(size(CusNum));for i=1:length(CusNum)if CusNum(i)>=2QueLength(i)=CusNum(i)-1;elseQueLength(i)=0;endendQueLength_avg=sum([0 QueLength].*[Time_interval 0] )/Timepoint(end);%系统平均等待队长%仿真图figure(1);set(1,'position',[0,0,1000,700]);subplot(2,2,1);title('各顾客到达时间和离去时间');stairs([0 ArriveNum],[0 t_Arrive],'b');hold on;stairs([0 LeaveNum],[0 t_Leave],'y');legend('到达时间','离去时间');hold off;subplot(2,2,2);stairs(Timepoint,CusNum,'b')title('系统等待队长分布');xlabel('时间');ylabel('队长');subplot(2,2,3);title('各顾客在系统中的排队时间和等待时间');stairs([0 ArriveNum],[0 t_Queue],'b');hold on;stairs([0 LeaveNum],[0 t_Wait],'y');hold off;legend('排队时间','等待时间');%仿真值与理论值比较disp(['理论平均等待时间t_Wait_avg=',num2str(1/(Mu-Lambda))]);disp(['理论平均排队时间t_Wait_avg=',num2str(Lambda/(Mu*(Mu-Lambda)))]);disp(['理论系统中平均顾客数=',num2str(Lambda/(Mu-Lambda))]);disp(['理论系统中平均等待队长=',num2str(Lambda*Lambda/(Mu*(Mu-Lambda)))]);disp(['仿真平均等待时间t_Wait_avg=',num2str(t_Wait_avg)])disp(['仿真平均排队时间t_Queue_avg=',num2str(t_Queue_avg)])disp(['仿真系统中平均顾客数=',num2str(CusNum_avg)]);disp(['仿真系统中平均等待队长=',num2str(QueLength_avg)]);五、数据结构1.仿真设计算法(主要函数)利用负指数分布与泊松过程的关系,产生符合泊松过程的顾客流,产生符合负指数分布的随机变量作为每个顾客的服务时间:Interval_Arrive=-log(rand(1,SimTotal))/Lambda;%到达时间间隔,结果与调用exprnd(1/Lambda,m)函数产生的结果相同Interval_Serve=-log(rand(1,SimTotal))/Mu;%服务时间间隔t_Arrive(1)=Interval_Arrive(1);%顾客到达时间时间计算t_Wait=t_Leave-t_Arrive;%各顾客在系统中的等待时间t_Queue=t_Wait-Interval_Serve; %各顾客在系统中的排队时间由事件来触发仿真时钟的不断推进。
queuing modeling排队论的matlab仿真(包括仿真代码)

Wireless Network Experiment Three: Queuing TheoryABSTRACTThis experiment is designed to learn the fundamentals of the queuing theory. Mainly about the M/M/S and M/M/n/n queuing MODELS.KEY WORDS: queuing theory, M/M/s, M/M/n/n, Erlang B, Erlang C. INTRODUCTIONA queue is a waiting line and queueing theory is the mathematical theory of waiting lines. More generally, queueing theory is concerned with the mathematical modeling and analysis of systems that provide service to random demands. In communication networks, queues are encountered everywhere. For example, the incoming data packets are randomly arrived and buffered, waiting for the router to deliver. Such situation is considered as a queue. A queueing model is an abstract description of such a system. Typically, a queueing model represents (1) the system's physical configuration, by specifying the number and arrangement of the servers, and (2) the stochastic nature of the demands, by specifying the variability in the arrival process and in the service process.The essence of queueing theory is that it takes into account the randomness of the arrival process and the randomness of the service process. The most common assumption about the arrival process is that the customer arrivals follow a Poisson process, where the times between arrivals are exponentially distributed. The probability of the exponential distribution function●Erlang B modelOne of the most important queueing models is the Erlang B model (i.e., M/M/n/n). It assumes that the arrivals follow a Poisson process and have a finite n servers. In Erlang B model, it assumes that the arrival customers are blocked and cleared when all the servers are busy. The blocked probability of a Erlang B model is given by the famous Erlang B formula,w here n is the number of servers and A= is the offered load in Erlangs, is the arrival rate and is the average service time. Formula (1.1) is hard to calculate directly from its right side when n and A are large. However, it is easy to calculate it using the following iterative scheme:●Erlang C modelThe Erlang delay model (M/M/n) is similar to Erlang B model, except that now it assumes that the arrival customers are waiting in a queue for a server to become available without considering the length of the queue. The probability of blocking (all the servers are busy) is given by the Erlang C formula,Where if and if . The quantity indicates the server utilization. The Erlang C formula (1.3) can be easily calculated by the following iterative schemewhere is defined in Eq.(1.1).DESCRIPTION OF THE EXPERIMENTSing the formula (1.2), calculate the blocking probability of the Erlang B model.Draw the relationship of the blocking probability PB(n,A) and offered traffic A with n = 1,2, 10, 20, 30, 40, 50, 60, 70, 80, 90, 100. Compare it with the table in the text book (P.281, table 10.3).From the introduction, we know that when the n and A are large, it is easy to calculate the blocking probability using the formula 1.2 as follows.it use the theory of recursion for the calculation. But the denominator and the numerator of the formula both need to recurs() when doing the matlab calculation, it waste time and reduce the matlab calculation efficient. So we change the formula to be :Then the calculation only need recurs once time and is more efficient.The matlab code for the formula is: erlang_b.m%**************************************% File: erlanb_b.m% A = offered traffic in Erlangs.% n = number of truncked channels.% Pb is the result blocking probability.%**************************************function [ Pb ] = erlang_b( A,n )if n==0Pb=1; % P(0,A)=1elsePb=1/(1+n/(A*erlang_b(A,n-1))); % use recursion "erlang(A,n-1)" endendAs we can see from the table on the text books, it uses the logarithm coordinate, so we also use the logarithm coordinate to plot the result. We divide the number of servers(n) into three parts, for each part we can define a interval of the traffic intensity(A) based on the figure on the text books :1. when 0<n<10, 0.1<A<10.2. when 10<n<20, 3<A<20.3. when 30<n<100, 13<A<120.For each part, use the “erlang_b”function to calculate and then use “loglog”function to figure the logarithm coordinate.The matlab code is :%*****************************************% for the three parts.% n is the number servers.% A is the traffic indensity.% P is the blocking probability.%*****************************************n_1 = [1:2];A_1 = linspace(0.1,10,50); % 50 points between 0.1 and 10.n_2 = [10:10:20];A_2 = linspace(3,20,50);n_3 = [30:10:100];A_3 = linspace(13,120,50);%*****************************************% for each part, call the erlang_b() function.%*****************************************for i = 1:length(n_1)for j = 1:length(A_1)p_1(j,i) = erlang_b(A_1(j),n_1(i));endendfor i = 1:length(n_2)for j = 1:length(A_2)p_2(j,i) = erlang_b(A_2(j),n_2(i));endendfor i = 1:length(n_3)for j = 1:length(A_3)p_3(j,i) = erlang_b(A_3(j),n_3(i));endend%*****************************************% use loglog to figure the result within logarithm coordinate. %*****************************************loglog(A_1,p_1,'k-',A_2,p_2,'k-',A_3,p_3,'k-');xlabel('Traffic indensity in Erlangs (A)')ylabel('Probability of Blocking (P)')axis([0.1 120 0.001 0.1])text(.115, .115,'n=1')text(.6, .115,'n=2')text(7, .115,'10')text(17, .115,'20')text(27, .115,'30')text(45, .115,'50')text(100, .115,'100')The figure on the text books is as follow:We can see from the two pictures that, they are exactly the same with each other except that the result of the experiment have not considered the situation with n=3,4,5,…,12,14,16,18.ing the formula (1.4), calculate the blocking probability of the Erlang C model.Draw the relationship of the blocking probability PC(n,A) and offered traffic A with n = 1,2, 10, 20, 30, 40, 50, 60, 70, 80, 90, 100.From the introduction, we know that the formula 1.4 is :Since each time we calculate the , we need to recurs n times, so the formula is not efficient. We change it to be:Then we only need recurs once. is calculated by the “erlang_b” function as step 1.The matlab code for the formula is : erlang_c.m%**************************************% File: erlanb_b.m% A = offered traffic in Erlangs.% n = number of truncked channels.% Pb is the result blocking probability.% erlang_b(A,n) is the function of step 1.%**************************************function [ Pc ] = erlang_c( A,n )Pc=1/((A/n)+(n-A)/(n*erlang_b(A,n)));endThen to figure out the table in the logarithm coordinate as what shown in the step 1.The matlab code is :%*****************************************% for the three parts.% n is the number servers.% A is the traffic indensity.% P_c is the blocking probability of erlangC model.%*****************************************n_1 = [1:2];A_1 = linspace(0.1,10,50); % 50 points between 0.1 and 10.n_2 = [10:10:20];A_2 = linspace(3,20,50);n_3 = [30:10:100];A_3 = linspace(13,120,50);%*****************************************% for each part, call the erlang_c() function.%*****************************************for i = 1:length(n_1)for j = 1:length(A_1)p_1_c(j,i) = erlang_c(A_1(j),n_1(i));%µ÷Óú¯Êýerlang_cendendfor i = 1:length(n_2)for j = 1:length(A_2)p_2_c(j,i) = erlang_c(A_2(j),n_2(i));endendfor i = 1:length(n_3)for j = 1:length(A_3)p_3_c(j,i) = erlang_c(A_3(j),n_3(i));endend%*****************************************% use loglog to figure the result within logarithm coordinate. %*****************************************loglog(A_1,p_1_c,'g*-',A_2,p_2_c,'g*-',A_3,p_3_c,'g*-');xlabel('Traffic indensity in Erlangs (A)')ylabel('Probability of Blocking (P)')axis([0.1 120 0.001 0.1])text(.115, .115,'n=1')text(.6, .115,'n=2')text(6, .115,'10')text(14, .115,'20')text(20, .115,'30')text(30, .115,'40')text(39, .115,'50')text(47, .115,'60')text(55, .115,'70')text(65, .115,'80')text(75, .115,'90')text(85, .115,'100')The result of blocking probability table of erlang C model.Then we put the table of erlang B and erlang C in the one figure, to compare their characteristic.The line with ‘ * ’ is the erlang C model, the line without ‘ * ’ is the erlang B model. We can see from the picture that, for a constant traffic intensity (A), the erlang C model has a higher blocking probability than erlang B model. The blocking probability is increasing with traffic intensity. The system performs better when has a larger n.ADDITIONAL BONUSWrite a program to simulate a M/M/k queue system with input parameters of lamda, mu, k.In this part, we will firstly simulate the M/M/k queue system use matlab to get the figure of the performance of the system such as the leave time of each customer and the queue lengthof the system.About the simulation, we firstly calculate the arrive time and the leave time for each customer. Then analysis out the queue length and the wait time for each customer use “for” loops.Then we let the input to be lamda = 3, mu = 1 and S = 3, and analysis performance of the system for the first 10 customers in detail.Finally, we will do two test to compared the performance of the system with input lamda = 1, mu = 1 and S = 3 and the input lamda = 4, mu = 1 and S = 3.The matlab code is:mms_function.mfunction[block_rate,use_rate]=MMS_function(mean_arr,mean_serv,peo_num,server_num) %%%%%%%%%%%%%%%%%%%%%%%%%%%%%%%%%%%%%%%%%%%%% %%%%%%%%%%%%%%%%%%%%%%%%%%%%first part: compute the arriving time interval, service time%interval,waiting time, leaving time during the whole service interval %%%%%%%%%%%%%%%%%%%%%%%%%%%%%%%%%%%%%%%%%%%%% %%%%%%%%%%%%%%%%%%%%%%%%%%%state=zeros(5,peo_num);%represent the state of each customer by%using a 5*peo_num matrix%the meaning of each line is: arriving time interval, service time%interval, waiting time, queue length when NO.ncustomer%arrive, leaving timestate(1,:)=exprnd(1/mean_arr,1,peo_num);%arriving time interval between each%customer follows exponetial distributionstate(2,:)=exprnd(1/mean_serv,1,peo_num);%service time of each customer follows exponetial distributionfor i=1:server_numstate(3,1:server_num)=0;endarr_time=cumsum(state(1,:));%accumulate arriving time interval to compute%arriving time of each customerstate(1,:)=arr_time;state(5,1:server_num)=sum(state(:,1:server_num));%compute living time of first NO.server_num%customer by using fomular arriving time + service timeserv_desk=state(5,1:server_num);%create a vector to store leaving time of customers which is in service for i=(server_num+1):peo_numif arr_time(i)>min(serv_desk)state(3,i)=0;elsestate(3,i)=min(serv_desk)-arr_time(i);%when customer NO.i arrives and the%server is all busy, the waiting time can be compute by%minus arriving time from the minimum leaving timeendstate(5,i)=sum(state(:,i));for j=1:server_numif serv_desk(j)==min(serv_desk)serv_desk(j)=state(5,i);breakend%replace the minimum leaving time by the first waiting customer'sleaving timeendend%%%%%%%%%%%%%%%%%%%%%%%%%%%%%%%%%%%%%%%%%%%%% %%%%%%%%%%%%%%%%%%%%%%%%%%%%second part: compute the queue length during the whole service interval %%%%%%%%%%%%%%%%%%%%%%%%%%%%%%%%%%%%%%%%%%%%% %%%%%%%%%%%%%%%%%%%%%%%%%%zero_time=0;%zero_time is used to identify which server is emptyserv_desk(1:server_num)=zero_time;block_num=0;block_line=0;for i=1:peo_numif block_line==0find_max=0;for j=1:server_numif serv_desk(j)==zero_timefind_max=1; %means there is empty serverbreakelse continueendendif find_max==1%update serv_deskserv_desk(j)=state(5,i);for k=1:server_numif serv_desk(k)<arr_time(i) %before the NO.i customer actually arrivesthere maybe some customerleaveserv_desk(k)=zero_time;else continueendendelseif arr_time(i)>min(serv_desk)%if a customer will leave before the NO.i%customer arrivefor k=1:server_numif arr_time(i)>serv_desk(k)serv_desk(k)=state(5,i);breakelse continueendendfor k=1:server_numif arr_time(i)>serv_desk(k)serv_desk(k)=zero_time;else continueendendelse %if no customer leave before the NO.i customer arriveblock_num=block_num+1;block_line=block_line+1;endendelse %the situation that the queue length is not zeron=0;%compute the number of leaing customer before the NO.i customer arrives for k=1:server_numif arr_time(i)>serv_desk(k)n=n+1;serv_desk(k)=zero_time;else continueendendfor k=1:block_lineif arr_time(i)>state(5,i-k)n=n+1;else continueendendif n<block_line+1% n<block_line+1 means the queue length is still not zeroblock_num=block_num+1;for k=0:n-1if state(5,i-block_line+k)>arr_time(i)for m=1:server_numif serv_desk(m)==zero_timeserv_desk(m)=state(5,i-block_line+k)breakelse continueendendelsecontinueendendblock_line=block_line-n+1;else %n>=block_line+1 means the queue length is zero%update serv_desk and queue lengthfor k=0:block_lineif arr_time(i)<state(5,i-k)for m=1:server_numif serv_desk(m)==zero_timeserv_desk(m)=state(5,i-k)breakelse continueendendelsecontinueendendblock_line=0;endendstate(4,i)=block_line;endplot(state(1,:),'*-');figureplot(state(2,:),'g');figureplot(state(3,:),'r*');figureplot(state(4,:),'y*');figureplot(state(5,:),'*-');Since the system is M/M/S which means the arriving rate and service rate follows Poisson distribution while the number of server is S and the buffer length is infinite, we can computeall the arriving time, service time, waiting time and leaving time of each customer. We can test the code with input lamda = 3, mu = 1 and S = 3. Figures are below.Arriving time of each customerService time of each customerWaiting time of each customer Queue length when each customer arriveLeaving time of each customerAs lamda == mu*server_num, the load of the system could be very high.Then we will zoom in the result pictures to analysis the performance of the system for the firstly 10 customer.The first customer enterthe system at about 1s.Arriving time of first 10 customerThe queue length is 1for the 7th customer.Queue length of first 10 customerThe second customerleaves the system atabout 1.3sLeaving time of first 10 customer1.As we have 3 server in this test, the first 3 customer will be served without any delay.2.The arriving time of customer 4 is about 1.4 and the minimum leaving time of customerin service is about 1.2. So customer 4 will be served immediately and the queue length is still 0.3.Customer 1, 4, 3 is in service.4.The arriving time of customer 5 is about 1.8 and the minimum leaving time of customerin service is about 1.6. So customer 5 will be served immediately and the queue length is still 0.5.Customer 1, 5 is in service.6.The arriving time of customer 6 is about 2.1 and there is a empty server. So customer 6will be served immediately and the queue length is still 0.7.Customer 1, 5, 6 is in service.8.The arriving time of customer 7 is about 2.2 and the minimum leaving time of customerin service is about 2.5. So customer 7 cannot be served immediately and the queue length will be 1.9.Customer 1, 5, 6 is in service and customer 7 is waiting.10.The arriving time of customer 8 is about 2.4 and the minimum leaving time of customerin service is about 2.5. So customer 8 cannot be served immediately and the queue length will be 2.11.Customer 1, 5, 6 is in service and customer 7, 8 is waiting.12.The arriving time of customer 9 is about 2.5 and the minimum leaving time of customerin service is about 2.5. So customer 7 can be served and the queue length will be 2.13.Customer 1, 7, 6 is in service and customer 8, 9 is waiting.14.The arriving time of customer 10 is about 3.3 and the minimum leaving time of customerin service is about 2.5. So customer 8, 9, 10 can be served and the queue length will be 0.15.Customer 7, 9, 10 is in service.Test 2:lamda = 1, mu = 1 and S = 3Waiting time of customerQueue length when each customer arriveAs lamda < mu*server_num, the performance of the system is much better.Test 3:lamda = 4, mu = 1 and S = 3Waiting time of customerQueue length when each customer arriveAs lamda > mu*server_num, system will crash as the waiting time and queue length increases as new customer arrives. For the situation of lamda<mu*server_num, the system performs better when mu and server_num are both not small. If the mu is smaller than lamda or we only have one server though with large mu, the system works not very good. It is may be because that the server time for each customer is a Poisson distribution, it may be a large time though the mu is large enough, so the more number of server, the better of the performance of the system.CONCLUSTIONAfter the experiment, we have a deeply understanding of the queuing theory, including the erlang B model and the erlang C model. What’s more, we are familiar with how to simulate the queue system for M/M/s. Through the simulation, we have known how the queue system works and the performance of the system with different input parameter.。
实验2单服务台单队列排队系统仿真

实验2排队系统仿真一、学习目的1.了解仿真的特点2.学习如何建构模型3.熟悉eM-Plant基本的对象和操作4.掌握排队系统的特点与仿真的实现方法二、问题描述该银行服务窗口为每个到达的顾客服务的时间是随机的,表2.4是顾客服务时间纪录的统计结果表2.4 每个顾客服务时间的概率分布对于上述这样一个单服务待排队系统,仿真分析30天,分析该系统中顾客的到达、等待和被服务情况,以及银行工作人员的服务和空闲情况。
三、系统建模3.1 仿真目标通过对银行排队系统的仿真,研究银行系统的服务水平和改善银行服务水平的方法,为银行提高顾客满意度,优化顾客服务流程服务。
3.2.系统建模3.2.1 系统调研1. 系统结构: 银行服务大厅的布局, 涉及的服务设备2. 系统的工艺参数: 到达-取号-等待-服务-离开3. 系统的动态参数: 顾客的到达时间间隔, 工作人员的服务时间4. 逻辑参数: 排队规则, 先到先服务5. 系统的状态参数: 排队队列是否为空, 如果不为空队长是多少, 服务台是否为空6. 系统的输入输出变量:输入变量确定其分布和特征值,顾客的到达时间间隔的概率分布表和每个顾客被服务时间的概率分布. 输出变量根据仿真目标设定. 包括队列的平均队长、最大队长、仿真结束时队长、总服务人员、每个顾客的平均服务时间、顾客平均排队等待服务时间、业务员利用率等。
3.2.2系统假设1.取号机前无排队,取号时间为02.顾客排队符合先进先出的排队规则3.一个服务台一次只能对一个顾客服务4.所有顾客只有一种单一服务5.仿真时间为1个工作日(8小时)6.等候区的长度为无限长3.2.3系统建模系统模型:3.2.4 仿真模型1.实体:银行系统中的实体是人(主动体)2.属性:到达时间间隔、接受服务的时间、接受服务类型3.事件:顾客到达、开始取号、取号结束、进入队列、出队列、接受服务、服务完成、离开银行。
4.活动:到达、取号、排队、服务、离开5.资源:取号机、排队的座椅、服务柜台4 系统仿真4.1 eM-plant 界面与主要控件介绍1. 实体:eM-Plant 中包括3类实体:entity ,container ,transporter 。
排队论的matlab仿真(包括仿真代码)

Wireless Network Experiment Three: Queuing TheoryABSTRACTThis experiment is designed to learn the fundamentals of the queuing theory.Mainly about the M/M/S and M/M/n/n queuing models.KEY WORDS:queuing theory,M/M/s,M/M/n/n,Erlang B,Erlang C. INTRODUCTIONA queue is a waiting line and queueing theory is the mathematical theory of waiting lines. More generally,queueing theory is concerned with the mathematical modeling and analysis of systems that provide service to random demands.In communication networks,queues are encountered everywhere.For example,the incoming data packets are randomly arrived and buffered,waiting for the router to deliver.Such situation is considered as a queue.A queueing model is an abstract description of such a system.Typically,a queueing model represents(1) the system's physical configuration,by specifying the number and arrangement of the servers, and(2)the stochastic nature of the demands,by specifying the variability in the arrival process and in the service process.The essence of queueing theory is that it takes into account the randomness of the arrival process and the randomness of the service process.The most common assumption about the arrival process is that the customer arrivals follow a Poisson process,where the times between arrivals are exponentially distributed.The probability of the exponential distribution functionis.●Erlang B modelOne of the most important queueing models is the Erlang B model(i.e.,M/M/n/n).It assumes that the arrivals follow a Poisson process and have a finite n servers.In Erlang B model,it assumes that the arrival customers are blocked and cleared when all the servers are busy.The blocked probability of a Erlang B model is given by the famous Erlang B formula,w here n is the number of servers and A=is the offered load in Erlangs,is the arrival rate and is the average service time.Formula(1.1)is hard to calculate directly from its right side when n and A are large.However,it is easy to calculate it using the following iterative scheme:●Erlang C modelThe Erlang delay model(M/M/n)is similar to Erlang B model,except that now it assumes that the arrival customers are waiting in a queue for a server to become available without considering the length of the queue.The probability of blocking(all the servers are busy)is given by the Erlang C formula,Where if and if.The quantity indicates the server utilization.The Erlang C formula(1.3) can be easily calculated by the following iterative schemewhere is defined in Eq.(1.1).DESCRIPTION OF THE EXPERIMENTSing the formula(1.2),calculate the blocking probability of the Erlang B model.Draw the relationship of the blocking probability PB(n,A)and offered traffic A with n=1,2,10,20,30,40,50,60,70,80,90,pare it with the table in the text book(P.281,table10.3).From the introduction,we know that when the n and A are large,it is easy to calculate the blocking probability using the formula1.2as follows.it use the theory of recursion for the calculation.But the denominator and the numerator of the formula both need to recurs()when doing the matlab calculation,it waste time and reduce the matlab calculation efficient.So we change the formula to be:Then the calculation only need recurs once time and is more efficient.The matlab code for the formula is:erlang_b.m%**************************************%File:erlanb_b.m%A=offered traffic in Erlangs.%n=number of truncked channels.%Pb is the result blocking probability.%**************************************function[Pb]=erlang_b(A,n)if n==0Pb=1;%P(0,A)=1elsePb=1/(1+n/(A*erlang_b(A,n-1)));%use recursion"erlang(A,n-1)" endendAs we can see from the table on the text books,it uses the logarithm coordinate,so we also use the logarithm coordinate to plot the result.We divide the number of servers(n)into three parts,for each part we can define a interval of the traffic intensity(A)based on the figure on the text books:1.when0<n<10,0.1<A<10.2.when10<n<20,3<A<20.3.when30<n<100,13<A<120.For each part,use the“erlang_b”function to calculate and then use“loglog”function to figure the logarithm coordinate.The matlab code is:%*****************************************%for the three parts.%n is the number servers.%A is the traffic indensity.%P is the blocking probability.%*****************************************n_1=[1:2];A_1=linspace(0.1,10,50);%50points between0.1and10.n_2=[10:10:20];A_2=linspace(3,20,50);n_3=[30:10:100];A_3=linspace(13,120,50);%*****************************************%for each part,call the erlang_b()function.%*****************************************for i=1:length(n_1)for j=1:length(A_1)p_1(j,i)=erlang_b(A_1(j),n_1(i));endendfor i=1:length(n_2)for j=1:length(A_2)p_2(j,i)=erlang_b(A_2(j),n_2(i));endendfor i=1:length(n_3)for j=1:length(A_3)p_3(j,i)=erlang_b(A_3(j),n_3(i));endend%*****************************************%use loglog to figure the result within logarithm coordinate. %*****************************************loglog(A_1,p_1,'k-',A_2,p_2,'k-',A_3,p_3,'k-');xlabel('Traffic indensity in Erlangs(A)')ylabel('Probability of Blocking(P)')axis([0.11200.0010.1])text(.115,.115,'n=1')text(.6,.115,'n=2')text(7,.115,'10')text(17,.115,'20')text(27,.115,'30')text(45,.115,'50')text(100,.115,'100')The figure on the text books is as follow:We can see from the two pictures that,they are exactly the same with each other except that the result of the experiment have not considered the situation with n=3,4,5,…,12,14,16,18. ing the formula(1.4),calculate the blocking probability of the Erlang C model.Draw the relationship of the blocking probability PC(n,A)and offered traffic A with n=1,2,10,20,30,40,50,60,70,80,90,100.From the introduction,we know that the formula1.4is:Since each time we calculate the,we need to recurs n times,so the formula is not efficient. We change it to be:Then we only need recurs once.is calculated by the“erlang_b”function as step1.The matlab code for the formula is:erlang_c.m%**************************************%File:erlanb_b.m%A=offered traffic in Erlangs.%n=number of truncked channels.%Pb is the result blocking probability.%erlang_b(A,n)is the function of step1.%**************************************function[Pc]=erlang_c(A,n)Pc=1/((A/n)+(n-A)/(n*erlang_b(A,n)));endThen to figure out the table in the logarithm coordinate as what shown in the step1. The matlab code is:%*****************************************%for the three parts.%n is the number servers.%A is the traffic indensity.%P_c is the blocking probability of erlangC model.%*****************************************n_1=[1:2];A_1=linspace(0.1,10,50);%50points between0.1and10.n_2=[10:10:20];A_2=linspace(3,20,50);n_3=[30:10:100];A_3=linspace(13,120,50);%*****************************************%for each part,call the erlang_c()function.%*****************************************for i=1:length(n_1)for j=1:length(A_1)p_1_c(j,i)=erlang_c(A_1(j),n_1(i));%µ÷Óú¯Êýerlang_cendendfor i=1:length(n_2)for j=1:length(A_2)p_2_c(j,i)=erlang_c(A_2(j),n_2(i));endendfor i=1:length(n_3)for j=1:length(A_3)p_3_c(j,i)=erlang_c(A_3(j),n_3(i));endend%*****************************************%use loglog to figure the result within logarithm coordinate. %*****************************************loglog(A_1,p_1_c,'g*-',A_2,p_2_c,'g*-',A_3,p_3_c,'g*-'); xlabel('Traffic indensity in Erlangs(A)')ylabel('Probability of Blocking(P)')axis([0.11200.0010.1])text(.115,.115,'n=1')text(.6,.115,'n=2')text(6,.115,'10')text(14,.115,'20')text(20,.115,'30')text(30,.115,'40')text(39,.115,'50')text(47,.115,'60')text(55,.115,'70')text(65,.115,'80')text(75,.115,'90')text(85,.115,'100')The result of blocking probability table of erlang C model.Then we put the table of erlang B and erlang C in the one figure,to compare their characteristic.The line with‘*’is the erlang C model,the line without‘*’is the erlang B model.We can see from the picture that,for a constant traffic intensity(A),the erlang C model has a higher blocking probability than erlang B model.The blocking probability is increasing with traffic intensity.The system performs better when has a larger n.ADDITIONAL BONUSWrite a program to simulate a M/M/k queue system with input parameters of lamda, mu,k.In this part,we will firstly simulate the M/M/k queue system use matlab to get the figure of the performance of the system such as the leave time of each customer and the queue length of the system.About the simulation,we firstly calculate the arrive time and the leave time for each customer. Then analysis out the queue length and the wait time for each customer use“for”loops. Then we let the input to be lamda=3,mu=1and S=3,and analysis performance of the system for the first10customers in detail.Finally,we will do two test to compared the performance of the system with input lamda=1, mu=1and S=3and the input lamda=4,mu=1and S=3.The matlab code is:mms_function.mfunction[block_rate,use_rate]=MMS_function(mean_arr,mean_serv,peo_num,server_num) %%%%%%%%%%%%%%%%%%%%%%%%%%%%%%%%%%%%%%%%%%%%% %%%%%%%%%%%%%%%%%%%%%%%%%%%%first part:compute the arriving time interval,service time%interval,waiting time,leaving time during the whole service interval %%%%%%%%%%%%%%%%%%%%%%%%%%%%%%%%%%%%%%%%%%%%% %%%%%%%%%%%%%%%%%%%%%%%%%%%state=zeros(5,peo_num);%represent the state of each customer by%using a5*peo_num matrix%the meaning of each line is:arriving time interval,service time%interval,waiting time,queue length when NO.ncustomer%arrive,leaving timestate(1,:)=exprnd(1/mean_arr,1,peo_num);%arriving time interval between each%customer follows exponetial distributionstate(2,:)=exprnd(1/mean_serv,1,peo_num);%service time of each customer follows exponetial distributionfor i=1:server_numstate(3,1:server_num)=0;endarr_time=cumsum(state(1,:));%accumulate arriving time interval to compute%arriving time of each customerstate(1,:)=arr_time;state(5,1:server_num)=sum(state(:,1:server_num));%compute living time of first NO.server_num%customer by using fomular arriving time+service timeserv_desk=state(5,1:server_num);%create a vector to store leaving time of customers which is in service for i=(server_num+1):peo_numif arr_time(i)>min(serv_desk)state(3,i)=0;elsestate(3,i)=min(serv_desk)-arr_time(i);%when customer NO.i arrives and the%server is all busy,the waiting time can be compute by%minus arriving time from the minimum leaving time endstate(5,i)=sum(state(:,i));for j=1:server_numif serv_desk(j)==min(serv_desk)serv_desk(j)=state(5,i);breakend%replace the minimum leaving time by the first waiting customer'sleaving timeendend %%%%%%%%%%%%%%%%%%%%%%%%%%%%%%%%%%%%%%%%%%%%% %%%%%%%%%%%%%%%%%%%%%%%%%%%%second part:compute the queue length during the whole service interval %%%%%%%%%%%%%%%%%%%%%%%%%%%%%%%%%%%%%%%%%%%%% %%%%%%%%%%%%%%%%%%%%%%%%%%zero_time=0;%zero_time is used to identify which server is emptyserv_desk(1:server_num)=zero_time;block_num=0;block_line=0;for i=1:peo_numif block_line==0find_max=0;for j=1:server_numif serv_desk(j)==zero_timefind_max=1;%means there is empty serverbreakelse continueendendif find_max==1%update serv_deskserv_desk(j)=state(5,i);for k=1:server_numif serv_desk(k)<arr_time(i)%before the NO.i customer actually arrivesthere maybe some customerleaveserv_desk(k)=zero_time;else continueendendelseif arr_time(i)>min(serv_desk)%if a customer will leave before the NO.i%customer arrivefor k=1:server_numif arr_time(i)>serv_desk(k)serv_desk(k)=state(5,i);breakelse continueendendfor k=1:server_numif arr_time(i)>serv_desk(k)serv_desk(k)=zero_time;else continueendendelse%if no customer leave before the NO.i customer arriveblock_num=block_num+1;block_line=block_line+1;endendelse%the situation that the queue length is not zeron=0;%compute the number of leaing customer before the NO.i customer arrives for k=1:server_numif arr_time(i)>serv_desk(k)n=n+1;serv_desk(k)=zero_time;else continueendendfor k=1:block_lineif arr_time(i)>state(5,i-k)n=n+1;else continueendendif n<block_line+1%n<block_line+1means the queue length is still not zeroblock_num=block_num+1;for k=0:n-1if state(5,i-block_line+k)>arr_time(i)for m=1:server_numif serv_desk(m)==zero_timeserv_desk(m)=state(5,i-block_line+k)breakelse continueendendelsecontinueendendblock_line=block_line-n+1;else%n>=block_line+1means the queue length is zero%update serv_desk and queue lengthfor k=0:block_lineif arr_time(i)<state(5,i-k)for m=1:server_numif serv_desk(m)==zero_timeserv_desk(m)=state(5,i-k)breakelse continueendendelsecontinueendendblock_line=0;endendstate(4,i)=block_line;endplot(state(1,:),'*-');figureplot(state(2,:),'g');figureplot(state(3,:),'r*');figureplot(state(4,:),'y*');figureplot(state(5,:),'*-');Since the system is M/M/S which means the arriving rate and service rate follows Poisson distribution while the number of server is S and the buffer length is infinite,we can computeall the arriving time,service time,waiting time and leaving time of each customer. We can test the code with input lamda=3,mu=1and S=3.Figures are below.Arriving time of each customerService time of each customerWaiting time of each customerQueue length when each customer arriveLeaving time of each customerAs lamda==mu*server_num,the load of the system could be very high.Then we will zoom in the result pictures to analysis the performance of the system for the firstly10customer.The first customer enterthe system at about1s.Arriving time of first10customerThe queue length is1for the7th customer.Queue length of first10customerThe second customerleaves the system atabout1.3sLeaving time of first10customer1.As we have3server in this test,the first3customer will be served without any delay.2.The arriving time of customer4is about1.4and the minimum leaving time of customerin service is about1.2.So customer4will be served immediately and the queue length is still0.3.Customer1,4,3is in service.4.The arriving time of customer5is about1.8and the minimum leaving time of customerin service is about1.6.So customer5will be served immediately and the queue length is still0.5.Customer1,5is in service.6.The arriving time of customer6is about2.1and there is a empty server.So customer6will be served immediately and the queue length is still0.7.Customer1,5,6is in service.8.The arriving time of customer7is about2.2and the minimum leaving time of customerin service is about2.5.So customer7cannot be served immediately and the queue length will be1.9.Customer1,5,6is in service and customer7is waiting.10.The arriving time of customer8is about2.4and the minimum leaving time of customerin service is about2.5.So customer8cannot be served immediately and the queue length will be2.11.Customer1,5,6is in service and customer7,8is waiting.12.The arriving time of customer9is about2.5and the minimum leaving time of customerin service is about2.5.So customer7can be served and the queue length will be2.13.Customer1,7,6is in service and customer8,9is waiting.14.The arriving time of customer10is about3.3and the minimum leaving time of customerin service is about2.5.So customer8,9,10can be served and the queue length will be0.15.Customer7,9,10is in service.Test2:lamda=1,mu=1and S=3Waiting time of customerQueue length when each customer arriveAs lamda<mu*server_num,the performance of the system is much better. Test3:lamda=4,mu=1and S=3Waiting time of customerQueue length when each customer arriveAs lamda>mu*server_num,system will crash as the waiting time and queue length increases as new customer arrives.For the situation of lamda<mu*server_num,the system performs better when mu and server_num are both not small.If the mu is smaller than lamda or we only have one server though with large mu,the system works not very good.It is may be because that the server time for each customer is a Poisson distribution,it may be a large time though the mu is large enough,so the more number of server,the better of the performance of the system.CONCLUSTIONAfter the experiment,we have a deeply understanding of the queuing theory,including the erlang B model and the erlang C model.What’s more,we are familiar with how to simulate the queue system for M/M/s.Through the simulation,we have known how the queue system works and the performance of the system with different input parameter.。
数学建模:排队系统仿真

多服务台问题(每个服务台 的服务时间一样)
服务台服务时间为3
顾客到达间隔时间为1
2个服务台
输出排队长的动态 变化情况(用连续 图的形式显示输出)
多服务台问题(每个服务台 的服务时间可以分别设置)
“Stair”形式,即阶梯形式
“Stem”形式,即条状形式
单击“Signal Scope”窗口的“Axes”下拉菜单下的“AutoScale” 子菜单可以改变”Signal Scope”中的坐标
单击“Signal Scope”窗口的“Style”下拉菜单可以改变”Signal Scope”中的输出结果的线性表示形式。
双击“Times-Based Entity Generator”(基于 时间的实体产生器)模块,打开模块设置对 话框,进行模块属性设置。
Generate entities upons(实体产生): 选择”Intergeneration time from port dialog”时,在“Distribution”下拉菜单中 指定如下三种服务时间分布。
5、顾客属性分路形式:根据顾客的属 性,分不同的出口。
路径模块
顾客复制分路模块
顾客复制分路模块
双击顾客复制分路模块
1、顾客复制形式:所有的出口都畅通时,即进行 顾客复制。
2、顾客复制形式:只要有任何一个出口畅通,即 进行顾客复制。
顾客复制分路模块
双击随机数产生器中的 Distribution下来菜单选 择指定随机数。
打开“Single Server”对话框
双击“Single Server”模块
单服务台排队系统仿真

单服务台排队系统仿真单服务台排队系统是指在一个服务台只有一个服务员的情况下,客户需要按顺序等待服务的系统。
本文将介绍一个针对单服务台排队系统的仿真模型。
在设计仿真模型之前,我们需要确定一些重要的参数。
首先是服务时间,即每个客户接受服务所需要的时间。
服务时间可以通过实际观察数据或者估算得出。
其次是到达间隔时间,即每个客户到达的时间间隔。
到达间隔时间可以通过实际观察数据或者使用随机数生成器进行模拟。
首先,我们需要创建一个事件队列来模拟客户的到达和离开。
事件队列是一个按照发生时间顺序排序的队列,每个事件都包含两个属性:时间和类型。
接下来,我们创建一个时钟来记录仿真进行的时间。
初始时,时钟指向第一个到达事件的时间。
然后,我们从事件队列中取出第一个事件,并更新时钟指向该事件的时间。
如果当前事件类型是到达事件,我们需要进行如下操作:首先,模拟下一个客户到达的时间,并将该事件添加到事件队列中。
然后,判断当前是否有客户正在接受服务。
如果没有,我们将当前事件类型设置为离开事件,并模拟该客户的服务时间和离开时间,并将该离开事件添加到事件队列中。
如果有客户正在接受服务,我们将当前事件类型设置为到达事件。
如果当前事件类型是离开事件,我们需要进行如下操作:首先,更新服务台的空闲状态。
然后,判断是否还有等待服务的客户。
如果有,我们将当前事件类型设置为离开事件,并模拟下一个客户的服务时间和离开时间,并将该离开事件添加到事件队列中。
如果没有等待服务的客户,我们将当前事件类型设置为到达事件。
重复上述步骤,直到事件队列中没有事件为止。
最后,我们可以根据仿真的结果,比如客户的等待时间、服务时间和系统繁忙率等指标,来评估和优化该排队系统的性能。
通过以上的模型,我们可以对单服务台排队系统进行仿真,并评估其性能。
我们可以通过改变服务时间、到达间隔时间等参数,来探究不同情况下系统的表现和优化方案。
同时,我们还可以根据仿真结果,对系统进行调整和改进,以提高客户的满意度和服务效率。
排队问题matlab完整程序
function shengclear allclose alltim0=720;%需要模拟的时间[num,pass]=computing(tim0);%计算模拟数据%动画制作envirment %场景title1= annotation('textbox', 'Position',[0.3377 0.8712 0.33480.07885], ...'EdgeColor','none','FitHeightToText','off','FontName','Arial','FontSize',16,...'FontWeight','bold','String',{'理发店忙闲情况分析'});time1 = annotation('textbox','Position',[0.02754 0.1019 0.09420.06538],...'EdgeColor','none','FitHeightToText','off','FontSize',14,'FontWeight',' bold',...'String',{'时间'});hour1 = annotation('textbox','Position',[0.1072 0.1038 0.075360.06346],...'EdgeColor','none','FitHeightToText','off','FontSize',14,...'FontWeight','bold','String',{'08:'});minute1 = annotation('textbox','Position',[0.1493 0.1038 0.072460.06538],...'EdgeColor','none','FitHeightToText','off', 'FontSize',14,...'FontWeight','bold','String',{'10'});counter1=1; %时间计数temp1=1; %顾客计数counter=1;counterxy=zeros(7,2);tempa=0;tempb=0;tempc=0;tempd=0;tempe=0;tempf=0;tempg=0;global man1 mana1 mana2 mana3 mana4 mana5global manb1 manb2 manb3 manb4 manb5global manc1 manc2 manc3 manc4 manc5global mand1 mand2 mand3 mand4 mand5global mane1 mane2 mane3 mane4 mane5man1(1,:)=[0.4625 0.1786 0.0982 0.1381]; %[x0 y0 x1 y1] man1(2,:)=[0.4875 0.2667 0.5018 0.2667]; %[x0 y0 x1 y1] man1(3,:)=[0.5214 0.2667 0.5339 0.2667]; %[x0 y0 x1 y1] man1(4,:)=[0.5125 0.25 0.5125 0.23]; %[x0 y0 x1 y1] man1(5,:)=[0.4968 0.2081 0.525 0.2072]; %[x0 y0 x1 y1] axis offwhile counter1<=10 %时间计数%显示时间minutex=rem(counter1,60);hourx=8+(counter1-minutex)/60;set(hour1,'String',{hourx})set(minute1,'String',{minutex})if temp1<=num%离开与删除人脸对象if tempa ~= 0if pass(tempa,6) == counter1leaveflash(1,counterxy(1,1),counterxy(1,2))tempa=0;delete(mana1,mana2,mana3,mana4,mana5);endendif tempb~=0if pass(tempb,6) == counter1leaveflash(2,counterxy(2,1),counterxy(2,2))tempb=0;delete(manb1,manb2,manb3,manb4,manb5);endendif tempc~=0if pass(tempc,6) == counter1leaveflash(3,counterxy(3,1),counterxy(3,2))tempc=0;delete(manc1,manc2,manc3,manc4,manc5);endendif tempd~=0if pass(tempd,6) == counter1leaveflash(4,counterxy(4,1),counterxy(4,2))tempd=0;delete(mand1,mand2,mand3,mand4,mand5);endendif tempe~=0if pass(tempe,6) == counter1leaveflash(5,counterxy(5,1),counterxy(5,2))tempe=0;delete(mane1,mane2,mane3,mane4,mane5);endendif tempf~=0if pass(tempf,6) == counter1leaveflash(6,counterxy(6,1),counterxy(6,2))tempf=0;delete(manf1,manf2,manf3,manf4,manf5);endendif tempg~=0if pass(tempg,6) == counter1leaveflash(7,counterxy(7,1),counterxy(7,2))tempg=0;delete(mang1,mang2,mang3,mang4,mang5);endend%产生人脸if pass(temp1,2)==counter1if tempa==0[mana1,mana2,mana3,mana4,mana5]=personcreat(pass(temp1,3)) tempa=temp1;if pass(temp1,5)==1counterxy(1,:)=[-0.027 0.055];endif pass(temp1,5)==2counterxy(1,:)=[0 0.055];endif pass(temp1,5)==3counterxy(1,:)=[0.027 0.055];endelseif tempb==0[manb1,manb2,manb3,manb4,manb5]=personcreat(pass(temp1,3))tempb=temp1;if pass(temp1,5)==1counterxy(2,:)=[-0.027 0.055];endif pass(temp1,5)==2counterxy(2,:)=[0 0.055];endif pass(temp1,5)==3counterxy(3,:)=[0.027 0.055];endtemp1=temp1+1;elseif tempc==0[manc1,manc2,manc3,manc4,manc5]=personcreat(pass(temp1,3))tempc=temp1;if pass(temp1,5)==1counterxy(3,:)=[-0.027 0.055];endif pass(temp1,5)==2counterxy(3,:)=[0 0.055];endif pass(temp1,5)==3counterxy(3,:)=[0.027 0.055];endtemp1=temp1+1;elseif tempd==0[mand1,mand2,mand3,mand4,mand5]=personcreat(pass(temp1,3))tempd=temp1;if pass(temp1,5)==1counterxy(4,:)=[-0.027 0.055];endif pass(temp1,5)==2counterxy(4,:)=[0 0.055];if pass(temp1,5)==3counterxy(4,:)=[0.027 0.055];endtemp1=temp1+1;elseif tempe==0[mane1,mane2,mane3,mane4,mane5]=personcreat(pass(temp1,3))tempe=temp1;if pass(temp1,5)==1counterxy(5,:)=[-0.027 0.055];endif pass(temp1,5)==2counterxy(5,:)=[0 0.055];endif pass(temp1,5)==3counterxy(5,:)=[0.027 0.055];endtemp1=temp1+1;elseif tempf==0[manf1,manf2,manf3,manf4,manf5]=personcreat(pass(temp1,3))tempf=temp1;if pass(temp1,5)==1counterxy(6,:)=[-0.027 0.055];endif pass(temp1,5)==2counterxy(6,:)=[0 0.055];endif pass(temp1,5)==3counterxy(6,:)=[0.027 0.055];endtemp1=temp1+1;elseif tempg==0[mang1,mang2,mang3,mang4,mang5]=personcreat(pass(temp1,3))tempg=temp1;if pass(temp1,5)==1counterxy(7,:)=[-0.027 0.055];endif pass(temp1,5)==2counterxy(7,:)=[0 0.055];endif pass(temp1,5)==3counterxy(7,:)=[0.027 0.055];endtemp1=temp1+1;endendendendendendendend%开始服务if tempa~=0if pass(tempa,2)+pass(tempa,7) == counter1serveflash(1,counterxy(1,1),counterxy(1,2))endendif tempb~=0if pass(tempb,2)+pass(tempb,7) == counter1serveflash(2,counterxy(2,1),counterxy(2,2))endendif tempc~=0if pass(tempc,2)+pass(tempc,7) == counter1serveflash(3,counterxy(3,1),counterxy(3,2))endendif tempd~=0if pass(tempd,2)+pass(tempd,7) == counter1serveflash(4,counterxy(4,1),counterxy(4,2))endendif tempe~=0if pass(tempe,2)+pass(tempe,7) == counter1serveflash(5,counterxy(5,1),counterxy(5,2))endendif tempf~=0if pass(tempf,2)+pass(tempf,7) == counter1serveflash(6,counterxy(6,1),counterxy(6,2))endendif tempg~=0if pass(tempg,2)+pass(tempg,7) == counter1serveflash(7,counterxy(7,1),counterxy(7,2))endendendcounter1=counter1+1;endiiii=1;sumtime=0;sumtimea=0;sumtimeb=0;sumtimec=0;numa=0;numb=0;numc=0;while iiii<numsumtime=sumtime+pass(iiii,3)+pass(iiii,4);if pass(iiii,5)==1sumtimea=sumtimea+pass(iiii,3)+pass(iiii,4);numa=numa+1;endif pass(iiii,5)==2sumtimeb=sumtimeb+pass(iiii,3)+pass(iiii,4);numb=numb+1;endif pass(iiii,5)==3sumtimec=sumtimec+pass(iiii,3)+pass(iiii,4);numc=numc+1;endiiii=iiii+1;endnum=num-1;freetimea=720-sumtimea;freetimeb=720-sumtimeb;freetimec=720-sumtimec;freetime=freetimea+freetimeb+freetimec;avetimea=round(1000*sumtimea/720)/1000;avetimeb=round(1000*sumtimeb/720)/1000;avetimec=round(1000*sumtimec/720)/1000;avetime=round(1000*sumtime/(3*720))/1000;scaleaa=freetimea/720;scaleab=freetimeb/720;scaleac=freetimec/720;dispdata(1,:)=[numa numb numc];dispdata(2,:)=[sumtimea sumtimeb sumtimec];dispdata(3,:)=[avetimea avetimeb avetimec];dispdata(4,:)=[freetimea freetimeb freetimec];dispdata(5,:)=[freetimea/720 freetimeb/720 freetimec/720];figure(2)subplot(2,2,1),bar(dispdata(1,:))title('服务顾客数')subplot(2,2,2),title('服务时间')bar(dispdata(2,:))subplot(2,2,3),title('平均服务时间')pie(dispdata(3,:))subplot(2,2,4),title('空闲比例')pie(dispdata(5,:))function [num,pass]=computing(tim0)seat=[0 0 0];%服务员属性pass=rand(1,4);%序号、到达时间、特殊要求时间、正常理发时间pass(5)=0;%服务员pass(6)=0;%离开时间pass(7)=0;%等待时间num=1;%服务人数tim=0;%时间计数器temp=0;%while tim<=tim0pass(num,1)=num; %装入序号pass(num,2)=rand;pass(num,3)=rand;pass(num,4)=rand;%计算顾客到达时间if pass(num,2)<=0.07temp=4;else if pass(num,2)<=0.17temp=5;else if pass(num,2)<=0.69temp=6;else if pass(num,2)<=0.89temp=7;else temp=8;endendendendtim=tim+temp; %装入顾客到达时间pass(num,2)=tim;if pass(num,3)<=0.1pass(num,3)=4; %装入需要特殊服务的时间else pass(num,3)=0;endnum=num+1;endnum=num-1;for i=1:num%计算顾客的理发席位if seat(1)<=pass(i,2)+pass(i,7)pass(i,5)=1; %由1号服务员理发temp1=timinge1(1,pass(i,4));seat(1)=pass(i,2)+pass(i,3)+temp1;pass(i,4)=temp1; %装入正常理发所需时间else if seat(2)<=pass(i,2)+pass(i,7)pass(i,5)=2; %由2号服务员理发temp1=timinge1(2,pass(i,4));seat(2)=pass(i,2)+pass(i,3)+temp1;pass(i,4)=temp1; %装入正常理发所需时间else if seat(3)<=pass(i,2)+pass(i,7)pass(i,5)=3; %由2号服务员理发temp1=timinge1(3,pass(i,4));seat(3)=pass(i,2)+pass(i,3)+temp1;pass(i,4)=temp1;else%计算等待时间x=seat(1);y=1;if x>seat(2)x=seat(2);y=2;endif x>seat(3)x=seat(3);y=3;endpass(i,5)=y;temp1=timinge1(y,pass(i,4));pass(i,7)=seat(y)-pass(i,2);seat(y)=seat(y)+temp1+pass(i,3);pass(i,4)=temp1;endendendpass(i,6)=pass(i,2)+pass(i,3)+pass(i,4);endfunction envirment%场景设置pict=figure('color',[0.75 0.75 0.75],'position',[50 50 690 520]);door = annotation('rectangle',[0.4214 0.1405 0.19460.03333],'FaceColor',[0 1 0],'EdgeColor',[0 1 0]);word1 = annotation('textbox','Position',[0.3393 0.1143 0.08750.07619],'EdgeColor','none','FitHeightToText','off','FontSize',12,'Stri ng',{'门口'});seata1= annotation('rectangle',[0.2054 0.8214 0.11070.02857],'FaceColor',[0.8471 0.1608 0],'EdgeColor',[0.8471 0.1608 0]); seata2 = annotation('rectangle',[0.2071 0.7476 0.014290.1024],'FaceColor',[0.8471 0.1608 0],'EdgeColor',[0.8471 0.1608 0]); seata3 = annotation('rectangle',[0.3021 0.7419 0.014290.1024],'FaceColor',[0.8471 0.1608 0],'EdgeColor',[0.8471 0.1608 0]); word2 = annotation('textbox','Position',[0.1607 0.65 0.11070.06667],'EdgeColor','none','FitHeightToText','off','String',{'SeatA'});seatb1 = annotation('rectangle',[0.4579 0.8171 0.11070.02857],'FaceColor',[0.8471 0.1608 0],'EdgeColor',[0.8471 0.1608 0]); seatb2 = annotation('rectangle',[0.4579 0.7386 0.014290.1024],'FaceColor',[0.8471 0.1608 0],'EdgeColor',[0.8471 0.1608 0]); seatb3 = annotation('rectangle',[0.5564 0.7448 0.014290.1024],'FaceColor',[0.8471 0.1608 0],'EdgeColor',[0.8471 0.1608 0]); word3 = annotation('textbox','Position',[0.3768 0.6381 0.10360.07381],'EdgeColor','none','FitHeightToText','off','String',{'SeatB'});seatc1 = annotation('rectangle',[0.6986 0.8157 0.11070.02857],'FaceColor',[0.8471 0.1608 0],'EdgeColor',[0.8471 0.1608 0]); seatc2 = annotation('rectangle',[0.6996 0.7343 0.014290.1024],'FaceColor',[0.8471 0.1608 0],'EdgeColor',[0.8471 0.1608 0]); seatc3 = annotation('rectangle',[0.7964 0.7333 0.014290.1024],'FaceColor',[0.8471 0.1608 0],'EdgeColor',[0.8471 0.1608 0]); word4 = annotation('textbox','Position',[0.6429 0.6286 0.10180.07619],'EdgeColor','none','FitHeightToText','off','String',{'SeatC'});watierplace = annotation('rectangle',[0.8214 0.1762 0.019640.3857],'FaceColor',[0 1 1],'EdgeColor',[0 1 1]);word5 = annotation('textbox','Position',[0.7107 0.2 0.11790.0619],'EdgeColor','none','FitHeightToText','off','String',{'等待席'});function leaveflash(xx,yy,zz)global man1 mana1 mana2 mana3 mana4 mana5global manb1 manb2 manb3 manb4 manb5global manc1 manc2 manc3 manc4 manc5global mand1 mand2 mand3 mand4 mand5global mane1 mane2 mane3 mane4 mane5switch xxcase 1for ii = 10:-1:1face(:,1)=man1(:,1)+yy*(ii-1);face(:,3)=man1(:,3)+yy*(ii-1);face(:,2)=man1(:,2)+zz*(ii-1);face(:,4)=man1(:,4)+zz*(ii-1);face(1,3)=0.0982;face(1,4)=0.1381;set(mana1,'position',[face(1,1) face(1,2) face(1,3) face(1,4)]);set(mana2,'X',[face(2,1);face(2,3)],'Y',[face(2,2);face(2,4)]);set(mana3,'X',[face(3,1);face(3,3)],'Y',[face(3,2);face(3,4)]);set(mana4,'X',[face(4,1);face(4,3)],'Y',[face(4,2);face(4,4)]);set(mana5,'X',[face(5,1);face(5,3)],'Y',[face(5,2);face(5,4)]);MM(ii)=getframe;endcase 2for ii = 10:-1:1face(:,1)=man1(:,1)+yy*(ii-1);face(:,3)=man1(:,3)+yy*(ii-1);face(:,2)=man1(:,2)+zz*(ii-1);face(:,4)=man1(:,4)+zz*(ii-1);face(1,3)=0.0982;face(1,4)=0.1381;set(manb1,'position',[face(1,1) face(1,2) face(1,3) face(1,4)]);set(manb2,'X',[face(2,1);face(2,3)],'Y',[face(2,2);face(2,4)]);set(manb3,'X',[face(3,1);face(3,3)],'Y',[face(3,2);face(3,4)]);set(manb4,'X',[face(4,1);face(4,3)],'Y',[face(4,2);face(4,4)]);set(manb5,'X',[face(5,1);face(5,3)],'Y',[face(5,2);face(5,4)]);MM(ii)=getframe;endcase 3for ii = 10:-1:1face(:,1)=man1(:,1)+yy*(ii-1);face(:,3)=man1(:,3)+yy*(ii-1);face(:,2)=man1(:,2)+zz*(ii-1);face(:,4)=man1(:,4)+zz*(ii-1);face(1,3)=0.0982;face(1,4)=0.1381;set(manc1,'position',[face(1,1) face(1,2) face(1,3) face(1,4)]);set(manc2,'X',[face(2,1);face(2,3)],'Y',[face(2,2);face(2,4)]); set(manc3,'X',[face(3,1);face(3,3)],'Y',[face(3,2);face(3,4)]); set(manc4,'X',[face(4,1);face(4,3)],'Y',[face(4,2);face(4,4)]);set(manc5,'X',[face(5,1);face(5,3)],'Y',[face(5,2);face(5,4)]);MM(ii)=getframe;endcase 4for ii = 10:-1:1face(:,1)=man1(:,1)+yy*(ii-1);face(:,3)=man1(:,3)+yy*(ii-1);face(:,2)=man1(:,2)+zz*(ii-1);face(:,4)=man1(:,4)+zz*(ii-1);face(1,3)=0.0982;face(1,4)=0.1381;set(mand1,'position',[face(1,1) face(1,2) face(1,3) face(1,4)]);set(mand2,'X',[face(2,1);face(2,3)],'Y',[face(2,2);face(2,4)]); set(mand3,'X',[face(3,1);face(3,3)],'Y',[face(3,2);face(3,4)]);set(mand4,'X',[face(4,1);face(4,3)],'Y',[face(4,2);face(4,4)]);set(mand5,'X',[face(5,1);face(5,3)],'Y',[face(5,2);face(5,4)]);MM(ii)=getframe;endcase 5for ii = 10:-1:1face(:,1)=man1(:,1)+yy*(ii-1);face(:,3)=man1(:,3)+yy*(ii-1);face(:,2)=man1(:,2)+zz*(ii-1);face(:,4)=man1(:,4)+zz*(ii-1);face(1,3)=0.0982;face(1,4)=0.1381;set(mane1,'position',[face(1,1) face(1,2) face(1,3) face(1,4)]);set(mane2,'X',[face(2,1);face(2,3)],'Y',[face(2,2);face(2,4)]); set(mane3,'X',[face(3,1);face(3,3)],'Y',[face(3,2);face(3,4)]); set(mane4,'X',[face(4,1);face(4,3)],'Y',[face(4,2);face(4,4)]);set(mane5,'X',[face(5,1);face(5,3)],'Y',[face(5,2);face(5,4)]);MM(ii)=getframe;endcase 6for ii = 10:-1:1face(:,1)=man1(:,1)+yy*(ii-1);face(:,3)=man1(:,3)+yy*(ii-1);face(:,2)=man1(:,2)+zz*(ii-1);face(:,4)=man1(:,4)+zz*(ii-1);face(1,3)=0.0982;face(1,4)=0.1381;set(manf1,'position',[face(1,1) face(1,2) face(1,3) face(1,4)]);set(manf2,'X',[face(2,1);face(2,3)],'Y',[face(2,2);face(2,4)]); set(manf3,'X',[face(3,1);face(3,3)],'Y',[face(3,2);face(3,4)]);set(manf4,'X',[face(4,1);face(4,3)],'Y',[face(4,2);face(4,4)]);set(manf5,'X',[face(5,1);face(5,3)],'Y',[face(5,2);face(5,4)]);MM(ii)=getframe;endcase 7for ii = 10:-1:1face(:,1)=man1(:,1)+yy*(ii-1);face(:,3)=man1(:,3)+yy*(ii-1);face(:,2)=man1(:,2)+zz*(ii-1);face(:,4)=man1(:,4)+zz*(ii-1);face(1,3)=0.0982;face(1,4)=0.1381;set(mang1,'position',[face(1,1) face(1,2) face(1,3)face(1,4)]);set(mang2,'X',[face(2,1);face(2,3)],'Y',[face(2,2);face(2,4)]);set(mang3,'X',[face(3,1);face(3,3)],'Y',[face(3,2);face(3,4)]);set(mang4,'X',[face(4,1);face(4,3)],'Y',[face(4,2);face(4,4)]);set(mang5,'X',[face(5,1);face(5,3)],'Y',[face(5,2);face(5,4)]);MM(ii)=getframe;endendfunction [face1,face2,face3,face4,face5]=personcreat(vect)if vect==0face1 = annotation('ellipse',[0.4625 0.1786 0.09820.1381],'FaceColor',[0.6824 0.4667 0],'EdgeColor',[0.6824 0.4667 0]); else face1 = annotation('ellipse',[0.4625 0.1786 0.09820.1381],'FaceColor',[0.4 0.6 0],'EdgeColor',[0.6824 0.4667 0]);%[0.2096 0.6881 0.09821 0.1381]endface2 = annotation('line',[0.4875 0.5018],[0.2667 0.2667],'LineWidth',3); face3 = annotation('line',[0.5214 0.5339],[0.2667 0.2667],'LineWidth',3); face4 = annotation('line',[0.5125 0.5125],[0.25 0.2309],'LineWidth',3); face5 = annotation('line',[0.4968 0.525],[0.2081 0.2072],'LineWidth',3);function serveflash(xx,yy,zz)global man1 mana1 mana2 mana3 mana4 mana5global manb1 manb2 manb3 manb4 manb5global manc1 manc2 manc3 manc4 manc5global mand1 mand2 mand3 mand4 mand5global mane1 mane2 mane3 mane4 mane5switch xxcase 1for ii = 1:10 %开始服务动画face(:,1)=man1(:,1)+yy*(ii-1);face(:,3)=man1(:,3)+yy*(ii-1);face(:,2)=man1(:,2)+zz*(ii-1);face(:,4)=man1(:,4)+zz*(ii-1);face(1,3)=0.0982;face(1,4)=0.1381;set(mana1,'position',[face(1,1) face(1,2) face(1,3) face(1,4)])set(mana2,'X',[face(2,1);face(2,3)],'Y',[face(2,2);face(2,4)])set(mana3,'X',[face(3,1);face(3,3)],'Y',[face(3,2);face(3,4)])set(mana4,'X',[face(4,1);face(4,3)],'Y',[face(4,2);face(4,4)])set(mana5,'X',[face(5,1);face(5,3)],'Y',[face(5,2);face(5,4)]) MM(ii)=getframe;endcase 2for ii = 1:10 %开始服务动画face(:,1)=man1(:,1)+yy*(ii-1);face(:,3)=man1(:,3)+yy*(ii-1);face(:,2)=man1(:,2)+zz*(ii-1);face(:,4)=man1(:,4)+zz*(ii-1);face(1,3)=0.0982;face(1,4)=0.1381;set(manb1,'position',[face(1,1) face(1,2) face(1,3) face(1,4)])set(manb2,'X',[face(2,1);face(2,3)],'Y',[face(2,2);face(2,4)])set(manb3,'X',[face(3,1);face(3,3)],'Y',[face(3,2);face(3,4)])set(manb4,'X',[face(4,1);face(4,3)],'Y',[face(4,2);face(4,4)])set(manb5,'X',[face(5,1);face(5,3)],'Y',[face(5,2);face(5,4)]) MM(ii)=getframe;endcase 3for ii = 1:10 %开始服务动画face(:,1)=man1(:,1)+yy*(ii-1);face(:,3)=man1(:,3)+yy*(ii-1);face(:,2)=man1(:,2)+zz*(ii-1);face(:,4)=man1(:,4)+zz*(ii-1);face(1,3)=0.0982;face(1,4)=0.1381;set(manc1,'position',[face(1,1) face(1,2) face(1,3) face(1,4)])set(manc2,'X',[face(2,1);face(2,3)],'Y',[face(2,2);face(2,4)]) set(manc3,'X',[face(3,1);face(3,3)],'Y',[face(3,2);face(3,4)]) set(manc4,'X',[face(4,1);face(4,3)],'Y',[face(4,2);face(4,4)])set(manc5,'X',[face(5,1);face(5,3)],'Y',[face(5,2);face(5,4)]) MM(ii)=getframe;endcase 4for ii = 1:10 %开始服务动画face(:,1)=man1(:,1)+yy*(ii-1);face(:,3)=man1(:,3)+yy*(ii-1);face(:,2)=man1(:,2)+zz*(ii-1);face(:,4)=man1(:,4)+zz*(ii-1);face(1,3)=0.0982;face(1,4)=0.1381;set(mand1,'position',[face(1,1) face(1,2) face(1,3) face(1,4)])set(mand2,'X',[face(2,1);face(2,3)],'Y',[face(2,2);face(2,4)])set(mand3,'X',[face(3,1);face(3,3)],'Y',[face(3,2);face(3,4)])set(mand4,'X',[face(4,1);face(4,3)],'Y',[face(4,2);face(4,4)])set(mand5,'X',[face(5,1);face(5,3)],'Y',[face(5,2);face(5,4)]) MM(ii)=getframe;endcase 5for ii = 1:10 %开始服务动画face(:,1)=man1(:,1)+yy*(ii-1);face(:,3)=man1(:,3)+yy*(ii-1);face(:,2)=man1(:,2)+zz*(ii-1);face(:,4)=man1(:,4)+zz*(ii-1);face(1,3)=0.0982;face(1,4)=0.1381;set(mane1,'position',[face(1,1) face(1,2) face(1,3) face(1,4)])set(mane2,'X',[face(2,1);face(2,3)],'Y',[face(2,2);face(2,4)]) set(mane3,'X',[face(3,1);face(3,3)],'Y',[face(3,2);face(3,4)]) set(mane4,'X',[face(4,1);face(4,3)],'Y',[face(4,2);face(4,4)])set(mane5,'X',[face(5,1);face(5,3)],'Y',[face(5,2);face(5,4)]) MM(ii)=getframe;endcase 6for ii = 1:10 %开始服务动画face(:,1)=man1(:,1)+yy*(ii-1);face(:,3)=man1(:,3)+yy*(ii-1);face(:,2)=man1(:,2)+zz*(ii-1);face(:,4)=man1(:,4)+zz*(ii-1);face(1,3)=0.0982;face(1,4)=0.1381;set(manf1,'position',[face(1,1) face(1,2) face(1,3) face(1,4)])set(manf2,'X',[face(2,1);face(2,3)],'Y',[face(2,2);face(2,4)])set(manf3,'X',[face(3,1);face(3,3)],'Y',[face(3,2);face(3,4)])set(manf4,'X',[face(4,1);face(4,3)],'Y',[face(4,2);face(4,4)])set(manf5,'X',[face(5,1);face(5,3)],'Y',[face(5,2);face(5,4)]) MM(ii)=getframe;endcase 7for ii = 1:10 %开始服务动画face(:,1)=man1(:,1)+yy*(ii-1);face(:,3)=man1(:,3)+yy*(ii-1);face(:,2)=man1(:,2)+zz*(ii-1);face(:,4)=man1(:,4)+zz*(ii-1);face(1,3)=0.0982;face(1,4)=0.1381;set(mang1,'position',[face(1,1) face(1,2) face(1,3) face(1,4)])set(mang2,'X',[face(2,1);face(2,3)],'Y',[face(2,2);face(2,4)]) set(mang3,'X',[face(3,1);face(3,3)],'Y',[face(3,2);face(3,4)]) set(mang4,'X',[face(4,1);face(4,3)],'Y',[face(4,2);face(4,4)])set(mang5,'X',[face(5,1);face(5,3)],'Y',[face(5,2);face(5,4)]) MM(ii)=getframe;endendfunction xx=timinge1(vect1,vect)switch vect1case 1if vect<=0.18xx=8;else if vect<=0.4xx=9;else if vect<=0.77xx=10;else xx=11;endendendcase 2if vect<=0.18xx=10;else if vect<=0.37xx=11;else if vect<=0.72xx=12;else xx=13;endendendotherwiseif vect<=0.15xx=12;else if vect<=0.37xx=13;else if vect<=0.74xx=14;else xx=15;endendendend。
单服务台排队系统的仿真

实验2---单服务台排队系统的仿真姓名:学号:一、目标任务①模拟路由器缓存区M|M|1|m实验。
②设定:λ=8/s,μ=10/s,ρ=0.8,m=10。
③模拟系统106s,求系统报文的丢失率及报文在路由器中停留时间的均值。
④模拟100次,图展示每次的模拟结果,并与理论值0.0184比较。
二、编程语言Matlab三、关键代码lamda = 8; %报文到达强度u = 10; %路由器处理强度m = 10; %路由器缓冲区长度T = 1000000; %模拟时间a = []; %模拟运行时丢失率的运行结果mean_a = 0; %模拟运行时丢失率的平均运行结果ref_value = 0.0184; %丢失率理论值大小b = []; %模拟运行时报文在路由器中的停留时间mean_b = 0; %模拟运行时报文在路由器中停留时间的均值%模拟运行一百次for i=1:100time = 0; %绝对时钟t = 0; %路由器的下一空闲时刻N = 0; %到达报文数NI = 0; %丢失报文数q = 0; %队长stay_time = 0; %报文在路由器中的停留时间%按指数分布产生随机到达时间和服务时间while 1CRTime = exprnd(1/lamda); %按指数分布产生下一报文的到达随机时间间隔time = CRTime + time; %下一个报文到达的时间if time > Tbreak;endN = N + 1;q = q + 1;while q > 0 & t < timeq = q - 1;ServeTime = exprnd(1/u);%按指数分布产生报文的随机服务时间if q == 0t = time + ServeTime;elset = t + ServeTime;endstay_time = stay_time + ServeTime * (q + 1);endif q == m + 1 %如果超过缓冲区长,则丢失报文数加1,队长减1 NI = NI + 1;q = q - 1;endenda = [a, NI/N];b = [b, stay_time/(N-NI)];end%计算结果mean_a = mean(a);mean_b = mean(b);%绘图x = 1:100;plot(x, a, x, mean_a); %绘制模拟运行时丢包率变化图以及均值线scatter(x, a, '.'); %绘制模拟运行时丢包率变化散点图scatter(x, b, '.'); %绘制模拟运行时平均停留时间变化散点图fprintf('平均丢包率%6.5f\n', mean_a); % 打印平均丢包率fprintf('平均停留时间%6.5f\n', mean_b); % 打印平均停留时间四、实验结果与分析图1 丢包率和平均停留时间图2模拟运行时丢包率变化图以及均值线M/M/1/∞/∞ 模型模型条件(1) 输入过程――顾客源是无限的, 单个到来, 到达过程服从泊松分布, 即顾客到达间隔时间服从负指数分布;(2) 排队规则――单队, 且队长没有限制, 先到先服务;(3) 服务机构――单服务台, 服务时间的长短是随机的,服从相同的负指数分布 。
完整版MM1排队系统仿真matlab实验报告

M/M/1排队系统实验报告一、实验目的本次实验要求实现M/M/1单窗口无限排队系统的系统仿真,利用事件调度 法实现离散事件系统仿真,并统计平均队列长度以及平均等待时间等值, 以与理论分析结果进行对比。
二、实验原理根据排队论的知识我们知道,排队系统的分类是根据该系统中的顾客到达模 式、服务模式、服务员数量以及服务规则等因素决定的。
1、 顾客到达模式设到达过程是一个参数为的Poisson 过程,则长度为t 的时间内到达k 个呼常数,表示了平均到达率或Poisson 呼叫流的强度。
2、 服务模式设每个呼叫的持续时间为「,服从参数为的负指数分布,即其分布函数为P{X t} 1 e t ,t 03、 服务规则 先进先服务的规则(FIFO4、理论分析结果Q -在该M/M/1系统中,设,则稳态时的平均等待队长为1,顾客T --------的平均等待时间为 。
三、 实验内容M/M/ 1排队系统:实现了当顾客到达分布服从负指数分布,系统服务时间也服从负指数分布,单服务台系统,单队排队,按 FIFO (先入先出队列)方式服务。
四、 采用的语言MatLab 语言源代码:clear; clc;叫的概率 服从Poisson 分布,即Pk ⑴(t)k t k! e k 0,1,2,,其中 >0为一%M/M/1排队系统仿真SimTotal=input(' 请输入仿真顾客总数SimTotal='); % 仿真顾客总数;Lambda=0.4; % 到达率Lambda;Mu=0.9; % 服务率Mu;t_Arrive=zeros(1,SimTotal);t_Leave=zeros(1,SimTotal);ArriveNum=zeros(1,SimTotal);LeaveNum=zeros(1,SimTotal);Interval_Arrive=-log(rand(1,SimTotal))/Lambda;% 到达时间间隔Interval_Serve=-log(rand(1,SimTotal))/Mu;% 服务时间t_Arrive(1)=Interval_Arrive(1);% 顾客到达时间ArriveNum(1)=1;for i=2:SimTotalt_Arrive(i)=t_Arrive(i-1)+Interval_Arrive(i);ArriveNum(i)=i;endt_Leave(1)=t_Arrive(1)+Interval_Serve(1);% 顾客离开时间LeaveNum(1)=1;for i=2:SimTotalif t_Leave(i-1)<t_Arrive(i)t_Leave(i)=t_Arrive(i)+Interval_Serve(i);elset_Leave(i)=t_Leave(i-1)+Interval_Serve(i);endLeaveNum(i)=i;endt_Wait=t_Leave-t_Arrive; % 各顾客在系统中的等待时间t_Wait_avg=mean(t_Wait);t_Queue=t_Wait-Interval_Serve;% 各顾客在系统中的排队时间t_Queue_avg=mean(t_Queue);Timepoint=[t_Arrive,t_Leave];% 系统中顾客数随时间的变化Timepoint=sort(Timepoint);ArriveFlag=zeros(size(Timepoint));% 到达时间标志CusNum=zeros(size(Timepoint));temp=2;CusNum(1)=1;for i=2:length(Timepoint)if (temp<=length(t_Arrive))&&(Timepoint(i)==t_Arrive(temp))CusNum(i)=CusNum(i-1)+1;temp=temp+1;ArriveFlag(i)=1;elseCusNum(i)=CusNum(i-1)-1;endend%系统中平均顾客数计算Time_interval=zeros(size(Timepoint));Time_interval(1)=t_Arrive(1);for i=2:length(Timepoint)Time_interval(i)=Timepoint(i)-Timepoint(i-1);endCusNum_fromStart=[0 CusNum];CusNum_avg=sum(CusNum_fromStart.*[Time_interval 0] )/Timepoint(end);QueLength=zeros(size(CusNum));for i=1:length(CusNum) if CusNum(i)>=2QueLength(i)=CusNum(i)-1;elseQueLength(i)=0;endendQueLength_avg=sum([0 QueLength].*[Time_interval 0] )/Timepoint(end);% 长系统平均等待队%仿真图figure(1); set(1,'position',[0,0,1000,700]);subplot(2,2,1);title(' 各顾客到达时间和离去时间'); stairs([0 ArriveNum],[0 t_Arrive],'b');hold on;stairs([0 LeaveNum],[0 t_Leave],'y'); legend(' 到达时间',' 离去时间'); hold off;subplot(2,2,2); stairs(Timepoint,CusNum,'b') title(' 系统等待队长分布');xlabel(' 时间');ylabel(' 队长');subplot(2,2,3);title(' 各顾客在系统中的排队时间和等待时间'); stairs([0 ArriveNum],[0 t_Queue],'b');hold on;stairs([0 LeaveNum],[0 t_Wait],'y');hold off; legend(' 排队时间',' 等待时间');%仿真值与理论值比较disp([' 理论平均等待时间t_Wait_avg=',num2str(1/(Mu-Lambda))]);disp([' 理论平均排队时间t_Wait_avg=',num2str(Lambda/(Mu*(Mu-Lambda)))]); disp([' 理论系统中平均顾客数=',num2str(Lambda/(Mu-Lambda))]);disp([' 理论系统中平均等待队长=',num2str(Lambda*Lambda/(Mu*(Mu-Lambda)))]);disp([' 仿真平均等待时间t_Wait_avg=',num2str(t_Wait_avg)])disp([' 仿真平均排队时间t_Queue_avg=',num2str(t_Queue_avg)]) disp([' 仿真系统中平均顾客数=',num2str(CusNum_avg)]);disp([' 仿真系统中平均等待队长=',num2str(QueLength_avg)]);五、数据结构1. 仿真设计算法(主要函数)利用负指数分布与泊松过程的关系,产生符合泊松过程的顾客流,产生符合负指数分布的随机变量作为每个顾客的服务时间:Interval_Arrive=-log(rand(1,SimTotal))/Lambda; %到达时间间隔,结果与调用exprnd(1/Lambda, m)函数产生的结果相同In terval_Serve=-log(ra nd(1,SimTotal))/Mu; %服务时间间隔t_Arrive(1)=Interval_Arrive(1); %顾客到达时间时间计算t_Wait=t_Leave-t_Arrive; %各顾客在系统中的等待时间t_Queue=t_Wait-Interval_Serve; %各顾客在系统中的排队时间由事件来触发仿真时钟的不断推进。
基于Matlab的排队问题仿真

自 10 9 9年 E L N R A G开创 性 的论 文 发表 以 来 , 队论 理 论 广 泛 应 用 于通 信 、 事 、 输 、 排 军 运 维
第3 卷 第 6 2 期
21 00年 1 2月
武 汉 理 工 大 学 学 报 ・信 息 与 管 理 工 程 版
J U N L O T I F R TO O R A FWU (N O MA IN& M N G ME TE G N E IG) A A E N N IE R N
Vo _ 2 . l3 No 6 De 2 0 c. 01
应结果 。
统 内有 n个 顾客 的概 率 P () t满足 方程 :
收稿 日期 :00— 6— 2 21 0 2.
作者简介: 李字光 (9 6一) 男 , 16 , 湖北天 门人 , 武汉理工大学理学 院讲师
第3 2卷
第 6期
李 宇光 : 基于 M t b的排队问题仿真 aa l
而某 阶段 服务员 又空 闲无 事 的情 形 。服务 系统 的 服务 能力一 方 面取决 于服 务员 的数量 和服 务员 的 能力 ; 另一 方 面也 取 决 于 顾 客 流 的性 质 。排 队 问 题就 是要 寻求顾 客流 、 务 能 力 和 服务 系统 效益 服
足 这种假 设 , 因此 需要 有更 一般 的方法 。
理 包括 线性 、 非线 性 系统 、 离散 、 连续 及混 合 、 任 单
服务台单队列排队系统仿真

服务台单队列排队系统仿真1. 引言排队是我们日常生活中常见的现象之一。
每当我们去银行、超市、餐厅等地方,总会看到人们在服务台前排长队等待接受服务。
而排队系统的效率直接影响到我们的等待时间和满意度。
为了改善排队系统的效率,许多地方引入了服务台单队列排队系统。
这种系统中,所有顾客都将排在同一个队伍中,然后按照先后顺序依次接受服务。
这种系统相比于多个队列排队系统,能够有效减少空闲时间和服务延迟。
为了对服务台单队列排队系统进行评估和优化,我们可以使用仿真技术来模拟系统的运行情况,并对其进行分析。
2. 仿真模型设计在服务台单队列排队系统的仿真模型中,我们需要考虑到以下几个方面的因素:2.1 顾客到达规律在实际排队系统中,顾客的到达时间往往是随机的,我们可以使用随机数生成器来模拟此过程。
通过设定到达时间的概率分布函数,我们可以生成一系列随机数来模拟顾客的到达间隔。
2.2 服务时间每个顾客在服务台的服务时间也是随机的。
同样地,我们可以使用随机数生成器来模拟服务时间。
通过设定服务时间的概率分布函数,我们可以生成一系列随机数来模拟顾客在服务台的停留时间。
2.3 服务台数量为了简化仿真模型,我们假设只有一个服务台。
在实际情况中,可以根据实际需求增加服务台数量,以提高系统的整体效率。
2.4 排队规则在服务台单队列排队系统中,顾客按照先后顺序依次接受服务。
当一个顾客结束服务后,下一个顾客将开始接受服务。
为了模拟这个过程,我们可以使用队列数据结构来管理顾客的排队顺序。
3. 仿真过程在进行仿真过程时,我们可以按照以下步骤进行操作:3.1 初始化仿真参数根据实际情况,我们可以设定好仿真的时间段、顾客到达规律和服务时间的概率分布函数等参数。
3.2 创建顾客队列根据顾客到达规律,我们可以按照一定的间隔时间将顾客加入到队列中。
3.3 顾客进入服务台当顾客队列不为空时,服务台将接受当前队列中的第一个顾客,并开始对其进行服务。
3.4 更新服务时间和队列在服务过程中,服务单位时间递减,直到达到零时,服务结束,当前顾客离开服务台,下一个顾客开始接受服务。
仿真模型的MATLAB实现SQSS系统仿真的Matlab实现SQMS系统仿真

人
电梯
消防部门
火灾
消防车
停车场
汽车
停车空间
急救车服务
人
急救车
1 排队系统 一般排队系统的基本特征
1 排队系统
排队系统主要绩效指标
服务台利用率 系统中平均顾客数
平均队长 顾客在系统内 平均停留时间
平均服务时间 平均到达时间间隔
L
n0
nPn
n0
n(1
)n
四、仿真模型的EXCEL实现
• 1. SQSS系统手工仿真的Excel实现 • 例4.1 考虑只有一个ATM机的银行自动存取款机器的网点,在某个
时段顾客到达为等间隔到达,每5分钟到达一位顾客,前6位顾客使 用ATM机器的时间(分钟)分别为3、3、3、7、7、7。可以看出 顾客到达速率为每5分钟一位,且顾客服务时间平均值也为5分钟一 位。使用仿真方法分析第6位顾客使用完ATM机器的时间及截至该时 刻顾客的排队等待总时间和ATM机的利用率。 • XLS演示
大型计算机
雇员
计算机
急救中心
雇员
护士
传真服务
雇员
传真机
物料处理系统 货物
物料处理单元
维护系统
设备
维修工人
质检站
物件
质检员
1 排队系统
排队系统:运输服务系统
系统类型
顾客
服务台
公路收费站
汽车
收费员
卡车装货地
卡车
装货工人
港口卸货区
轮船
卸货工人
等待起飞的飞机
飞机
跑道
航班服务
人
飞机
出租车服务
MM1排队系统仿真matlab实验报告

M/M/1排队系统实验报告一、实验目的本次实验要求实现M/M/1单窗口无限排队系统的系统仿真,利用事件调度法实现离散事件系统仿真,并统计平均队列长度以及平均等待时间等值,以与理论分析结果进行对比。
二、实验原理根据排队论的知识我们知道,排队系统的分类是根据该系统中的顾客到达模式、服务模式、服务员数量以及服务规则等因素决定的。
1、 顾客到达模式设到达过程是一个参数为λ的Poisson 过程,则长度为t 的时间内到达k 个呼叫的概率 服从Poisson 分布,即etkk k t t p λλ-=!)()(,⋅⋅⋅⋅⋅⋅⋅⋅⋅=,2,1,0k ,其中λ>0为一常数,表示了平均到达率或Poisson 呼叫流的强度。
2、 服务模式设每个呼叫的持续时间为i τ,服从参数为μ的负指数分布,即其分布函数为{}1,0t P X t e t μ-<=-≥3、 服务规则先进先服务的规则(FIFO ) 4、 理论分析结果在该M/M/1系统中,设λρμ=,则稳态时的平均等待队长为1Q ρλρ=-,顾客的平均等待时间为T ρμλ=-。
三、实验内容M/M/1排队系统:实现了当顾客到达分布服从负指数分布,系统服务时间也服从负指数分布,单服务台系统,单队排队,按FIFO (先入先出队列)方式服务。
四、采用的语言MatLab 语言 源代码:clear; clc;%M/M/1排队系统仿真SimTotal=input('请输入仿真顾客总数SimTotal='); %仿真顾客总数;Lambda=0.4; %到达率Lambda;Mu=0.9; %服务率Mu;t_Arrive=zeros(1,SimTotal);t_Leave=zeros(1,SimTotal);ArriveNum=zeros(1,SimTotal);LeaveNum=zeros(1,SimTotal);Interval_Arrive=-log(rand(1,SimTotal))/Lambda;%到达时间间隔Interval_Serve=-log(rand(1,SimTotal))/Mu;%服务时间t_Arrive(1)=Interval_Arrive(1);%顾客到达时间ArriveNum(1)=1;for i=2:SimTotalt_Arrive(i)=t_Arrive(i-1)+Interval_Arrive(i);ArriveNum(i)=i;endt_Leave(1)=t_Arrive(1)+Interval_Serve(1);%顾客离开时间LeaveNum(1)=1;for i=2:SimTotalif t_Leave(i-1)<t_Arrive(i)t_Leave(i)=t_Arrive(i)+Interval_Serve(i);elset_Leave(i)=t_Leave(i-1)+Interval_Serve(i);endLeaveNum(i)=i;endt_Wait=t_Leave-t_Arrive; %各顾客在系统中的等待时间t_Wait_avg=mean(t_Wait);t_Queue=t_Wait-Interval_Serve;%各顾客在系统中的排队时间t_Queue_avg=mean(t_Queue);Timepoint=[t_Arrive,t_Leave];%系统中顾客数随时间的变化Timepoint=sort(Timepoint);ArriveFlag=zeros(size(Timepoint));%到达时间标志CusNum=zeros(size(Timepoint));temp=2;CusNum(1)=1;for i=2:length(Timepoint)if (temp<=length(t_Arrive))&&(Timepoint(i)==t_Arrive(temp)) CusNum(i)=CusNum(i-1)+1;temp=temp+1;ArriveFlag(i)=1;CusNum(i)=CusNum(i-1)-1;endend%系统中平均顾客数计算Time_interval=zeros(size(Timepoint));Time_interval(1)=t_Arrive(1);for i=2:length(Timepoint)Time_interval(i)=Timepoint(i)-Timepoint(i-1);endCusNum_fromStart=[0 CusNum];CusNum_avg=sum(CusNum_fromStart.*[Time_interval 0] )/Timepoint(end);QueLength=zeros(size(CusNum));for i=1:length(CusNum)if CusNum(i)>=2QueLength(i)=CusNum(i)-1;elseQueLength(i)=0;endendQueLength_avg=sum([0 QueLength].*[Time_interval 0] )/Timepoint(end);%系统平均等待队长%仿真图figure(1);set(1,'position',[0,0,1000,700]);subplot(2,2,1);title('各顾客到达时间和离去时间');stairs([0 ArriveNum],[0 t_Arrive],'b');hold on;stairs([0 LeaveNum],[0 t_Leave],'y');legend('到达时间','离去时间');hold off;subplot(2,2,2);stairs(Timepoint,CusNum,'b')title('系统等待队长分布');xlabel('时间');ylabel('队长');subplot(2,2,3);title('各顾客在系统中的排队时间和等待时间');stairs([0 ArriveNum],[0 t_Queue],'b');stairs([0 LeaveNum],[0 t_Wait],'y');hold off;legend('排队时间','等待时间');%仿真值与理论值比较disp(['理论平均等待时间t_Wait_avg=',num2str(1/(Mu-Lambda))]);disp(['理论平均排队时间t_Wait_avg=',num2str(Lambda/(Mu*(Mu-Lambda)))]);disp(['理论系统中平均顾客数=',num2str(Lambda/(Mu-Lambda))]);disp(['理论系统中平均等待队长=',num2str(Lambda*Lambda/(Mu*(Mu-Lambda)))]);disp(['仿真平均等待时间t_Wait_avg=',num2str(t_Wait_avg)])disp(['仿真平均排队时间t_Queue_avg=',num2str(t_Queue_avg)])disp(['仿真系统中平均顾客数=',num2str(CusNum_avg)]);disp(['仿真系统中平均等待队长=',num2str(QueLength_avg)]);五、数据结构1.仿真设计算法(主要函数)利用负指数分布与泊松过程的关系,产生符合泊松过程的顾客流,产生符合负指数分布的随机变量作为每个顾客的服务时间:Interval_Arrive=-log(rand(1,SimTotal))/Lambda;%到达时间间隔,结果与调用exprnd(1/Lambda,m)函数产生的结果相同Interval_Serve=-log(rand(1,SimTotal))/Mu;%服务时间间隔t_Arrive(1)=Interval_Arrive(1);%顾客到达时间时间计算t_Wait=t_Leave-t_Arrive;%各顾客在系统中的等待时间t_Queue=t_Wait-Interval_Serve; %各顾客在系统中的排队时间由事件来触发仿真时钟的不断推进。
单服务台排队系统离散事件系统仿真实验

单服务台排队系统离散事件系统仿真实验在单服务台排队系统中,存在一个服务台和一些顾客。
顾客根据一定的到达规律到达系统,并进行排队等候服务。
每个顾客需要一定的时间来接受服务,然后离开系统。
在整个过程中,需要记录每个顾客的到达时间、完成时间、等候时间等信息,以评估系统的性能。
以下是进行单服务台排队系统离散事件系统仿真实验的步骤:1.制定实验目标和假设:明确实验的目标和假设,例如评估平均等候时间、系统的利用率等。
2.定义实验参数:设置模拟的时间段、顾客到达的规律、服务时间分布等。
可以根据实际情况选择不同的参数值。
3.创建顾客队列:使用队列数据结构来表示顾客队列,顾客到达时将其加入队列中。
4.初始化系统状态:初始化服务台为空闲状态,设置初始时钟为0。
5.模拟顾客到达:根据到达规律随机生成顾客到达的时间,并将其加入队列。
6.模拟服务过程:当服务台空闲时,从队列中取出下一个顾客进行服务。
根据服务时间分布生成一个随机的服务时间,将服务结束时间设置为当前时钟加上服务时间。
7.记录统计信息:记录每个顾客的到达时间、服务开始时间、完成时间、等候时间等信息。
同时记录系统的状态信息,如系统空闲时间、顾客总数等。
8.更新系统状态:更新服务台的状态,如果队列为空,则服务台为空闲状态,否则继续进行下一个顾客的服务。
9.终止条件判断:判断是否继续模拟,可以根据实验目标设定条件,如模拟时间达到一定阈值或顾客数量达到一定数量。
10.实验结果分析:根据记录的统计信息,计算实验结果,如平均等候时间、系统的利用率等。
通过对比不同参数设置下的实验结果,评估系统的性能情况,并对系统设计进行优化。
在实验过程中,需要注意选择合适的离散事件系统仿真工具,如MATLAB、Python等,进行系统的建模和实验的实施。
同时,应合理选择实验参数和统计指标,以保证实验结果的可靠性和可解释性。
通过进行单服务台排队系统离散事件系统仿真实验,可以评估系统的性能,并对系统设计进行优化,提高系统的效率和顾客的满意度。
单服务排队系统MAAB仿真程序
单服务台系统MATLAB仿真一、引言排队是日常生活中经常遇到的现象。
通常 ,当人、物体或是信息的到达速率大于完成服务的速率时 ,即出现排队现象。
排队越长 ,意味着浪费的时间越多 ,系统的效率也越低。
在日常生活中 ,经常遇到排队现象 ,如开车上班、在超市等待结账、工厂中等待加工的工件以及待修的机器等。
总之 ,排队现象是随处可见的。
排队理论是运作管理中最重要的领域之一 ,它是计划、工作设计、存货控制及其他一些问题的基础。
Matlab是 MathWorks公司开发的科学计算软件 ,它以其强大的计算和绘图功能、大量稳定可靠的算法库、简洁高效的编程语言以及庞大的用户群成为数学计算工具方面的标准 ,几乎所有的工程计算领域 ,Matlab都有相应的软件工具箱。
选用 Matlab软件正是基于 Matlab的诸多优点。
二、排队模型三.仿真算法原理(1)顾客信息初始化根据到达率λ和服务率μ来确定每个顾客的到达时间间隔和服务时间间隔。
服务间隔时间可以用负指数分布函数exprnd()来生成。
由于泊松过程的时间间隔也服从负指数分布, 故亦可由此函数生成顾客到达时间间隔。
需要注意的是exprnd()的输入参数不是到达率λ和服务率μ而是平均到达时间间隔1/λ和平均服务时间1/μ。
根据到达时间间隔 ,确定每个顾客的到达时刻. 学习过 C 语言的人习惯于使用 FOR循环来实现数值的累加, 但FOR循环会引起运算复杂度的增加而在MATLAB 仿真环境中, 提供了一个方便的函数cumsum() 来实现累加功能读者可以直接引用对当前顾客进行初始化。
第1 个到达系统的顾客不需要等待就可以直接接受服务其离开时刻等于到达时刻与服务时间之和。
(2)进队出队仿真在当前顾客到达时刻,根据系统内已有的顾客数来确定是否接纳该顾客。
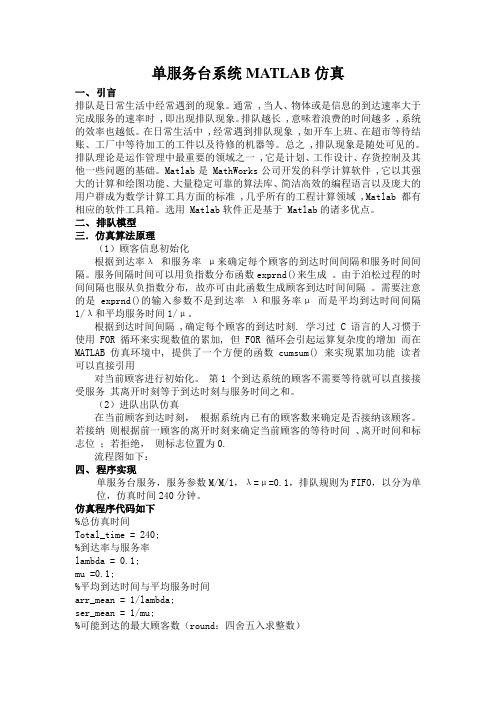
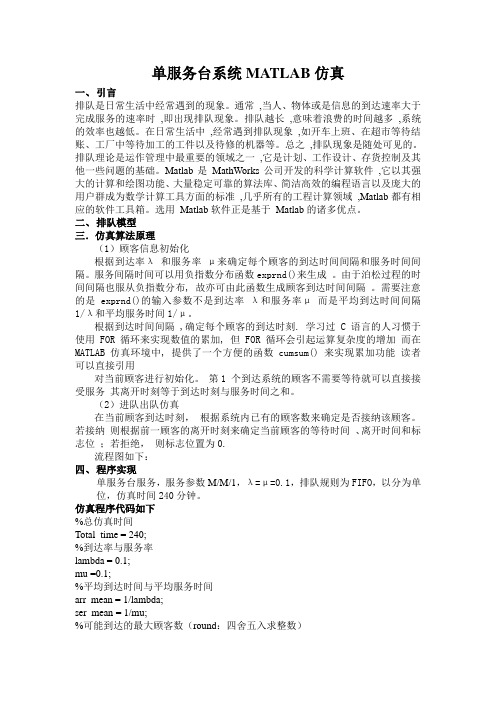
若接纳则根据前一顾客的离开时刻来确定当前顾客的等待时间、离开时间和标志位;若拒绝,则标志位置为0.流程图如下:四、程序实现单服务台服务,服务参数M/M/1,λ=μ=0.1,排队规则为FIFO,以分为单位,仿真时间240分钟。
单服务排队系统MATLAB仿真程序 (2)
单服务台系统MATLAB仿真一、引言排队是日常生活中经常遇到的现象。
通常,当人、物体或是信息的到达速率大于完成服务的速率时,即出现排队现象。
排队越长,意味着浪费的时间越多,系统的效率也越低。
在日常生活中,经常遇到排队现象,如开车上班、在超市等待结账、工厂中等待加工的工件以及待修的机器等。
总之,排队现象是随处可见的。
排队理论是运作管理中最重要的领域之一,它是计划、工作设计、存货控制及其他一些问题的基础。
Matlab是MathWorks公司开发的科学计算软件,它以其强大的计算和绘图功能、大量稳定可靠的算法库、简洁高效的编程语言以及庞大的用户群成为数学计算工具方面的标准,几乎所有的工程计算领域,Matlab都有相应的软件工具箱。
选用Matlab软件正是基于Matlab的诸多优点。
二、排队模型三.仿真算法原理(1)顾客信息初始化根据到达率λ和服务率μ来确定每个顾客的到达时间间隔和服务时间间隔。
服务间隔时间可以用负指数分布函数exprnd()来生成。
由于泊松过程的时间间隔也服从负指数分布, 故亦可由此函数生成顾客到达时间间隔。
需要注意的是exprnd()的输入参数不是到达率λ和服务率μ而是平均到达时间间隔1/λ和平均服务时间1/μ。
根据到达时间间隔 ,确定每个顾客的到达时刻. 学习过 C 语言的人习惯于使用 FOR循环来实现数值的累加, 但FOR循环会引起运算复杂度的增加而在MATLAB 仿真环境中, 提供了一个方便的函数cumsum() 来实现累加功能读者可以直接引用对当前顾客进行初始化。
第1 个到达系统的顾客不需要等待就可以直接接受服务其离开时刻等于到达时刻与服务时间之和。
(2)进队出队仿真在当前顾客到达时刻,根据系统内已有的顾客数来确定是否接纳该顾客。
若接纳则根据前一顾客的离开时刻来确定当前顾客的等待时间、离开时间和标志位;若拒绝,则标志位置为0.流程图如下:四、程序实现单服务台服务,服务参数M/M/1,λ=μ=0.1,排队规则为FIFO,以分为单位,仿真时间240分钟。
- 1、下载文档前请自行甄别文档内容的完整性,平台不提供额外的编辑、内容补充、找答案等附加服务。
- 2、"仅部分预览"的文档,不可在线预览部分如存在完整性等问题,可反馈申请退款(可完整预览的文档不适用该条件!)。
- 3、如文档侵犯您的权益,请联系客服反馈,我们会尽快为您处理(人工客服工作时间:9:00-18:30)。
单服务台系统MATLAB仿真学号:1040408115 姓名:缪晨一、引言排队是日常生活中经常遇到的现象。
通常,当人、物体或是信息的到达速率大于完成服务的速率时,即出现排队现象。
排队越长,意味着浪费的时间越多,系统的效率也越低。
在日常生活中,经常遇到排队现象,如开车上班、在超市等待结账、工厂中等待加工的工件以及待修的机器等。
总之,排队现象是随处可见的。
排队理论是运作管理中最重要的领域之一,它是计划、工作设计、存货控制及其他一些问题的基础。
Matlab是MathWorks公司开发的科学计算软件,它以其强大的计算和绘图功能、大量稳定可靠的算法库、简洁高效的编程语言以及庞大的用户群成为数学计算工具方面的标准,几乎所有的工程计算领域,Matlab都有相应的软件工具箱。
选用Matlab软件正是基于Matlab的诸多优点。
二、排队模型三.仿真算法原理(1)顾客信息初始化根据到达率λ和服务率µ来确定每个顾客的到达时间间隔和服务时间间隔。
服务间隔时间可以用负指数分布函数exprnd()来生成。
由于泊松过程的时间间隔也服从负指数分布, 故亦可由此函数生成顾客到达时间间隔。
需要注意的是exprnd()的输入参数不是到达率λ和服务率µ 而是平均到达时间间隔1/λ和平均服务时间1/µ。
根据到达时间间隔,确定每个顾客的到达时刻. 学习过C 语言的人习惯于使用FOR循环来实现数值的累加, 但FOR循环会引起运算复杂度的增加而在MATLAB 仿真环境中, 提供了一个方便的函数cumsum() 来实现累加功能读者可以直接引用对当前顾客进行初始化。
第1 个到达系统的顾客不需要等待就可以直接接受服务其离开时刻等于到达时刻与服务时间之和。
(2)进队出队仿真在当前顾客到达时刻,根据系统内已有的顾客数来确定是否接纳该顾客。
若接纳则根据前一顾客的离开时刻来确定当前顾客的等待时间、离开时间和标志位;若拒绝,则标志位置为0.流程图如下:四、程序实现单服务台服务,服务参数M/M/1,λ=µ=0.1,排队规则为FIFO,以分为单位,仿真时间240分钟。
仿真程序代码如下%总仿真时间Total_time = 240;%到达率与服务率lambda = 0.1;mu =0.1;%平均到达时间与平均服务时间arr_mean = 1/lambda;ser_mean = 1/mu;%可能到达的最大顾客数(round:四舍五入求整数)arr_num = round(Total_time*lambda*2);%顾客事件表初始化events = [];%按负指数分布产生各顾客达到时间间隔events(1,:) = exprnd(arr_mean,1,arr_num);%各顾客的到达时刻等于时间间隔的累积和events(1,:) = cumsum(events(1,:));%按负指数分布产生各顾客服务时间events(2,:) = exprnd(ser_mean,1,arr_num);%计算仿真顾客个数,即到达时刻在仿真时间内的顾客数len_sim = sum(events(1,:)<= Total_time);%*****************************************% 计算第1 个顾客的信息%*****************************************%第1 个顾客进入系统后直接接受服务,无需等待events(3,1) = 0;%其离开时刻等于其到达时刻与服务时间之和events(4,1) = events(1,1)+events(2,1);%其肯定被系统接纳,此时系统内共有1 个顾客,故标志位%置1events(5,1) = 1;%其进入系统后,系统内已有成员序号为1member = [1];%*****************************************% 计算第i 个顾客的信息%*****************************************for i = 2:arr_num%如果第i 个顾客的到达时间超过了仿真时间,则跳出循环if events(1,i)>Total_timebreak;%如果第i 个顾客的到达时间未超过仿真时间,则计算在其%到达时刻系统中已有的顾客个数else number = sum(events(4,member) > events(1,i)); %如果系统已满,则系统拒绝第i 个顾客,其标志位置0if number >= N+1events(5,i) = 0;%如果系统为空,则第i 个顾客直接接受服务else if number == 0%其等待时间为0events(3,i) = 0;%其离开时刻等于到达时刻与服务时间之和events(4,i) = events(1,i)+events(2,i);%其标志位置1events(5,i) = 1;member = [member,i];%如果系统有顾客正在接受服务,且系统等待队列未满,则%第i 个顾客进入系统else len_mem = length(member);%其等待时间等于队列中前一个顾客的离开时刻减去其到%达时刻events(3,i)=events(4,member(len_mem))-events(1,i); %其离开时刻等于队列中前一个顾客的离开时刻加上其服%务时间events(4,i)=events(4,member(len_mem))+events(2,i); %标识位表示其进入系统后,系统内共有的顾客数events(5,i) = number+1;member = [member,i];endendendend五、仿真结果events =[]number =1number =events =Columns 1through75.6418 13.2050 57.5155 68.3886 86.5789 88.8820 100.55489.1178 25.7746 14.2747 20.9298 16.9332 14.2731 8.74030 0 0 0 0 0 014.7597 0 0 0 0 0 01.0000 0 0 0 0 0 0 Columns 8through14106.9312 124.9101 129.9854 143.3425 147.5878 151.3098 154.211330.0267 1.0235 0.5680 7.1159 7.1488 10.8554 1.05300 0 0 0 0 0 00 0 0 0 0 0 00 0 0 0 0 0 0 Columns 15through21162.1843 186.9750 201.7163 202.6228 221.4368 223.3506 229.5432 9.9629 21.9640 2.4814 9.4228 14.2009 9.0656 23.38680 0 0 0 0 0 00 0 0 0 0 0 00 0 0 0 0 0 0 Columns 22through28229.5819 255.0699 263.2190 285.6008 285.9892 339.7321 342.2822 20.2516 0.5970 0.4486 5.5302 28.1709 14.4911 10.40840 0 0 0 0 0 00 0 0 0 0 0 00 0 0 0 0 0 0 Columns 29through35344.2996 345.7073 370.4249 379.5933 393.0690 395.2996 403.7064 1.9700 41.7316 31.4600 17.7792 4.3214 3.1235 4.34260 0 0 0 0 0 00 0 0 0 0 0 00 0 0 0 0 0 0 Columns 36through42404.6424 421.6883 435.0138 454.2870 474.2329 475.6337 481.0860 7.9646 6.0329 12.1631 2.9478 16.6625 3.7575 16.95480 0 0 0 0 0 00 0 0 0 0 0 00 0 0 0 0 0 0487.0670 506.3803 507.9699 512.7172 523.1882 529.85819.9836 4.6901 2.4817 25.1175 0.7323 2.53970 0 0 0 0 00 0 0 0 0 00 0 0 0 0 0events =Columns 1through75.6418 13.2050 57.5155 68.3886 86.5789 88.8820 100.55489.1178 25.7746 14.2747 20.9298 16.9332 14.2731 8.74030 0 0 0 0 0 014.7597 0 71.7901 0 0 0 01.0000 0 1.0000 0 0 0 0 Columns 8through14106.9312 124.9101 129.9854 143.3425 147.5878 151.3098 154.211330.0267 1.0235 0.5680 7.1159 7.1488 10.8554 1.05300 0 0 0 0 0 00 0 0 0 0 0 00 0 0 0 0 0 0 Columns 15through21162.1843 186.9750 201.7163 202.6228 221.4368 223.3506 229.54329.9629 21.9640 2.4814 9.4228 14.2009 9.0656 23.38680 0 0 0 0 0 00 0 0 0 0 0 00 0 0 0 0 0 0229.5819 255.0699 263.2190 285.6008 285.9892 339.7321 342.282220.2516 0.5970 0.4486 5.5302 28.1709 14.4911 10.40840 0 0 0 0 0 00 0 0 0 0 0 00 0 0 0 0 0 0 Columns 29through35344.2996 345.7073 370.4249 379.5933 393.0690 395.2996 403.70641.9700 41.7316 31.4600 17.7792 4.3214 3.1235 4.34260 0 0 0 0 0 00 0 0 0 0 0 00 0 0 0 0 0 0 Columns 36through42404.6424 421.6883 435.0138 454.2870 474.2329 475.6337 481.08607.9646 6.0329 12.1631 2.9478 16.6625 3.7575 16.95480 0 0 0 0 0 00 0 0 0 0 0 00 0 0 0 0 0 0 Columns 43through48487.0670 506.3803 507.9699 512.7172 523.1882 529.85819.9836 4.6901 2.4817 25.1175 0.7323 2.53970 0 0 0 0 00 0 0 0 0 00 0 0 0 0 0number =1number =events =Columns 1through75.6418 13.2050 57.5155 68.3886 86.5789 88.8820 100.55489.1178 25.7746 14.2747 20.9298 16.9332 14.2731 8.74030 0 0 0 0 0 014.7597 0 71.7901 0 0 0 01.0000 0 1.0000 0 0 0 0 Columns 8through14106.9312 124.9101 129.9854 143.3425 147.5878 151.3098 154.211330.0267 1.0235 0.5680 7.1159 7.1488 10.8554 1.05300 0 0 0 0 0 00 0 0 0 0 0 00 0 0 0 0 0 0 Columns 15through21162.1843 186.9750 201.7163 202.6228 221.4368 223.3506 229.54329.9629 21.9640 2.4814 9.4228 14.2009 9.0656 23.38680 0 0 0 0 0 00 0 0 0 0 0 00 0 0 0 0 0 0Columns 22through28229.5819 255.0699 263.2190 285.6008 285.9892 339.7321 342.2822 20.2516 0.5970 0.4486 5.5302 28.1709 14.4911 10.40840 0 0 0 0 0 00 0 0 0 0 0 00 0 0 0 0 0 0 Columns 29through35344.2996 345.7073 370.4249 379.5933 393.0690 395.2996 403.7064 1.9700 41.7316 31.4600 17.7792 4.3214 3.1235 4.34260 0 0 0 0 0 00 0 0 0 0 0 00 0 0 0 0 0 0 Columns 36through42404.6424 421.6883 435.0138 454.2870 474.2329 475.6337 481.0860 7.9646 6.0329 12.1631 2.9478 16.6625 3.7575 16.95480 0 0 0 0 0 00 0 0 0 0 0 00 0 0 0 0 0 0 Columns 43through48487.0670 506.3803 507.9699 512.7172 523.1882 529.85819.9836 4.6901 2.4817 25.1175 0.7323 2.53970 0 0 0 0 00 0 0 0 0 00 0 0 0 0 0events =Columns 1through75.6418 13.2050 57.5155 68.3886 86.5789 88.8820 100.55489.1178 25.7746 14.2747 20.9298 16.9332 14.2731 8.74030 0 0 0 0 0 014.7597 0 71.7901 0 103.5121 0 01.0000 0 1.0000 0 1.0000 0 0 Columns 8through14106.9312 124.9101 129.9854 143.3425 147.5878 151.3098 154.211330.0267 1.0235 0.5680 7.1159 7.1488 10.8554 1.05300 0 0 0 0 0 00 0 0 0 0 0 00 0 0 0 0 0 0 Columns 15through21162.1843 186.9750 201.7163 202.6228 221.4368 223.3506 229.54329.9629 21.9640 2.4814 9.4228 14.2009 9.0656 23.38680 0 0 0 0 0 00 0 0 0 0 0 00 0 0 0 0 0 0 Columns 22through28229.5819 255.0699 263.2190 285.6008 285.9892 339.7321 342.282220.2516 0.5970 0.4486 5.5302 28.1709 14.4911 10.40840 0 0 0 0 0 00 0 0 0 0 0 00 0 0 0 0 0 0 Columns 29through35344.2996 345.7073 370.4249 379.5933 393.0690 395.2996 403.70641.9700 41.7316 31.4600 17.7792 4.3214 3.1235 4.34260 0 0 0 0 0 00 0 0 0 0 0 00 0 0 0 0 0 0 Columns 36through42404.6424 421.6883 435.0138 454.2870 474.2329 475.6337 481.08607.9646 6.0329 12.1631 2.9478 16.6625 3.7575 16.95480 0 0 0 0 0 00 0 0 0 0 0 00 0 0 0 0 0 0 Columns 43through48487.0670 506.3803 507.9699 512.7172 523.1882 529.85819.9836 4.6901 2.4817 25.1175 0.7323 2.53970 0 0 0 0 00 0 0 0 0 00 0 0 0 0 0number =1number =1number =events =Columns 1through75.6418 13.2050 57.5155 68.3886 86.5789 88.8820 100.55489.1178 25.7746 14.2747 20.9298 16.9332 14.2731 8.74030 0 0 0 0 0 014.7597 0 71.7901 0 103.5121 0 01.0000 0 1.0000 0 1.0000 0 0 Columns 8through14106.9312 124.9101 129.9854 143.3425 147.5878 151.3098 154.211330.0267 1.0235 0.5680 7.1159 7.1488 10.8554 1.05300 0 0 0 0 0 00 0 0 0 0 0 00 0 0 0 0 0 0 Columns 15through21162.1843 186.9750 201.7163 202.6228 221.4368 223.3506 229.54329.9629 21.9640 2.4814 9.4228 14.2009 9.0656 23.38680 0 0 0 0 0 00 0 0 0 0 0 00 0 0 0 0 0 0 Columns 22through28229.5819 255.0699 263.2190 285.6008 285.9892 339.7321 342.282220.2516 0.5970 0.4486 5.5302 28.1709 14.4911 10.40840 0 0 0 0 0 00 0 0 0 0 0 00 0 0 0 0 0 0 Columns 29through35344.2996 345.7073 370.4249 379.5933 393.0690 395.2996 403.70641.9700 41.7316 31.4600 17.7792 4.3214 3.1235 4.34260 0 0 0 0 0 00 0 0 0 0 0 00 0 0 0 0 0 0 Columns 36through42404.6424 421.6883 435.0138 454.2870 474.2329 475.6337 481.08607.9646 6.0329 12.1631 2.9478 16.6625 3.7575 16.95480 0 0 0 0 0 00 0 0 0 0 0 00 0 0 0 0 0 0 Columns 43through48487.0670 506.3803 507.9699 512.7172 523.1882 529.85819.9836 4.6901 2.4817 25.1175 0.7323 2.53970 0 0 0 0 00 0 0 0 0 00 0 0 0 0 0events =Columns 1through75.6418 13.2050 57.5155 68.3886 86.5789 88.8820 100.5548 9.1178 25.7746 14.2747 20.9298 16.9332 14.2731 8.74030 0 0 0 0 0 0 14.7597 0 71.7901 0 103.5121 0 0 1.0000 0 1.0000 0 1.0000 0 0Columns 8through14106.9312 124.9101 129.9854 143.3425 147.5878 151.3098 154.2113 30.0267 1.0235 0.5680 7.1159 7.1488 10.8554 1.05300 0 0 0 0 0 0 136.9579 0 0 0 0 0 0 1.0000 0 0 0 0 0 0 Columns 15through21162.1843 186.9750 201.7163 202.6228 221.4368 223.3506 229.5432 9.9629 21.9640 2.4814 9.4228 14.2009 9.0656 23.38680 0 0 0 0 0 00 0 0 0 0 0 00 0 0 0 0 0 0Columns 22through28229.5819 255.0699 263.2190 285.6008 285.9892 339.7321 342.2822 20.2516 0.5970 0.4486 5.5302 28.1709 14.4911 10.40840 0 0 0 0 0 00 0 0 0 0 0 00 0 0 0 0 0 0Columns 29through35344.2996 345.7073 370.4249 379.5933 393.0690 395.2996 403.70641.9700 41.7316 31.4600 17.7792 4.3214 3.1235 4.34260 0 0 0 0 0 00 0 0 0 0 0 00 0 0 0 0 0 0 Columns 36through42404.6424 421.6883 435.0138 454.2870 474.2329 475.6337 481.08607.9646 6.0329 12.1631 2.9478 16.6625 3.7575 16.95480 0 0 0 0 0 00 0 0 0 0 0 00 0 0 0 0 0 0 Columns 43through48487.0670 506.3803 507.9699 512.7172 523.1882 529.85819.9836 4.6901 2.4817 25.1175 0.7323 2.53970 0 0 0 0 00 0 0 0 0 00 0 0 0 0 0number =1number =1number =events =Columns 1through75.6418 13.2050 57.5155 68.3886 86.5789 88.8820 100.55489.1178 25.7746 14.2747 20.9298 16.9332 14.2731 8.74030 0 0 0 0 0 014.7597 0 71.7901 0 103.5121 0 01.0000 0 1.0000 0 1.0000 0 0 Columns 8through14106.9312 124.9101 129.9854 143.3425 147.5878 151.3098 154.211330.0267 1.0235 0.5680 7.1159 7.1488 10.8554 1.05300 0 0 0 0 0 0 136.9579 0 0 0 0 0 01.0000 0 0 0 0 0 0 Columns 15through21162.1843 186.9750 201.7163 202.6228 221.4368 223.3506 229.54329.9629 21.9640 2.4814 9.4228 14.2009 9.0656 23.38680 0 0 0 0 0 00 0 0 0 0 0 00 0 0 0 0 0 0 Columns 22through28229.5819 255.0699 263.2190 285.6008 285.9892 339.7321 342.282220.2516 0.5970 0.4486 5.5302 28.1709 14.4911 10.40840 0 0 0 0 0 00 0 0 0 0 0 00 0 0 0 0 0 0 Columns 29through35344.2996 345.7073 370.4249 379.5933 393.0690 395.2996 403.70641.9700 41.7316 31.4600 17.7792 4.3214 3.1235 4.34260 0 0 0 0 0 00 0 0 0 0 0 00 0 0 0 0 0 0 Columns 36through42404.6424 421.6883 435.0138 454.2870 474.2329 475.6337 481.08607.9646 6.0329 12.1631 2.9478 16.6625 3.7575 16.95480 0 0 0 0 0 00 0 0 0 0 0 00 0 0 0 0 0 0 Columns 43through48487.0670 506.3803 507.9699 512.7172 523.1882 529.85819.9836 4.6901 2.4817 25.1175 0.7323 2.53970 0 0 0 0 00 0 0 0 0 00 0 0 0 0 0events =Columns 1through75.6418 13.2050 57.5155 68.3886 86.5789 88.8820 100.5548 9.1178 25.7746 14.2747 20.9298 16.9332 14.2731 8.74030 0 0 0 0 0 0 14.7597 0 71.7901 0 103.5121 0 0 1.0000 0 1.0000 0 1.0000 0 0Columns 8through14106.9312 124.9101 129.9854 143.3425 147.5878 151.3098 154.2113 30.0267 1.0235 0.5680 7.1159 7.1488 10.8554 1.05300 0 0 0 0 0 0 136.9579 0 0 150.4584 0 0 0 1.0000 0 0 1.0000 0 0 0 Columns 15through21162.1843 186.9750 201.7163 202.6228 221.4368 223.3506 229.5432 9.9629 21.9640 2.4814 9.4228 14.2009 9.0656 23.38680 0 0 0 0 0 00 0 0 0 0 0 00 0 0 0 0 0 0Columns 22through28229.5819 255.0699 263.2190 285.6008 285.9892 339.7321 342.2822 20.2516 0.5970 0.4486 5.5302 28.1709 14.4911 10.40840 0 0 0 0 0 00 0 0 0 0 0 00 0 0 0 0 0 0Columns 29through35344.2996 345.7073 370.4249 379.5933 393.0690 395.2996 403.7064 1.9700 41.7316 31.4600 17.7792 4.3214 3.1235 4.34260 0 0 0 0 0 00 0 0 0 0 0 00 0 0 0 0 0 0 Columns 36through42404.6424 421.6883 435.0138 454.2870 474.2329 475.6337 481.08607.9646 6.0329 12.1631 2.9478 16.6625 3.7575 16.95480 0 0 0 0 0 00 0 0 0 0 0 00 0 0 0 0 0 0 Columns 43through48487.0670 506.3803 507.9699 512.7172 523.1882 529.85819.9836 4.6901 2.4817 25.1175 0.7323 2.53970 0 0 0 0 00 0 0 0 0 00 0 0 0 0 0number =1number =events =Columns 1through75.6418 13.2050 57.5155 68.3886 86.5789 88.8820 100.5548 9.1178 25.7746 14.2747 20.9298 16.9332 14.2731 8.74030 0 0 0 0 0 0 14.7597 0 71.7901 0 103.5121 0 0 1.0000 0 1.0000 0 1.0000 0 0Columns 8through14106.9312 124.9101 129.9854 143.3425 147.5878 151.3098 154.2113 30.0267 1.0235 0.5680 7.1159 7.1488 10.8554 1.05300 0 0 0 0 0 0 136.9579 0 0 150.4584 0 0 0 1.0000 0 0 1.0000 0 0 0 Columns 15through21162.1843 186.9750 201.7163 202.6228 221.4368 223.3506 229.5432 9.9629 21.9640 2.4814 9.4228 14.2009 9.0656 23.38680 0 0 0 0 0 00 0 0 0 0 0 00 0 0 0 0 0 0Columns 22through28229.5819 255.0699 263.2190 285.6008 285.9892 339.7321 342.2822 20.2516 0.5970 0.4486 5.5302 28.1709 14.4911 10.40840 0 0 0 0 0 00 0 0 0 0 0 00 0 0 0 0 0 0Columns 29through35344.2996 345.7073 370.4249 379.5933 393.0690 395.2996 403.70641.9700 41.7316 31.4600 17.7792 4.3214 3.1235 4.34260 0 0 0 0 0 00 0 0 0 0 0 00 0 0 0 0 0 0 Columns 36through42404.6424 421.6883 435.0138 454.2870 474.2329 475.6337 481.08607.9646 6.0329 12.1631 2.9478 16.6625 3.7575 16.95480 0 0 0 0 0 00 0 0 0 0 0 00 0 0 0 0 0 0 Columns 43through48487.0670 506.3803 507.9699 512.7172 523.1882 529.85819.9836 4.6901 2.4817 25.1175 0.7323 2.53970 0 0 0 0 00 0 0 0 0 00 0 0 0 0 0events =Columns 1through75.6418 13.2050 57.5155 68.3886 86.5789 88.8820 100.55489.1178 25.7746 14.2747 20.9298 16.9332 14.2731 8.74030 0 0 0 0 0 014.7597 0 71.7901 0 103.5121 0 01.0000 0 1.0000 0 1.0000 0 0 Columns 8through14106.9312 124.9101 129.9854 143.3425 147.5878 151.3098 154.2113 30.0267 1.0235 0.5680 7.1159 7.1488 10.8554 1.05300 0 0 0 0 0 0 136.9579 0 0 150.4584 0 162.1652 0 1.0000 0 0 1.0000 0 1.0000 0Columns 15through21162.1843 186.9750 201.7163 202.6228 221.4368 223.3506 229.5432 9.9629 21.9640 2.4814 9.4228 14.2009 9.0656 23.38680 0 0 0 0 0 00 0 0 0 0 0 00 0 0 0 0 0 0Columns 22through28229.5819 255.0699 263.2190 285.6008 285.9892 339.7321 342.2822 20.2516 0.5970 0.4486 5.5302 28.1709 14.4911 10.40840 0 0 0 0 0 00 0 0 0 0 0 00 0 0 0 0 0 0Columns 29through35344.2996 345.7073 370.4249 379.5933 393.0690 395.2996 403.7064 1.9700 41.7316 31.4600 17.7792 4.3214 3.1235 4.34260 0 0 0 0 0 00 0 0 0 0 0 00 0 0 0 0 0 0Columns 36through42404.6424 421.6883 435.0138 454.2870 474.2329 475.6337 481.0860 7.9646 6.0329 12.1631 2.9478 16.6625 3.7575 16.95480 0 0 0 0 0 00 0 0 0 0 0 00 0 0 0 0 0 0 Columns 43through48487.0670 506.3803 507.9699 512.7172 523.1882 529.85819.9836 4.6901 2.4817 25.1175 0.7323 2.53970 0 0 0 0 00 0 0 0 0 00 0 0 0 0 0number =1number =events =Columns 1through75.6418 13.2050 57.5155 68.3886 86.5789 88.8820 100.55489.1178 25.7746 14.2747 20.9298 16.9332 14.2731 8.74030 0 0 0 0 0 014.7597 0 71.7901 0 103.5121 0 01.0000 0 1.0000 0 1.0000 0 0Columns 8through14106.9312 124.9101 129.9854 143.3425 147.5878 151.3098 154.2113 30.0267 1.0235 0.5680 7.1159 7.1488 10.8554 1.05300 0 0 0 0 0 0 136.9579 0 0 150.4584 0 162.1652 0 1.0000 0 0 1.0000 0 1.0000 0Columns 15through21162.1843 186.9750 201.7163 202.6228 221.4368 223.3506 229.5432 9.9629 21.9640 2.4814 9.4228 14.2009 9.0656 23.38680 0 0 0 0 0 00 0 0 0 0 0 00 0 0 0 0 0 0Columns 22through28229.5819 255.0699 263.2190 285.6008 285.9892 339.7321 342.2822 20.2516 0.5970 0.4486 5.5302 28.1709 14.4911 10.40840 0 0 0 0 0 00 0 0 0 0 0 00 0 0 0 0 0 0Columns 29through35344.2996 345.7073 370.4249 379.5933 393.0690 395.2996 403.7064 1.9700 41.7316 31.4600 17.7792 4.3214 3.1235 4.34260 0 0 0 0 0 00 0 0 0 0 0 00 0 0 0 0 0 0Columns 36through42404.6424 421.6883 435.0138 454.2870 474.2329 475.6337 481.08607.9646 6.0329 12.1631 2.9478 16.6625 3.7575 16.95480 0 0 0 0 0 00 0 0 0 0 0 00 0 0 0 0 0 0 Columns 43through48487.0670 506.3803 507.9699 512.7172 523.1882 529.85819.9836 4.6901 2.4817 25.1175 0.7323 2.53970 0 0 0 0 00 0 0 0 0 00 0 0 0 0 0events =Columns 1through75.6418 13.2050 57.5155 68.3886 86.5789 88.8820 100.55489.1178 25.7746 14.2747 20.9298 16.9332 14.2731 8.74030 0 0 0 0 0 014.7597 0 71.7901 0 103.5121 0 01.0000 0 1.0000 0 1.0000 0 0 Columns 8through14106.9312 124.9101 129.9854 143.3425 147.5878 151.3098 154.211330.0267 1.0235 0.5680 7.1159 7.1488 10.8554 1.05300 0 0 0 0 0 0 136.9579 0 0 150.4584 0 162.1652 01.0000 0 0 1.0000 0 1.0000 0 Columns 15through21162.1843 186.9750 201.7163 202.6228 221.4368 223.3506 229.5432 9.9629 21.9640 2.4814 9.4228 14.2009 9.0656 23.38680 0 0 0 0 0 0 172.1472 0 0 0 0 0 0 1.0000 0 0 0 0 0 0Columns 22through28229.5819 255.0699 263.2190 285.6008 285.9892 339.7321 342.2822 20.2516 0.5970 0.4486 5.5302 28.1709 14.4911 10.40840 0 0 0 0 0 00 0 0 0 0 0 00 0 0 0 0 0 0Columns 29through35344.2996 345.7073 370.4249 379.5933 393.0690 395.2996 403.7064 1.9700 41.7316 31.4600 17.7792 4.3214 3.1235 4.34260 0 0 0 0 0 00 0 0 0 0 0 00 0 0 0 0 0 0Columns 36through42404.6424 421.6883 435.0138 454.2870 474.2329 475.6337 481.0860 7.9646 6.0329 12.1631 2.9478 16.6625 3.7575 16.95480 0 0 0 0 0 00 0 0 0 0 0 00 0 0 0 0 0 0Columns 43through48487.0670 506.3803 507.9699 512.7172 523.1882 529.85819.9836 4.6901 2.4817 25.1175 0.7323 2.53970 0 0 0 0 00 0 0 0 0 00 0 0 0 0 0number =events =Columns 1through75.6418 13.2050 57.5155 68.3886 86.5789 88.8820 100.55489.1178 25.7746 14.2747 20.9298 16.9332 14.2731 8.74030 0 0 0 0 0 014.7597 0 71.7901 0 103.5121 0 01.0000 0 1.0000 0 1.0000 0 0 Columns 8through14106.9312 124.9101 129.9854 143.3425 147.5878 151.3098 154.211330.0267 1.0235 0.5680 7.1159 7.1488 10.8554 1.05300 0 0 0 0 0 0 136.9579 0 0 150.4584 0 162.1652 01.0000 0 0 1.0000 0 1.0000 0 Columns 15through21162.1843 186.9750 201.7163 202.6228 221.4368 223.3506 229.54329.9629 21.9640 2.4814 9.4228 14.2009 9.0656 23.38680 0 0 0 0 0 0 172.1472 0 0 0 0 0 01.0000 0 0 0 0 0 0Columns 22through28229.5819 255.0699 263.2190 285.6008 285.9892 339.7321 342.2822 20.2516 0.5970 0.4486 5.5302 28.1709 14.4911 10.40840 0 0 0 0 0 00 0 0 0 0 0 00 0 0 0 0 0 0 Columns 29through35344.2996 345.7073 370.4249 379.5933 393.0690 395.2996 403.7064 1.9700 41.7316 31.4600 17.7792 4.3214 3.1235 4.34260 0 0 0 0 0 00 0 0 0 0 0 00 0 0 0 0 0 0 Columns 36through42404.6424 421.6883 435.0138 454.2870 474.2329 475.6337 481.0860 7.9646 6.0329 12.1631 2.9478 16.6625 3.7575 16.95480 0 0 0 0 0 00 0 0 0 0 0 00 0 0 0 0 0 0 Columns 43through48487.0670 506.3803 507.9699 512.7172 523.1882 529.85819.9836 4.6901 2.4817 25.1175 0.7323 2.53970 0 0 0 0 00 0 0 0 0 00 0 0 0 0 0events =Columns 1through75.6418 13.2050 57.5155 68.3886 86.5789 88.8820 100.55489.1178 25.7746 14.2747 20.9298 16.9332 14.2731 8.74030 0 0 0 0 0 014.7597 0 71.7901 0 103.5121 0 01.0000 0 1.0000 0 1.0000 0 0 Columns 8through14106.9312 124.9101 129.9854 143.3425 147.5878 151.3098 154.211330.0267 1.0235 0.5680 7.1159 7.1488 10.8554 1.05300 0 0 0 0 0 0 136.9579 0 0 150.4584 0 162.1652 01.0000 0 0 1.0000 0 1.0000 0 Columns 15through21162.1843 186.9750 201.7163 202.6228 221.4368 223.3506 229.54329.9629 21.9640 2.4814 9.4228 14.2009 9.0656 23.38680 0 0 0 0 0 0 172.1472 208.9390 0 0 0 0 01.0000 1.0000 0 0 0 0 0 Columns 22through28229.5819 255.0699 263.2190 285.6008 285.9892 339.7321 342.282220.2516 0.5970 0.4486 5.5302 28.1709 14.4911 10.40840 0 0 0 0 0 00 0 0 0 0 0 00 0 0 0 0 0 0 Columns 29through35344.2996 345.7073 370.4249 379.5933 393.0690 395.2996 403.70641.9700 41.7316 31.4600 17.7792 4.3214 3.1235 4.34260 0 0 0 0 0 00 0 0 0 0 0 00 0 0 0 0 0 0 Columns 36through42404.6424 421.6883 435.0138 454.2870 474.2329 475.6337 481.08607.9646 6.0329 12.1631 2.9478 16.6625 3.7575 16.95480 0 0 0 0 0 00 0 0 0 0 0 00 0 0 0 0 0 0 Columns 43through48487.0670 506.3803 507.9699 512.7172 523.1882 529.85819.9836 4.6901 2.4817 25.1175 0.7323 2.53970 0 0 0 0 00 0 0 0 0 00 0 0 0 0 0number =1number =1number =events =Columns 1through75.6418 13.2050 57.5155 68.3886 86.5789 88.8820 100.55489.1178 25.7746 14.2747 20.9298 16.9332 14.2731 8.74030 0 0 0 0 0 014.7597 0 71.7901 0 103.5121 0 01.0000 0 1.0000 0 1.0000 0 0 Columns 8through14106.9312 124.9101 129.9854 143.3425 147.5878 151.3098 154.211330.0267 1.0235 0.5680 7.1159 7.1488 10.8554 1.05300 0 0 0 0 0 0 136.9579 0 0 150.4584 0 162.1652 01.0000 0 0 1.0000 0 1.0000 0 Columns 15through21162.1843 186.9750 201.7163 202.6228 221.4368 223.3506 229.54329.9629 21.9640 2.4814 9.4228 14.2009 9.0656 23.38680 0 0 0 0 0 0 172.1472 208.9390 0 0 0 0 01.0000 1.0000 0 0 0 0 0 Columns 22through28229.5819 255.0699 263.2190 285.6008 285.9892 339.7321 342.282220.2516 0.5970 0.4486 5.5302 28.1709 14.4911 10.40840 0 0 0 0 0 00 0 0 0 0 0 00 0 0 0 0 0 0 Columns 29through35344.2996 345.7073 370.4249 379.5933 393.0690 395.2996 403.70641.9700 41.7316 31.4600 17.7792 4.3214 3.1235 4.34260 0 0 0 0 0 00 0 0 0 0 0 00 0 0 0 0 0 0 Columns 36through42404.6424 421.6883 435.0138 454.2870 474.2329 475.6337 481.08607.9646 6.0329 12.1631 2.9478 16.6625 3.7575 16.95480 0 0 0 0 0 00 0 0 0 0 0 00 0 0 0 0 0 0 Columns 43through48487.0670 506.3803 507.9699 512.7172 523.1882 529.85819.9836 4.6901 2.4817 25.1175 0.7323 2.53970 0 0 0 0 00 0 0 0 0 00 0 0 0 0 0events =Columns 1through75.6418 13.2050 57.5155 68.3886 86.5789 88.8820 100.5548 9.1178 25.7746 14.2747 20.9298 16.9332 14.2731 8.74030 0 0 0 0 0 0 14.7597 0 71.7901 0 103.5121 0 0 1.0000 0 1.0000 0 1.0000 0 0Columns 8through14106.9312 124.9101 129.9854 143.3425 147.5878 151.3098 154.2113 30.0267 1.0235 0.5680 7.1159 7.1488 10.8554 1.05300 0 0 0 0 0 0 136.9579 0 0 150.4584 0 162.1652 0 1.0000 0 0 1.0000 0 1.0000 0 Columns 15through21162.1843 186.9750 201.7163 202.6228 221.4368 223.3506 229.5432 9.9629 21.9640 2.4814 9.4228 14.2009 9.0656 23.38680 0 0 0 0 0 0 172.1472 208.9390 0 0 235.6377 0 0 1.0000 1.0000 0 0 1.0000 0 0 Columns 22through28229.5819 255.0699 263.2190 285.6008 285.9892 339.7321 342.2822 20.2516 0.5970 0.4486 5.5302 28.1709 14.4911 10.40840 0 0 0 0 0 00 0 0 0 0 0 00 0 0 0 0 0 0Columns 29through35344.2996 345.7073 370.4249 379.5933 393.0690 395.2996 403.70641.9700 41.7316 31.4600 17.7792 4.3214 3.1235 4.34260 0 0 0 0 0 00 0 0 0 0 0 00 0 0 0 0 0 0 Columns 36through42404.6424 421.6883 435.0138 454.2870 474.2329 475.6337 481.08607.9646 6.0329 12.1631 2.9478 16.6625 3.7575 16.95480 0 0 0 0 0 00 0 0 0 0 0 00 0 0 0 0 0 0 Columns 43through48487.0670 506.3803 507.9699 512.7172 523.1882 529.85819.9836 4.6901 2.4817 25.1175 0.7323 2.53970 0 0 0 0 00 0 0 0 0 00 0 0 0 0 0number =1number =1number =1。