如何写实验报告 How to Write a Lab Report
实验报告范本

实验报告范本一、引言实验的目的是介绍并演示如何撰写实验报告,以便为同学们提供一个合适的范本。
本报告将按照以下结构进行撰写:引言、实验方法、结果和讨论、结论、参考文献。
二、实验方法本实验使用了以下材料和设备:实验样品、试剂、实验装置和仪器。
详细介绍了实验中使用的方法和步骤,并对每个步骤进行了解释和讨论。
三、结果和讨论在这一部分,我们会详细描述实验过程中所取得的结果,并就结果进行讨论。
对实验中遇到的问题进行分析,并分别给出了解决方法,以及结果是否符合预期的原因。
通过对结果的讨论,进一步说明了实验的合理性。
四、结论在本部分,我们对整个实验进行总结,并得出结论。
根据实验结果,我们得出了一些重要的结论,并阐述了对于未来研究的一些建议和展望。
五、参考文献在这一部分,我们列出了在实验报告中引用的所有文献和资料的详细信息,包括作者、标题、出版日期和出版社等。
参考文献:[1] Smith, John. "A Study on Experimental Reports." Journal of Science Education, vol. 10, no. 2, 2018, pp. 45-52.[2] Johnson, Lisa. "How to Write an Effective Lab Report." Science Communication Journal, vol. 5, no. 3, 2019, pp. 67-75.[3] Wang, Xiaojun, et al. "Experimental Methods in Physics." Research Methods in Science, vol. 15, no. 1, 2020, pp. 89-104.六、致谢在这一部分,我们表达对实验中提供支持和帮助的人们的感谢之情,包括教师、实验室助理、同学等。
Lab Report Template 实验报告样板
University of Arizona Materials Science and Engineering MSE 110: Solid State ChemistrySection NumberLab Title goes hereDate Performed:Date Submitted:Your NameLab PartnersPartner 1 NamePartner 2 Nameetc2 IntroductionIn your own words, describe the purpose of the experiment and the theory supporting the study. Briefly outline how the experiment will be done without going into much detail. State explicitly what the experiment hopes to accomplish. This section should be a few paragraphs long.Experimental ProcedureProvide a bulleted list of materials used in the lab if any.If the experiment required any set-up, provide figures explaining that set-up.In your own words, describe the procedure used. This should be a numbered list of steps that you took during the lab, written in passive voice. This section is not a list of instructions. Include figures as necessary.Experimental ResultsThis section should include all data collected (calculated and measured) in well-organized tables. All tables should be labeled with a table number and introduced in a sentence or two, i.e. “Table 7.4 includes all measured marble diameters, d”. Units should be included for all measurements and listed at the top of the table next to the column label. Graphs should have well labeled axes and use appropriate scales. All calculations performed to get the final result should be detailed here. For each equation used, provide the equation in variables and the calculation as you performed it.Discussion and ConclusionsThis section should restate the final result of the experiment and a comparison should be made between the experimental and theoretical results. Sources of error should be discussed here (do not cite human error). This section should also relate findings and sources of error to the underlying theory of the experiment.If external references were used (including images), provide an appropriate citation for each source.。
中学物理实验报告格式模板
中学物理实验报告格式模板As a student conducting a physics experiment in middle school, it is important to follow a specific format for the lab report. 作为一名中学生在进行物理实验时,遵循特定的实验报告格式是非常重要的。
First and foremost, the lab report should include a title that clearly reflects the purpose of the experiment. This title should be concise and informative, giving the reader a clear idea of what will be discussed in the report. Additionally, the introduction should provide background information on the topic being studied and explain the objectives of the experiment.首先,实验报告应包括一个清晰反映实验目的的标题。
这个标题应该简洁明了,给读者一个明确的想法,了解报告中将要讨论的内容。
另外,引言部分应提供有关所研究主题的背景信息,并解释实验的目标。
Moreover, the materials and methods section of the lab report should detail all the equipment and materials used in the experiment, as well as the procedures followed. It is crucial to provide sufficient detail so that the experiment can be replicated by others. Additionally, any safety precautions taken during the experimentshould be clearly outlined in this section.此外,实验报告的材料和方法部分应详细介绍实验中使用的所有设备和材料,以及遵循的程序。
Lab-report-物理实验报告(英文)
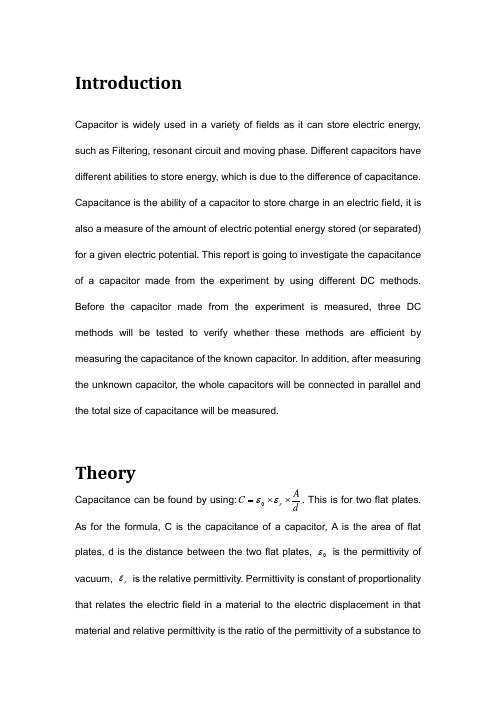
IntroductionCapacitor is widely used in a variety of fields as it can store electric energy, such as Filtering, resonant circuit and moving phase. Different capacitors have different abilities to store energy, which is due to the difference of capacitance. Capacitance is the ability of a capacitor to store charge in an electric field, it is also a measure of the amount of electric potential energy stored (or separated) for a given electric potential. This report is going to investigate the capacitance of a capacitor made from the experiment by using different DC methods. Before the capacitor made from the experiment is measured, three DC methods will be tested to verify whether these methods are efficient by measuring the capacitance of the known capacitor. In addition, after measuring the unknown capacitor, the whole capacitors will be connected in parallel and the total size of capacitance will be measured.Theory Capacitance can be found by using:dA C r ⨯⨯=εε0. This is for two flat plates. As for the formula, C is the capacitance of a capacitor, A is the area of flat plates, d is the distance between the two flat plates, 0ε is the permittivity of vacuum, r ε is the relative permittivity. Permittivity is constant of proportionality that relates the electric field in a material to the electric displacement in that material and relative permittivity is the ratio of the permittivity of a substance tothat of free space or vacuum. Different materials have different relative permittivity, the behind table includes the relative permittivity of some different material:Source: (The Engineering Tool Box, 2011.) When two capacitors are placed in series, the charge on each plate is of equalof charges on plate and V is the voltage across the capacitor). When ais the initial voltage adding on the capacitor, e is a constant and it is 2.718, R is resistance, C is capacitance and 0I is the initial current flowing through the capacitor). Analogously, when a capacitor is discharged, it flows RC t e V V -=0and RC t eI I -=0.MethodsApparatus :Power supply, leads, ruler, calipers, clips, known capacitor, aluminum foil,。
如何写实验报告英文版
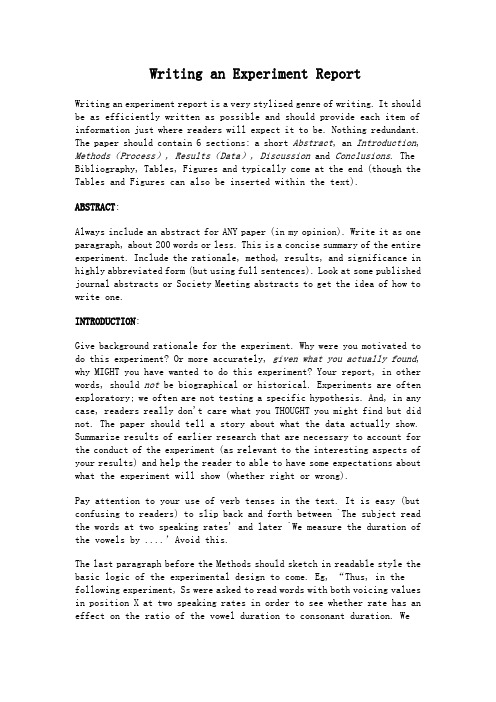
Writing an Experiment ReportWriting an experiment report is a very stylized genre of writing. It should be as efficiently written as possible and should provide each item of information just where readers will expect it to be. Nothing redundant. The paper should contain 6 sections: a short Abstract, an Introduction, Methods(Process), Results(Data), Discussion and Conclusions. The Bibliography, Tables, Figures and typically come at the end (though the Tables and Figures can also be inserted within the text).ABSTRACT:Always include an abstract for ANY paper (in my opinion). Write it as one paragraph, about 200 words or less. This is a concise summary of the entire experiment. Include the rationale, method, results, and significance in highly abbreviated form (but using full sentences). Look at some published journal abstracts or Society Meeting abstracts to get the idea of how to write one.INTRODUCTION:Give background rationale for the experiment. Why were you motivated to do this experiment? Or more accurately, given what you actually found, why MIGHT you have wanted to do this experiment? Your report, in other words, should not be biographical or historical. Experiments are often exploratory; we often are not testing a specific hypothesis. And, in any case, readers really don't care what you THOUGHT you might find but did not. The paper should tell a story about what the data actually show. Summarize results of earlier research that are necessary to account for the conduct of the experiment (as relevant to the interesting aspects of your results) and help the reader to able to have some expectations about what the experiment will show (whether right or wrong).Pay attention to your use of verb tenses in the text. It is easy (but confusing to readers) to slip back and forth between `The subject read the words at two speaking rates' and later `We measure the duration of the vowels by ....’Avoid this.The last paragraph before the Methods should sketch in readable style the basic logic of the experimental design to come. Eg, “Thus, in the following experiment, Ss were asked to read words with both voicing values in position X at two speaking rates in order to see whether rate has an effect on the ratio of the vowel duration to consonant duration. Weexpected to find no difference in ratio due to speaking rate.'' (Or whatever.)METHODS:There are 3 logical parts to the methods: the Independent Variables(input variables, the things you controlled: place of article, word length, speaking rate, etc or whatever), the Task performed by the subjects, and the Dependent Variables. You have a task (eg, reading these phrases in a some way) for which certain values of the IV s are set (eg, +/-voice, +/- front, final stops at two speaking rates, etc.). Then you measure the DV s (eg, vowel durations, F0 contours, whatever). Finally you look for ways in which the DV s are structured by (influenced by) the IV s. This section should be tight and business-like in style.Of course, you need to tell your readers about at least the following: •characteristics of your subjects (sex, native language, age range, etc.; and the instructions you gave them),•how the recordings were made, including major equipment items, •analysis of the recordings; the measurement procedures; the software employed. Describe any special problems in measurementthat arose and your solution to them,•describe the statistics you performed, if any.RESULTS:Systematically go through the relevant aspects of your data. Present tables and graphs of the DV s. The organization of these paragraphs will probably be in terms of the IV s. For example, "The change in value of IV affects both DV1 and DV2,".)Describe the important features of the data in the text. Lead the reader through the tables and figures (eg, "As can be seen in the left side of Figure 1,..."). Devise data presentation techniques that make the real meaning of the data as clear as possible. Be sure to label graphs and figures clearly. Organization of paragraphs would normally be in terms of the independent variables.DISCUSSION:1) Organization of paragraphs (subsections) may often be in terms of independent variables (i.e. the factors varied in the experimental design).2) Compare your results to previous similar experiments. To what extent do your results resemble those found before?3) What new discoveries have you found? What is their significance to specific and more general issues in the area?CONCLUSIONS:Review and summarize very briefly what was done in this experiment and what you found in the results. State in general terms the most important discovery in the experiment. You may also want to suggest follow-up experiments.Notes on Experimental Writing Style1) Avoid first person pronouns no matter how awkward it may seem. "I asked the Ss to..." => "The Ss were asked to...".2) Paper is cheap! It is easier to spread out your text and figures and use many separate pages.3) Be as pithy as possible. Learn to use standard verbal formulas to abbreviate descriptions of methods, statistics, etc. Never be concerned that your paper is too short. It can only be too long. Say everything you have to say and no more. If you want to stretch out your paper, do it in the Discussion-- keep the Methods and Results tight, systematic and predictable.4) Make a careful outline that you update as you write. It's generally easiest to write the Methods first, then Results (starting a new page), then sketch out the Discussion (starting a new page), and finally create an easily read and descriptive title. Then write the Introduction last.5) When completed, the order of parts should be: Abstract, Text, References, Tables (on a separate pages unless very small), Figures (each on a separate page unless very small and labeled at the bottom). All tables and figures need a legend (on the page or listed on a separate page). Staple on diagonal in upper left hand corner. No fancy covers or plastic folders! Typed, of course, and EVERYTHING DOUBLE SPACED.6) Use plenty of Figures! Be creative with figures to facilitate the reader's understanding.But most of all HAVE FUN.。
lab report例文
Lab Report例文I. 引言该实验旨在研究……本文将根据实验结果,以及相应的数据分析和讨论,给出完整的实验报告。
II. 实验方法2.1 设备和材料本实验使用的设备和材料包括:•仪器A•仪器B•材料X•材料Y2.2 实验步骤1.步骤1:……2.步骤2:……3.步骤3:……III. 实验结果3.1 数据收集在本实验中,我们采集了以下数据:(注意:以下为虚构数据)实验条件数据1 数据2 数据3A 10 20 30B 15 25 35C 12 22 323.2 数据处理根据上述数据,我们进行了以下数据处理步骤:1.步骤1:……2.步骤2:……3.步骤3:……3.3 数据分析根据数据处理的结果,我们进行了数据分析,得出以下结论:1.结论1……2.结论2……3.结论3……IV. 讨论4.1 结果分析根据实验结果和数据分析,我们可以得出如下结论:1.结论1……2.结论2……3.结论3……4.2 误差分析在本实验中,可能存在一些误差,这些误差可能导致实验结果的偏差。
以下是可能的误差来源:1.误差来源1:……2.误差来源2:……3.误差来源3:……4.3 实验改进根据误差分析,我们可以提出一些改进实验的方法:1.改进方法1:……2.改进方法2:……3.改进方法3:……V. 结论根据实验结果和讨论,我们得出以下结论:1.结论1……2.结论2……3.结论3……VI. 参考文献[1] 引用文献1[2] 引用文献2[3] 引用文献3VII. 附录在此附上了本实验中使用的原始数据和完整的数据处理过程。
VIII. 致谢感谢实验室的支持,以及所有参与实验的人员的辛勤工作。
感谢导师的指导和建议,使本实验能够顺利完成。
IX. 作者简介•作者A:XXX大学,XXX学院,XXX专业,学号 XXXXX,Email: *******************•作者B:XXX大学,XXX学院,XXX专业,学号 XXXXX,Email: *******************•作者C:XXX大学,XXX学院,XXX专业,学号 XXXXX,Email: *******************以上为该实验的完整报告。
英文实验报告的格式和写法
英文实验报告的格式和写法【转】2010-10-04 06:03一份最标准的实验报告的格式:1. Abstract2. Introduction3. Method4. Results5. Discussion6. Conclusion7. Reference分别来分享下近来学到的。
Abstract摘要摘要,就是整篇文章摘出来的要。
强烈建议整篇文章写完后再写摘要。
把文章每个部分选一些句子出来就可以拼凑成一个abstract了。
一个abstract 的模板:1 一两句话说明这个实验的主要理论依据,或者实验需要证明的假说。
2 一两句话说一下这个理论或者假说的相关的研究。
3 两三句话描述一下实验4 两三句话概括一下实验结果5 一句话说一个结论,解释一下这个实验的意义或结果的重要性转一个别人的example:Does a child’s focus correlate with barometric pressure? if so, does it correlate positively or negatively? Tucker (1999) hypothesized a negative correlation, but this assertion has never been tested. Our team used the MISHA CPT to measure the focus of a group of 150 third-grade students. we divided the students into three groups of 50 students. one group took the MISHA CPT when barometric pressure was low, another group took it when barometric pressure was neutral, and the final group took it when barometric pressure was high. the results found that children focused significantly better when barometric pressure was low than when barometric pressure was neutral or high. the results suggest that when diagnosing ADHD, practitioners should give the CPT when barometric pressure is neutral.IntroductionIntroduction以实验目的为开头,解释一下这个实验需要证明的东西。
How to Write a Lab Report
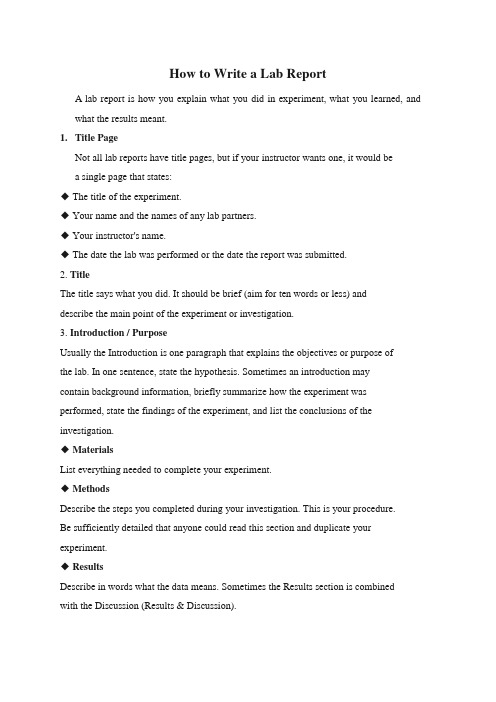
How to Write a Lab ReportA lab report is how you explain what you did in experiment, what you learned, andwhat the results meant.1.Title PageNot all lab reports have title pages, but if your instructor wants one, it would bea single page that states:◆ The title of the experiment.◆ Your name and the names of any lab partners.◆ Your instructor's name.◆ The date the lab was performed or the date the report was submitted.2. TitleThe title says what you did. It should be brief (aim for ten words or less) anddescribe the main point of the experiment or investigation.3. Introduction / PurposeUsually the Introduction is one paragraph that explains the objectives or purpose ofthe lab. In one sentence, state the hypothesis. Sometimes an introduction maycontain background information, briefly summarize how the experiment was performed, state the findings of the experiment, and list the conclusions of the investigation.◆MaterialsList everything needed to complete your experiment.◆MethodsDescribe the steps you completed during your investigation. This is your procedure.Be sufficiently detailed that anyone could read this section and duplicate your experiment.◆ResultsDescribe in words what the data means. Sometimes the Results section is combinedwith the Discussion (Results & Discussion).4. ConclusionsMost of the time the conclusion is a single paragraph that sums up what happened in the experiment, whether your hypothesis was accepted or rejected, and what this means.。
实验报告英语作文模板
实验报告英语作文模板英文回答:Introduction。
The purpose of this experiment was to investigate the effect of temperature on the rate of a chemical reaction. The reaction studied was the decomposition of hydrogen peroxide (H2O2) into water (H2O) and oxygen (O2). The hypothesis was that the rate of the reaction would increase as the temperature increased.Methods。
The experiment was conducted by measuring the volume of oxygen produced over time at different temperatures. The following materials were used:100 mL of 3% hydrogen peroxide solution。
10 mL of catalase enzyme solution。
250 mL graduated cylinder。
Thermometer。
Stopwatch。
The procedure was as follows:1. The hydrogen peroxide solution was poured into the graduated cylinder.2. The catalase enzyme solution was added to the hydrogen peroxide solution.3. The stopwatch was started.4. The volume of oxygen produced was recorded every minute for 10 minutes.5. The temperature of the solution was recorded everyminute for 10 minutes.Results。
英语实验报告演讲稿范文
Introduction:Good morning/afternoon everyone,Today, I am honored to present my experimental report on the effects of light on plant growth. This study was conducted to investigate how different light conditions affect the growth rate, leaf color, and overall health of plants. Through careful observation and analysis, we aimed to understand the importance of light in plant development and its potential applications in agriculture and horticulture.Background:Plants require light as one of their primary sources of energy for photosynthesis. Photosynthesis is the process by which plants convert light energy into chemical energy, which is then used to produce glucose and oxygen. The light spectrum and intensity significantly influence the rate of photosynthesis and, consequently, the growth of plants. This experiment aimed to explore the following hypotheses:1. Higher light intensity will result in greater growth rate and leaf color intensity.2. Different light wavelengths will affect plant growth differently.3. Continuous light exposure will promote better growth compared to intermittent light.Materials and Methods:For this experiment, we used three types of plants: lettuce, spinach, and tomato. The plants were grown in identical pots with equal amounts of soil and water. We set up four different light conditions: low light (LL), medium light (ML), high light (HL), and continuous light (CL). The light sources were LED grow lights with different intensities and wavelengths.The experimental setup was as follows:1. Low Light (LL): The plants were exposed to 1000 lux of light for 8 hours a day.2. Medium Light (ML): The plants were exposed to 2000 lux of light for 8 hours a day.3. High Light (HL): The plants were exposed to 3000 lux of light for 8 hours a day.4. Continuous Light (CL): The plants were exposed to 2000 lux of light continuously for 24 hours a day.The plants were measured weekly for growth rate, leaf color, and overall health. The growth rate was measured by calculating the increase in height and leaf area. Leaf color was determined using a spectrophotometer, which measured the absorption of light by the leaves at different wavelengths. Overall health was assessed visually, considering factors like leaf discoloration, wilting, and pest infestation.Results:After eight weeks of experimentation, we observed the following results:1. Growth Rate:The plants exposed to high light intensity (HL) and continuous light (CL) showed the highest growth rate, with lettuce and spinach reaching a height of 15 cm and 12 cm, respectively. In contrast, the plants in the low light (LL) condition only grew to a height of 5 cm and 7 cm for lettuce and spinach, respectively.2. Leaf Color:The plants exposed to high light intensity (HL) and continuous light (CL) had the darkest leaf color, indicating a higher concentration of chlorophyll. The medium light (ML) condition also resulted in a goodleaf color, while the low light (LL) condition produced paler leaveswith less chlorophyll.3. Overall Health:The plants exposed to continuous light (CL) showed the best overall health, with minimal leaf discoloration, wilting, and pest infestation.The high light (HL) condition also maintained good health, while the medium light (ML) and low light (LL) conditions showed signs of stress, including leaf discoloration and pest infestation.Discussion:Our results indicate that light intensity and exposure time play acrucial role in plant growth. Higher light intensity and continuouslight exposure significantly enhance the growth rate and leaf color of plants. This suggests that adjusting light conditions can be aneffective strategy to optimize plant growth in controlled environments, such as greenhouses and vertical farms.Moreover, our findings support the hypothesis that different light wavelengths affect plant growth differently. However, further researchis required to determine the specific wavelengths that are mostbeneficial for each plant species.The continuous light condition proved to be more beneficial than intermittent light, as it minimized stress on the plants and promoted better overall health. This finding has implications for the design of indoor farming systems, where continuous light can be more energy-efficient and effective.Conclusion:In conclusion, our experiment has demonstrated the significant impact of light on plant growth. By understanding the relationship between light intensity, exposure time, and plant species, we can develop moreeffective strategies for optimizing plant growth in various environments. This knowledge can be applied to improve agricultural practices, enhance crop yields, and promote sustainable horticultural practices.Thank you for your attention, and I am open to any questions you may have regarding this study.。
如何写实验报告HowtoWriteaLabReport

4、结语
根据本课程的要求,每个实验的实际实验时间非常 有限。本文对于赛曼效应实验的调节方面进行了分 析,在达到实验所要求的精确程度的前提下,提出 了一种提高调整效率的方法,可以使总体的实验效 率有一定程度的提高。此外,设计了一种简易的装 置,可以在不改变原实验装置的情况下,在一定程 度上提高测量的精确度,部分的满足一些更深层次 探究的需要。
The Procedure Section
A sketch of apparatus, or a list of equipment A carefully hand-drawing sketch is usually better Tell what you did with the equipment, but not be too “step-
Lab Report
Lab reports are an essential part of all laboratory courses and usually a significant part of your grade.
A lab report is how you explain what you did in experiment, what you learned, and what the results meant.
如何写实验报告 HowtoWriteaLabReport
关于实验报告的“三句半”
抄书抄讲义,浪费时间 报告写得越长得分越高,负担太重 实验记录再写一遍,真没意思 最好不写实验报告
实验报告和学术论文
实验报告和学术论文有没有区别? 既有又没有!(可能有1000和100的差别) 同样不能抄袭 同样不能粗制滥造 同样要用精练、准确、科学的语言
英文作文实验报告模板
Title: [Experiment Name]Introduction:The purpose of this experiment was to [briefly describe the objective of the experiment]. This report outlines the methodology, results, and conclusions drawn from the experiment.Objective:To [state the main objective of the experiment].Materials and Methods:1. Materials:- [List all the materials used in the experiment.]2. Apparatus:- [Describe the equipment used, including models and serial numbersif applicable.]3. Procedure:- [Provide a step-by-step description of how the experiment was conducted.]- Step 1: [Description of Step 1]- Step 2: [Description of Step 2]- [Continue with additional steps as necessary.]4. Data Collection:- [Describe how data was collected during the experiment.]5. Data Analysis:- [Outline the methods used to analyze the data collected.]Results:The following results were obtained from the experiment:1. Observations:- [Summarize any observations made during the experiment.]2. Data Tables:- [Include tables with relevant data collected during the experiment.]3. Graphs and Charts:- [Include graphs and charts to visually represent the data.]Discussion:The results of the experiment were [briefly discuss the outcomes]. This section should include:1. Analysis of Results:- [Interpret the data and discuss the implications of the results.]2. Comparison with Previous Work:- [Compare the results with those from similar experiments or literature.]3. Limitations:- [Discuss any limitations of the experiment or the methodology used.]4. Further Research:- [Suggest areas for further research or modifications to the experiment.]Conclusion:Based on the results and discussion, the following conclusions can be drawn:- [State the main conclusions of the experiment.]- [Highlight any significant findings or contributions of the experiment.]Acknowledgments:We would like to acknowledge [name of person or organization] for their support and assistance in conducting this experiment.References:[Include a list of all references cited in the report.]Appendices:[Include any additional information or data that is relevant but not included in the main body of the report.]---This template is designed to provide a structured outline for writing an experimental report. It can be customized according to the specific requirements of the experiment and the discipline in which it is conducted.。
电脑实验报告格式范文
电脑实验报告格式范文(中英文实用版)Title: Sample Format for Computer Lab ReportIntroduction:The purpose of this report is to document the findings and analysis of a computer experiment conducted on [Date].The experiment involved [Briefly describe the experiment].This report will provide a detailed account of the process, results, and conclusions drawn from the experiment.实验报告的目的是记录在[日期]进行的计算机实验的结果和分析。
该实验涉及[简要描述实验]。
本报告将详细介绍实验过程、结果和得出的结论。
Materials and Methods:The following materials and equipment were used in this experiment: [List the materials and equipment].The experimental procedure consisted of the following steps: [List the steps].本次实验使用了以下材料和设备:[列出材料和设备]。
实验程序包括以下步骤:[列出步骤]。
Results:The results of the experiment are presented in [Graphs, tables, etc.].From the analysis of the results, it can be observed that [Discuss the trends, patterns, or relationships observed].实验结果以[图表、表格等]形式呈现。
实验报告的写作及注意事项

实验报告的写作及注意事项第一篇:实验报告的写作及注意事项实验课程旨在系统强化学生基本实验技能的训练,培养学生独立实验能力、自主获取知识的能力及创新意识。
而实验报告则完整地记录实验的全过程,包括对实验结果的分析和总结。
后者不但有助于学生理解和掌握实验目的、原理、方法和技能,还能通过观察、分析实验现象和结果,初步培养和训练学生的逻辑思维能力、综合分析能力和文字表达能力,是科学论文写作的基础。
作为实验教的实验报告除应包括题目、目的、原理、内容和操作过程外,还要记录所观察到的现象产生变化的过程(或轨迹)、数据及讨论分析等。
怎么才能写好实验报告?本文就此谈几点粗浅体会。
一、实验报告在实验科学中的作用(一)实验报告写作对实验课的重要性通过书写实验报告可以培养学生的多种能力,可以使得实验操作的过程在学生脑海中得以演练或得以重现,提高学生对所学知识的巩固的强度并由此激发学生动手操作的积极性;通过对实验结果与所需要求的比较及存在问题的分析,使学生能提出实验方法的改进措施,达到能够敢于独立思考。
培养学生突破习惯性思维的束缚,勇于创造的能力;通过实验报告中对实验数据的分析、处理,懂得从误差产生原因达到能怎样找出清除方法的分析;通过对实验结果的总结,可以培养学生的综合归纳能力。
为了写好实验报告学生势必在课前要预习实验的基本内容,实验进程,并对相关学科理论知识要有针对性地予以检索,形成规律性认知,例如通过对万有引力存在的认识,理解物质的重力产生的本质,而从离心力的出现,感悟天空行星不发生相互碰撞。
(二)在消化实验原理和技术方法中的作用实验指导是学生对课堂所学科学理论验证方法的航标,它指引着学生朝着做好实验的方向前进。
实验是运动手与脑的过程,在进行每个动作的实施时均浸润着大脑的思考、分析,所以实验过程有助于加深对实验指导书的理解和对实验技术方法的正确掌握。
因此,只有认真总结实验过程才能对实验指导书有深刻的理解,从而才有可能做好实验并正确写出高质量的实验报告,才能消化实验原理,提炼出切实可行的技术方法。
How_to_write_a_Physics_Lab_report

How to write a Physics Lab reportFor each lab, each group is required to produce a technical report in English and print out your report as a PDF and submit the PDF within two weeks of you completing the experiment.(If you undertake the experiment on Monday, then you must submit your assignment by the week after the next Monday). The assessment of your report will primarily be on the technical content rather than your written English. However if you do not explain clearly what you mean then you will loose marks. Nevertheless, the intention is that you obtain some practice in the concise and accurate style of writing that engineers use. This is an essential skill for a engineering graduate.To gain an idea of the structure of a scientific paper, it is recommended you visit some physics journal WebPages and look at recently published papers.The following is the general structure of a paper, but as you will find from browsing the published literature there are variations that depend on the content of the paper. However, use the following as a basis from which to work.Cover (5%)At the beginning of the lab report, you should provide a cover page containing the lab title, team members names, the data, and the name of your lab instructor.Introduction (20%)This section is where the paper starts and includes some background or history to the area of research. It is very rare for an idea to arise by itself since there is always some precedent that has led to the ideas being tested in an experiment. It might also include some application of the principle behind the experiment. For example, say the experiment was about the sign of the charge carriers in a semiconductor. One application is a magnetic field sensor that uses the Hall Effect. Finally, some motivation is required for conducting this experiment. Why would anyone want to conduct this experiment? What did you test or examine? That is, give the reader a “road-map” about where you are headed.If there is some background mathematical theory or qualitative ideas that need to be introduced so that the experimental results can be understood, then this is the place to do it. In fact, you will find it missing in some papers because there was no background theory to discuss. In many cases the theory is not extensive enough to place it in a dedicated section and is simply incorporated in the Introduction.Experimental Setup and Procedure (15%)Since the paper is about an experiment, then there must be some description of the apparatus used. A reader can only gain confidence in the results if they are confident that you had appropriate apparatus and were able to describe its function and limitations (every piece of apparatus has its limitations, no matter how expensive it is!). In many cases you need to describe in some detail those parts of the apparatus that are critical to the understanding of the experimental results. A diagram goes a long way in helping the reader understand your description of the setup. If more than one apparatus was used then you can use subsections. Although the procedure section of your lab handout may be very long and detailed, the procedure section of your report should be concise and only include the major parts of the procedure. You should summarize each of the major parts of the procedure in your own words. You can write this in paragraph form or in list format. You do not have to include all the detailed instructions - for those the reader can be referred to the lab handout. Include the procedure of any exercises that are requested at the end of the lab handout. Remember to use past tense since you are reporting on the procedure you followed.Results and Discussion (40%)In this section you will take the reader, in a logical order, through all the results obtained. A written commentary should take the reader through all the tables of results and figures that are included in this section (referring to figure and table numbers) with comments on key aspects. You must mention every figure and table somewhere in the text. This section must contain the results in a form that will be most useful to the reader, which usually means the final results as graphs or tables. Graphs should show all experimental data points clearly. Don’t jus t use the default Excel graph appearance – make it look professional.This section also includes an analysis of the results. The results of your experimental work need to be discussed and explain what they mean. This is the most important part of the work and must be the result of careful thought and analysis. You should discuss whether or not your result agrees with the engineering theory. If they do not you should try to explain why, you should include an analysis of errors; a statement like “results ag reed within the limits of experimental error” is meaningless without this analysis. Do not propose impossible explanations for the difference between theory and experiment. Always try to quantify the effect and see whether it is at least possible. Suggest ways in which the experiment could be improved.Conclusions (20%)A conclusion IS NOT a place where you say “… therefore, I conclude that I have discovered the following new physical principles …” It is nothing more than a summary of what the experiment was about, the results, and what they mean. It should show how far the object of the experiment has been achieved. Quite often people skip reading the paper and go straight to the conclusion to save some time. This section is usually the weakest part of most student reports since they just want the report to be over and done with. Try to spend some time on this section.Common mistakes and helpful hints• Remember to write in the correct tense. You have already completed the experiments that you are reporting about. So they WERE done –they are NOT being now as you write the report. They are NOT going to be done as the reader reads further into the report. For example, the experiment WAS carried out and the results ARE presented in Fig. XX.• Do not w rite instructions as if you are writing a laboratory manual.• Do not write in dot point format. The writing must be in a narrative style.• Do not do join-the-dots plots for your graphs. They do not convey any extra information. However, if you have more than one plot on the same graph and the points are scattered and interleaved, then it is legitimate to join the points simply to distinguish the points that belong to the same plot.• Explain how you determined your errors. There must always be a reason fo r an error estimate. • Always compare experimental and accepted values.• Express discrepancies in terms of errors, not as small, large or 5%!• Use Origin/Excel routines to determine errors in fitted parameters, but be aware of their limitations.• Exclude any waffle when trying to explain discrepancies – show physical insight.。
How to Write a Laboratory Report
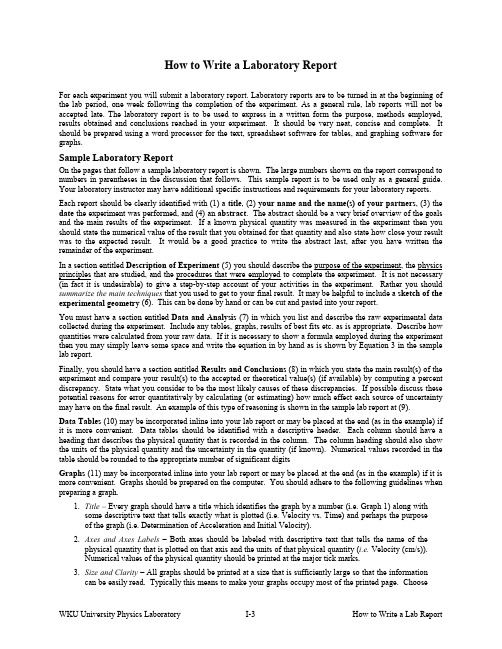
How to Write a Laboratory ReportFor each experiment you will submit a laboratory report. Laboratory reports are to be turned in at the beginning of the lab period, one week following the completion of the experiment. As a general rule, lab reports will not be accepted late. The laboratory report is to be used to express in a written form the purpose, methods employed, results obtained and conclusions reached in your experiment. It should be very neat, concise and complete. It should be prepared using a word processor for the text, spreadsheet software for tables, and graphing software for graphs.Sample Laboratory ReportOn the pages that follow a sample laboratory report is shown. The large numbers shown on the report correspond to numbers in parentheses in the discussion that follows. This sample report is to be used only as a general guide. Your laboratory instructor may have additional specific instructions and requirements for your laboratory reports. Each report should be clearly identified with (1) a title, (2) your name and the name(s) of your partners, (3) the date the experiment was performed, and (4) an abstract. The abstract should be a very brief overview of the goals and the main results of the experiment. If a known physical quantity was measured in the experiment then you should state the numerical value of the result that you obtained for that quantity and also state how close your result was to the expected result. It would be a good practice to write the abstract last, after you have written the remainder of the experiment. In a section entitled Description of Experiment (5) you should describe the purpose of the experiment, the physics principles that are studied, and the procedures that were employed to complete the experiment. It is not necessary (in fact it is undesirable) to give a step-by-step account of your activities in the experiment. Rather you should summarize the main techniques that you used to get to your final result. It may be helpful to include a sketch of the experimental geometry (6). This can be done by hand or can be cut and pasted into your report. You must have a section entitled Data and Analysis (7) in which you list and describe the raw experimental data collected during the experiment. Include any tables, graphs, results of best fits etc. as is appropriate. Describe how quantities were calculated from your raw data. If it is necessary to show a formula employed during the experiment then you may simply leave some space and write the equation in by hand as is shown by Equation 3 in the sample lab report. Finally, you should have a section entitled Results and Conclusions (8) in which you state the main result(s) of the experiment and compare your result(s) to the accepted or theoretical value(s) (if available) by computing a percent discrepancy. State what you consider to be the most likely causes of these discrepancies. If possible discuss these potential reasons for error quantitatively by calculating (or estimating) how much effect each source of uncertainty may have on the final result. An example of this type of reasoning is shown in the sample lab report at (9). Data Tables (10) may be incorporated inline into your lab report or may be placed at the end (as in the example) if it is more convenient. Data tables should be identified with a descriptive header. Each column should have a heading that describes the physical quantity that is recorded in the column. The column heading should also show the units of the physical quantity and the uncertainty in the quantity (if known). Numerical values recorded in the table should be rounded to the appropriate number of significant digits Graphs (11) may be incorporated inline into your lab report or may be placed at the end (as in the example) if it is more convenient. Graphs should be prepared on the computer. You should adhere to the following guidelines when preparing a graph. 1. Title – Every graph should have a title which identifies the graph by a number (i.e. Graph 1) along with some descriptive text that tells exactly what is plotted (i.e. Velocity vs. Time) and perhaps the purpose of the graph (i.e. Determination of Acceleration and Initial Velocity). 2. Axes and Axes Labels – Both axes should be labeled with descriptive text that tells the name of the physical quantity that is plotted on that axis and the units of that physical quantity (i.e. Velocity (cm/s)). Numerical values of the physical quantity should be printed at the major tick marks. 3. Size and Clarity – All graphs should be printed at a size that is sufficiently large so that the information can be easily read. Typically this means to make your graphs occupy most of the printed page. ChooseWKU University Physics LaboratoryI-3How to Write a Lab Reportaxes limits so that the region of interest occupies most of the graph. Choose font sizes that are sufficiently large to be easily readable. 4. Graph Modes – You should adjust the graph mode so that individual data points are shown with some form of marker or with dots. Data values should never be connected with a jagged line. Show relationships that represent the best fit to data using lines with no markers. 5. Annotation – Whenever a best fit is performed on a graph, the results of the fit should be clearly displayed on the graph. In the case of a linear fit one should show the values of the slope and the yintercept. Be sure to include also the associated uncertainties and units. It is a good idea to include a measure of the goodness of fit (either the chi-squared value or the linear correlation coefficient – both discussed later) on the graph. Also, if possible, describe the physical significance of the slope and intercept as is done in the graph above. Finally, be sure to place your name (and your partner’s names if appropriate) and the date on the graph. 6. Uncertainty Bars – Whenever the uncertainties of individual data values are known they should be represented on the graph with uncertainty bars (often called error bars) as is shown in the above graph. At the end of the laboratory report staple your DATA Sheets (12) that you used during the laboratory period to record important data and results. Here you should show an example of each calculation that is used throughout the experiment. You will want to write the equation that was used and then show the use of the equation with numerical values substituted into it. If you make a mistake then simply cross out the suspected error and write the correct result as is shown near (13).WKU University Physics LaboratoryI-4How to Write a Lab ReportNewton’s Second LawJoe StudentPartner: Sue StudentJanuary 27, 2000AbstractThe position of a system of two masses was recorded as a function of time using a spark-timer apparatus. Using these data the instantaneous velocity wasapproximated by calculating the average velocity over 1/30 second time intervals. The acceleration of the system, which was calculated from the slope of a graph of velocity versus time, was 59.1 ± 1.5 cm/s2. The value of the accelerationpredicted using Newton’s Second Law was 60.9 ± 0.1 cm/s2. The discrepancy between these two values for the acceleration of the mass was only 3%.WKU University Physics LaboratoryI-5Sample Lab ReportNewton’s Second LawDescription of Experiment In this experiment we verified Newton’s Second Law by measuring the acceleration of a system subject to a net external force. Newton’s second law states that the acceleration a of an object is directly proportional to the net force acting on the object and inversely proportional to the object’s mass m. Newton’s second law can be expressed as an equation usingFnet = m a.(1)The unbalanced force was supplied by a mass falling in the earth’s gravitational field as is shown in Figure 1. Mass M rested on a smooth horizontal air track and was attached to mass m by a light tape passing over a pulley. When the system was released M was pulled along the track by the force supplied by the suspended mass m. The air track and pulley had small openings through which jets of air were ejected to create a nearly frictionless surface. The two masses were connected by a very light recording tape on which marks are made every 1/60 second by a spark timer.Figure 1 –Geometry for Newton’s Second Law Experiment We ignored the friction in the pulley as well as the friction between the mass and the air track. Also, the mass of the string was assumed to be negligible. With these assumptions Newton’s second law wasWKU University Physics LaboratoryI-6Sample Lab Reportapplied to m and M. The resulting system of equations were solved to eliminate the tension in the string yieldinga=m g m+M(2)for the predicted value of the acceleration of this system. We measured the velocity of M by measuring the distance between marks on the tape and dividing by the time interval that occurred between the creation of the marks. A graph of velocity versus time was made. The slope of this linear graph was the constant acceleration of the system. This result was compared to the value predicted from Newton’s second law given by Equation 2. Data and Analysis The masses of the system shown in Figure 1 were determined to be m = 10.23 ± 0.02 g and M = 154.35 ± 0.02 g using a mechanical balance. The position of the marks on the spark tape were measured using a meter stick and recorded to the nearest 0.02 cm in Data Table I. This table also shows the velocity at each twelfth dot which was estimated using the formula for average velocity(3) where ∆xi is the displacement between previous and successive dots and ∆ti is the corresponding time (2/60 s = 1/30 s). The total elapsed time (ti) required for the mass to move from the zeroth dot to the ith dot was determined knowing that the dots were separated in time by 1/60 second. Results and Conclusion Graph I shows a plot of the velocity versus time. The slope of this graph is the experimental value of the acceleration of the system. Using a least-squares fitting package, the acceleration was found to be aexp = slope = (59.1 ± 1.5) cm/s2. The value of the acceleration predicted by substituting measured values of the masses and g = 980 cm/s2 into equation (2) was (60.9 ± 0.1) cm/s2. The percent discrepancy between the two values is only -3.0%.WKU University Physics LaboratoryI-7Sample Lab ReportThe good agreement between the measured value of the acceleration of the system and the value predicted by Newton’s provides justification for the validity of Newton’s second law. Much of the difference between the measured and predicted values of acceleration can be attributed to uncertainties in the measurements in the distance between dots. This measurement uncertainty is on the order of ±0.02 cm. The displacement is then, using worse case propagation of error, uncertain by an amount ±0.04 cm. The uncertainty in the velocity calculated from equation (6) is then ±1.2 cm/s. For a typical velocity measurement this uncertainty is on the order of 2% accounting for most of the discrepancy. Additional sources of uncertainty include incorrect location of dots on the paper because the sparks may not be always perpendicular to the tape and friction along the air track and in the pulley.WKU University Physics LaboratoryI-8Sample Lab ReportData Table IPosition and Velocity of Falling Mass as Function of TimeDot Number iTotal Time ti ( ?/60 sec)Total Time ti (sec)Position xi (cm) ± 0.02 cmDisplacement ∆xi (cm) ± 0.04 cmTime Change ∆ti (s)Velocity vi (cm/s) ± 1.2 cm/s11 12 13 23 24 25 35 36 37 47 48 49 59 60 61 71 72 7311/60 12/60 13/60 23/60 24/60 25/60 35/60 36/60 37/60 47/60 48/60 49/60 59/60 60/60 61/60 71/60 72/60 73/600.183 0.200 0.217 0.383 0.400 0.417 0.583 0.600 0.617 0.783 0.800 0.817 0.983 1.000 1.017 1.183 1.200 1.21715.78 16.39 17.02 24.33 25.16 26.00 35.26 36.28 37.30 48.52 49.76 51.03 64.25 65.61 67.04 82.22 83.82 85.45 3.23 2/60 96.9 2.79 2/60 83.7 2.51 2/60 75.3 2.04 2/60 61.2 1.67 2/60 50.1 1.24 2/60 37.2WKU University Physics LaboratoryI-9Sample Lab ReportWKU University Physics LaboratoryI-10Sample Lab ReportWKU University Physics LaboratoryI-11Sample Lab ReportWKU University Physics LaboratoryI-12Sample Lab Report。
A+干货之LabReport该怎么写?分享实验报告格式与写作秘诀

A+干货之Lab Report该怎么写?分享实验报告格式与写作秘诀今天我们来谈谈L a b R e p o r t、r e p o r t论文咋写。
R e p o r t有很多种:r e a d i n g r e p o r t,b u s i n e s s r e p o r t,c l a s s r e p o r t等等吧!而我们今天所说的是L a b R e p o r t。
之所以要讲讲它,是因为很多同学们经常咨询些这货(L a b R e p o r t)该咋整。
鉴于大家都比较感兴趣,今天以心理学实验报告为例,总结了一些规律经验,给大家分析一下L a b R e p o r t该怎么写?来来来,敲黑板,划重点啦!总的来说,标题页(T i t l e p a g e),摘要(a b s t r a c t),参考文献(R e f e r e n c e s),和附录(A p p e n d i c e s)都是要单独占页的,文本通常要两倍行距,字号设为12,页码也不要忘了哦!从你的标题页上必须要体现出来:你研究的是什么,你的自变量I V (I n d e p e n d e n t V a r i a b l e)和因变量D V(D e p e n d e n t V a r i a b l e)分别是啥,此外,这不应该以一个问题的形式给出虽然摘要在报告的开头部分,但是建议你最好最后再来写它。
A b s t r a c t(最好控制在一百五十个字左右哦)应该简明扼要给出以下几点:•研究的目的及理由;•参与者及计划安排;•实验方法;•主要的发现;•该研究的重要意义。
I n t r o d u c t i o n的目的就是解释你的假设的由来,你必须解释你的研究与其假设或者目的有啥关联。
要明白目的(p u r p o s e)和假设(h y p o t h e s i s)是不同的:目的(p u r p o s e)表明了你希望从实验中得到什么,而假设(h y p o t h e s i s)是你希望发生的事情。
怎样写实验报告
怎样撰写物理实验报告刘小廷物理实验除了使学生受到系统的科学实验方法和实验技能的训练外,通过书写实验报告,还要培养学生将来从事科学研究和工程技术开发的论文书写基础。
因此,实验报告是实验课学习的重要组成部分,希望同学们能认真对待。
正规的实验报告,应包含以下六个方面的内容:(1)实验目的;(2)实验原理;(3)实验仪器设备;(4)实验内容(简单步骤)及原始数据;(5)数据处理及结论;(6)结果的分析讨论。
现就物理实验报告的具体写作要点作一些介绍,供同学们参考。
一、实验目的不同的实验有不同的训练目的,通常如讲义所述。
但在具体实验过程中,有些内容未1曾进行,或改变了实验内容。
因此,不能完全照书本上抄,应按课堂要求并结合自己的体会来写。
如:实验4-2 金属杨氏弹性模量的测量实验目的1.掌握尺读望远镜的调节方法,能分析视差产生的原因并消除视差;2.掌握用光杠杆测量长度微小变化量的原理,正确选择长度测量工具;3.学会不同测量次数时的不确定度估算方法,分析各直接测量对实验结果影响大小;4.练习用逐差法和作图法处理数据。
二、实验原理实验原理是科学实验的基本依据。
实验设计是否合理,实验所依据的测量公式是否严密可靠,实验采用什么规格的仪器,要求精度如何?应在原理中交代清楚。
1.必须有简明扼要的语言文字叙述。
通2常教材可能过于详细,目的在便于学生阅读和理解。
书写报告时不能完全照书本上抄,应该用自己的语言进行归纳阐述。
文字务必清晰、通顺。
2.所用的公式及其来源,简要的推导过程。
3.为阐述原理而必要的原理图或实验装置示意图。
如图不止一张,应依次编号,安插在相应的文字附近。
如:实验3-3 滑线变阻器的分压与限流特性实验原理滑线变阻器在电路中的连接不同,可构成分压器和限流器。
1.分压特性研究实验电路如图1。
滑动头将滑线电阻r分成r和r两部分,r为负载电阻。
电路总电阻为12l3 re图2 分压特性曲线r?r2?r1rlr1?rl 故总电流为v为电源的端电压,不是电源的电动势e。
- 1、下载文档前请自行甄别文档内容的完整性,平台不提供额外的编辑、内容补充、找答案等附加服务。
- 2、"仅部分预览"的文档,不可在线预览部分如存在完整性等问题,可反馈申请退款(可完整预览的文档不适用该条件!)。
- 3、如文档侵犯您的权益,请联系客服反馈,我们会尽快为您处理(人工客服工作时间:9:00-18:30)。
order in which they made Describe any departures from procedure described in the lab manual, if any Describe any steps taken to reduce experimental uncertainty
Short Sections
摘要、引言、结论
Checklist
Summarize the entire paper in the abstract State the problem or question under investigation in the introduction Summarize the experimental procedure in the introduction Discuss quantitative results in both the abstract and conclusions
Short Sections
摘要、引言、结论
Checklist
Summarize the entire paper in the abstract State the problem or question under investigation in the introduction Summarize the experimental procedure in the introduction Discuss quantitative results in both the abstract and conclusions
How to Write a Lab Report By Anne Marie Helmenstine, Ph.D., Guide
何益鑫、张新夷 Franck-Hertz实验的物理过程 物理实验 2011年第6期
近代物理实验I 学生论文
关于实验报告的“三句半”
抄书抄讲义,浪费时间
by-step” about it. Avoid (1) a numbered list of steps, and (2) narratives like this: “first we did (whatever), but that didn’t work, so then we tried (something else) …” Refine your procedure to remove these false steps, and present it in enough detail so that the reader can clearly understand what you did. One detail you should definitely include is the number of times you repeated in any given measurement.
Checklist for a Procedure Section
Provide a sketch diagram of experimental setup Provide a list and/or descriptions of equipment Describe all any measurements, in roughly the
引言:光泵磁共振实验包括了原子物理中很 多的内容,其中用光抽运-磁共振-光探测技术, 对于原子、离子和 的研究有着非常重要的意 义,使我们更加深刻了对于微观粒子结构的 认识
Short Sections
摘要、引言、结论
Checklist
Summarize the entire paper in the abstract State the problem or question under investigation in the introduction Summarize the experimental procedure in the introduction Discuss quantitative results in both the abstract and conclusions
Lab Report 必须回答的问题
What did you do ?
Why did you do it ? How did you do it ?
What happened ?
Standard Format
Abstract
I. Introduction A.Motivation B.Summary of the experiment
order in which they made Describe any departures from procedure described in the lab manual, if any Describe any steps taken to reduce experimental uncertainty
The Procedure Section
A sketch of apparatus, or a list of equipment
A carefully hand-drawing sketch is usually better
Tell what you did with the equipment, but not be too “step-
Lab Report
Read your report over twice. 4 or 5 single-spaced typewritten pages of text, not
counting graphs. This means that few of the major sections will exceed one page in length, and some may be shorter.
Results
-- creative, but very careful, don’t allow yourself to indulge in empty speculation about an unexpected result -- avoid comments like: “Our results prove that the theory is correct.”
II. Theoretical background
III.Experimental design and procedure A. Description of the samples B. Description of the apparatus C. Description of the experimental procedure IV.Experimental results A. Row data B. Calculated data Results and discussion V.Discussion/Analysis A. Method of analysis B. Discussion of results C. (Optional) Suggestions for future improvements VI.Conclusions A. Summary of the results B. Pertinence of the results to the questions raised in the introduction Section
Provide a sketch diagram of experimental setup Provide a list and/or descriptions of equipment Describe all any measurements, in roughly the
Short Sections
摘要、引言、结论
Checklist
Summarize the entire paper in the abstract State the problem or question under investigation in the introduction Summarize the experimental procedure in the introduction Discuss quantitative results in both the abstract and conclusions
Short Sections
摘要、引言、结论
Checklist
Summarize the entire paper in the abstract State the problem or question under investigation in the introduction Summarize the experimental procedure in the introduction Discuss quantitative results in both the abstract and conclusions
There are some items you should leave out of a
lab report. Please don’t complain about the equipment.
Don’t editorialize about an experiment being a
如何写实验报告
How to Write a Lab Report
张新夷
物理楼243室 65643522 xy-zhang@
Acknowledgements
/~brune/phys371/how_to_write_a_lab_report.pdf