湖南统计年鉴2020社会经济发展指标:“大湘西地区”主要经济指标情况(2019年)
湖南统计年鉴2020社会经济发展指标:人口和自然资源
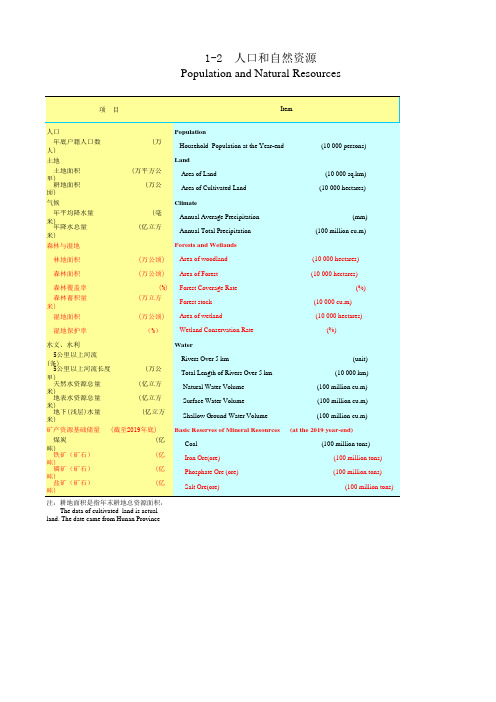
注:耕地面积是指年末耕地总资源面积, The data of cultivated land is actual
land. The date came from Hunan Province
(unit) (10 000 km) (100 million cu.m) (100 million cu.m) (100 million cu.m) (at the 2019 year-end) (100 million tons) (100 million tons) (100 million tons)
Land Area of Land Area of Cultivated Land
Climate Annual Average Precipitation Annual Total Precipitation
Forests and Wetlands
(10 000 persons)
(10 000 sq.km) (10 000 hectares)
煤炭
(亿
吨)
铁矿(矿石)
(亿
吨)
磷矿(矿石)
(亿
吨)
盐矿(矿石)
(亿
吨)
Water Rivers Over 5 km Total Length of Rivers Over 5 km Natural Water Volume Surface Water Volume Shallow Ground Water Volume
1-2 人口和自然资源 Population and Natural Resources
湖南统计年鉴2020社会经济发展指标:国民经济和社会发展速度指标(2)

135.3 115.2 145.8
124.5 134.8
107.4 116.1 111.3140.7
124.7 92.0
107.1
101.8 126.1 153.2
101.4
98.6 99.8
103.0
98.8 102.1 113.2
100.1 118.2 101.0
单位:% 指标
1-9 续表 2 continued
Item
邮电通信业 邮政业务总量 函件 报刊期发数 快递业务量 电信业务总量 固定电话用户数 移动电话用户数 固定互联网用户数 移动互联网用户数
国内商业 社会消费品零售总额
对外经济贸易和旅游 进出口总额 进口额 出口额 国际旅游 来湘旅游人数 旅游外汇收入
Finance and Insurance Total Saving Deposotit of F inancial Institutions Total Loan Balances of F inancial Institutions Premium Income from Property Insurance Premium Income from Life Insurance
Students Enrollment Institutions of Higher Education Specialized Secondary Schools Secondary Schools Primary Schools
State Fiscal on Education Science and Technology
128.9 85.5
104.6 133.4 266.8
95.9 110.9 124.3 106.2
湖南省2020年国民经济和社会发展计划主要指标及部门责任分工
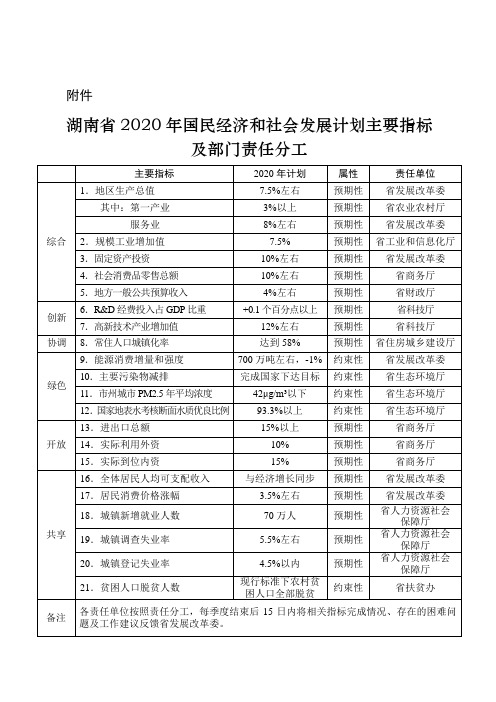
4.社会消费品零售总额
10%左右
预期性
省商务厅
5.地方一般公共预算收入
4%左右
预期性
省财政厅
创新
6.R&D经费投入占GDP比重
+0.1个百分点以上
预期性
省科技厅
7.高新技术产业增加值
12%左右
预期性
省科技厅
协调
8.常住人口城镇化率
达到58%
预期性
省住房城乡建设厅
绿色
9.能源消费增量和强度
附件
湖南省2020年国民经济和社会发展计划主要指标及部门责任分工
主要指标
2020年计划
属性
责任单位
综合
1.地区生产总值
7.5%左右
预期性
省发展改革委
其中:第一产业
3%以上
预期性
省农业农村厅
服务业
8%左右
预期性
省发展改革委
2.规模工业增加值
7.5%
预期性
省工业和信息化厅
3.固定资产投资
10%左右
预期性
预期性
省商务厅
15.实际到位内资
15%
预期性
省商务厅
共享
16.全体居民人均可支配收入
与经济增长同步
预期性
省发展改革委
17.居民消费价格涨幅
3.5%左右
预期性
省发展改革委
18.城镇新增就业人数
70万人
预期性
省人力资源社会
保障厅
19.城镇调查失业率
5.5%左右
预期性
省人力资源社会
保障厅
20.城镇登记失业率
700万吨左右,-1%
约束性
湖南近20年经济发展情况
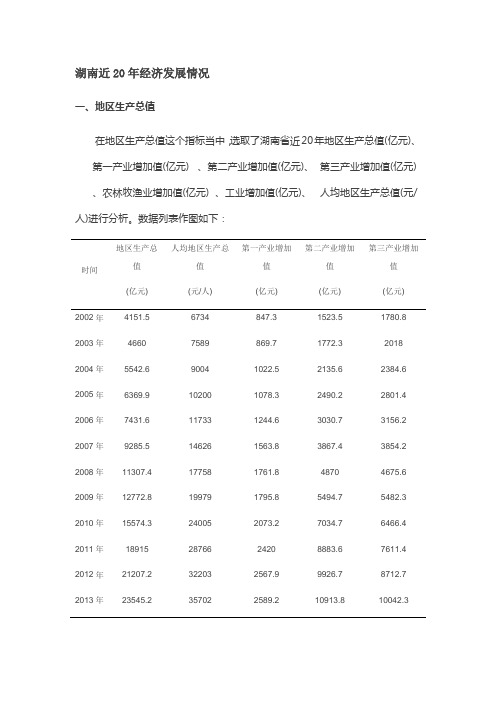
湖南近20年经济发展情况一、地区生产总值在地区生产总值这个指标当中,选取了湖南省近20年地区生产总值(亿元)、第一产业增加值(亿元) 、第二产业增加值(亿元)、第三产业增加值(亿元)、农林牧渔业增加值(亿元) 、工业增加值(亿元)、人均地区生产总值(元/人)进行分析。
数据列表作图如下:时间地区生产总值(亿元)人均地区生产总值(元/人)第一产业增加值(亿元)第二产业增加值(亿元)第三产业增加值(亿元)2002年4151.5 6734 847.3 1523.5 1780.8 2003年4660 7589 869.7 1772.3 2018 2004年5542.6 9004 1022.5 2135.6 2384.6 2005年6369.9 10200 1078.3 2490.2 2801.4 2006年7431.6 11733 1244.6 3030.7 3156.2 2007年9285.5 14626 1563.8 3867.4 3854.2 2008年11307.4 17758 1761.8 4870 4675.6 2009年12772.8 19979 1795.8 5494.7 5482.3 2010年15574.3 24005 2073.2 7034.7 6466.4 2011年18915 28766 2420 8883.6 7611.4 2012年21207.2 32203 2567.9 9926.7 8712.7 2013年23545.2 35702 2589.2 10913.8 10042.32014年25881.3 39181 2671 11825.1 11385.2 2015年28538.6 43155 2747.9 12665.7 13125 2016年30853.5 46606 2915.6 12942 14995.9 2017年33828.1 51030 2998.4 13459.8 17369.9 2018年36329.7 54763 3084.2 13904.1 19341.4 2019年39894.1 60104 3647.2 15401.7 20845.2 2020年41542.6 62537 4240.7 15949.2 21352.7 2021年46063.1 69440 4322.9 18126.1 23614.1湖南省近20年地区生产总值持续上升,人均生产总值也是持续上升的状态。
湖南统计年鉴2020社会经济发展指标:亿元以上商品交易市场基本情况(2019年)

农业生产用具市场 Agricultural production appliance market农用生产资料市场 Agricultural Production Markets木材市场 Wood Markets建材市场 Building Material Markets化工材料及制品市场 Chemical Materials and Products Markets金属材料市场 Metal Materials Markets机械设备市场 Mechanical Equipments Markets其他生产资料市场 Others农产品市场 Farm Produce Markets粮油市场 Grain and Oil Markets肉禽蛋市场 Meat, Poultry and Eggs Markets水产品市场 Aquatic Products Markets蔬菜市场 Vegetables Markets干鲜果品市场 Dried and Fresh Melons and Fruits Markets其他农产品市场 Others食品、饮料及烟酒市场 Food, Beverages, Tobacco and Liquor Markets食品饮料市场 Food and Beverages Markets茶叶市场 Tea market烟酒市场 Tobacco and Liquor Markets其他食品饮料及烟酒市场 Others纺织、服装、鞋帽市场 Textiles, Clothing, Shoes and Hats Markets布料及纺织品市场 Cloth and Textiles Markets服装市场 Clothing Markets鞋帽市场 Shoes and Hats Markets其他纺织服装鞋帽市场 Others日用品及文化用品市场 Daily Use Articles and Cultural Goods Markets文具市场 Stationary Markets图书、报刊杂志市场 Books, Newspapers and Magazines Markets音像制品及电子出版物市场 Video Products and E-journal Markets其他日用品及文化用品市场 Others黄金、珠宝、玉器等首饰市场 Gold, jewelry, jade and other jewelry markets电器、通讯器材、电子设备市场 Electrical Appliances, Communication Appl- iances andElectronical Appliances Markets家电市场 Household Appliances Markets通讯器材市场 Communication Appliances Markets计算机及辅助设备市场 Computer and Auxillary Equipments Markets其他电器、通讯器材、电子设备 Others医疗、医疗用品及器材市场 Medicine, Medical Materials and Medical Instruments Markets 中药材市场 Chinese Medicine Market家具、五金及装饰材料市场 Furniture, Hardware and Decoration Materials Markets家具市场 Furniture Markets装饰材料市场 Decoration Materials Markets五金材料市场 Hardware Materials Markets其他装修市场 Others汽车、摩托车及零配件市场 Cars, Motorcycles and Spare Parts Markets汽车市场 Cars Markets摩托车市场 Motocycles Markets机动车零配件市场 Vehicle Spare Parts Markts花、鸟、鱼、虫市场 Flower, Bird, Fish and Insects Markets花卉市场 Flower Markets其他专业市场 Other professional markets按营业状态分组By Operating Status常年营业 Perennial Operation季节性营业 Seasonal Operation其他 Others按经营方式分组By Operating Mode以批发为主 Whole Sale以零售为主 Retail2570154 14237 1550519 22199718917 31409917 427602570 417271721 2670659 401785715301 3746712 622341224 435913576 836893584 720741221 1255234984 941033177 322261443 1205194 2624613 31048927 312515820882 1280258 251825014825 2910685 357185114 4718634 16560 1420415 1163101 17058 15050 1443893345 814531326 1450146 418061246 1680627 217861747 217861747 321488213578 711911123 1799658876 631953068 2531511 730212603 31295903 1127127 315991573 1458458 1458458 1348348 300204850168687 2551346 11074795 15411674192182 149897347764610.809.622.90 5.106.50 1.96 125.6081.468.2933.56 27.69570.815.4244.273.41 3.29 67.19737.774.0456.083.7710.16 21.17550.38 15.6254.20 11.5829.00 11.0137.96 10.9150.254.2412.971.56 1.201.98 6.323.1429.77 75.42174.101.20 5.22 59.04115.372.80 4.37 12.3849.143.4825.211.302.651.3218.240.65 3.220.21 1.102.0047.16 20.3175.00 10.5849.550.13 1.268.4018.871.20 5.33 47.7783.07 47.7783.07 177.49279.89 16.2010.93 93.75186.74 55.0277.06 12.52 5.16 80.59245.80 77.85233.600.28 2.672.469.53 11.0025.21 11.0025.210.88 3.40 1105.174331.361.742.471.90 5.25 741.983428.12 366.82910.96。
湖南统计年鉴2020社会经济发展指标:按全省人口平均的主要产品产量

( kg / person)
化学农药原药
(公斤/人) Chemical Pesticide
( kg / person)
初级形态塑料
(公斤/人) Primary Plastics
( kg / person)
合成橡胶
(公斤/人) Synthetic Rubber
( kg/person)
汽车
(辆/万人) Motor Vehicles
( kg / person)
发电量
(千瓦小时/人) Electricity
(kwh / person)
生铁
(公斤/人) Pig Iron
( kg / person)
粗钢
(公斤/人) Crude Steel
( kg / person)
钢材
(公斤/人) Steel
( kg / person)
水泥
(吨/人) Cement
25.75
24.80
1.99
6.41
4.31
4.71
3.19
10.37
11.18
8.44
25.49 23.14
7.80
9.16
21.60
47.05
10.25
7.60
17.21 41.75
5.75
6.18
4.20
5.30
4.93
1.42
0.70
1.86
1.04
0.53
3.52
6.81
8.77
8.25
ቤተ መጻሕፍቲ ባይዱ
1.50
(米/人) Cloth
(m / person)
针棉织品(折用纱量) (公斤/人) Cotton Knitwear
湖南统计年鉴2020社会经济发展指标:湖南省级及以上产业园区基本情况(2019年)
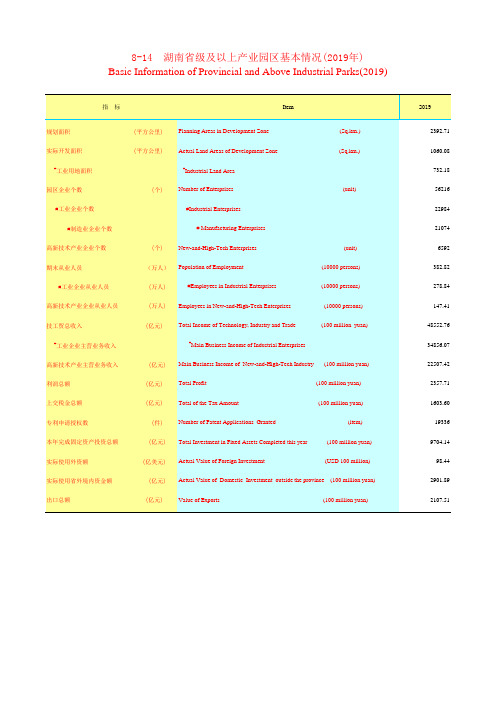
(10000 persons)
高新技术产业企业从业人员
(万人) Employees in New-and-High-Tech Enterprises
(10000 persons)
技工贸总收入
(亿元)
Total Income of Technology, Industry and Trade
(100 million yuan)
8-14 湖南省级及以上产业园区基本情况(2019年) Basic Information of Provincial and Above Industrial Parks(2019)
指标
Item
规划面积
(平方公里)
Planning Areas in Development Zone
(Sq.km.)
实际开发面积
(平方公里)
Actual Land Areas of Development Zone
(Sq.km.)
#工业用地面积
#Industrial Land Area
园区企业个数
(个) Number of Enterprises
(unit)
#工业企业个数
#Industrial Enterprises
(100 million yuan)
实际使用外资额
(亿美元) Actual Value of Foreign Investment
(USD 100 milBiblioteka ion)实际使用省外境内资金额
(亿元) Actual Value of Domestic Investment outside the province (100 million yuan)
出口总额
湖南统计年鉴2020社会经济发展指标:各市州规模以上工业主要经济指标(2019年)(3)

(%)
8.48
4.26
7.87
7.46
4.20
34.13 300.45
资产总计
Total Assets
977.99 2248.42 2153.42 116.88 1155.63
流动负债合计
Total Liquid Liabilities
256.26 673.02 776.30
37.99 434.20
负债合计
Total Liabilities
424.71 893.25 1003.69
1778.15 4503.67 2282.10
86.95 2212.72
营业税金及附加
Tax and Extra Charges of Main Bussiness
15.17 201.99 360.16
0.79
18.43
管理费用
Administrative Expense
88.87 273.46 118.59
168.76 216.99 204.75
7.53 101.68
本年应付职工薪酬
Total Wages Payable of the Year
154.33 372.81 177.12
8.41 166.99
总资产贡献率
(%) Ratio of Total Assets to Output Value
(%)
平均人数
(万人)
(10 000 persons)
23.47
35.63
21.19
1.46
19.11
流动资产
Liquid Assets
320.03 733.91 1225.72
40.82 455.31
湖南统计年鉴2020社会经济发展指标:国民经济和社会发展总量指标(2)

金融机构人民币贷款余额
Total Loan Balances of F inancial Institutions
财产险保费收入
Premium Income from Property Insurance
人身险保费收入
Premium Income from Life Insurance
教育、科技、文化
32.03 8358.00
718.00
325.24 1076.96 3259.76
248.24 2173.16
540.29 78932.57
2477.10 646.77
6302.89 1635.32 5226.59
1359.79 5664.27 15134.27
25.13 8.60
16.53
146.89 67.34 79.55
对外经济贸易和旅游
Foreign Trade and Tourism
进出口总额
(亿美元)
Total Exports and Imports
(USD 100 million)
进口额
Imports
出口额
Exports
国际旅游
International Tourism
来湘旅游人数 (万人次)
Tourism to Hunan
Education, Science and Technology, Culture
教育
Education
专任教师数
(万人)
Full-time Teachers
(10 000 persons)
普通高等学校
Institutions of Higher Education
中等职业学校
- 1、下载文档前请自行甄别文档内容的完整性,平台不提供额外的编辑、内容补充、找答案等附加服务。
- 2、"仅部分预览"的文档,不可在线预览部分如存在完整性等问题,可反馈申请退款(可完整预览的文档不适用该条件!)。
- 3、如文档侵犯您的权益,请联系客服反馈,我们会尽快为您处理(人工客服工作时间:9:00-18:30)。
(亿元)
(100 million yuan)
422.29
13.4
社会消费品零售总额 (亿元) Total Retail Sales of Consumer Goods
(100 million yuan)
3017.14
10.2
进出口总额
(万美元) Total Exports and Imports
(USD 10 000)
28951
8.7
农村居民人均可支配收入 (元) Disposable Income of Rural Households (yuan)
11828
10.3
农林牧渔业总产值
(亿元) Gross Output Value of Farming, Forestry, Animal,Husbandry
1535.93
16.9 12.5 23.8
24.2 22.2 19.0 18.1
9.6 10.7
6.5 17.5 13.6
2041.45
-0.2
生产总值
(亿元) Gross Domestic Products
(100 million yuan)
6667.51
7.9
第一产业增加值
Primary Industry
914.59
3.4
第二产业增加值
Secondary Industry
1956.18
7.4
第三产业增加值
Tertiary Industry
(100 million yuan)
9148.49
4.2
金融机构人民币贷款余额(亿元) Loans in Financial Organizations
(100 million yuan)
5723.73
15.5
)
占全省比重 Percentage
(%) 29.5 16.5 25.0 12.8 17.6
一般公共预算支出
(亿元)
General Public Budget Expenditure yuan)
(100 million
全体居民可支配收入 (元) Disposable Income
(yuan)
376.75
8.1
1911.98
5.2
19061
10.3
城镇居民人均可支配收入 (元) Disposable Income of Urban Households (yuan)
3.3
and Fishery
(100 million yuan)
规模以上工业企业单位数 (个) Number of industrial enterprises above Designated Size
(unit)
3674
7.9
规模以上工业企业利润总额
Total Profits of industrial Enterprises above Designated Size
20-4 “大湘西地区”主要经济指标情况(2019年) Main Economic Indicators of "West Hunan"(2019)
指标
绝对值 比上年增长
Item
Value Increase over
2018(%)
常住人口
(万人) Resident Population
(10 000 persons)
3796.74
9.2
人均地区生产总值
(元) Per Capita Gross Regional Product
(yuan)
32617
7.9
固定资产投资
(亿元) Fixed Assets Investment
(100 million yuan)
8.5
地方一般公共预算收入 (亿元) General Public Budget Revenue (100 million yuan)
606665
418
49.9
实际利用外资
(万美元) Foreign Direct Investment Actually Used
(USD 10 000)
117212
13.5
金融机构人民币存款余额(亿元) Deposits in Financial Organizations