基于LabVIEW的虚拟双踪示波器的设计
【完美升级版】基于LabVIEW的虚拟示波器的设计_毕业论文设计
基于LabVIEW的虚拟示波器的设计毕业论文摘要虚拟仪器是现代测量技术和计算机技术相结合的产物,标志着自动测试与电子测试仪器领域技术发展的一个崭新方向.随着信息技术和计算机技术的高速发展,数字信号处理作为一门新兴的学科,其重要性日益在各个领域的应用中体现出来。
本文介绍了利用LabVIEW 图形编程语言进行虚拟仪器开发的方法,设计了一种基于PC机声卡的虚拟示波器,说明了虚拟仪器在现代测试领域中的重要地位以及其广阔的发展前景.从某种意义上说,“软件就是仪器”。
关键词LabVIEW,虚拟仪器,示波器The design of virtual wave displayer based onLabVIEWAbstractVirtual instrument is the produce that merges the computer technology and measurement technique.It stands for a brand new development directory in the field of auto-measurement and electronic measurement。
With the rapid development of information technology and the computer technology, the digital signal processing takes an emerging discipline, its importance displays day by day in each domain application. This article introduces how to develop virtual instruments using graph programming language-LabVIEW ,designs a virtual signal displayer based on PC and explains the important part and wide development prospects of virtual instrument in modern measurement technique field.In a sense, “The sof tware is an instrument”.Keywords LabVIEW, virtual instrument目录第1章绪论 (1)1.1 虚拟仪器的概述 (1)1.1.1 什么是虚拟仪器 (1)1.1.2 虚拟仪器的构成 (2)1.1.3 虚拟仪器的优点 (3)1.1.4 虚拟仪器的发展现状 (4)1.1.5 虚拟仪器的发展趋势 (4)1.2 图形化编程语言LabVIEW (4)1.2.1 什么是LabVIEW (5)1.2.2 LabVIEW的主要特点 (5)1.2.3 LabVIEW调试与运行 (6)第2章示波器的原理 (7)2.1 模拟示波器 (7)2.1.1 示波器的基本结构 (7)2.1.2 示波器的扫描原理 (8)2.2 数字示波器 (9)2.2.1 数字示波器的基本原理 (9)2.2.2 数字示波器的特点 (11)2.3 虚拟示波器 (12)第3章系统的硬件设计 (14)3.1 声卡 (14)3.1.1 声卡的工作原理 (14)3.1.2 声卡的基本结构 (14)3.2 硬件设置 (16)3.2.1 实验中声卡的参数设置 (16)3.2.2 虚拟示波器中声卡的连接方式 (16)3.3 前置运算电路 (17)第4章系统的软件设计 (18)4.1 虚拟示波器工作流程图 (18)4.2 数据采集模块 (18)4.3 频谱分析模块 (22)4.4 数据测量和显示模块 (23)第5章系统调试与程序显示 (25)5.1 虚拟示波器性能 (25)5.1.1 程序设计思路 (25)5.1.2 虚拟示波器操作界面 (25)5.1.3 虚拟示波器总程序框图 (26)5.2 虚拟示波器波形显示 (27)结论 (30)致谢 (31)参考文献 (32)附录 (34)第1章绪论1.1虚拟仪器的概述虚拟仪器是计算机技术和传统的仪器仪表技术相结合的产物,它是在以计算机为核心的硬件平台上,由用户设计和定义其功能,具有虚拟面板. 虚拟仪器技术具有高效、易用、开放、灵活、更新快、功能强大、性价比高、用户定义等诸多优点. 目前在我国应用的虚拟仪器开发平台主要有美国NI公司的LabVIEW及其相应组件和Agilent公司的HP - VEE ,其中NI的LabVIEW系列产品在我国使用比较广泛.LabVIEW是当前用于数据采集、信号处理和虚拟仪器开发的一个标准工具,而且是一个基于图形化编程语言的虚拟仪器软件开发工具,设计者可利用它方便快捷地建立自己的虚拟仪器程序而无需复杂的程序代码编写. 它适用于多种操作系统,用LabVIEW设计的虚拟仪器程序可以脱离LabVIEW开发环境,最终用户看见的是和实际的硬件仪器相似的操作面板1.1.1什么是虚拟仪器所谓虚拟仪器,就是在通用计算机为核心的硬件平台上,由用户设计定义、具有虚拟面板、测试功能由测试软件实现的一种计算机仪器系统。
基于LabVIEW的虚拟双踪示波器的设计外文翻译

基于LabVIEW的虚拟双踪示波器的设计外文翻译外文文献A DAQ card based mixed signal virtual oscmoscopeAbstractComplex signals find many applications in SONAR, RADAR,Echo Location Systems and for studying the resonant frequencies. Digital StorageOscilloscopcs(DSO) is used these days for acquisition and display of routine signals. This instrument, found in every measurement laboratory, though potent in displaying simple periodic waveforms like sinusoids fails when frequency-varying time signals are applied, This problem surfaces because the underlying technique of oscilloscope used to trigger the waveform does not acquiesce with complex signals like chirp. Ready solution to this problem is the mixed signal oscilloscope. This is a costly solution and small laboratories cannot afford to have the costly instruments. In this paper, a cost effective DAQ card based mixed signal virtual 0scilloscope is proposed to study the complex signals. An intelligent technique, Weighted Hamming Distance (WHD) algorithm was used to accurately trigger the complex waveforms. Also for frequency domain analysis, Joint Time Frequency Analysis(JTFA) techniques were used. A LabVlEW'TM based virtual instrument was designed and developed with a capability to acquire, display and analyze the triggered signal. The integrated programming language LabVIEWTM was chosen as it offers many simple ready to use functions. In a way the proposal offers a cost effective, fast and flexible solution to treat the complex signals. The need to createsuch solutions is the consequence of costly hardware systems. The deficiency of conventional hardware. Scheme for the virtual oscilloscope for complex signals with some real time experimental results are presented in this work.Kevywords: Virtual instrumentation,Chirp signal,Data acquisition,Triggering, Complex signals, JTFA1.IntroductionFor the last two decades there has been a tremendous progress in computer technology. Measurement domain is no longer left unaffected. The way measurements are being done is totally revolutionized. Computer based measurement or say virtual instrumentation is gradually replacing the costly bench 1top instrumentation as it offers flexible,fast and cost effective solutions. Various classical instrumentation systems namely Oscilloscope, Multimeters and Spectrum analyzers ect. are almost phased out by their counter part virtual instrumentation. Our research extends the trend and demonstrates the developmen of the computer based mixed signal digital oscilloscope.Conventional signals such as the sinusoids have a constant frequency and the amplitede only varies with time throughout the signal definition. On the other hand, complex signals can be defined in this context as signals in which all the parameters vary. Fig.1 shows a typical complex signal i.e. Linear Chirp.Variation of amplitude and frequency with time can easily be understood by having a look at the signal. This requires a visually stable display of signal. The complex signal offers challenges f'or acquisition, display an analysis. Even the conventional modernage DSO is not capable of displaying and analyzing complex signals because these instruments employ simple triggering technique like level trigger. The conventional technnique of voltage trigger apparently fails when complex signals like chirp are analyzed on DSO. This is due to the very fact that these instruments consider chirp as a conventional sine wave and trigger for each cycle of the sine wave instead of triggering for the complete chirp cycle. This analysis of the chirp signal as several sine waveforms of different frequencies leads the DSO to display them as sinusoids in quick succession. As this rapid change occues at a very high rate and because of human eye not registering events occurring faster than 1/20th of a second the display appears as several overlapped sine waves. In the recent work[1], a new triggering technique was proposed for the complex signals based on WHD. Subsequent sections present the solution to the problem. For analysis of the complex signals in frequency domain JFFA technique is utilized and implemented[2-6].DSO uses the level trigger to display the waveform applied to it. This leads to trigger interval and the number of samples for this trigger interval is computed and these numbers of samples are display. The DSO considers the interval as the fundamental time period of the whole waveform and thus takes tbat much samples from its buffer and starts displaying it in quick succession. With simple waveform like a sine wave, level trigger can achieve stable display because trigger interval contains same number of cycles. This is shown in Fig. 2a.23Now for the complex signal as shown in Fig.2b, leveltriggering produces a trigger interval having variable number of cycles for the same number ofsamples/time resulting in a visually unstable display.The actual trigger interval should be one complete cycle for a chirp signal as indicated in Fig. 2c. Having done this the repeated chirp signal for this time duration will be displayed without any overlapping components as long as the entire time period is displayed.To observe the shortcomings experimentally in display of complex signals on the oscilloscope T ektronix dual channel signal generator AFG-3022 (250 MS/s, 25 MHz) was used to generate a chirp signal by choosing the sweep mode to sine waveform with its frequency varying linearly with respect to time. This signal was fed to TektronixTDS-2022 (2 GS/s, 200MHz) dual-channel DSO. The overlapping display as shown in Fig. 3 was observed.2. Intelligent method of triggeringAccurate triggering lies solely on correct identification of the time period of waveform under consideration. For this purpose, pattern recognition scheme was implemented to identify the pattern in the signal [1] and thus obtain the time period of one complete cycle of the chirp. First, a fixed number of samples N are taken as reference pattern. Then the signal is shifted by one sample to form the test pattern. This pattern is then tested for its closeness' to the reference pattern. Closeness' can be defined as the distance by which test pattern is away from reference pattern.WHD is used as the decision function for closeness. Hamming distance is defined for two binary vectors as the number of different' bits are given their vectors. InWHD the different bits are given their binary weightingaccording to the bit position45and their weights according to the bit position and their weights are summed up. WHD of two binary n bit number x and a is given byIf X and A are two binary vectors of n-bits element, then WHD for these two vectorsis computed by summing up the element by element WHD and is given byFor a vector of dimension N, the samples are shifted N times and its closeness is computed at each shift.When these computations are done, the difference 洫in the signals is found to be minimum (ideally zero when no noise) when the cycle repeated itself. Following are the major steps involved and implemented for intelligent trigger mechanism.1. Acquiring the long enough signal using DAQ card and to convert the decimal values of samples into binary form.2.A fixed number(N) of binary samples are stored in array. The stored samples are shifted by a fixedc number of samples, n (=1,inthis case).3. The original saved samples and the shifted samples are XORed bit-by-bit.The result is then multiplied by a factor of 2, where I represent the position of bit.4.The summation of all the resulting values gives the WHD for nth shifts.65.A plot of WHD vs. n is made and the minimum is calculated by peak detection method. The difference between two successive minima is the trigger interval in number of samples.6. The number of samples multiplied by the sampling rate results in trigger interval (in seconds).As a test case WHD algorithm is implemented for the following triangular waveforrn in Fig.4.The waveform is sampled at 8 points per eycle. Each sampled value is 3 bit length.The step by step implementation is given below.WHD waveforrn is plotted using WHD(1), WHD(2), …, WHD(8), and the location of the minima gives the triggering interval. Fig.5 shows the WHD waveform also clearly indicating the trigger interval at 8th sample.The WHD VI(Fig.6) was developed for this task. It takes the waveform, whose triggering interval is to be found, and the no of samples, on which computation is to be done, as input and outputs the sample at which minima occurs along with the value of minima and the WHD waveform. For typical chirp signal WHD waveformis obtained as shown in Fig.7. The number of samples between two consecutive minima is equal to the number of samples in one cycle of the waveform. The product of the number of samples with the sampling interval is the triggering interval of the input signal. Thus, the virtual instrument could also display complex waveformswith considerable aese. Fig.7 shows triggering interval of 5 cycles.3. Frequency domain analysisFor simple signals the frequency analysis is performed by traditional tools like FFT. For such signals the Fourier Transform works well as their frequency components remain constant throughout the signal existence and hence there is no need forthe time-frequency relationship. In case of complex signals the frequency varies with time. FFT fails to analyze these signals as it gives information about thefrequency and its amplitude. Time information is lost.78In order to overcome this difficulty, there are JTFA tools iike Short TimeFourier Transform(STFT) and Wavelet Transform. These are implemented for the signals under consideration.The STFT is a modified form of Fourier Transform. In this technique the signal is rnultiplied with a window function and their product's Fourier Transform (2).The main principle behind this technique is that the window function(w) breaks down the signal into segments of small finite durtion. The frequency component of the signal during this segment is assumed to be constant. By computing the Fourier Transform for this segment the frequency vs. amplitude information is obtained. Then the window is moved to another segment by a step having the same duration as the previous one giving the frequency component for that segment. Thus the frequency for different time intervals gives time-frequency relationship.However, there is a disadvantage with this tecnique. The size of the window function used is fixed, thus STFT will have same resolution for low and high frequencies. Resolution is the certainty by which one can determine time or9frequency information. It is generally seen that a larger window leads to better frequency resolution and a small windowleads to better time resolution. Thus, it depends upon the user whether he wants frequency or time resolution. Even if there is a need for change of resolution, the user has to do the same manually.To overcome the resolution problern, a more advanced technique called Wavelet Transform is used these days. In this the window size can be altered, using a scalingparameter a. The equation for Wavelet Transform is given as wherea is the scaling parameter,b is the translation parameter,x(t) is the signal to beanalyzed andis the wavelet functionThe wavelet function <(t) is known as the mother wavelet .Its scaled and time shifted versions are known as the daughter wavelets. These daughter wavelets having varying size offer different frequency and time resolutions at different frequencies. The scale parameter a represents the freequency component in an inverse relation. Thus the valuc of scale is inversely proportional to frequency component.Initially the wavelet function has scale a=1 and is placed at the starting of the signal. The wavelet transform and thus the frequency component of that segment. Then the wavelet function is moved by b steps and the wavelet transform is computed for that segment. This procecdure is continued till the end of the signal. Thus Wavelet transform for a=1 and all the time steps till the end of signal getscomputed. Similarly the wavelet function is again placed at the start of the signal but with changed value of scale a. Theprocedure is continued till the Wavelet transform for each scale and time step combination has been computed.It can be observed that the computation of Wavelet Transform leads to a lot of redundancy.To reduce the redundancy, the scale values and the time steps can be linked using dyadic sampling. a= 2" and b=k 2' where n and k are integers. This leads to reduction in redundancy. This is called Discrete Wavelet Transform(DWT).4. ImplementationA DAQ card based virtual instrument was designed and developed inLabVIEW TM programming environment. This virtual instrument has the capability to generate intelligent software trigger as described above for complex waveforms like chirp. The main decisionns during design of the virtual instrument are: choosing the data acquisition card and, what is equally important, choosing the set of features the instrument should offer. The choice of the data acquistion card has a great influence on the efficiency of the whole instrument[7,8].Particular DAQ cards are differentiated by price and, the specification it offers.A low cost NIPCI-6035E, 16bit, 200KS/s card was chosen. The hardware was programmed at maximum sampling rate. A separate problem is designing software, which, in that case, is the main part of instrument design phase. The major features of the developed virtual instrument are:The capability to acquire and process simple and complex waveforms.Dual channel mode: The instrument is capable of displaying two inputs simultaneously and can perform simple mathoperations between the two.Auto set: Runs the WHD code to re-compute the trigger interval for the new signal and thus achieve a stable display. In case, the two inputs do not have the same frequency, the LCM of the trigger intervals of A and B is found to so that integral number of cycles of both the channels can be shown simultaneously.Time domain measurements: The signal being displayed in time domain are measured on various parameters-Amplitude-Peak to peak-Mean(DC)-RMS101112Fig. 9. The results of wavelet transrorm implemented in the virtual instrument. (Channel A analyzing sine signal and Channel B analyzing a chirp signal). Frequency Domain Aalysis: The plot of Magnitude vs. frequency, Phase vs. frequency and the facility to choose the windowing function.STFT based Joint Time Frequency Analysis (JTFA): The spectrogram with the additional choices of the plotting the graph with scale in decibels, windowing functions and the window length for STFT analysis.Wavelet based Joint Time Frequency Analysis(JTFA):The scalogram which plots scales vs. time steps, choice of time-frequency sampling parameters like time steps and scales and the choice of wavelet functions.For the frequency domain analysis, DSP toolkit available withLabVIEW softwarewas utilized. Standard functions are available in the toolkit. The virtual instrument thus developed is intelligent as it takes different actions with different signals contrary to a digital storage oscilloscope. Trigger implemented enables us to obtian the correct value of the time period and a stable display. Analysis of complex signals can also be performed using this instrument. Fig.8 shows the front Panel of the virtual instrument showing Time-domain measurements. Fig.9 shows the time frequency relationship on both the channel B analyses the chirp signal. As seen clearly the chirp signal shows the varying frequency with time.5. Limitations of developed virtual instrumentSamples for few cycles are required to determin the triggering interval. One need to optimize tbe appropriate sampling rate and the number of samples to be processed. The processing time taken by the WHD technique is directly proportional to the number of samples and hence to the sampling rate as the higher sampling rate leadsto the more number of samples per cycle. The time required to compute trigger also depends upon the speed of the computing system. For large amount of data (if high sampling rates us fixed), computationally heavy WHD algorithm and other features for more analysis, the butter might overflow leading to loss of data. Every time the input waveform is changed user has to do retriggering.6. Conclusion and discussionSuccessful development of the virtual instrument with the capability of acquiring, displaying and analyzing complex signals is done. The instrument over comes the shortcomings of theDSOs, found commonly in laboratories, in achieving stable display for complex signals. The developd instrument is cost effective and flexible in nature and had the large number of features to choose from. The computer towards the measurement systems. The VI developed is expected to go a long way in the instrumentation area.1314 基于混合信号的数据采集卡的虚拟示波器摘要:复杂的信号在声纳、雷达、回声定位系统和谐振频率的研究中有多种应用。
「基于LABVIEW的虚拟示波器设计—虚拟示波器」

「基于LABVIEW的虚拟示波器设计—虚拟示波器」虚拟示波器是一种通过计算机软件来模拟传统示波器的工作原理和功能的设备。
它可以用于信号的检测和分析,具有方便、灵活、实时性强等优点。
本文将介绍基于LABVIEW的虚拟示波器设计。
LABVIEW是由美国国家仪器公司(National Instruments)开发的一种基于图形化编程的开发环境。
它可以实现快速的数据采集和处理,适用于各种工程应用。
借助LABVIEW的强大功能,我们可以设计出一个功能完善的虚拟示波器。
首先,我们需要从外部设备中获取信号。
LABVIEW支持多种类型的数据采集设备,如数据采集卡、传感器等。
我们可以通过连接这些设备,将信号输入到LABVIEW中。
LABVIEW提供了丰富的数据采集和处理函数,能够方便地获取并处理输入信号。
接着,我们需要设计一个用户界面,用于显示信号和调节示波器的各个参数。
LABVIEW中提供了多种界面控件,如图表、调节器等。
我们可以根据需要,在用户界面中添加这些控件,并设置相应的属性。
通过LABVIEW的可视化编程方式,我们可以直观地完成用户界面的设计。
在信号显示方面,虚拟示波器需要能够实时地显示输入信号的波形。
LABVIEW提供了图表控件,可以用于显示波形图。
我们可以将获取到的信号数据传递给图表控件,然后设置相应的显示参数,如坐标轴范围、背景颜色等。
这样,用户就能够清晰地看到输入信号的变化。
除了实时显示信号波形外,虚拟示波器还应具备其他功能,如调节触发电平、选择触发方式等。
LABVIEW中提供了丰富的函数库,可以方便地实现这些功能。
我们可以通过在用户界面中添加调节器、开关等控件,并将其与相应的函数进行关联,从而实现示波器的各个参数的调节。
总之,基于LABVIEW的虚拟示波器设计具有很大的灵活性和可扩展性。
我们可以根据需求进行定制,实现更多功能,如频谱分析、数据存储等。
同时,LABVIEW提供了强大的数据处理和可视化功能,能够让我们更加方便地进行数据分析和结果展示。
LabView双踪示波器设计

双踪信号发生器
设计思路:
信号发生器是一种能提供各种频率、波形和输出电平电信号的设备。
在测量各种电信系统或电信设备的振幅特性、频率特性、传输特性及其它电参数时,以及测量元器件的特性与参数时,用作测试的信号源或激励源。
1)总体设计思路
在波形的选择上,使用条件结构,枚举选择对应的波形。
生成的波形可加入均匀的白噪声,通过前面板的开关可以选择是否加入噪声,通过开关的布尔量可以将暂停波形页面。
上图为使用条件结构,枚举选择对应的波形
上图为整体结构的框图
2) 前面板的设计
前面板实现输入波形、频率、幅值、相位、占空比的设置,还有通道及是否加入白噪声的选择。
上图为双踪信号源前面板整体图形
3) 程序框图
对于不同的波形选择,这里采用枚举选择的方式,通道一波形及参数设置如下图所示:
对于通道一、通道二、通道一与二同时显示波形图也是枚举类型的采用条件结构。
程序框图如下:
对于是否加入均匀白噪声的程序框图如下:
软件功能:
1) 单一通道波形显示:
当运行LabView时首先按下运行按钮,运行指示灯亮。
选择通道、波形及输入参数得到通道一显示波形如下图所示:
2) 双通道波形显示
在通道选择处选择“通道1与通道2”,设置好波形及输入参数得到通道一显示波形如下图所示:
3) 添加均匀的白噪声
在添加噪声处选择是否加入噪声,并设置好波形及输入参数。
因噪声不稳定所以加入噪声后可以点击运行按钮,运行指示灯灭,此时图像暂停。
如下图所示:
4) 退出
当完成所需信号的发生时,点击“关闭”按钮即可退出该虚拟仪器的使用。
基于LabVIEW的双踪虚拟示波器的设计与实现

3.2.1应收账款。
管理层估计销售收入和计提坏账准备时决断空间较大,但这样只能改变盈利的确认时间。
利用应收账款调增一个会计期间的盈利就意味着要调减另一个会计期间的盈利。
只有调增盈利时获得的收益大于调减盈利时付出的代价时,才适合运用这种策略。
研究人员通常把这种策略解释为管理层乐观主义,即管理层预期未来盈利增长足以吸收盈利调减的部分。
3.2.2存货。
存货是一个资金储备库,管理层把支出的资金存储在这里,然后定期转为费用。
管理层需要预测需求以制定销售价格,包括决定是否打折,因而决断空间较大。
3.2.3其他流动资产。
这一类项目名目繁多,存在很大的决断空间。
3.2.4固定资产。
固定资产可以把巨额支出资本化,然后以比较随意的方式计提折旧,决断空间也较大。
管理层需要预测未来生产需求和固定资产磨损程度以判断固定资产是否退役。
3.2.5应付账款、应付利息。
这些是欠供应商或债权人的固定金额的负债,决断空间较小。
3.2.6员工福利计划。
管理层需要预测员工福利投资的收益率,获取期望寿命等精算数据,决断空间较大。
3.2.7长期负债。
长期负债的价值是以发行收入确定的,升水或贴水要按照一定的方法摊销,决断空间较小。
4盈余管理的识别研究人员通常采用三种方法来判断企业是否存在盈余管理行为。
一是综合应计法,即运用回归模型估计预期应计和意外应计;二是研究具体的应计项目,如坏账准备和存货计价;三是分析盈利分布的不连贯性。
4.1综合应计法。
Jones(1991)模型是最常见的综合应计模型。
应计既受管理层操控的影响也受企业经济状况的影响,因此模型把应计总额与销售收入变动(ΔSales)和固定资产总额(PPE)联系起来:Total Accruals it=a1i+b1i DSales it+c1i PPE it+e1it(1)此模型有两个假设:一是当前的应计(营运资本的变动)是与销售或销售增长相关的企业经营活动和经济状况的,因为公式(1)通常用滞后的资产或滞后的销售估计各个参数;二是固定资产总额能够控制应计中的非操控性的折旧费用等项目。
基于LabVIEW的虚拟双踪示波器的设计
基于LabVIEW的虚拟双踪示波器的设计摘要示波器是科学研究和工程设计中广泛应用的一种通用仪器。
虚拟数字存储示波器是虚拟仪器技术的一种具体应用,主要由数据采集、数据处理和结果显示三大部分组成。
其中,数据处理和结果显示由计算机软件系统来完成,只有数据采集是在软件的控制下由硬件来完成。
本文主要利用功能强大的图形化虚拟仪器开发平台LabVIEW,完成虚拟双踪示波器的设计。
本设计采用模块化的设计思想,将每个功能均由一个模块来完成。
其中主要包括由信号发生、触发控制和采样控制组成的数据采集模块,由滤波、频谱分析、加窗处理和波形存储及回放组成的信号分析及处理模块,时基控制的波形显示模块。
数据处理和结果显示都是由计算机软件系统来实现的,而数据采集则是在软件的控制下由硬件来完成的。
本文所设计的虚拟示波器除具有通用功能外,又优于普通示波器,具有自身的优点,如滤波、频谱分析、波形的存储和调用,其成本低廉,功能可根据应用的需要不断地扩展。
最后对虚拟示波器进行了系统测试和性能分析,实验结果达到了预先的设计要求。
词:虚拟仪器,虚拟双踪示波器,LabVIEW关键西安交通大学城市学院本科生毕业设计(论文)IIABSTRACTABSTRACTScope of scientific research and engineering design is a widely used general-purpose equipment. Virtual Digital Storage Oscilloscope is a kind of virtual instrument technology specific application, mainly by the data acquisition, data processing and the results showed three major components. Among them, the data processing and results accomplished by the computer software system, only the data acquisition is under the control of the software from the hardware to complete.This paper mainly using powerful graphical LabVIEW virtualinstrument development platform, completed the design of virtual oscilloscope double steps. This design USES the modular design thought, will each function all by a module to complete. Include the signal happen and trigger the control and sampling control the data acquisition module, composed by filtering, spectrum analysis, add window treatment and waveform storage and playback of signal analysis and processing module, the time base control of the waveform display module. Data processing and the results showed that are made by computer software system to achieve, and the data acquisition is under the control of the software by the hardware to finish. In this paper, the design of virtual oscilloscope is in addition to the general function, and better than the ordinary oscilloscope, which has its own advantages, such as filtering, spectrum analysis, waveform, the storage and call low cost, according to the needs of the function can be used continuously expanded.At last the virtual oscilloscope system test and performance analysis, the experimental results to advance design requirements.KEY WORDS: Virtual instrument, Virtual oscilloscope.Were double, LabVIEWIII西安交通大学城市学院本科生毕业设计(论文)IV目录目录1 绪论 .............................................................1 1.1问题的提出及课题研究意义 (1)1.2 虚拟仪器概述 ................................................ 2 1.3 虚拟仪器的现状 .............................................. 7 1.4 本研究的内容 ................................................ 9 2 虚拟示波器的基本原理 ............................................. 112.1示波器的结构 ............................................... 11 2.2示波器的波形显示原理 ....................................... 12 2.3虚拟示波器的工作原理 ....................................... 14 3 系统设计 ......................................................... 17 3.1 硬件设计 ................................................... 18 3.2 软件设计 (19)3.2.1 LabVIEW编程环境介绍 (19)3.2.2 软件编程 ............................................. 22 3.3信号分析及处理设计 (25)3.3.1波形存储及调用 (29)3.3.2数据存储 (29)3.3.3 数据回放 (30)3.3.4 显示控制 (31)....................................... 33 4 虚拟示波器的调试与测试结果4.1虚拟示波器的性能指标 (33)4.2程序的调试与仪器对比测试结果 (33)4.2.1波形显示调试结果 (33)4.2.2触发控制调试 (35)4.2.3数据分析和处理调试 ................................... 36 5结论与展望 ....................................................... 37 参考文献 .. (39)V1 绪论1 绪论1.1问题的提出及课题研究意义随着电子技术、计算机技术、软件技术、网络技术的高度发展,其在仪器技术和测量技术上的应用也越来越广,仪器仪表结构在许多方面都较传统仪器有很大突破,在功能和作用上发生了质的变化,由此产生了许多新的测试仪器、测试理论、测试方法。
基于labview的虚拟示波器的设计与实现

双通道虚拟示波器的设计1.设计思想本设计是基于labView软件实现A、B两个通道的设计,即双踪示波器。
设置两个菜单下拉列表控制通道A和通道B的选通状况,输入某种信号即显示相应的波形,选择关则关闭显示通道,选择双通道则同时显示输入的两个波形。
输入信号可用基本模拟信号,如正弦波、方波、三角波、锯齿波等。
波形显示采用波形图控件,同时还需要有波形控制部件,垂直灵敏度及扫描速率检测部件等以及时间延迟、幅度偏移、信号的幅值及频率等转盘。
最后要设计示波器关闭按钮,通过while循环的停止按钮来实现。
2.方案设计本设计的VI在创建过程中,首先创建前面板,然后进行程序框图的编写。
在程序的编写中,使用了条件结构while循环结构以及常用的数据处理函数,同时还用到了信号生成控件VI、旋钮控件VI等多个labView控件。
在程序框图的编写过程中,创建了多个labView ,用于双通道示波器部分功能的实现,完整的设计框图如下所示:子VI12 图2 后面板框图3.设计步骤3.1通道A 、B 的选择及波形发生在程序框图面板上创建两个条件结构,利用基本函数发生器创建波形发生模块,用菜单下拉列表控制条件输入端,将固定值0这个分支闲置,即不产生波形,达到前面板菜单下拉列表上“关”的功能,固定值1、2、3、4这几个分支分别加入正弦波、方波、三角波、锯齿波等模拟波形信号,这样,实现了信号源的选择。
具体效果如图2,以下分别为5个条件选择分支的程序图,及前面板上菜单下拉列表功能的实现,B 通道同理。
3图2 波形选择模块 3.2波形控制和调节部分这部分是为了获得显示波形的详细信息而设计的,其结构如下图:图3 单频信息控件图3是提取单频信号控件,可以在前面板上显示信号的幅值和频率。
图4 幅度偏移图4是实现了幅度的偏移,公式为x1+x2(x1为输入信号,x2为偏移量)。
图5 垂直灵敏度图5实现的是垂直灵敏度的控制,通过一个条件选择结构实现6个档位的转变。
基于LABVIEW的虚拟示波器设计—虚拟示波器
目录1 LabVIEW软件及其大体设计原理简介 (1)1.1 LabVIEW简介 (1)1.2 LabVIEW软件设计大体原理 (1)2 关于虚拟示波器的设计思路及方案的实现 (3)2.1 设计思路 (3)2.2 方案的实现 (3)2.2.1 前面板的设计 (3)2.2.2 设计的大体原理和设计步骤 (4)3 设计心得 (9)4 参考文献: (10)5 程序调试进程中发觉的问题和解决方法 (10)基于LABVIEW的虚拟示波器设计1 LabVIEW软件及其大体设计原理简介1.1 LabVIEW简介LabVIEW(Laboratory Virtual instrument Engineering)是一种图形化的编程语言,它普遍地被工业界、学术界和研究实验室所同意,视为一个标准的数据搜集和仪器操纵软件。
LabVIEW集成了与知足GPIB、VXI、RS-232和RS-485协议的硬件及数据搜集卡通信的全数功能。
它还内置了便于应用TCP/IP、ActiveX等软件标准的库函数。
这是一个功能壮大且灵活的软件。
利用它能够方便地成立自己的虚拟仪器,其图形化的界面使得编程及利用进程都生动有趣。
传统文本编程语言依照指令的先后顺序决定程序执行顺序,但LabVIEW 则采纳数据流编程方式,程序框图中节点之间的数据流向决定了VI 及函数的执行顺序。
LabVIEW 提供很多外观与传统仪器(如示波器、万用表)类似的控件,可用来方便地创建用户界面。
用户界面在LabVIEW 中被称为前面板。
利用图标和连线,可以通过编程对前面板上的对象进行控制。
这就是图形化源代码,又称G 代码。
LabVIEW 的图形化源代码在某种程度上类似于流程图,因此又被称作程序框图。
LabVIEW尽可能利用了技术人员、科学家、工程师所熟悉的术语、图标和概念。
因此,LabVIEW是一个面向最终用户的工具。
它能够增强你构建自己的科学和工程系统的能力,提供了实现仪器编程和数据搜集系统的便利途径。
(完整版)基于LabVIEW的虚拟示波器的设计毕业设计

毕业论文(设计)课题基于LABVIEW虚拟示波器的设计学生袁敏院部电气工程学院专业班级11电子信息工程(2)班指导教师陶沙二○一五年五月目录插图清单....................................................................................................................................摘要....................................................................................................... 错误!未定义书Abstract .....................................................................................................................................第一章绪论................................................................................................. 错误!未定义书1.1虚拟仪器的起源和结构 ............................................................... 错误!未定义书1.2虚拟仪器技术的四大优势 ........................................................... 错误!未定义书1.3虚拟仪器的现状及发展方向 ....................................................... 错误!未定义书1.4本论文的主要工作 ....................................................................... 错误!未定义书第二章LabVIEW ....................................................................................... 错误!未定义书2.1LabVIEW的概念.......................................................................... 错误!未定义书2.1.1 LabVIEW创建虚拟仪器 ................................................... 错误!未定义书2.2 labview的模板 ............................................................................. 错误!未定义书2.2.1工具选板 ........................................................................... 错误!未定义书2.2.2控件选板(Control Palette) ..................................... 错误!未定义书2.2.3函数选板(Functions Palette) ..................................... 错误!未定义书第三章系统硬件设计 ................................................................................ 错误!未定义书3.1数据采集与仪器控制 ................................................................... 错误!未定义书3.2虚拟仪器.....................................................................................................................3.2.1选择合适的总线 ............................................................................................第四章虚拟示波器软件设计 .................................................................................................4.1系统总体构成 ............................................................................................................4.2滤波器模块..................................................................................................................4.3存储与回放模块 ........................................................................................................4.4频谱分析模块..............................................................................................................4.5参数测量模块 ............................................................................................................第五章虚拟示波器的调试 .....................................................................................................5.1波形显示.....................................................................................................................5.2频谱分析.....................................................................................................................5.3参数测量.....................................................................................................................第六章结论和展望..................................................................................................................参考文献....................................................................................................................................致谢:........................................................................................................................................插图清单图2-1 工具图 .............................................................................................. 错误!未定义书图2-2 工具选板的功能图 ......................................................................... 错误!未定义书图2-3 新式功能选板图 .............................................................................. 错误!未定义书图2-4 控件各个子模板图 .......................................................................... 错误!未定义书图2-5 函数选板框图 .................................................................................. 错误!未定义书图2-6 编程的功能框图 .............................................................................. 错误!未定义书图3-1 传感器图 .......................................................................................................................图3-2 选择合适仪器图 ...........................................................................................................图4-1 系统总体流程图 ...........................................................................................................图4-2 系统总体前面板 ...........................................................................................................图4-3 系统总体程序框图 .......................................................................................................图4-4 滤波器前面板 ...............................................................................................................图4-5 滤波器程序框图 ...........................................................................................................图4-6 存储和回放模块前面板 ...............................................................................................图4-7a 存储和回放模块程序框图 .........................................................................................图4-7a 存储和回放模块程序框图 .........................................................................................图4-8 频谱分析模块程序框图 ...............................................................................................图4-9 频谱分析模块前面板 ...................................................................................................图4-10 参数模块前面板 .........................................................................................................图4-10 参数测量程序框图 .....................................................................................................图5-1 波形显示结果 ...............................................................................................................图5-2 频谱分析结果显示 .......................................................................................................图5-3 均方根分析结果 ...........................................................................................................图5-4 相位分析 .......................................................................................................................图5-5 全局结果的分析 ...........................................................................................................基于LabVIEW的虚拟示波器的设计摘要由于实验室大多驱动仪器硬件大多都是国外进口,不但前期的花费大,而且后期的维护、升级的使用也会花费大量的人力财力。
基于LABVIEW的虚拟示波器设计

基于LABVIEW的虚拟示波器设计虚拟仪器是一种使用软件模拟实际仪器功能的工具。
在近年来,随着计算机技术的快速发展,虚拟仪器在各种测量和控制领域的应用越来越广泛。
针对示波器这一重要的测试仪器,本文将介绍如何使用LABVIEW软件设计一个基于LABVIEW的虚拟示波器。
LABVIEW是一款由National Instruments公司开发的图形化编程环境,用于进行数据采集、仪器控制和数据分析等工作。
通过使用LABVIEW,可以轻松地实现各种虚拟仪器的设计和开发。
虚拟示波器是一种具有示波器功能的软件程序,通过采集和显示信号波形,用于检测和分析电路中的信号。
在进行虚拟示波器设计时,需要考虑以下几个关键因素:1. 数据采集:虚拟示波器需要能够采集外部信号并进行处理。
可以使用LABVIEW提供的数据采集模块,例如DAQmx模块,来实现数据的采集和处理功能。
2. 数据显示:虚拟示波器需要能够将采集到的数据以波形的形式显示出来。
LABVIEW提供了丰富的图形化控件,可以轻松实现波形显示功能。
通过使用Waveform Chart或Graph控件,可以将采集到的数据实时显示。
3. 触发功能:示波器通常具有触发功能,用于稳定地观察特定事件。
在虚拟示波器设计中,可以利用LABVIEW提供的Trigger模块来实现触发功能。
通过设定触发条件,可以实现稳定的波形观察。
4.配置选项:虚拟示波器需要提供一些常用的配置选项,例如时间和电压的刻度设置,波形颜色和线型的选择等。
可以使用LABVIEW提供的控件,例如数字输入框和下拉菜单,来实现这些配置选项。
基于以上几个关键因素,下面我们将详细介绍基于LABVIEW的虚拟示波器设计的具体步骤:步骤1:设置数据采集通道。
通过使用DAQmx模块,选择需要采集的数据通道,例如模拟输入通道或数字输入通道。
步骤2:创建界面。
使用LABVIEW的图形化工具,创建一个用户界面,包括波形显示区、触发设置区和配置选项区。
基于LABVIEW的虚拟示波器设计

基于LABVIEW的虚拟示波器设计引言:虚拟示波器是一种基于计算机软件来模拟实际示波器的一种设备。
它可以通过计算机屏幕上的波形显示来查看和分析电子电路中的信号。
虚拟示波器可以用于教学、研究和工程应用中。
本文将介绍基于LABVIEW的虚拟示波器的设计。
设计目标:本设计的目标是基于LABVIEW软件实现一个功能完善的虚拟示波器,具有以下主要功能和特点:1.实时显示输入信号的波形;2.具有信号的峰值、频率、相位等测量功能;3.具有波形触发功能,可以根据用户设定的触发条件对波形进行触发和捕获;4.支持多通道输入信号,可以同时显示多个通道的波形;5.具有数据保存和导出功能,可以保存波形数据并导出为文件;6.友好的用户界面,方便用户使用和操作。
设计过程:1.硬件连接:将输入信号通过适当的硬件接口连接到计算机,如USB或者GPIB接口。
2.创建虚拟示波器界面:使用LABVIEW软件创建一个用户界面,包括波形显示区域、测量区域、触发条件设置区域等。
用户界面应该简洁明了,易于操作。
3.添加波形显示:在用户界面的波形显示区域添加一个波形显示图表,用于实时显示输入信号的波形。
可以设置波形显示的参数,如横轴和纵轴的标尺范围、触发模式等。
4.添加测量功能:在用户界面的测量区域添加测量功能模块,可以实时测量输入信号的峰值、频率、相位等参数。
可以根据需要添加更多的测量功能。
5.添加触发功能:在用户界面的触发设置区域添加触发条件设置模块,可以设置触发条件,如触发电平、触发沿等。
当输入信号满足触发条件时,将触发波形的捕获和显示。
6.多通道支持:如果需要支持多个通道的输入信号,可以在用户界面中添加多个波形显示图表,每个图表对应一个通道的输入信号。
7.数据保存和导出:添加数据保存和导出功能,可以保存波形数据并导出为文件,以便后续分析和处理。
8.测试和调试:对设计的虚拟示波器进行测试和调试,确保各项功能正常工作。
结果展示:通过LABVIEW软件的虚拟示波器设计,可以实时显示输入信号的波形,并进行各种测量和触发操作。
基于labview的双通道虚拟示波器设计vi

基于labview的双通道虚拟示波
器设计vi
基于LabVIEW的双通道虚拟示波器设计VI的主要任务是基于收集的模拟信号数据生成波形图表,并显示在计算机屏幕上,再通过软件进行信号特征分析、过滤、采集、储存等操作。
该设计VI可以设置图表缩放、显示控制等操作,方便用户实现对收集的信号数据的分析、处理和储存。
首先,需要在LabVIEW界面中设计GUI,设定数据源、采样间隔、缩放比例与显示等参数,创建一个按键进行开始/停止数据采集。
其次,通过图形显示控制器来创建两个波形控件,并设置其相应的属性,如颜色、线型、更新率等。
此外,还需编写数据获取、处理和储存等功能模块,包括调节Y轴的范围、记录波形数据、设置触发方式等。
最后,将所有模块进行连接,使得整个VI的功能能够得以实现。
总之,基于LabVIEW的双通道虚拟示波器设计VI需要结合图形界面、数据处理和计算机控制等多方面的技术,其设计实现对实验数据的观测和处理能够非常高效、精确和快速。
同时,做好VI开发过程中的文档记录、测试和调试等工作也是非常重要的。
这种VI技术应用广泛,可被广泛应用于工程技术、计算机控制、自动化控制等领域。
相关问题
基于labview的双通道虚拟示波器设计
LabVIEW是一个强大的图形化编程环境,可以用于设计各种
基于labview的虚拟示波器设计。
基于LabVIEW的虚拟示波器设计_论文
基于LabVIEW 的虚拟示波器设计的虚拟示波器设计- I - 基于LabVIEW 的虚拟示波器设计摘 要虚拟示波器就是虚拟仪器技术(NI NI)利用高性能的模块化硬件,结合)利用高性能的模块化硬件,结合高效灵活的软件来完成各种测试、测量和自动化的应用。
灵活高效的软件能帮助您创建完全自定义的用户界面,模块化的硬件能方便地提供全方位的系统集成,标准的软硬件平台能满足对同步和定时应用的需求。
这也正是NI 近30年来始终引领测试测量行业发展趋势的原因所在。
虚拟仪器的突出特点之一在于在很大程度上用系统软件的升级替代了仪器设备硬件的更换设备硬件的更换,,这将节省大量的资金投入这将节省大量的资金投入,,代表了仪器仪表技术的发展方向。
能够与计算机技术结合,将计算机资源与仪器硬件,数字信号处理技术与不同功能的软件模块结合,组成不同的仪器功能。
如今的软件模块结合,组成不同的仪器功能。
如今,,虚拟仪器已在超大规模集成电路测试、模拟测试、模拟//数字电路测试、现代家用电器测试、电子元件、电力电子器件测试以及军事、航天、生物医学、工厂测试、电工技术等领域的可移动式现场测试工作中得到应用。
任何基于虚拟仪器技术的设备仍然需要利用数据采集卡实现数据的采集工作的采集工作,,以供系统进行进一步的分析处理。
以供系统进行进一步的分析处理。
虚拟示波器的出现改变了原有示波器的整体设计思路,,用软件代替了硬件。
将传统仪器由硬件实现的数据分析与显示功能,改由功能强大的计算机及其显示器来完成,使工程技术人员可以用一部笔记本电脑到现场就可以轻松完成信号的采集、处理及频谱分析和波形分析。
采集、处理及频谱分析和波形分析。
关键字:LabVIEW ,虚拟仪器,虚拟示波器AbstractVirtual oscilloscope Virtual Instrument Technology ( NI ) using a high performance modular hardware, combined with efficient and flexible software to complete a variety of test, measurement and automation applications. A flexible and efficient software can help you create a fully customizable user interface, modular hardware can provide a full range of system integration, software and hardware platform can meet the standard of synchronization and timing applications. This is the NI nearly 30years always lead the test and measurement industry development trend of the reason. At the same time only with efficient software, modular I / O hardware and software and hardware platform for the integration of the three major components, in order to give full play to the virtual instrument technology of high performance, scalability, less development time, as well as excellent integration of these four advantages.Virtual instrument is one of the prominent characteristics is to a large extent with system software upgrade replacement equipment hardware replacement, it will save a lot of capital investment, on behalf of the instrument technology development direction. Now, virtual instrument has been in very large scale integrated circuit testing, analog / digital circuit testing, modern test household appliances, electronic components, power electronic device test as well as military, aerospace, biomedical, factory testing, electrical technology in the field of mobile site testing application. Based on virtual instrument technology equipment still requires the use of a data acquisition card data collection work, for further analysis and processing system.Keywords: LabVIEW,Virtual instrument,Virtual oscilloscope目录摘 要 (I)Abstract ................................................................................................................................................................................................................................................................................................. II II 目录 . (III)第1章 虚拟仪器技术 (1)1.1虚拟仪器的概念 (1)1.2虚拟仪器的构成和特点 (1)1.3虚拟仪器研究背景和发展趋势 (2)1.4虚拟仪器在各个领域的应用 (2)第2章 LabVIEW (4)2.1 LabVIEW的概述的概述 (4)2.2 LabVIEW的基本构成 (4)2.3 LabVIEW的软件设计基本原理 (5)2.4 LabVIEW的运行和调试的运行和调试 (5)2.4.1 LabVIEW的运行 (5)2.4.2 LabVIEW的调试 (6)第3章 虚拟示波器的设计 (7)3.1示波器的基本功能介绍 (7)3.2虚拟示波器的控制系统要求 (7)3.3虚拟示波器的设计步骤 (8)第4章 虚拟示波器测试 (16)4.1虚拟示波器的测试方法 (16)4.1.1 频率不变,幅值改变时的频谱测试分析 (16)4.1.2 幅值保持不变,频率改变时的频谱测试分析 (17)4.1.3 改变触发控制的频谱测试改变触发控制的频谱测试 (19)4.2 结论 (20)结论第5章 总结与展望 (21)参考文献 (22)致 谢 (23)第1章 虚拟仪器技术1.1虚拟仪器的概念 虚拟仪器是微电子领域与计算机技术的飞速发展及测量技术与计算机深层次相结合的一种革命性的产物。
基于LabVIEW的虚拟示波器设计分析
基于LabVIEW的虚拟示波器设计分析引言虚拟仪器是一种基于计算机的自动化测试仪器系统。
虚拟仪器的突出优点在于能够与计算机技术结合,将计算机资源与仪器硬件,数字信号处理技术与不同功能的软件模块结合,组成不同的仪器功能。
用户可根据测试的需要,自己设计所需要的仪器系统,即利用数据采集卡及计算机外围硬件进行信号的采集与检测,然后用计算机所编的软件来实现对信号的处理、计算和分析以及对测试结果进行显示。
波形分析是信号处理中重要的分析手段。
引言虚拟仪器是一种基于计算机的自动化测试仪器系统。
虚拟仪器的突出优点在于能够与计算机技术结合,将计算机资源与仪器硬件,数字信号处理技术与不同功能的软件模块结合,组成不同的仪器功能。
用户可根据测试的需要,自己设计所需要的仪器系统,即利用数据采集卡及计算机外围硬件进行信号的采集与检测,然后用计算机所编的软件来实现对信号的处理、计算和分析以及对测试结果进行显示。
波形分析是信号处理中重要的分析手段。
虚拟示波器的出现改变了原有示波器的整体设计思路,用软件代替了硬件。
将传统仪器由硬件实现的数据分析与显示功能,改由功能强大的计算机及其显示器来完成,使工程技术人员可以用一部笔记本电脑到现场就可轻松完成信号的采集、处理及频谱分析和波形分析。
LabVIEW(实验室虚拟仪器集成环境)是NI公司(美国国家仪器公司)的创新软件产品,也是目前应用最广、发展最快、功能最强的图形化软件集成开发环境,可实现数据采集、仪器控制、过程监控和自动测试等实验室研究和工业自动化领域的实际任务。
LabVIEW从基本的数学函数、字符串处理函数、数据运算函数、文件I/O函数到高级分析库,包括了信号处理、窗函数、滤波器设计、线性代数、概率论与数理统计、曲线拟合等,涵盖了仪器设计中几乎所有需要的函数。
LabVIEW的功能模块包括数据采集、通用接口总线和仪表的实时控制、数据分析、数据显示以及数据的存储。
拥有大量数据采集和仪表控制的功能模块和开发工具,因此,LabVIEW可以编出外观和功能都与真实仪表很相似的程序。
基于LabVIEW双踪示波器设计

基于LabVIEW双踪示波器设计工作性能稳定,测量精度高,且功能可以不断扩展,且不需要任何成本。
示波器是在科学研究和工程设计中具有广泛应用的仪器。
与传统的示波器相比,本研究设计的虚拟示波器主要具有以下优点:①功能和性能指标可以扩展。
②操作面板简单清晰,初学者易掌握。
③具有强大的网络通信能力。
1 双踪示波器设计1.1 设计要求①通道选择,单通道A、B以及通道叠加。
②触发功能、极性选择功能。
③时基、水平以及幅度选择按钮。
1.2 前面板的设计虚拟函数信号发生器的前面板设计。
在前面板中,添加多种控件,例如布尔开关、波形图表、旋钮等,结果用实时波形图的方式显示。
①开关部分:添加“停止”按钮控件控制函数信号发生器的工作。
②幅度、时基和水平位置调节:添加3对旋钮以及数值显示控件,分别用来调节这3个参数。
③波形显示:添加波形图表以及输出控件,用于显示输出波形。
④通道选择:添加一个特垂直滑动杆,来控制通道A,通道B和通道A&B的选择。
⑤触发、极性控制:添加2个垂直滑动杆开关,用于控制触发和极性。
双踪示波器前面板如图1所示。
1.3 虚拟双踪示波器的程序框图设计①运用层叠式顺序结构,创建触发源、触发极性,触发电平节点,对这些对这些触发控创建一个disabled,将disabled附一个初值0,创建一个局部变量。
②示波器的触发功能可以在信号的正确点处同步水平扫描,这对表现清晰的信号特性非常重要。
如果每一次扫描的起始都从信号的不同位置开始,那么屏幕上的图象会很混乱。
触发的目的是保证信号波形稳定地显示,每次捕捉的起点都是相同的,将该点以后的波形稳定的显示出来。
③通道选择模块主要是控制虚拟示波器采集卡的通道数,通道控制可以分为A,B,A+B三种方式。
可以单独对A或者B进行数据采集,也可以同时对A+B双通道进行数据采集。
④时基模块:主要功能是直接控制每次进入显示波形的点数来控制扫描频率。
时基调整可以调节显示屏横坐标的分度值(5ms/div,10ms/div,20ms/div)。
基于LabVIEW双通道示波器的设计与实现
基于LabVIEW双通道示波器的设计与实现Design and Implementation of Double Channel OscilloscopeBased on LabVIEW2015年02 月摘要虚拟仪器技术是现在计算机系统和仪器系统相结合的产物,是当今计算机辅助测试领域的一项重要技术。
它推动着传统仪器朝着数字化,智能化,模块化,网络化的方向发展。
随着电子计算机技术和软件开发技术的日新月异,电子计算机在数据的实时分析和处理,显示,存贮等方面的优势与传统的仪器相比越来越明显。
与此同时,随着计算机性价比的不断提升,传统仪器的价格又长期居高不下,再加上传统仪器的功能单一,发展虚拟仪器已经成为一个不可阻挡的历史潮流。
美国NI公司在这种大环境下,率先发起了对虚拟仪器的研究开发,推出了LabVIEW软件开发平台。
文章阐述了虚拟仪器的背景、概念、发展、组成等,重点介绍了采用图形化编程软件LABVIEW设计虚拟示波器方法以与它的波形显示、频谱分析、参数显示等功能,最终实现开发一个能够对声音信号进行显示的虚拟示波器。
本文所设计的虚拟示波器经过测试可以对信号正确的采集和显示,达到了本次虚拟示波器的设计要求。
本课题在掌握了虚拟仪器的基本结构与信号处理的相关知识基础之上,设计了一套虚拟示波器。
对虚拟仪器的概念,结构,发展趋势进行了相关分析。
关键词:虚拟仪器虚拟示波器 LabVIEWABSTRACTNow, virtual instrument technology is the combination of the computer system and instrument system, is an important technology in the field of computer aided testing. It promotes the traditional instruments toward digital, intelligent, modular, network direction.With advances in computer technology and software development technology, electronic computer in real-time data analysis and processing, display, storage, etc advantages compared with traditional instruments is more and more obvious. At the same time, with the improving of the computer price, the price of traditional instruments and high for a long time, coupled with the single function of traditional instrument, virtual instrument development has become an unstoppable tide of history. NI companies in the United States in this environment, take the lead in launching the research and development of virtual instrument, introduced the LabVIEW software development platform.The article expounds the background, concept, the development of virtual instrument, composition, etc., focus on using graphical programming software LABVIEW virtual oscilloscope design method and its waveform display, spectrum analysis, and other functions, eventually developing a audio signals to display the virtual oscilloscope.In this paper, the design of virtual oscilloscope tested signal right acquisition and display, can be reached the design requirements of virtual oscilloscope.This topic in the mastery of the basic structure of virtual instrument and signal processing based on knowledge, design a set of virtual oscilloscope. The concept of virtual instrument, the structure, the development trend of related analysis.Keywords:Virtual instrumentVirtual oscilloscope LabVIEW目录绪论1第一章虚拟仪器技术概述21.1虚拟仪器概述21.1.1虚拟仪器概念21.1.2虚拟仪器构成21.1.3 虚拟仪器特点31.2虚拟仪器的现状41.2.1国外虚拟仪器的研究现状41.2.2国虚拟仪器的研究现状51.2.3虚拟仪器的发展方向61.3虚拟仪器的发展趋势61.4虚拟仪器的研究步骤与本论文的结构7第二章 LABVIEW概述82.1 LabVIEW的基本概述82.2什么叫LabVIEW82.3LabVIEW软件的特点92.4LabVIEW创建虚拟仪器过程10第三章虚拟示波器的设计与实现103.1系统设计介绍103.2整体设计方案123.3设计步骤133.3.1选择与波形发生133.3.2波形控制和调节部分14第四章虚拟示波器的调试与结果分析164.1 测试与结果174.2 性能分析18结论18参考文献19致19Ⅰ绪论虚拟仪器技术是现在计算机系统和仪器系统相结合的产物,是当今计算机辅助测试领域的一项重要技术。
基于LabVIEW的双通道虚拟示波器设计
基于LabVIEW的双通道虚拟示波器设计摘要:本文基于LabVIEW软件,采用模块化的设计思路,开发了双通道虚拟示波器。
软件设计主要包含通道选择模块、时间和幅值分度调节模块、触发耦合模块、参数测量模块及信号发生模块。
通道选择模块可以选择两个通道单独显示、两个通道同时显示以及两个通道叠加显示,时间和幅值分度调节模块可以分别调节示波器的时间分度和幅值分度。
通过信号发生模块产生仿真信号,参数测量模块完成波形的各种参数测量。
仿真结果表明该系统基本实现了传统示波器的功能,且测量精度和可靠性等性能指标优于传统仪器。
具有较强的可操作性和可维护性。
Abstract:According to the designing idea of modularization, a virtual dual-channel digital oscilloscope based on LabVIEW is developed. The software system includes modules of channel selecting,time and amplitude indexing regulation,triggering and coupling,parameter measuring and signal generating. In channel selecting module,signals can be displayed individually,simultaneously or superimposedly. Simulation signal is produced via module of signal generating and all kinds of parameters can be measured via parameter measuring module. Simulation results show the virtual oscilloscope has realized the functions of traditional oscilloscope and performs better in precision and reliability. It has a high manipulability and maintainability.关键词:虚拟仪器;示波器;信号发生器;LabVIEWKey words:virtual instrument;oscilloscope;signal generator;LabVIEW中图分类号:TP39 文献标识码:A 文章编号:1006-4311(2013)01-0203-020 引言虚拟仪器(Virtual Instruments,VI)技术是当今计算机辅助测试(CAT)领域的一项重要的新技术。
基于LABVIEW的虚拟示波器设计
基于LabVIEW的虚拟示波器设计摘要虚拟仪器是当今仪器技术的发展热点,本文设计并实现了一种功能强大的虚拟示波器系统,详细介绍了利用图形化编程语言LabVIEW进行仪器程序设计的方法。
关键词示波器;虚拟仪器;数据采集;LabVIEW示波器是生产实践和科学研究中应用十分广泛的电子测量仪器。
虚拟仪器以计算机为核心,功能由用户定义和设计,具有虚拟面板,其测试功能由测试软件实现。
虚拟仪器的关键是用软件来实现硬件的功能,实现“软件即仪器”[1]。
本文应用虚拟仪器开发平台LabVIEW开发了一种虚拟示波器,不仅扩展了示波器的分析和计算能力,而且降低了仪器的价格,增强了仪器的通用性。
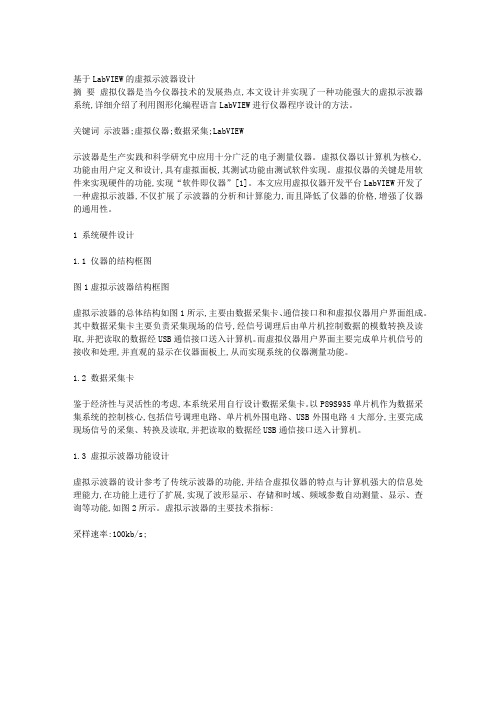
1 系统硬件设计1.1 仪器的结构框图图1虚拟示波器结构框图虚拟示波器的总体结构如图1所示,主要由数据采集卡、通信接口和和虚拟仪器用户界面组成。
其中数据采集卡主要负责采集现场的信号,经信号调理后由单片机控制数据的模数转换及读取,并把读取的数据经USB通信接口送入计算机。
而虚拟仪器用户界面主要完成单片机信号的接收和处理,并直观的显示在仪器面板上,从而实现系统的仪器测量功能。
1.2 数据采集卡鉴于经济性与灵活性的考虑,本系统采用自行设计数据采集卡。
以P89S935单片机作为数据采集系统的控制核心,包括信号调理电路、单片机外围电路、USB外围电路4大部分,主要完成现场信号的采集、转换及读取,并把读取的数据经USB通信接口送入计算机。
1.3 虚拟示波器功能设计虚拟示波器的设计参考了传统示波器的功能,并结合虚拟仪器的特点与计算机强大的信息处理能力,在功能上进行了扩展,实现了波形显示、存储和时域、频域参数自动测量、显示、查询等功能,如图2所示。
虚拟示波器的主要技术指标:采样速率:100kb/s;。
基于LABVIEW的虚拟示波器的设计
基于LABVIEW的虚拟示波器的设计虚拟示波器是一种基于计算机软件实现的示波器,可以通过图形界面显示电压随时间变化的波形。
基于LABVIEW的虚拟示波器,可以利用LABVIEW提供的丰富的图形化编程工具和硬件接口,实现更多功能和灵活性。
设计虚拟示波器的关键是收集、处理和显示波形数据。
基于LABVIEW的虚拟示波器可以通过各种数据采集设备(例如模拟输入IO卡或者USB采集设备)连接到电路中并接收电压信号。
这些设备通常提供了多个输入通道,可以同时采集多个信号。
LABVIEW的硬件接口模块可以帮助用户方便地与这些设备进行交互。
数据采集完成后,虚拟示波器需要将采集到的数据进行处理和显示。
在LABVIEW中,可以使用信号处理的工具包,对采集的数据进行滤波、傅里叶变换等处理,以便更好地展示电压信号的特征。
通过使用LABVIEW的图形显示工具,可以将处理后的数据以波形的形式进行直观的观察。
虚拟示波器不仅仅可以显示波形数据,还可以提供其他功能,例如自动测量、功率谱分析、频率响应等。
通过LabVIEW的功能模块,可以方便地实现这些功能。
例如,可以使用自动测量模块来自动计算波形的最大值、最小值、平均值等指标。
也可以使用频谱分析模块对波形进行频率分析,显示不同频率的成分。
除了显示波形数据和提供其他功能,虚拟示波器还可以提供一些调试和分析工具,以帮助用户更好地理解电路中的问题。
通过在LABVIEW界面中增加控件,用户可以实现诸如光标测量、自动触发等功能。
还可以通过在界面中增加控制按钮,实现波形的暂停、回放等功能,以便用户更好地分析和调试电路。
虚拟示波器的设计需要考虑用户的需求和易用性。
LABVIEW提供了丰富的图形化编程工具和灵活的界面设计功能,可以根据用户的需求进行定制。
同时,LABVIEW还支持导出数据到其他格式,如Excel或者MATLAB,方便用户进行深入的数据分析和处理。
在设计虚拟示波器时,还需考虑性能和稳定性问题。
- 1、下载文档前请自行甄别文档内容的完整性,平台不提供额外的编辑、内容补充、找答案等附加服务。
- 2、"仅部分预览"的文档,不可在线预览部分如存在完整性等问题,可反馈申请退款(可完整预览的文档不适用该条件!)。
- 3、如文档侵犯您的权益,请联系客服反馈,我们会尽快为您处理(人工客服工作时间:9:00-18:30)。
摘要示波器是科学研究和工程设计中广泛应用的一种通用仪器。
虚拟数字存储示波器是虚拟仪器技术的一种具体应用,主要由数据采集、数据处理和结果显示三大部分组成。
其中,数据处理和结果显示由计算机软件系统来完成,只有数据采集是在软件的控制下由硬件来完成。
本文主要利用功能强大的图形化虚拟仪器开发平台LabVIEW,完成虚拟双踪示波器的设计。
本设计采用模块化的设计思想,将每个功能均由一个模块来完成。
其中主要包括由信号发生、触发控制和采样控制组成的数据采集模块,由滤波、频谱分析、加窗处理和波形存储及回放组成的信号分析及处理模块,时基控制的波形显示模块。
数据处理和结果显示都是由计算机软件系统来实现的,而数据采集则是在软件的控制下由硬件来完成的。
本文所设计的虚拟示波器除具有通用功能外,又优于普通示波器,具有自身的优点,如滤波、频谱分析、波形的存储和调用,其成本低廉,功能可根据应用的需要不断地扩展。
最后对虚拟示波器进行了系统测试和性能分析,实验结果达到了预先的设计要求。
关键词:虚拟仪器,虚拟双踪示波器,LabVIEWABSTRACTScope of scientific research and engineering design is a widely used general-purpose equipment. Virtual Digital Storage Oscilloscope is a kind of virtual instrument technology specific application, mainly by the data acquisition, data processing and the results showed three major components. Among them, the data processing and results accomplished by the computer software system, only the data acquisition is under the control of the software from the hardware to complete.This paper mainly using powerful graphical LabVIEW virtual instrument development platform, completed the design of virtual oscilloscope double steps.This design USES the modular design thought, will each function all by a module to complete. Include the signal happen and trigger the control and sampling control the data acquisition module, composed by filtering, spectrum analysis, add window treatment and waveform storage and playback of signal analysis and processing module, the time base control of the waveform display module. Data processing and the results showed that are made by computer software system to achieve, and the data acquisition is under the control of the software by the hardware to finish. In this paper, the design of virtual oscilloscope is in addition to the general function, and better than the ordinary oscilloscope, which has its own advantages, such as filtering, spectrum analysis, waveform, the storage and call low cost, according to the needs of the function can be used continuously expanded.At last the virtual oscilloscope system test and performance analysis, the experimental results to advance design requirements.KEY WORDS: Virtual instrument, Virtual oscilloscope.Were double, LabVIEW目录1 绪论 (1)1.1问题的提出及课题研究意义 (1)1.2 虚拟仪器概述 (2)1.3 虚拟仪器的现状 (7)1.4 本研究的内容 (9)2 虚拟示波器的基本原理 (11)2.1示波器的结构 (11)2.2示波器的波形显示原理 (12)2.3虚拟示波器的工作原理 (14)3 系统设计 (17)3.1 硬件设计 (18)3.2 软件设计 (19)3.2.1 LabVIEW编程环境介绍 (19)3.2.2 软件编程 (22)3.3 信号分析及处理设计 (25)3.3.1波形存储及调用 (29)3.3.2数据存储 (29)3.3.3 数据回放 (30)3.3.4 显示控制 (31)4 虚拟示波器的调试与测试结果 (33)4.1虚拟示波器的性能指标 (33)4.2程序的调试与仪器对比测试结果 (33)4.2.1波形显示调试结果 (33)4.2.2触发控制调试 (35)4.2.3数据分析和处理调试 (36)5结论与展望 (37)参考文献 (39)1 绪论1.1问题的提出及课题研究意义随着电子技术、计算机技术、软件技术、网络技术的高度发展,其在仪器技术和测量技术上的应用也越来越广,仪器仪表结构在许多方面都较传统仪器有很大突破,在功能和作用上发生了质的变化,由此产生了许多新的测试仪器、测试理论、测试方法。
同时越来越复杂的测试条件,高度自动化的工业化大生产迫切需要功能更强大、成本更低廉、系统更灵活的新一代测试仪器。
随着科技的发展,虽然传统仪器也得到迅猛的发展,仪器精度越来越高,功能越来越强,性能越来越好,但传统仪器基本上没有摆脱单独使用、手动操作的局限。
在工业自动化测试及测量领域,传统的测量方法使用起来很不便利,其局限性非常明显,显然已经不能适应时代发展的需要了。
传统台式仪器的主要结构由硬件构成,是由厂家设计并定义好功能的一个封闭结构,形式相对固定,所能实现的测试功能单一,每种仪器只能实现一类测量功能,用户在使用过程中难以对其功能进行改变,并只能以确定的方式提供给用户。
因此人们对测试仪器提出了更高的要求:例如测试精度高,可靠性好,功能强,仪器体积小,测试全程自动化,智能化,使用灵活方便,升级便利, 同时还能进行测量数据的存储、处理和显示,具有和其他仪器设备(如计算机等) 进行数据通讯等功能。
今后电子测试仪器的发展方向,是从模拟技术转向数字技术,从单台仪器转向多种功能组合仪器,从硬件实现仪器功能转向软硬件结合使用,从简单的功能组合转向以一个人计算机为核心的测试平台,从硬件模块转向软件包形式。
基于计算机的测试仪器的思想逐渐形成,美国国家仪器公司首先提出了“软件即是仪器”的口号,虚拟仪器应运而生。
虚拟仪器的核心思想是利用计算机的强大资资源,使本来需要硬件实现的技术软件化,以便最大程度地降低系统成本,增强系统灵活性。
在现代电子测量、仪器仪表等领域,示波器是电子信号测量行业最常用的仪器之一,主要用来测量并显示被测信号的参数和波形,在科学试验及现场检测等许多领域被广泛应用。
目前我国高档台式仪器如数字示波器、频谱分析仪、逻辑分析仪等还主要依赖进口,这些仪器加工工艺复杂,对制造水平要求高,生产突破度难。
计算机技术的进步为新型测控仪器的产生提供了技术基础、功能更强的应用软件提供了方便。
虚拟仪器的诞生,使用户可以将一些先进的数字信号处理算法应用于虚拟仪器的设计,增加传统台式仪器所不具备的功能,还能利用先进的计算机技术提高效率,而且完全可以通过软件配置实现多功能集成的仪器设计。
因此,目前研制一种结构简单、操作方便、生产技术要求不高、成本低的数字示波器是非常必要的。
1.2 虚拟仪器概述虚拟仪器 (Virtual Instrument)是基于计算机的仪器。
计算机和仪器的密切结合是目前仪器发展的一个重要方向。
粗略地说这种结合有两种方式,一种是将计算机装入仪器,其典型的例子就是所谓的智能化仪器。
随着计算机功能的日益强大及其体积的日趋缩小,这类仪器的功能也越来越强大,目前已经出现含嵌入式系统的仪器。
另一种方式是将仪器装入计算机。
以通用的计算机硬件及操作系统为依托实现各种仪器功能。
虚拟仪器主要是指这种方式。
所谓虚拟仪器就是在通用计算机上选用一组软件和硬件,使得在操作这台仪器时就像使用一台自己设计的专用的传统仪器,操作人员可以通过友好的用户界面来控制仪器的启动、运行和结束,只需要向仪器发布一个测试指令,就可以获得最终的测试结果和信息。
完成对被测信号的数据采集、信号分析、波形显示、故障诊断、数据存储以及控制输出等功能。
虚拟仪器的构成如图1-1所示:图1-1 虚拟仪器的结构 测量仪器的发展,一种较普遍地说法是分为五个阶段,如图1-2所示显示器 人机接口 信号分析及处理器 各类接口A/D 转换器 数据发生器信号调理器 D/A 转换器 信号调理器 信号调理器图1-2 测量仪器的发展 模拟仪器主要有模拟式电压表、电流表等,这些仪表解决了当时对某些量的测量需求。
从二十世纪初到五十年代左右,测量理论、方法与电子技术、控制技术相结合,出现了以记录仪和示波器为代表的电子仪表。
五十年代以后,随着晶体管和集成电路的出现以及应用电子技术的发展,数字技术成功地应用到测量仪器。
七十年代初,出现了智能仪器。
智能仪器是将微机置于仪器内部,使仪器具有控制、存储、运算、逻辑判断及自动操作等智能特点,并在测量准确度、灵敏度、可靠性、自动化程度、运用能力及解决测量技术问题深度和广度等方面都有明显的进步。