扫描透射电子显微镜模式分析
扫描电子显微镜(SEM)和透射电子显微镜(TEM)

二次电子能够产生样品表面放大的形貌像,这个像是在样品被扫描时按时序建立起来的,即使用逐点成像的方法获得放大像。
扫描电子显微镜(SEM)
ห้องสมุดไป่ตู้
扫描电镜的优点:有较高的放大倍数,20-200000倍之间连续可调;有很大的景深,视野大,成像富有立体感,可直接观察各种试样凹凸不平表面的细微结构;试样制备简单,目前的扫描电镜都配有X射线能谱仪装置,这样可以同时进行显微组织形貌的观察和微区成分分析(即SEM-EDS),因此它是当今十分重要的科学研究仪器之一。
扫描电子显微镜(SEM)工作原理
透射电子显微镜(TEM):
透射电子显微镜可以看到在光学显微镜下无法看清的小于0.2um的细微结构,这些结构称为亚显微结构或超微结构。要想看清这些结构,就必须选择波长更短的光源,以提高显微镜的分辨率。
1932年Ruska发明了以电子束为光源的透射电子显微镜,电子束的波长要比可见光和紫外光短得多,并且电子束的波长与发射电子束的电压平方根成反比,也就是说电压越高波长越短。目前TEM的分辨力可达0.2nm。
扫描电子显微镜下,细胞(粉色、蓝色)上培养出来的新冠病毒(黄色)
学习感悟:生命科学的发展离不开技术,显微镜的发明推动了生命科学的发展。要观察病毒就需要特殊的显微镜。
扫描电子显微镜(SEM):
扫描电子显微镜是1965年发明的主要用于细胞生物学研究电子显微镜,主要是利用二次电子信号成像来观察样品的表面形态,即用极狭窄的电子束去扫描样品,通过电子束与样品的相互作用产生各种效应,其中主要是样品的二次电子。
材料科学中的显微分析技术

材料科学中的显微分析技术随着科技的不断进步和发展,材料科学领域也在不断地推陈出新,尤其是在显微分析技术方面,取得了巨大的成就。
显微分析技术是材料科学中一种非常重要的研究手段,主要通过观察样品的微观结构和性质来达到材料分析和研究的目的。
本文将重点介绍几种常用的显微分析技术。
一、扫描电子显微镜(SEM)扫描电子显微镜是一种非常常用的显微分析技术,它主要利用电子束照射样品后所产生的二次电子和反射电子来观察样品表面的形貌、结构和成分。
SEM 可以通过不同的电子能量、探针电流等参数来调节图像的分辨率和深度,因此对于材料表面形貌的观察和分析非常有帮助。
二、透射电子显微镜(TEM)与 SEM 不同的是,透射电子显微镜主要研究的是材料的内部结构和组成成分。
透射电子显微镜通过压缩电子波长并穿过材料薄层来观察材料的内部结构。
这种技术非常适合于研究各种微纳米结构,如晶体缺陷、嵌入物晶体、纳米线、薄膜等。
三、原子力显微镜(AFM)原子力显微镜是一种非接触式的显微分析技术,可以实现 nm 和单个原子的分辨率。
AFM 通过利用样品表面的力变化来计算样品表面的形貌,可以直接观察到材料表面的原子结构和表面化学性质。
AFM 技术在材料表面形貌、粗糙度以及纳米级表面摩擦等方面各有应用。
四、拉曼光谱分析拉曼光谱分析是一种非常常见的光谱分析技术,它通过利用激光束的激发下产生的被动散射光,来给出材料的振动信息,包括化合物的结构、作为表面成分的化合物、内部动态变化等。
拉曼光谱分析广泛用于材料、纳米材料及化学生物学领域,为研究物理、化学、生物等方面的问题提供了有效的工具。
五、X射线衍射分析(XRD)X射线衍射分析是一种分析材料内部结构的技术,主要应用于晶体结构分析、材料相变研究、材料显微结构分析等领域。
XRD 通过跟踪和分析样品探针的散射角度和强度,从而确定材料的具体晶格结构、原子排列和相互影响。
总结以上几种显微分析技术只是材料分析中常用的几种手段,还有许多其他的方法可以用于材料或材料组件的分析和研究。
扫描电镜显微分析报告

扫描电镜显微分析报告一、引言扫描电镜(Scanning Electron Microscope, SEM)是一种利用电子束对样品表面进行扫描观察和显微分析的仪器。
其分辨率比光学显微镜要高很多,可以清晰显示样品表面的形态和结构。
本次实验使用SEM对样品进行了显微分析,并编写下述报告。
二、实验目的1.了解SEM的基本原理和工作方式;2.观察样品表面的形态和结构;3.通过SEM图像分析,获取样品的组成成分和晶体形貌信息。
三、实验步骤1.准备样品,将其放在SEM样品台上;2.调节SEM参数,包括加速电压、工作距离、扫描速度等;3.进行扫描观察,获取SEM图像;4.根据SEM图像进行显微分析,分析样品的形态、结构和成分。
四、实验结果经过扫描电镜观察,我们获得了样品表面的SEM图像。
该样品是一块金属材料,其表面呈现出颗粒状的结构。
颗粒大小不均匀,分布较为稀疏。
部分颗粒表面存在裂纹和凹凸不平的现象。
通过放大图像,我们可以看到颗粒呈现出不规则的形态和表面结构。
根据样品的形态和颗粒特征,我们推测该样品可能是一种金属合金。
颗粒的大小和分布情况表明,在合金制备过程中,可能存在着颗粒的生长过程或者晶体相变的情况。
我们还可以观察到部分颗粒表面存在裂纹和凹凸不平,这可能与金属材料在制备、处理或使用过程中的应力释放有关。
通过对SEM图像的分析,我们得到了样品的表面形貌和结构信息,但对于其具体的成分和晶体形貌仍需要进一步的分析。
五、实验结论本次实验使用扫描电镜对样品进行了显微分析,并获得了样品的SEM图像。
1.样品表面呈现颗粒状结构,颗粒大小分布不均匀;2.部分颗粒表面存在裂纹和凹凸不平的现象;3.样品可能是一种金属合金,颗粒的形态和分布情况可能与晶体相变和应力释放有关。
对于SEM图像中的颗粒成分和晶体形貌信息,我们需要进一步的分析才能得出准确的结论。
比如可以使用能谱仪对样品进行能谱分析,确定其具体的成分元素;还可以进行X射线衍射分析,获取样品的晶体结构参数。
高角环形暗场扫描透射电镜工作原理

高角环形暗场扫描透射电镜工作原理高角环形暗场扫描透射电镜工作原理简介高角环形暗场扫描透射电镜(Scanning Transmission Electron Microscope,简称STEM)是一种强大的工具,用于研究材料的结构和性质。
它利用高能电子束通过样品,将样品的微观结构显微地显示出来,并提供高分辨率的图像和化学分析。
工作原理1.发射电子源:STEM使用一种极其尖锐的发射电子源,如钨尖或场致发射电源。
这个发射电子源发射出非常细的电子束,用于对样品进行扫描。
2.高能电子束:生成的电子束被加速到非常高的能量,通常在几千伏到几十万伏之间。
这样高能的电子束可以穿过样品,并与样品中的原子或分子发生相互作用。
3.透射电子模式:在STEM中,使用透射电子模式来观察样品。
透射电子模式允许电子束穿透样品,并通过其中的原子或分子与电子进行相互作用。
这种相互作用会散射部分电子,产生信号。
4.暗场探测:暗场是一种特殊的探测方式。
在STEM中,使用环形暗场探测器来收集散射电子。
环形暗场探测器位于电子束后方,收集在一个特定角度范围内散射的电子。
由于暗场探测器只收集散射电子,相对于亮场探测器,它能提供更高的对比度。
5.扫描:STEM是一种扫描电子显微镜,可以通过扫描样品表面的方式获取完整的成像。
电子束被聚焦到非常小的点上,然后在样品上进行扫描,在每个扫描位置收集散射电子。
通过多个扫描位置的叠加,可以生成一幅高分辨率的图像。
功能和应用1.高分辨率成像:STEM提供高分辨率的成像,可以显示样品中的各种微观结构,例如晶体缺陷、晶界和原子排列等。
它可以显示出高度细节的图像,对材料科学和纳米技术的研究非常有用。
2.化学分析:STEM还可以进行化学分析,通过透射电子能谱(Energy-Dispersive X-ray Spectroscopy,简称EDS)技术来确定样品中不同元素的含量和分布情况。
这项功能使STEM成为研究材料的化学成分和晶体结构的有力工具。
仪器分析SEMTEM

仪器分析SEMTEMSEM(扫描电子显微镜)和TEM(透射电子显微镜)是两种常用的仪器分析方法,用于观察材料的微观结构和成分。
它们都利用电子束与样品的相互作用来获取信息。
下面将分别介绍SEM和TEM的工作原理和应用。
SEM利用高能电子束与样品表面的相互作用来观察样品的表面形貌和成分。
其工作原理如下:电子枪产生的聚焦电子束通过透镜系统形成一个细小的电子束,并聚焦引导到样品表面上。
与样品表面相互作用的电子束导致了反射、散射或吸收,其中部分电子通过接收器收集到形成信号。
这些信号被转换成图像,并在显微镜屏幕上显示出来。
SEM可以提供高分辨率、大深度以及大视场的表面形貌图像,并且可以通过能谱分析系统对样品的元素组成进行表征。
SEM广泛应用于材料科学、生物科学、纳米科学等领域。
在材料科学中,SEM可以用于观察材料的晶体形态、纹理、表面缺陷等。
在生物科学中,SEM可以用于观察细胞、组织和生物材料的形貌和结构。
在纳米科学中,SEM可以用于研究纳米材料的形貌、尺寸和形状。
此外,SEM还可以用于分析样品的成分和化学组成。
相比之下,TEM是一种通过透射电子束与样品相互作用来观察材料的内部结构和成分的方法。
其工作原理如下:电子枪产生的电子束经过透镜系统形成一个细小的电子束,并聚焦到样品上。
样品上的一部分电子透过样品,并通过设备上的透射电子探测器来检测。
这些透射电子被转换成图像,并在显微镜屏幕上显示出来。
TEM具有高分辨率的优点,可以提供关于样品内部结构和成分的详细信息。
TEM广泛应用于材料科学、生物科学、纳米科学等领域。
在材料科学中,TEM可以用于观察材料的晶格结构、晶界、层状结构等。
在生物科学中,TEM可以用于观察细胞、组织和病毒等的内部结构。
在纳米科学中,TEM可以用于观察纳米材料的结构、尺寸和形貌。
此外,TEM还可以用于分析样品的成分和化学组成。
综上所述,SEM和TEM是常用的仪器分析方法,用于观察材料的微观结构和成分。
透射电子显微镜的原理

透射电子显微镜的原理一、透射电子显微镜的成像原理可分为三种情况:1、吸收像:当电子射到质量、密度大的样品时,主要的成相作用是散射作用。
样品上质量厚度大的地方对电子的散射角大,通过的电子较少,像的亮度较暗。
早期的透射电子显微镜都是基于这种原理。
2、衍射像:电子束被样品衍射后,样品不同位置的衍射波振幅分布对应于样品中晶体各部分不同的衍射能力,当出现晶体缺陷时,缺陷部分的衍射能力与完整区域不同,从而使衍射波的振幅分布不均匀,反映出晶体缺陷的分布。
3、相位像:当样品薄至100Å以下时,电子可以穿过样品,波的振幅变化可以忽略,成像来自于相位的变化。
二、扫描电子显微镜成像原理扫描电子显微镜通过用聚焦电子束扫描样品的表面来产生样品表面的图像。
电子与样品中的原子相互作用,产生包含关于样品的表面测绘学形貌和组成的信息的各种信号。
电子束通常以光栅扫描图案扫描,并且光束的位置与检测到的信号组合以产生图像。
扫描电子显微镜可以实现分辨率优于1纳米。
样品可以在高真空,低真空,湿条件(用环境扫描电子显微镜)以及宽范围的低温或高温下观察到。
最常见的扫描电子显微镜模式是检测由电子束激发的原子发射的二次电子。
可以检测的二次电子的数量,取决于样品测绘学形貌,以及取决于其他因素。
通过扫描样品并使用特殊检测器收集被发射的二次电子,创建了显示表面的形貌的图像。
它还可能产生样品表面的高分辨率图像,且图像呈三维,鉴定样品的表面结构。
扩展资料:在使用透视电子显微镜观察生物样品前样品必须被预先处理。
随不同研究要求的需要科学家使用不同的处理方法。
1、固定:为了尽量保存样本的原样使用戊二醛来硬化样本和使用锇酸来染色脂肪。
2、冷固定:将样本放在液态的乙烷中速冻,这样水不会结晶,而形成非晶体的冰。
这样保存的样品损坏比较小,但图像的对比度非常低。
3、脱干:使用乙醇和丙酮来取代水。
4、垫入:样本被垫入后可以分割。
5、分割:将样本使用金刚石刃切成薄片。
TEM电子显微镜工作原理详解
TEM电子显微镜工作原理详解TEM电子显微镜是一种高分辨率的分析仪器,能够在纳米尺度下观察材料的微观结构和成分,对于研究材料的性质和特性具有重要意义。
本文将详细介绍TEM电子显微镜的工作原理,包括透射电子显微镜和扫描透射电子显微镜。
透射电子显微镜(Transmission Electron Microscope,TEM)工作原理:透射电子显微镜主要由电子光源、透镜和探测器组成。
首先,电子光源发射高能电子束,这些电子从阴极发射出来,经过加速器获得较高的能量。
然后,电子束通过一系列的电磁透镜进行聚焦,使电子束变得更加细致和密集。
接着,电子束通过物质样本,部分电子被样本吸收或散射,形成透射电子。
这些透射电子被接收器捕获和放大成像,形成TEM图像。
透射电子显微镜的工作原理是基于电子的波粒二象性。
电子是一种粒子同时也是一种波动,其波动性质使得它具备非常短的波长,远远小于可见光的波长。
这使得TEM能够观察到比传统光学显微镜更小的尺度。
另外,透射电子显微镜在工作中还需要考虑电子束的束流强度、对样本的破坏性和控制样本与探测器之间的距离等因素。
TEM电子显微镜通过透射电子成像方式观察样本,因此对样本的制备要求非常高。
样品需要制备成非常薄的切片,通常厚度在几十纳米到几百纳米之间,以保证电子可以穿透。
对于一些无法制备成切片的样品,可以利用离子切割或焦离子技术获得透明的样品。
此外,在观察样本时需要避免污染和氧化等现象。
扫描透射电子显微镜(Scanning Transmission Electron Microscope,STEM)工作原理:扫描透射电子显微镜是透射电子显微镜的一种变种,它在透射成像的基础上加入了扫描功能。
STEM可以实现高分辨率的成像,同时也可以进行能谱分析和电子衍射。
STEM电子显微镜工作原理类似于透射电子显微镜,但需要注意的是,STEM使用的电子束并不需要通过所有的样本区域。
电子束只需通过样本中的一个小区域,然后扫描整个样本,因此样本制备要求和透射电子显微镜相比较低。
扫描电镜和透射电镜的原理

扫描电镜和透射电镜的原理1. 简介嘿,朋友们!今天咱们聊聊两种神奇的显微镜:扫描电镜(SEM)和透射电镜(TEM)。
这两位显微镜界的大咖就像两位超级英雄,各有各的绝技,帮助科学家们揭开微观世界的神秘面纱。
听起来是不是很酷?嘿嘿,别着急,慢慢来,咱们先来个大概念的扫盲。
2. 扫描电镜(SEM)2.1 工作原理好,先说说扫描电镜吧。
这家伙的工作原理就像在玩“扫雷”游戏。
你知道的,它用的是一束高能电子,咔咔咔地“扫”过样品表面。
当这束电子击中样品时,样品会发出二次电子、背散射电子等信号。
接着,扫描电镜就像一位认真负责的侦探,通过这些信号来重建样品的表面图像。
是不是感觉它特别像个“高科技侦探”?2.2 图像特点而且,扫描电镜的图像可不是随随便便的,它可以让我们看到样品表面的微观细节,像个“放大镜”一样。
想象一下,细菌、细胞、纳米材料,这些平时肉眼根本看不见的东西,在它面前都变得清晰可见,简直是微观界的“明星”!更有趣的是,它还可以提供三维图像,给人一种身临其境的感觉。
哇,真是太神奇了!3. 透射电镜(TEM)3.1 工作原理说完扫描电镜,咱们来看看透射电镜。
这位“超级英雄”可是更为强大。
透射电镜的工作原理就像是在观察电影放映一样。
它把电子束打进样品,样品像幕布一样,电子在穿透过程中被样品的内部结构散射。
透过样品后的电子,再被收集起来,形成高分辨率的图像,简直就像在揭开层层面纱,让我们看到样品的“真面目”!3.2 应用领域透射电镜的分辨率非常高,可以达到原子级别的观察,真是让人叹为观止。
用它可以研究材料的微观结构,分析晶体缺陷,甚至观察生物样品的超微结构。
你能想象吗?在透射电镜下,一根头发的内部结构都能看得一清二楚,真是细致入微,简直让人不敢相信自己的眼睛!4. 比较与总结4.1 优缺点现在,咱们来聊聊这两位英雄的优缺点。
扫描电镜虽然不能像透射电镜那样观察到内部结构,但它在样品制备上要简单得多,很多时候只需把样品直接放进来就好。
扫描透射电子显微镜模式分析
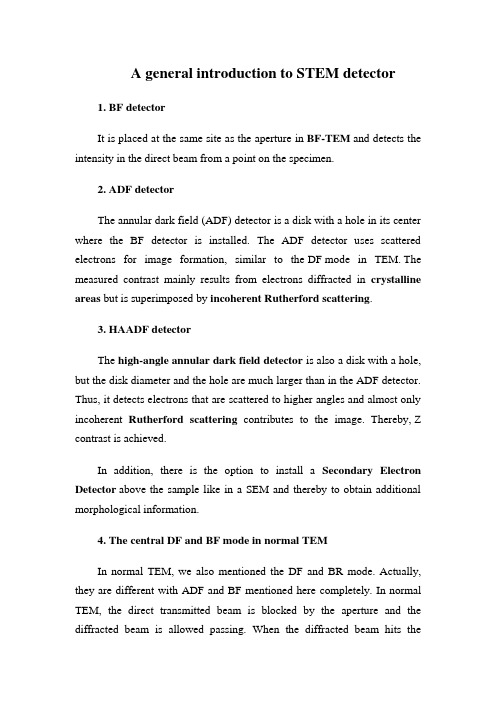
A general introduction to STEM detector1. BF detectorIt is placed at the same site as the aperture in BF-TEM and detects the intensity in the direct beam from a point on the specimen.2. ADF detectorThe annular dark field (ADF) detector is a disk with a hole in its center where the BF detector is installed. The ADF detector uses scattered electrons for image formation, similar to the DF mode in TEM.The measured contrast mainly results from electrons diffracted in crystalline areas but is superimposed by incoherent Rutherford scattering.3. HAADF detectorThe high-angle annular dark field detector is also a disk with a hole, but the disk diameter and the hole are much larger than in the ADF detector. Thus, it detects electrons that are scattered to higher angles and almost only incoherent Rutherford scattering contributes to the image. Thereby, Z contrast is achieved.In addition, there is the option to install a Secondary Electron Detector above the sample like in a SEM and thereby to obtain additional morphological information.4. The central DF and BF mode in normal TEMIn normal TEM, we also mentioned the DF and BR mode. Actually, they are different with ADF and BF mentioned here completely. In normal TEM, the direct transmitted beam is blocked by the aperture and the diffracted beam is allowed passing. When the diffracted beam hits thescreen and forms a image which is called as DF. Otherwise, diffracted beam is blocked with aperture and transmitted beam forms BR image.However, in STEM mode, they are totally different because the beam on sample is cone-shaped beam rather than parallel light.STEM模式和TEM模式的对比图Z-contrast actually uses an annular detector which can only collect the scattered electrons outside the beam cone. That is to say, the transmitted electrons inside beam cone are involved. This is good thing for other imaging mode because diffraction contrast was avoided and the imaging only has dependence on atomic structure. This imaging mode is called as STEM-HAADF. Here, two issues are not addressed yet. One is whether STEM-BF and STEM-ADF imaging involves diffraction contrast. Personally, I think STEM-ADF should involve phase contrast and Z contrast. For STEM-BR, phase contrast is greatly involved. However, in case of HAADF, only Z-contrast works.Camera Length affects the Inner Collection angel. In our TEM, when camera length is 11 cm, the inner collection angel is 60 mrad. Once the camera length reducing to 5 cm, the inner collection angel is 110 mrad. Therefore, the collection angle is controlled by the camera length. Whoaffects the camera length? According to equation (L=f*Mp*M l) where f is the focal distance of objective lens (f is related with the excited current, acceleration voltage, the number of coil), Mp and M l are the magnification of projective lens and intermediate lens respectively. Experimentally, the f can be changed significantly through adjusting the excited current. Besides, in order to change the camera length, you also can change the excited current of projective lens or intermediate lens. When inner collection angle is bigger than 100 mrad, the Rutherford scattering dominates the imaging.The inner angles for HAADF detectors are at least three times the angle of electron-probe-forming aperture. In many cases of HAADF imaging, the annular detection angle was practically set to be 60 - 170 mrad due to the limitation of combinations between aperture sizes and camera lengths. Above image shows the positions of the detectors which can be installed in a STEM system. Depending on the scattering angle of the transmitted electrons, various signals can be detected as a function of the position of thescanning probe: BF (bright-field)-STEM, DF (dark-field)-STEM or HAADF (high angle annular dark field)-STEM.The DF detectors are annularly shaped to maximize the collection efficiency and the range of the collected scattering angles can be adjusted through the magnification of the intermediate lenses.FEI HAADF detectorChapter 1. Introduction to STEMSome TEMs have scanning coils which allow them to be used as a scanning transmission electron microscope (STEM). In STEM, a conical electron beam is focused through the specimen by a lens in front of the specimen (C2 and the objective lens pre-field which is also called mini lens), as shown below.The optical configuration is roughly the same as simply forming an image of the filament by focussing C2 the very first experiment we did in the electron microscope. In fact, if your microscope has a twin objective lens including pre-field and backfield, the optics are a little bit more complicated, but lets start thinking about things as simply as possible.The small beam cross-over at the specimen plane is usually called an Electron Probe. Images can be formed by moving the probe across the specimen (by the double- deflection shift coils) and detecting the transmitted electrons, which are either on the optic axis (to form a bright-field (BF)image) or have been scattered to high angles, to form a dark-field image (DF).In order to make an image, we have to display the signal coming out of one or more detectors in some way. This is usually done on a slow-scan television screen (although it is nowadays also done by computer). The signal detected is used to modulate the intensity of the image on the display screen, while the scan of the display is synchronised accurately with the position of the probe on the specimen. Usually, the same scan generator is used to control both the x-y position of the small beam (or probe) shift deflection coils and the coils that control the display screen. The principle is the same as a conventional scanning electron microscope.A STEM doesn’t actually need any lenses below the specimen at all, because everything important happens before the electrons reach the sample. In practice, a TEM/STEM has all the usual objective lens and projector lenses below the sample (shown as a dotted box above), but in STEM mode these are just used to change the effective camera length (that is, the distance between the specimen and the detector plane). They can also be used to form an image of the electron probe.Although there are certain benefits of STEM imaging (which have not been generally been recognised until quite recently), the main advantage of this geometry is the fact that the probe can be used to irradiate a very small volume of specimen in order to obtain all sorts of other signals such as characteristic X-rays, Auger or secondary electrons, or electron energy-loss spectra. All these signals can be spatially resolved at a resolution corresponding to the width of the probe, thus allowing for high resolution micro- analysis. For the material scientist, analytical signals like these can be much more useful than simply images, say to identify the elements present in an inhomogeneous sample.Chapter 2.The Ronchigram(水纹相)Experiment: Load a test specimen of polystyrene spheres, shadow coated with gold particles on a carbon film. Line up the microscope as usual in normal TEM mode. Select the largest condenser aperture and centre it.Ask the demonstrator: Show me how to put the microscope into STEM mode, with the scan switched off. Please align the condenser lens, aperture and stigmators (消散器), and objective rotation centre (current and HT centre), so that I can see a reasonably well-aligned Ronchigram.Let’s start by not actually scanning the probe at all. Examine what we see on the phosphor screen at the bottom end of the electron microscope. The rays coming out of the sample have conical shape, formed by the condenser aperture, and this cone eventually hits the phosphor screen, where it forms a bright circle. The circle is called the 'Gabor hologram', the 'Ronchigram' or the 'central zero-order disc of the convergent beam electron diffraction pattern' depending on the context and who is talking about it. I'm going to call it the Ronchigram. It provides the best way of lining up a STEM, and it will also teach us a lot about electron lens aberrations.Experiment: Look at the Ronchigram. Start by going through focus on both C2 and the objective lens. Move the specimen.You will find that the Ronchigram looks pretty strange, a sort of fish-eye view of the specimen. Go through focus with either the objective or C2 (Note: the objective lens is the pre-field objective lens). If you want to increase the contrast, go up in spot size. Weird shapes move in and out with over focusing and under focusing. If the microscope is well aligned, the Ronchigram from an amorphous specimen should look something the next figure, which has been calculated in a computer:Well, why does the Ronchigram look like this? As a first approximation, what we should see is a shadow image cast by the specimen which reverses as we change the cross-over of the beam near the specimen, as shown below:When the beam is crossing over exactly at the specimen, there will be a burred mess over the whole disc (middle picture above). If the specimen has some feature, like the curly P above, then above and below focus we see a shadow of that feature cast onto the central disc, and magnified according to how far away the beam cross-over is above or below the specimen.Experiment: Turn C2 from a zero setting, slowly increasing its strength. You should see the image reversal. All this occurs at a rather low setting of C2. At higher settings, the Ronchigram may get focussed into a bright spot and undergo a second reversal. However, this reversal is to do with the way we are using the lower part of the microscope (below the specimen plane) to image the cone of illumination coming out of the specimen. Concentrate on the low settings of C2.In fact, the behaviour of image is much more complicated than the figure above suggests because of the effects of aberrations in the lens. Allsorts of aberrations may be present in C2, but these tend to over-focussinghigh angle beams (ones that pass well off-centre), bringing them to a premature focus, i.e. a focus that is nearer the lens than it should be.To understand this, first consider a perfect lens. A perfect lens, by definition, focuses all beams from the source to a single point, as shown below.If we have aberration presents, high-angle beams tend to be over-focussed, so that they focus at a plane above the plane of perfect focus, like this:How is this extra complication going to affect what we see in the Ronchigram? Start by thinking about just two sets of beams: two which are virtually 'paraxial' (which means that they are traveling very close the centre of the lens) and which therefore come to the correct focal point of the lens (a point which is called the Gaussian focus); and two which are at very high angle, or close to the very edge of the condenser aperture, as shown below.Now, when the probe-forming lens is highly over-focussed (which in this experiment means that C2 is moderately excited), all the beams,including the paraxial and high- angle beams, cross-over before they reach the specimen. What we see is just a shadow-image Ronchigram as we would expect, although there will be a slight change in magnification between areas near the centre of the Ronchigram and its edge.Similarly, when the lens is highly under-excited, we see a reversed shadow image, again slightly distorted in magnification. However, near focus there is a peculiar region which I have called the 'region of radial inversion' in the figure above. When the specimen is lying somewhere in this region (or the lens has been adjusted accordingly), paraxial beams are crossing below it, but high-angle beams are crossing above it. In the Ronchigram, the centre of the pattern has undergone a reversal; the edge of the pattern is still in the over-focused orientation.Experiment: On a well-aligned Ronchigram, focus C2 so that the magnification of the image is at maximum. Under-focus slightly and move the specimen. You should be able to find a condition where the centre of image moves in one direction, while the outer area moves in the opposite direction. If you do, then you are within the region of radial inversion. If all you can see are streaking effects and asymmetric stretching of areas of the Ronchigram, then the lenses have not been lined up properly, or the astigmatism in the condenser lens has not been corrected.Look again carefully at the artificial Ronchigram:There are two characteristic rings, which you should be able to see experimentally as well. When the focus is set within the region of radial inversion, there is a central circular area where we see just a normal shadow image at rather high magnification. There is then a ring where everything is streaked out in the radial direction: this is called the ring of infinite radial magnification. At a higher radius, there is a ring where everything is streaked out into a circular pattern: this is called the ring of infinite azimuthal magnification. We don't have to understand why this happens like it does - it is all to do with the mathematics of how much the rays miss Gaussian focus as a function of their angle through the lens.What is important is that the Ronchigram must be circularly symmetric if you want to get a good STEM image.Experiment: Put the C2 stigmators onto their coarsest setting, and change them by a large amount. Watch the Ronchigram as a function of C2 defocus, especially at or near Gaussian focus (i.e. when you can see a highly magnified blob at the centre of the Ronchigram). You should see streaking shapes, which are like ovals or figures of eight.If you can't see any of the effects we've talked about, then the lenses are not properly aligned. Let’s first discuss in more detail how the lenses are arranged.Chapter 3.Lens geometry in STEM mode on aTEMIn normal TEM mode, we have two cross-overs below C2, the lower one occurring within the objective pre-field, as shown in the elementary guide. One way of forming a probe would be to de-excite C2, as we did in the very first experiment in first section of the TEM guide, but then we still have a second cross-over which is happening somewhere odd within the pre-field.Greater flexibility and an optimized probe focus can be obtained by avoiding the cross-over within the objective pre-field. In practice, this is achieved by either lowering the overall objective excitation or (depending on the make of microscope) using another small lens within the upper part of the objective twin lens, which is called either a mini-condenser or mini-lens. When the machine is being run in normal TEM mode, this lens is run in the same sense as the objective, making the pre-field very strong. When STEM mode is selected, the mini-lens is WEAKENED (or switched off), and so it cancels out the pre-field to a certain extent.The next Figure illustrates conventional TEM imaging:Where the top lens is C2, and the two lower lenses represent the objective pre-field (and/or the objective lens pre-field boosted by a condenser mini-lens or objective mini-lens).Now when we go into STEM mode, most microscopes reduce theinfluence of the pre-field, so now the ray-diagram looks like this:Note that both C2 and the objective lens affect the focus of the electron probe. Because C2 is so weakly excited, you can see from the figure above that it will have a huge effect on the convergence angle of the illumination at the specimen plane. For this reason, many manufacturers fix the value of C2 in STEM mode. To obtain control of it, the user has to override the computer.Remember: In STEM, the only electron optics that matter all happen before the specimen. Alignments you made relating to TEM imaging, especially the objective focus (this is the backfield objective focus below the specimen) and stigmation, are useless in STEM mode. We must alter the objective lens (thus altering the pre-field above the specimen) and C2 to control the alignment. The relevant stigmators for STEM mode are the condenser stigmators, not the objective stigmators.Now that we know that two lenses are involved in the forming probe, we can work how to line them up with one another. The most sensitive mis-alignment arises from the double- deflection coils being on the wrong tilt setting. If the beam tilt is wrong, the beam from C2 passes into the objective pre-field off-axis and at an angle. It will come out below the specimen also at the wrong angle: this is most common reason for losing the beam in STEM or nano-probe mode at high camera lengths.The first thing to get right in STEM mode is therefore the objective rotation centre. The alignment is almost certainly not the same as for TEM, because the objective is in a completely different state, and we are aligning with respect to the pre-field, not the main body of the lens below the specimen. Similarly, the condenser aperture is almost certainly off-line, even if you lined it up in TEM mode.All the corrections are best done in the electron Ronchigram.Experiment:(A)Wobble the objective lens, and try to get the image moving in and out symmetrically with the condenser (we assume here that this is on line). As you alter the beam tilt (this should be the correction you are adjusting on the multi-function knobs when aligning in STEM mode), the whole Ronchigram will at the same time bodily move across the phosphor screen. That's because the conical beam cast by the condenser lens is rocking like a lever through the specimen, and moves all over the far-field plane, like the sweep of a torch beam. Start with a large condenser aperture. The aim is to get a stationary shadow image at the very centre of the disc you can see on the screen.Just get the rotation centre roughly right, stop the objective wobbling, and then change C2. (Remember that on most machines you may have over-ride the C2 setting). Is the Ronchigram going in and out symmetrically around a point at the centre of the condenser aperture? If not, shift the condenser aperture onto that axis. If in any doubt at all, leave the condenser aperture where it was correct for TEM imaging. You will not get a perfect STEM image, but neither will you lose the beam, which is very easy at this stage.Now go back and wobble the objective lens again. When both these centres are roughly co-incident with the condenser aperture, set C2 at the value you are going to use it in STEM mode.(B)Focus the objective to get the Ronchigram to 'blow up' into infinitive magnification at its centre. Adjust the condenser stigmators so that the Ronchigram changes symmetrically as a function of defocus. This takes some practice. (Remember that the objective stigmators, which are below the specimen, are useless in STEM mode, although you should try to set them roughly right in TEM mode before switching to STEM mode.)If in doubt, wait until you are in scanning mode and can see an image on the scanning monitors before you attempt to correct astigmatism. However, note that if the stigmators are wrong and you change them later, all the above alignments should be re-iterated if you want the best probe possible. Misalignment, tilt, astigmatism, defocus and spherical aberration (which is the thing that makes the Ronchigram look the way it does) are all just lens aberrations that add up and affect the focus of the probe. Change any one of these variables, and another one will no longer be optimal.(C)Whatever you do, don't try turn C2 so high that what you see on the phosphor screen reaches a focus. This is bound to look astigmatic - but don't correct the condenser stigmators in this condition. Set C2 at its STEM mode setting. Now focus the objective lens: in other words, change the focus until the Ronchigram magnification is a maximum (i.e. the intensity distribution 'blows up' at its centre). If there is astigmatism present, the Ronchigram will not 'blow up' into a uniform infinite magnification blob. Instead, it will look stretched in one direction at one setting of objective defocus, and stretched roughly at right-angles at another setting of defocus. Set the objective between these two extremes, and then correct the condenser stigmators, turning them so that whatever you see spreads more uniformly over the Ronchigram. If the stretching of the image gets more extreme, you're turning the stigmator the wrong way.As a general rule, for the best scanning probe resolution, you should select a condenser aperture size that just selects the middle 'flat' area of intensity in the Ronchigram when it is just in focus. 'Just in focus' means that as we decrease focus from above the beam cross-over setting, the very centre of the Ronchigram has just exploded into a blob, but has not yet become a clear inverted shadow image. Because changing spot size changes the value of C2 as well as C1 (in STEM mode), and this affects the angle ofconvergence at the specimen, the size of the condenser aperture needed to fulfill this condition may also change.Chapter 4.Pivot pointsBefore we begin to scan the probe to make a STEM image, it is essential to check the pivot points. (Sadly, this is not possible on all makes of machine because it is regarded as 'too difficult' by the manufacturers. However, you can usually obtain access to the control indirectly via the computer.) Think of the following diagram, where the pivot points are incorrectly adjusted:In an ideal world, the probe continues to point in exactly the same direction as it is scanned over the specimen by the beam shift coils. However, if the rocking point of the scan coils is wrong, the beam tilts as well as shifts (see introductory guide if you have forgotten the meaning of tilt and shift). This has two consequences: the Ronchigram moves relative to the detectors as the probe is scanned, and the magnification of the STEM image will not be calibrated. At worst, the beam may be only tilting, and not moving laterally at all, in which case the apparent magnification of the STEM image will be much higher than the nominal value. Note that this pivot point adjustment is quite different to the pivot point values in TEMmode. In the latter, we adjust for a stationary probe as a function of tilt; here we adjust for stationary tilt as a function of shift. We are aiming for shift purity.There are different ways of making this adjustment on different machines. It is essential to correct it for each spot size and/or objective/condenser combinations of setting. The way the beam shift interacts with the objective pre-field means that the degree of tilt can be strongly correlated to strength of the objective.Ask the demonstrator: How do I adjust the pivot points in STEM mode?If in doubt, one way of doing this is to assume the objective aperture is truly in the back focal plane of the objective lens (Usually, it is not quite in the back focal plane). If we pretend it is in the back focal plane, then a way of testing the pivot points is to select diffraction mode and observe the Ronchigram. Insert a small objective aperture (smaller than the Ronchigram), which should cast a shadow over the Ronchigram, and switch on the pivot point adjustment.If two objective apertures become visible, the diffraction lens is not focusing on the back focal plane; focus the diffraction lens until only one objective aperture is visible. Now remove the objective aperture and adjust the STEM pivot points until the two Ronchigrams are superposed. Note that in STEM mode, focusing the diffraction lens in diffraction mode does not mean making the beam make a sharp point (as in TEM diffraction), because there a very large range of angles present in the conical beam coming out of the specimen.Why two objective aperture images are visible when diffraction lens is not focusing on the back focal plane?Chapter 5.Aligning the detectorsOnce we have corrected the Ronchigram and the pivots, then all we have to do is get the detectors lined up with the beam coming out of the bottom of the specimen. In a TEM/STEM, the STEM detectors are usually mounted below the phosphor screen, and normally you can't actually see them. Quite often, because of space constraints, they are not mounted on the centre line of the microscope, but are off to one side.Ask the demonstrator: Please tell me roughly where the detectors are relative to the centre of the phosphor screen.There are normally two detectors. A solid-state circular disc is used to collect the bright-field signal. Around it is mounted another solid-state detector in the shape of a circular annulus, which is used to collect all the dark- field electrons: that is, all the electrons which have scattered to a large angle outside the cone of the Ronchigram. Looking down on the two detectors, they look like this:The STEM imaging will only work properly if we get three variables correctly adjusted: the camera-length (i.e. the effective distance or magnification between the specimen and the detector plane) and the x- and y-shift of the detector plane. It sounds simple, but there are a lot of things that can go wrong. This brings two questions. One is how to adjust the camera length and another is how to shift the detector plane? Anotherimportant issue is why the camera length is one critical factor which affects the STEM imaging.Suppose for a moment that the detectors are on the optic axis. What effect does changing the camera length have? Look at the next diagram.At very short camera-lengths (This means the image magnification is very low), the disc of the Ronchigram will be much smaller than the disc of the bright-field detector. This condition is good for dark-field imaging, because the annular detector is effectively lying at a high angle which is what we want for easy image interpretation. The image contrast is roughly proportional to the Rutherford scattering of electrons from the atomic nuclei. NOTE: ABOVE STATEMENT IS JUST SUITED TO THE ALLIGNMENT.As the camera length increases, the Ronchigram gets bigger and bigger, until it reaches a point where it covers the whole bright-field detector. In this condition, the signals on both the dark-field and bright-field detectors are at a maximum, although the contrast on both images will be rather poor.Why the disc of the Ronchigram much smaller than the disc of the BF detector is good for DF imaging?At even longer camera lengths, both the bright-field detector and the annular dark field detector are covered by the Ronchigram. In this condition, the bright-field image is very noisy and has low intensity, but it will have much more contrast and will be more like a conventional bright- field image in TEM mode.However, for any one camera length, think of all the things that can go wrong if the detector is not properly aligned, as shown in the next figure:Clearly, if the Ronchigram misses both detectors (which, by Sod's Law, is the most likely occurrence) then we will see nothing at all on the STEM monitors, because very few electrons will be hitting either of the detectors.If the detector is almost aligned correctly, the central disc of the Ronchigram will hit the dark-field detector, but miss the bright-field detector. Under these circumstances, the signal displayed on the so-called dark-field monitor will be bright, and will look like a bright-field image, because it is collecting all the electrons which have passed through the specimen. Even worse, the so-called bright-field detector will be detecting high-angle scattered dark-field electrons, and so it will look like a dark-field image. Because the annular dark-field detector is so much larger than the bright-field detector, there are many more ways to get this inversion of signals to occur than to get the signals the right way round. For this reason, people often spend many happy hours thinking the monitors on the STEM are the wrong way round.。
扫描电子显微镜和透射电子显微镜分析

扫描电子显微镜和透射电子显微镜分析摘要:电子显微镜是利用电子与物质作用所产生之讯号来鉴定微区域晶体结构,微细组织,化学成份,化学键结和电子分布情况的电子光学装置。
而常用的就是扫描电子显微镜以及透射电子显微镜。
而通过电子显微分析具有高分辨率等特点,故广泛的应用于化学、生物、医学、冶金、材料等领域等重要各个研究领域和工业部门。
关键词:扫描电子显微镜;透射电子显微镜;实例分析•扫描电子显微镜扫描电子显微镜不是通过电磁透镜放大成像的原理,而是以类似于电视摄像纤维方式,利用细聚焦电子束在样品表面扫描时激发出来的各种物理信号而来调制成像。
当高能的入射电子轰击物质表面时,被激发的区域将产生二次电子、俄歇电子、特征x射线和连续谱X射线、背散射电子、透射电子,以及在可见、紫外、红外光区域产生的电磁辐射。
同时,也可产生电子-空穴对、晶格振动(声子)、电子振荡(等离子体)。
原则上讲,利用电子和物质的相互作用,可以获取被测样品本身的各种物理、化学性质的信息,如形貌、组成、晶体结构、电子结构和内部电场或磁场等等。
由于电子枪的效率的不断提高,使扫描电子显微的样品室附近的空间增大,可以装入更多的探测器。
因此,目前扫描电子显微镜不只是分析形貌像,它可以和其他分析仪器组合,使人们能在同一台仪器进行形貌、微区成分和晶体结构等多种微观组织结构信息的同位分析。
•电子显微镜原理和主要结构扫描电子显微镜主要是通过背散射以及二次电子等物理信号成像,它工作是这样的:从电子枪灯丝中发出约为25~30μm的电子束,在受到了阳极的高压加速后,射向镜筒,经过光镜与物镜的聚焦之后,在样品表面形成一个具有一定能量、强度、斑点直径的电子束。
在扫描线圈的磁场作用下,入射电子束在样品表面上按照一定的空间和时间顺序做光栅式逐点扫描。
由于入射电子与样品之间的相互作用,将从样品中激发出二次电子。
由于控制镜筒入射电子束的扫描线圈的电路同时在控制显像管的电子束成像,用这样方式一点一线组成了像。
扫描透射电子显微镜

虽然扫描透射电子显微镜的分辨率 已经非常高,但仍受到电子束穿透 深度的限制。对于较厚的样品,可 能无法获得清晰的图像。因此,需 要进一步优化电子束的聚焦和扫描
扫描透射电子显微镜
缺点
(1) 成本高:扫描透射电子显微镜的价格较 高,需要投入大量的资金 (2) 技术难度大:相对于其他电子显微镜, 扫描透射电子显微镜的技术难度较大,需要 专业的技术人员操作和维护 (3) 对样品的要求较高:扫描透射电子显微 镜对样品的厚度和均匀性要求较高,需要选 择合适的样品进行观察
扫描透射电子显微镜
扫描透射电子显微镜的优缺点
优点
扫描透射电子显微镜
1
扫描透射 电子显微 2
镜
3
(1) 高分辨率:扫描透射电子显微镜具有原子尺度的 分辨率,可以观察到样品的微观结构和细节
(2) 样品制备简单:相对于其他电子显微镜,扫描透 射电子显微镜的样品制备相对简单,不需要特殊的样 品制备技术
(3) 多种分析功能:扫描透射电子显微镜可以配备多 种分析功能,如能量散射谱(EDS)、X射线能谱(XEDS) 等,可以对样品进行多方面的分析
技术,以提高穿透深度和分辨率
扫描透射电子显微镜
分辨率 与穿透 深度
数据分 析与处
理
设备成 本与维
护
扫描透射电子显微镜产生的数据量 巨大,需要高效的数据处理和分析 技术。目前,尽管有许多算法和软 件可用于数据处理,但仍需要进一 步优化以提高效率和准确性
扫描透射电子显微镜的价格较高, 且需要专业的技术人员进行操作和 维护。这限制了其在一些科研机构 和学校的普及。因此,需要降低设 备成本,并简化操作和维护流程, 以扩大其应用范围
实验四 透射和扫描电镜的样品观察

实验四透射和扫描电镜的样品观察课程名称:细胞生物学实验实验日期:2014年10月27日班级:试验121(青岛)姓名学号:刘香凝sy0040一、实验原理用电子束成像的显微镜称为电子显微镜。
电子显微镜是一种高精密度的电子光学仪器,它具有较高的分辨力和放大倍数,是观察和研究物质微观结构的强大工具。
根据成像原理的不同,电镜分为透射电子显微镜和扫描电子显微镜。
(一)、透射电子显微镜原理透射电镜主要用于观察生物样品内部精细的结构,用于透射电镜观察的样品往往需制备成超薄切片。
1、透射电镜的基本构造1)电子束照明系统:照明系统由电子枪和聚光镜两部分组成。
电子枪位于镜筒顶端,由阴极——控制极——阳极构成三级电子枪。
电子枪是电子束的发射装置,由高频电流加热钨丝激发电子,并用高压使电子加速。
聚光镜的作用是将电子枪发出的电子束会聚于样品平面,并调节试样平面处电子束孔径角、电流密度和照明光斑半径.2) 电镜成像系统由样品室、物镜、中间镜和投影镜组成。
通过聚光镜会聚的电子束穿过样品,经物镜放大形成一级放大像,再经中间镜和投影镜进行二级和三级放大。
最后在荧光屏上形成最终的放大像,通过调节中间镜和投影镜电流,放大倍数能从几百倍连续改变到十几万到几十万倍。
聚光镜、物镜、中间镜与投影镜等都是电磁透镜。
电磁透镜是精密加工的中空圆柱体,里面置线圈,通过线圈电流的大小,调节磁场强度使电子束发生偏转,汇聚或发散,最终结果正如光线透过玻璃透镜一样,可以聚焦成像。
3)真空系统由气泵组成,保持镜筒内高真空,由于电镜是利用高速的电子束为照明源,在电子束的通道上不能有任何游离的气体存在,否则将发生电子与残余气体原子的碰撞,引起电离,放电等反应,易烧坏灯丝获污染样品。
4) 记录观察系统包括荧光界和照明系统。
镜筒最下面部位是观察窗。
窗口由防护X射线的一定厚度的铅玻璃组成。
观察窗内下方是荧光屏,荧光屏上的荧光物质通常由硫化锌或硫化锌与硫化镐的粉末组成。
它们在电子束的照射下产生荧光,使电子像转化为肉眼可见的可见光图像。
扫描电镜显微分析

扫描电镜显微分析扫描电镜显微分析实验报告一、实验目的1、了解扫描电镜的基本结构和原理。
2、掌握扫描电镜试样的制备方法。
3、了解扫描电镜的基本操作。
4、了解二次电子像、背散射电子像和吸收电子像,观察记录操作的全过程及其在组织形貌观察中的应用。
二、实验内容1、根据扫描电镜的基本原理,对照仪器设备,了解各部分的功能用途。
2、根据操作步骤,对照设备仪器,了解每步操作的目的和控制的部位。
3、在老师的指导下进行电镜的基本操作。
4、对电镜照片进行基本分析。
三、实验设备仪器与材料Quanta 250 FEG 扫描电子显微镜四、实验原理(一)、扫描电子显微镜的基本结构和成像原理扫描电子显微镜(Scanning Electron Microscope,简称SEM)是继透射电镜之后发展起来的一种电子显微镜简称扫描电镜。
它是将电子束聚焦后以扫描的方式作用样品,产生一系列物理信息,收集其中的二次电子、背散射电子等信息,经处理后获得样品表面形貌的放大图像。
扫描电镜主要由电子光学系统;信号检测处理、图像显示和记录系统及真空系统三大系统组成。
其中电子光学系统是扫描电镜的主要组成部分,主要组成:电子枪、电磁透镜、光栏、扫描线圈、样品室等,其外形和结构原理如图1所示。
由电子枪发射出的电子经过聚光镜系统和末级透镜的会聚作用形成一直径很小的电子束,投射到试样的表面,同时,镜筒内的偏置线圈使这束电子在试样表面作光栅式扫描。
在扫描过程中,入射电子依次在试样的每个作用点激发出各种信息,如二次电子、背散射电子、特征X射线等。
安装在试样附近的探测器分别检测相关反应表面形貌特征的形貌信息,如二次电子、背散射电子等,经过处理后送到阴极射线管(简称CRT)的栅极调制其量度,从而在与入射电子束作同步扫描的CRT上显示出试样表面的形貌图像。
根据成像信号的不同,可以在SEM的CRT上分别产生二次电子像、背散射电子像、吸收电子像、X射线元素分布图等。
本实验主要介绍的二次电子像和背散射电子像。
扫描透射电子显微分析技术
第五章扫描透射电子显微分析技术(STEM)本章主要内容5.1 STEM概述及发展史51STEM5.2 STEM构造及工作原理5.3 STEM主要功能及应用5.4 STEM最新进展及发展趋势参考书:R.J.Keyse et al,Introduction to Scanning Transmission Electron Microscopy, 参考书:R J Keyse et al Introduction to Scanning Transmission Electron Microscopy BIOS Scientific Publishers Limited,1998。
51STEM STEM是指透射电子显微镜中有扫描附件者,尤其是指采发射电枪作成的扫描透射电镜扫描透射5.1 STEM概述采用场发射电子枪作成的扫描透射电子显微镜。
扫描透射电子显微分析是综合了扫描和普通透射电子分析的原理和特点而出现的一种新型分析方式STEM能够获得TEM所特点而出现的一种新型分析方式。
STEM能够获得TEM所不能获得的一些关于样品的特殊信息。
STEM技术要求较高,要非常高的真空度,并且电子学系统比TEM和SEM都要复要非常高真度,并子学系和都要复杂。
扫描透射电子显微镜是透射电子显微镜的一种发展。
扫描透射电子显微镜是透射电子显微镜的种发展扫描线圈迫使电子探针在薄膜试样上扫描,与扫描电子显微镜不同之处在于探测器置于试样下方,探测器接受透射束散射束放在荧光电子束流或弹性散射电子束流,经放大后,在荧光屏上显示与常规透射电子显微镜相对应的扫描透射电子显微镜的明场像和暗场像明场像和暗场像。
51STEM为什么发展和使用STEM技术?5.1 STEM概述TEM STEM电子束平行束、会聚束非常小而亮的会聚束(电子探针)105A)(<1nm,>0.5nA)成像所有成像信号同时记录,图像放大有投影镜控制成像信号逐点记录,图像放大不需要投影镜衍射模式利用平行束利用会聚束结构几何需要投影镜不需要投影镜,有足够的空间配置各种检测器STEM优点:1利用STEM可以观察较厚的试样和低衬度的试样1. 利用STEM可以观察较厚的试样和低衬度的试样。
扫描电子显微镜分析
随着被分析晶体污染程度的增加和晶体完整性的降低,花样 会变得模糊不清,甚至消失。
C、花样的测量和计算
对于电子通道花样的几何测量:
(1)确定投射原点的位置;这是进行一切几何测量的基本 参考点。用实验方法确定,采取把扫描线圈的帧扫描和行 扫描电源分别依次中断的办法,在荧光屏上依次获得一条 水平扫描线和垂直扫描线,其交点Байду номын сангаас为投射原点。
如果得到的电子通道花样已经进行了晶体学注释,则分析 单晶体取向的方法有两种情况:
图5 从电子通道花样 分析单晶取向示意图 (a)晶带轴平行于 光轴;(b)晶带轴 不平行于光轴
(1)如果两个电子通道带所属晶带轴的极点和投影原点重合 (图5-a),则晶带轴方向[uvw]即代表单晶表面法线的晶体学 方向。其中[uvw]可以由如下关系式求得:
从上式可求出(x, y, z),然后把x、y、z化为3个互质的最 小整数x’、y’、z’,( x’, y’, z’)就是被分析晶体表面的晶 体学方向。 对于多晶试样,可以采用逐个晶粒取向的测定得出试样的织 构(需要选择有代表性的区域并测试足够数量的晶粒)。
点阵常数的测定:把待测试样放在试样台上,再在其旁边放 置合适的标准试样,然后依次记录下两个试样的电子通道花 样。通过对花样的分析,分别求出待测试样和标准试样的面 间距d1、d0和衍射角θ1、θ0。由于两个试样的实验条件相同, 所以
有不同的布拉格角,因此,入射束做面扫描时,将在不同
扫描点上产生与各自(hkl)晶面相对应的
的
区域,结果在荧光屏上出现一系列属于各自(hkl)晶面的
电子通道带,即电子通道花样。
B、电子通道花样的特点
电子通道花样出现的条件:晶体比较完整,电子束的扫描范 围大于布拉格角。
透射式电子显微镜实验

物理仿真实验报告项目名称:透射式电子显微镜实验院系名称:专业班级:姓名:学号:透射式电子显微镜实验一、实验目的在软件虚拟的环境中,了解对透射电子显微镜的基础操作流程;结合原理的介绍,了解它们的意义。
二、实验原理图1图1表示:透射电子显微镜由电子枪(照明源、接地阳极、光阑等)、双聚光镜、物镜、中间镜、投影镜等组成. 电子显微镜的热发射电子枪由高温的钨丝尖端发射电子,高级的场发射电子枪在高电场驱动下通过隧道效应发射电子. 场发射电子束的亮度显著提高,同时能量分散度(色差)显著减少,使电子束直径会聚到1nm以下仍有相当的束流.双聚光镜将电子枪发出的电子会聚到样品,经过样品后在下表面形成电子的物波,物波经过物镜、中间镜、投影镜在荧光屏或照相底片上形成放大象.图2为了获得更高的性能,目前生产的新型TEM的结构更为复杂(图2),如透镜有:聚光镜两个,会聚小透镜,物镜,物镜小透镜,三个中间镜,投影镜等. 这样的结构可以在很大范围内改变像的放大倍数,并被用来实现扫描透射成像(STEM,需要利用偏转线圈)、微衍射和微分析(加上X射线能谱仪).图3图3是透射电子显微镜阿贝成像原理光路图. 物波在物镜的焦平面上形成衍射图样,各个衍射波经过透镜汇聚成第一中间像。
改变中间镜、投影镜电流(即改变它们的焦距),将试样下表面的物波聚焦到荧光屏或底片上得到的是显微像(左). 当中间镜、投影镜改变焦距将焦平面的衍射图样聚焦到荧光屏或底片上得到的是衍射图样(右). 透射电子显微镜的一大优点是:可以同时提供试样的放大像和对应的衍射图样。
得到显微像后在第一中间象处放置选区光阑选出需要的局部图象,再次得到的衍射图样就是和选区(最小选区为几百nm)图像对应的电子衍射图样.图4图4(动画)分别演示显微象和衍射图样的形成过程.先用闪烁的红色箭头表示试样、第一中间象、第二中间象和显微象的形成过程.接着用闪烁的三个圆斑表示物镜焦平面上的衍射图样经过中间镜和投影镜形成衍射图样的过程.三、实验仪器透射电子显微镜主要部件电子枪电子枪有四种:热发射W电子枪,热发射LaB6电子枪,热场发射W (100)电子枪和冷场发射W(310)电子枪. 前两种利用高温下电子获得足够能量逸出灯丝,后两种利用高场下电子的隧道效应逸出灯丝,它们的性能及使用条件见下表.热发射LaB6灯丝比热发射W亮度高,束斑小,能量发散度小,使用温度低,但真空度需提高. 产品更先进的场发射电子枪性能更好,但真空度需更高,并且价格昂贵. 利用场发射枪,可以获得半高宽为0.5nm的电子束。
扫描电镜工作原理

扫描电镜工作原理扫描电镜(Scanning Electron Microscope,SEM)是一种常用的高分辨率显微镜,它利用电子束与样品的相互作用来获取样品的表面形貌和成分信息。
下面将详细介绍扫描电镜的工作原理。
一、电子束的产生与聚焦扫描电镜中的关键部件是电子枪,它通过热发射或场发射的方式产生高能电子束。
电子束经过聚焦系统,通过一系列的电磁透镜进行聚焦,使电子束变得更加细致和聚焦,从而提高分辨率。
二、样品的制备与加载在进行扫描电镜观察之前,需要对样品进行制备。
常见的样品制备方法包括金属涂层、冷冻切片、离子切割等。
制备完成后,将样品加载到扫描电镜的样品室中。
三、扫描电子显微镜的工作模式1. 透射电子显微镜模式(TEM)透射电子显微镜模式是将电子束穿透样品,然后通过样品上的透射电子显微镜探测器进行成像。
这种模式适用于对样品内部结构的观察,可以提供高分辨率的成像。
2. 扫描电子显微镜模式(SEM)扫描电子显微镜模式是将电子束聚焦到样品表面,然后通过样品表面反射的次级电子、反射电子或后向散射电子进行成像。
这种模式适用于对样品表面形貌和成分的观察。
四、扫描电子显微镜的成像原理1. 次级电子成像(SEI)次级电子成像是通过探测样品表面次级电子的信号来获得图像。
当电子束与样品表面相互作用时,会产生次级电子。
这些次级电子被探测器捕捉到,并转换成图像。
2. 反射电子成像(BEI)反射电子成像是通过探测样品表面反射电子的信号来获得图像。
当电子束与样品表面相互作用时,一部分电子会被样品表面反射出来,这些反射电子被探测器捕捉到,并转换成图像。
3. 后向散射电子成像(BSEI)后向散射电子成像是通过探测样品表面后向散射电子的信号来获得图像。
当电子束与样品表面相互作用时,部分电子会发生散射,并改变其运动方向。
这些后向散射电子被探测器捕捉到,并转换成图像。
五、扫描电子显微镜的分辨率扫描电子显微镜的分辨率是指它可以分辨出两个相邻物体之间的最小距离。
- 1、下载文档前请自行甄别文档内容的完整性,平台不提供额外的编辑、内容补充、找答案等附加服务。
- 2、"仅部分预览"的文档,不可在线预览部分如存在完整性等问题,可反馈申请退款(可完整预览的文档不适用该条件!)。
- 3、如文档侵犯您的权益,请联系客服反馈,我们会尽快为您处理(人工客服工作时间:9:00-18:30)。
A general introduction to STEM detector1. BF detectorIt is placed at the same site as the aperture in BF-TEM and detects the intensity in the direct beam from a point on the specimen.2. ADF detectorThe annular dark field (ADF) detector is a disk with a hole in its center where the BF detector is installed. The ADF detector uses scattered electrons for image formation, similar to the DF mode in TEM.The measured contrast mainly results from electrons diffracted in crystalline areas but is superimposed by incoherent Rutherford scattering.3. HAADF detectorThe high-angle annular dark field detector is also a disk with a hole, but the disk diameter and the hole are much larger than in the ADF detector. Thus, it detects electrons that are scattered to higher angles and almost only incoherent Rutherford scattering contributes to the image. Thereby, Z contrast is achieved.In addition, there is the option to install a Secondary Electron Detector above the sample like in a SEM and thereby to obtain additional morphological information.4. The central DF and BF mode in normal TEMIn normal TEM, we also mentioned the DF and BR mode. Actually, they are different with ADF and BF mentioned here completely. In normal TEM, the direct transmitted beam is blocked by the aperture and the diffracted beam is allowed passing. When the diffracted beam hits the screen and forms a image which is called as DF. Otherwise, diffracted beam is blocked with aperture and transmitted beam forms BR image.However, in STEM mode, they are totally different because the beam on sample is cone-shaped beam rather than parallel light.STEM模式和TEM模式的对比图Z-contrast actually uses an annular detector which can only collect the scattered electrons outside the beam cone. That is to say, the transmitted electrons inside beam cone are involved. This is good thing for other imaging mode because diffraction contrast was avoided and the imaging only has dependence on atomic structure. This imaging mode is called as STEM-HAADF. Here, two issues are not addressed yet. One is whether STEM-BF and STEM-ADF imaging involves diffraction contrast. Personally, I think STEM-ADF should involve phase contrast and Z contrast. For STEM-BR, phase contrast is greatly involved. However, in case of HAADF, only Z-contrast works.Camera Length affects the Inner Collection angel. In our TEM, when camera length is 11 cm, the inner collection angel is 60 mrad. Once the camera length reducing to 5 cm, the inner collection angel is 110 mrad. Therefore, the collection angle is controlled by the camera length. Who affects the camera length? According to equation (L=f*Mp*M l) where f is the focal distance of objective lens (f is related with the excited current, acceleration voltage, the number of coil), Mp and M l are the magnification of projective lens and intermediate lens respectively. Experimentally, the fcan be changed significantly through adjusting the excited current. Besides, in order to change the camera length, youalso can change the excited current of projective lens or intermediate lens. When inner collection angle is bigger than 100 mrad, the Rutherford scattering dominates the imaging.The inner angles for HAADF detectors are at least three times the angle of electron-probe-forming aperture. In many cases of HAADF imaging, the annular detection angle was practically set to be 60 - 170 mrad due to the limitation of combinations between aperture sizes and camera lengths. Above image shows the positions of the detectors which can be installed in a STEM system. Depending on the scattering angle of the transmitted electrons, various signals can be detected as a function of the position ofthe scanning probe: BF (bright-field)-STEM, DF (dark-field)-STEM or HAADF (high angle annular dark field)-STEM.The DF detectors are annularly shaped to maximize the collection efficiency and the range of the collected scattering angles can be adjusted through the magnification of the intermediate lenses.FEI HAADF detectorChapter 1. Introduction to STEM Some TEMs have scanning coils which allow them to be used as a scanning transmission electron microscope (STEM). In STEM, a conical electron beam is focused through the specimen by a lens in front of the specimen (C2 and the objective lens pre-field which is also called mini lens), as shown below.The optical configuration is roughly the same as simply forming an image of the filament by focussing C2 the very first experiment we did in the electron microscope. In fact, if your microscope has a twin objective lens including pre-field and backfield, the optics are a little bit more complicated, but lets start thinking about things as simply as possible.The small beam cross-over at the specimen plane is usually called an Electron Probe. Images can be formed by moving the probe across the specimen (by the double- deflection shift coils) and detecting the transmitted electrons, which are either on the optic axis (to form a bright-field (BF) image) or have been scattered to high angles, to form a dark-field image (DF).In order to make an image, we have to display the signal coming out of one or more detectors in some way. This is usually done on a slow-scan television screen (although it is nowadays also done by computer). The signal detected is used to modulate the intensity of the image on the display screen, while the scan of the display is synchronised accurately with the position of the probe on the specimen. Usually, the same scan generator is used to control both the x-y position of the small beam (or probe) shift deflection coils and the coils that control the display screen. The principle is the same as a conventional scanning electron microscope.A STEM doesn’t actually need any lenses below the specimen at all, because everything important happens before the electrons reach the sample. In practice, a TEM/STEM has all the usual objective lens and projector lenses below the sample (shown asa dotted box above), but in STEM mode these are just used to change the effectivecamera length (that is, the distance between the specimen and the detector plane). They can also be used to form an image of the electron probe.Although there are certain benefits of STEM imaging (which have not been generally been recognised until quite recently), the main advantage of this geometry is the fact that the probe can be used to irradiate a very small volume of specimen in order to obtain all sorts of other signals such as characteristic X-rays, Auger or secondary electrons, or electron energy-loss spectra. All these signals can be spatially resolved at a resolution corresponding to the width of the probe, thus allowing for high resolution micro- analysis. For the material scientist, analytical signals like these can be much more useful than simply images, say to identify the elements present in an inhomogeneous sample.Chapter 2.The Ronchigram(水纹相)Experiment: Load a test specimen of polystyrene spheres, shadow coated with gold particles on a carbon film. Line up the microscope as usual in normal TEM mode. Select the largest condenser aperture and centre it.Ask the demonstrator: Show me how to put the microscope into STEM mode, with the scan switched off. Please align the condenser lens, aperture and stigmators (消散器), and objective rotation centre (current and HT centre), so that I can see a reasonably well-aligned Ronchigram.Let’s start by not actually scanning the probe at all. Examine what we see on the phosphor screen at the bottom end of the electron microscope. The rays coming out of the sample have conical shape, formed by the condenser aperture, and this cone eventually hits the phosphor screen, where it forms a bright circle. The circle is called the 'Gabor hologram', the 'Ronchigram' or the 'central zero-order disc of the convergent beam electron diffraction pattern' depending on the context and who is talking about it. I'm going to call it the Ronchigram. It provides the best way of lining up a STEM, and it will also teach us a lot about electron lens aberrations.Experiment:Look at the Ronchigram. Start by going through focus on both C2 and the objective lens. Move the specimen.You will find that the Ronchigram looks pretty strange, a sort of fish-eye view of the specimen. Go through focus with either the objective or C2 (Note: the objective lens is the pre-field objective lens). If you want to increase the contrast, go up in spot size. Weird shapes move in and out with over focusing and under focusing. If the microscope is well aligned, the Ronchigram from an amorphous specimen should look something the next figure, which has been calculated in a computer:Well, why does the Ronchigram look like this? As a first approximation, what we should see is a shadow image cast by the specimen which reverses as we change the cross-over of the beam near the specimen, as shown below:When the beam is crossing over exactly at the specimen, there will be a burred mess over the whole disc (middle picture above). If the specimen has some feature, like the curly P above, then above and below focus we see a shadow of that feature cast onto the central disc, and magnified according to how far away the beam cross-over is above or below the specimen.Experiment: Turn C2 from a zero setting, slowly increasing its strength. You should see the image reversal. All this occurs at a rather low setting of C2. At higher settings, the Ronchigram may get focussed into a bright spot and undergo a second reversal. However, this reversal is to do with the way we are using the lower part of the microscope (below the specimen plane) to image the cone of illumination coming out of the specimen. Concentrate on the low settings of C2.In fact, the behaviour of image is much more complicated than the figure above suggests because of the effects of aberrations in the lens. All sorts of aberrations may be present in C2, but these tend to over-focussing high angle beams (ones that pass well off-centre), bringing them to a premature focus, i.e. a focus that is nearer the lens than it should be.To understand this, first consider a perfect lens. A perfect lens, by definition, focuses all beams from the source to a single point, as shown below.If we have aberration presents, high-angle beams tend to be over-focussed, so that they focus at a plane above the plane of perfect focus, like this:How is this extra complication going to affect what we see in the Ronchigram? Start by thinking about just two sets of beams: two which are virtually 'paraxial' (which means that they are traveling very close the centre of the lens) and which therefore come to the correct focal point of the lens (a point which is called the Gaussian focus); and two which are at very high angle, or close to the very edge of the condenser aperture, as shown below.Now, when the probe-forming lens is highly over-focussed (which in this experiment means that C2 is moderately excited), all the beams, including the paraxial and high- angle beams, cross-over before they reach the specimen. What we see is just a shadow-image Ronchigram as we would expect, although there will be a slight change in magnification between areas near the centre of the Ronchigram and its edge.Similarly, when the lens is highly under-excited, we see a reversed shadow image, again slightly distorted in magnification. However, near focus there is a peculiar region which I have called the 'region of radial inversion' in the figure above. When the specimen is lying somewhere in this region (or the lens has been adjusted accordingly), paraxial beams are crossing below it, but high-angle beams are crossing above it. In the Ronchigram, the centre of the pattern has undergone a reversal; the edge of the pattern is still in the over-focused orientation.Experiment: On a well-aligned Ronchigram, focus C2 so that the magnification of the image is at maximum. Under-focus slightly and move the specimen. You should be able to find a condition where the centre of image moves in one direction, while the outer area moves in the opposite direction. If you do, then you are within the region of radial inversion. If all you can see are streaking effects and asymmetric stretching of areas of the Ronchigram, then the lenses have not been lined up properly, or the astigmatism in the condenser lens has not been corrected.Look again carefully at the artificial Ronchigram:There are two characteristic rings, which you should be able to see experimentally as well. When the focus is set within the region of radial inversion, there is a central circular area where we see just a normal shadow image at rather high magnification. There is then a ring where everything is streaked out in the radial direction: this is called the ring of infinite radial magnification. At a higher radius, there is a ring where everything is streaked out into a circular pattern: this is called the ring of infinite azimuthal magnification. We don't have to understand why this happens like it does - it is all to do with the mathematics of how much the rays miss Gaussian focus as a function of their angle through the lens.What is important is that the Ronchigram must be circularly symmetric if you want to get a good STEM image.Experiment:Put the C2 stigmators onto their coarsest setting, and change them by a large amount. Watch the Ronchigram as a function of C2 defocus, especially at or near Gaussian focus(i.e. when you can see a highly magnified blob at the centre of the Ronchigram). You should see streaking shapes, which are like ovals or figures of eight.If you can't see any of the effects we've talked about, then the lenses are not properly aligned. Let’s first discuss in more detail how the lenses are arranged.Chapter 3.Lens geometry in STEM mode on a TEM In normal TEM mode, we have two cross-overs below C2, the lower one occurring within the objective pre-field, as shown in the elementary guide. One way of forming a probe would be to de-excite C2, as we did in the very first experiment in first section of the TEM guide, but then we still have a second cross-over which is happening somewhere odd within the pre-field.Greater flexibility and an optimized probe focus can be obtained by avoiding the cross-over within the objective pre-field. In practice, this is achieved by either lowering the overall objective excitation or (depending on the make of microscope) using another small lens within the upper part of the objective twin lens, which is called either a mini-condenser or mini-lens. When the machine is being run in normal TEM mode, this lens is run in the same sense as the objective, making the pre-field very strong. When STEM mode is selected, the mini-lens is WEAKENED (or switched off), and so it cancels out the pre-field to a certain extent.The next Figure illustrates conventional TEM imaging:Where the top lens is C2, and the two lower lenses represent the objective pre-field (and/or the objective lens pre-field boosted by a condenser mini-lens or objective mini-lens).Now when we go into STEM mode, most microscopes reduce the influence of the pre-field, so now the ray-diagram looks like this:Note that both C2 and the objective lens affect the focus of the electron probe. Because C2 is so weakly excited, you can see from the figure above that it will have a huge effect on the convergence angle of the illumination at the specimen plane. For this reason, many manufacturers fix the value of C2 in STEM mode. To obtain control of it, the user has to override the computer.Remember: In STEM, the only electron optics that matter all happen before the specimen. Alignments you made relating to TEM imaging, especially the objective focus (this is the backfield objective focus below the specimen) and stigmation, are useless in STEM mode. We must alter the objective lens (thus altering the pre-field above the specimen) and C2 to control the alignment. The relevant stigmators for STEM mode are thecondenser stigmators, not the objective stigmators.Now that we know that two lenses are involved in the forming probe, we can work how to line them up with one another. The most sensitive mis-alignment arises from the double- deflection coils being on the wrong tilt setting. If the beam tilt is wrong, the beam from C2 passes into the objective pre-field off-axis and at an angle. It will come out below the specimen also at the wrong angle: this is most common reason for losing the beam in STEM or nano-probe mode at high camera lengths.The first thing to get right in STEM mode is therefore the objective rotation centre. The alignment is almost certainly not the same as for TEM, because the objective is in a completely different state, and we are aligning with respect to the pre-field, not the main body of the lens below the specimen. Similarly, the condenser aperture is almost certainly off-line, even if you lined it up in TEM mode.All the corrections are best done in the electron Ronchigram.Experiment:(A)Wobble the objective lens, and try to get the image moving in and out symmetrically with the condenser (we assume here that this is on line). As you alter the beam tilt (this should be thecorrection you are adjusting on the multi-function knobs when aligning in STEM mode), the whole Ronchigram will at the same time bodily move across the phosphor screen. That's because the conical beam cast by the condenser lens is rocking like a lever through the specimen, and moves all over the far-field plane, like the sweep of a torch beam. Start with a large condenser aperture. The aim is to get a stationary shadow image at the very centre of the disc you can see on the screen.Just get the rotation centre roughly right, stop the objective wobbling, and then change C2. (Remember that on most machines you may have over-ride the C2 setting). Is the Ronchigram going in and out symmetrically around a point at the centre of the condenser aperture? If not, shift the condenser aperture onto that axis. If in any doubt at all, leave the condenser aperture where it was correct for TEM imaging. You will not get a perfect STEM image, but neither will you lose the beam, which is very easy at this stage.Now go back and wobble the objective lens again. When both these centres are roughly co-incident with the condenser aperture, set C2 at the value you are going to use it in STEM mode.(B)Focus the objective to get the Ronchigram to 'blow up' into infinitive magnification at its centre. Adjust the condenser stigmators so that the Ronchigram changes symmetrically as a function of defocus. This takes some practice. (Remember that the objective stigmators, which are below the specimen, are useless in STEM mode, although you should try to set them roughly right in TEM mode before switching to STEM mode.)If in doubt, wait until you are in scanning mode and can see an image on the scanning monitors before you attempt to correct astigmatism. However, note that if the stigmators are wrong and you change them later, all the above alignments should be re-iterated if you want the best probe possible. Misalignment, tilt, astigmatism, defocus and spherical aberration (which is the thing that makes the Ronchigram look the way it does) are all just lens aberrations that add up and affect the focus of the probe. Change any one of these variables, and another one will no longer be optimal.(C)Whatever you do, don't try turn C2 so high that what you see on the phosphor screen reaches a focus. This is bound to look astigmatic - but don't correct the condenser stigmators in this condition. Set C2 at its STEM mode setting. Now focus the objective lens: in other words, change the focus until the Ronchigrammagnification is a maximum (i.e. the intensity distribution 'blows up' at its centre). If there is astigmatism present, the Ronchigram will not 'blow up' into a uniform infinite magnification blob. Instead, it will look stretched in one direction at one setting of objective defocus, and stretched roughly at right-angles at another setting of defocus. Set the objective between these two extremes, and then correct thecondenser stigmators, turning them so that whatever you see spreads more uniformly over the Ronchigram. If the stretching of the image gets more extreme, you're turning the stigmator the wrong way.As a general rule, for the best scanning probe resolution, you should select a condenser aperture size that just selects the middle 'flat' area of intensity in the Ronchigram when it is just in focus. 'Just in focus' means that as we decrease focus from above the beam cross-over setting, the very centre of the Ronchigram has just exploded into a blob, but has not yet become a clear inverted shadow image. Because changing spot size changes the value of C2 as well as C1 (in STEM mode), and this affects the angle of convergence at the specimen, the size of the condenser aperture needed to fulfill this condition may also change.Chapter 4.Pivot pointsBefore we begin to scan the probe to make a STEM image, it is essential to check the pivot points. (Sadly, this is not possible on all makes of machine because it is regarded as 'too difficult' by the manufacturers. However, you can usually obtain access to the control indirectly via the computer.) Think of the following diagram, where the pivot points are incorrectly adjusted:In an ideal world, the probe continues to point in exactly the same direction as it is scanned over the specimen by the beam shift coils. However, if the rocking point of the scan coils is wrong, the beam tilts as well as shifts (see introductory guide if you have forgotten the meaning of tilt and shift). Thishas two consequences: the Ronchigram moves relative to the detectors as the probe is scanned, and the magnification of the STEM image willnot be calibrated. At worst, the beam may be only tilting, and not moving laterally at all, in which case the apparent magnification of the STEM image will be much higher than the nominal value. Note that this pivot point adjustment is quite different to the pivot point values in TEM mode. In the latter, we adjust for a stationary probe as a function of tilt; here we adjust for stationary tilt as a function of shift. We are aiming for shift purity.There are different ways of making this adjustment on different machines. It is essential to correct it for each spot size and/or objective/condenser combinations of setting. The way the beam shift interacts with the objective pre-field means that the degree of tilt can be strongly correlated to strength of the objective.Ask the demonstrator: How do I adjust the pivot points in STEM mode?If in doubt, one way of doing this is to assume the objective aperture is truly in the back focal plane of the objective lens (Usually, it is not quite in the back focal plane). If we pretend it is in the back focal plane, then a way of testing the pivot points is to selectdiffraction mode and observe the Ronchigram. Insert a small objective aperture (smaller than the Ronchigram), which should cast a shadow over the Ronchigram, and switch on the pivot point adjustment.If two objective apertures become visible, the diffraction lens is not focusing on the back focal plane; focus the diffraction lens until only one objective aperture is visible. Now remove the objective aperture and adjust the STEM pivot points until the two Ronchigrams are superposed. Note that in STEM mode, focusing the diffraction lens in diffraction mode does not mean making the beam make a sharp point (as in TEM diffraction), because there a very large range of angles present in the conical beam coming out of the specimen.Why two objective aperture images are visible when diffraction lens is not focusing on the back focal plane?Chapter 5.Aligning the detectors Once we have corrected the Ronchigram and the pivots, then all we have to do is get the detectors lined up with the beam coming out of the bottom of the specimen. In a TEM/STEM, the STEM detectors are usually mounted below the phosphor screen, and normally you can't actually see them. Quite often, because of space constraints, they are not mounted on the centre line of the microscope, but are off to one side.Ask the demonstrator: Please tell me roughly where the detectors are relative to the centre of the phosphor screen.There are normally two detectors. A solid-state circular disc is used to collect the bright-field signal. Around it is mounted another solid-state detector in the shape of a circular annulus, which is used to collect all the dark- field electrons: that is, all the electrons which have scattered to a large angle outside the cone of the Ronchigram. Looking down on the two detectors, they look like this:The STEM imaging will only work properly if we get three variables correctly adjusted: the camera-length(i.e. the effective distance or magnification between the specimen and the detector plane) and the x- and y-shift of the detector plane. It sounds simple, but there are a lot of things that can go wrong. This brings two questions. One is how to adjust the camera length and another is how to shift the detector plane? Another important issue is why the camera length is one critical factor which affects the STEM imaging.Suppose for a moment that the detectors are on the optic axis. What effect does changing the camera length have? Look at the next diagram.At very short camera-lengths (This means the image magnification is very low), the disc of the Ronchigram will be much smaller than the disc of the bright-field detector. This condition is good for dark-field imaging, because the annular detector is effectively lying at a high angle which is what we want for easy image interpretation. The image contrast is roughly proportional to the Rutherford scattering of electrons from the atomic nuclei. NOTE: ABOVE STATEMENT IS JUST SUITED TO THE ALLIGNMENT.As the camera length increases, the Ronchigram gets bigger and bigger, until it reaches a point where it covers the whole bright-field detector. In this condition, the signals on both the dark-field and bright-field detectors are at a maximum, although the contrast on both images will be rather poor.Why the disc of the Ronchigram much smaller than the disc of the BF detector is good for DF imaging?At even longer camera lengths, both the bright-field detector and the annular dark field detector are covered by the Ronchigram. In this condition, the bright-field image is very noisy and has low intensity, but it will have much more contrast and will be more like a conventional bright- field image in TEM mode.However, for any one camera length, think of all the things that can go wrong if the detector is not properly aligned, as shown in the next figure:Clearly, if the Ronchigram misses both detectors (which, by Sod's Law, is the most likely occurrence) then we will see nothing at all on the STEM monitors, because very few electrons will be hitting either of the detectors.If the detector is almost aligned correctly, the central disc of the Ronchigram will hit the dark-field detector, but miss the bright-field detector. Under these circumstances, the signaldisplayed on the so-called dark-field monitor will be bright, and will look like a bright-field image, because it is collecting all the electrons which have passed through the specimen. Even worse, the so-called bright-field detector will be detecting high-angle scattered dark-field electrons, and so it will look like a dark-field image. Because the annular dark-field detector is so much larger than the bright-field detector, there are many more ways to get this inversion of signals to occur than to get the signals the right way round. For this reason, people often spend many happy hours thinking the monitors on the STEM are the wrong way round.。