第四讲 MATLAB与EXCEL数据交互
将excel中的数据导入matlab教程的方法步骤
将excel中的数据导入matlab教程的方法步骤在Excel中经常录入好数据以后都会有导入到matlab中去,这个功能也比较常用,如果还不会的朋友不妨学习一下。
接下来是店铺为大家带来的如何将excel中的数据导入matlab的教程,希望对你有用。
将excel中的数据导入matlab的教程Excel导入matlab步骤1:将待导入的矩阵结构的数据录入Excel 中,录入时注意行列要跟原矩阵一一对应Excel导入matlab步骤2:录入完以后保存数据,为了后续步骤使用方便,命名时我们最好把它命名为我们接下来在MATLAB中要引用的变量名(比如在MATLAB中要将该矩阵作为B矩阵参与运算,就可以把它命名为B.xls,xls为文件扩展名)将excel中的数据导入matlab的教程图2Excel导入matlab步骤3:运行MATLAB程序,点击工具栏上的Import Data工具按钮将excel中的数据导入matlab的教程图3Excel导入matlab步骤4:在弹出的“Import Data”对话框中找到前面保存的数据文件(B.xls),“打开”将excel中的数据导入matlab的教程图4Excel导入matlab步骤5:弹出“Import”窗口,在窗口工具栏左侧导入选项中选择“Matrix(矩阵)”,然后点击工具栏右侧的“勾”,导入数据将excel中的数据导入matlab的教程图5Excel导入matlab步骤6:关闭“Import”窗口,回到MATLAB 主程序,在WorkSpace(工作空间)中可以看到刚刚导入矩阵变量,接下来就可以对矩阵进行运算了将excel中的数据导入matlab的教程图6Excel导入matlab步骤7:每次关闭MATLAB程序都会将工作空间中的变量清空,所以如果经常用到该变量,不妨将该变量保存为MAT文件将excel中的数据导入matlab的教程图7将excel中的数据导入matlab的教程图8Excel导入matlab步骤8:这样一来每次打开MATLAB,只需要双击MAT文件便可以将变量导入工作空间将excel中的数据导入matlab的教程图9猜你喜欢:1.怎么将Excel数据导入MATLAB中2.怎么将外来数据导入excel20103.怎么将txt中的数据导入到excel20074.如何利用excel进行数据分析的教程5.如何用excel进行数据分析的教程6.怎么在Excel中输入分数7.怎么实现Excel与ppt2010数据同步。
如何将Excel中的数据导入MATLAB并在MATLAB中画出图像
首先Excel必须是office的(WPS的不可以,MATLAB不能识别),在MATLAB中使用命令xlsread读取Excel中的数据到MATLAB里,如下所示:[number,txt,raw]=xlsread(''),此时读取的文件须在MATLAB默认路径下,命令具体用法及参数含义可直接用help命令在MATLAB中查找。
读取的数据界面如下:
1.如何将Excel中的数据导入MATLAB并在MATLAB中画出图像?
首先Excel必须是office的(WPS的不可以,MATLAB不能识别),file-Import Data-在工作路径下找到需要导入的文件(图3)-点击打开(图4)-点击next-点击finish-导入成功-在workspace中看到图5(导入的数据)。
至此数据导入成功。
下面是如何利用该数据绘图:
法一:双击workspace中的data打开如图6,选中要画图的数据如图7(数据范围可以根据需要随便选择),点击上方的plot(data(1:874,1:2),画出图像如图8,并且在工作空间中自动显示画图命令。
法二:直接在工作空间中写画图命令。
图3
图4
图5图6图7图8。
matlab与excel数据交换的有利工具
matlab与excel数据交换的有利工具——excel link(1) What Is Excel Link?Excel Link is a software add-in that integrates Microsoft Excel andMATLAB in a Microsoft Windows-based computing environment. By connecting Exceland MA TLAB, you can access the numerical, computational, and graphical powerof MATLAB from Excel worksheet and macro programming tools. Excel Link letsyou exchange and synchronize data between the two environments.1. System Requirements2. Installing Excel Link3. Configuring Excel to Work with Excel Link4. Starting Excel Link5. Connecting to an Existing MATLAB Session6. Stopping Excel LinkFollow these instructions to install Excel Link and then configure Excel.System RequirementsExcel Link requires approximately 202 kilobytes of disk space. Operating system requirements are:Microsoft Windows XP ,Microsoft Windows 2000Excel Link also requires one of the following versions of Excel:Excel 2000Excel ,2002Excel ,2003Excel(Excel Link has also been qualified against Excel 2007 Beta.)Excel Link also requires MA TLAB for Windows.For best results with MATLAB figures and graphics, set the color palette of your display to a value greater than 256 colors. Click Start > Settings > Control Panel > Display, and then click the Settings tab.Choose an appropriate entry from the Color Palette menu.Installing Excel LinkInstallWindows and Excel before you install MATLAB and Excel Link.To install Excel Link, follow the instructions in the MA TLAB installation documentation. Select the Excel Link check box when you select MATLAB components to install.Configuring Excel to Work with Excel LinkAfter you have installed Excel Link, you are ready to configure Excel. You need do these steps only once:1. Start Microsoft Excel.2. Select Tools > Add-Ins and click Browse.3. Find and select the Excel Link add-in excllink.xla under matlabroot/toolbox/exlink. Click OK.(Throughout this document the notation matlabroot representsthe MATLAB root directory, the directory where MATLAB is installed on yoursystem.)4. Back in the Add-Ins dialog box, make sure that the check box is selected and click OK.The Excel Link add-in loads now and with each subsequent invocation of Excel.5 .Watch for the appearance of the MATLAB Command Window button on the Windows taskbar.6 .Watch for the appearance of the Excel Link toolbar on your Excel worksheet.Excel Link is now ready for your use.Starting Excel LinkAutomatic StartWhen installed and configured according to the preceding instructions,Excel Link and MA TLAB automatically start when you start Excel.If you do not want Excel Link and MATLAB to start automatically when you start Excel, enter =MLAutoStart("no") in a worksheet cell. This function changes the initialization file so that Excel Link and MATLAB no longer start automatically when you start Excel. See MLAutoStart in Functions — Alphabetical List.Manual StartTo start Excel Link and MATLAB manually from Excel, select Tools > Macro. In the Macro Name/Reference box enter matlabinit and click Run. Watch for the MA TLAB Command Window button to appear on the taskbar. See matlabinit in Functions — Alphabetical List.Connecting to an Existing MATLAB SessionTo connect a new Excel session to an existing MATLAB process, you must start MATLAB with the /automation command-line option. The /automation option starts MA TLAB as an automation server. The Command Window is minimized, and the MATLAB desktop is not running.To add the /automation option to the command line:1. Right-click your shortcut to MA TLAB.2 .Select Properties.3. Click the Shortcut tab.4. Add the string /automation in the Target field. Remember to leave a space between matlab.exe and /automation.Stopping Excel LinkTo stop both Excel Link and MATLAB, stop Excel as you normally would.Excel Link and MATLAB both stop when you stop Excel.To stop MA TLAB and Excel Link and leave Excel running, enter =MLClose() inan Excel worksheet cell. You can restart Excel Link and MATLAB manually with MLOpen or matlabinit.If you stop MATLAB directly in the MATLAB Command Window and leave Excel running, enter =MLClose() in an Excel worksheet cell. (MLClose tells Excel that MATLAB is no longer running.)You can restart Excel Link and MA TLAB manually with MLOpen or matlabinit. Understanding the EnvironmentExcel Link communicates between the Excel workspace and the MATLAB workspace.It positions Excel as a front end to MA TLAB. You use Excel Link functionsfrom an Excel worksheet or macro without leaving the Excel environment. Witha small number of functions to manage the link and manipulate data, ExcelLink is powerful in its simplicity.Installing and Operating Excel LinkThis section covers the following topics:matlab与excel数据交换的有利工具——excel link(2) What the Functions DoThis section covers the following topics:Link Management FunctionsData Management FunctionsWith Excel Link, Microsoft Excel becomes an easy-to-use data-storage and application-development front end for MA TLAB, which is a powerful computational and graphical processor. Excel Link provides functions to manage the link and to manipulate data. You never have to leave the Excel environment. You can invoke functions as worksheet cell formulas or in macros.For details on each function, see Functions — Alphabetical List.Link Management FunctionsExcel Link provides four link management functions to initialize, start,and stop Excel Link and MATLAB.You can invoke any link management function except matlabinit as a worksheet cell formula or in a macro. You invoke matlabinit fromthe Excel Tools Macro menu or in a macro subroutine.Use MLAutoStart to toggle automatic startup. If youinstall and configure Excel Link according to the default instructions, Excel Link and MATLAB automatically start every time you start Excel. If you choose manual startup, use matlabinit to initialize Excel Link and start MATLAB.Use MLClose to stop MA TLAB .without stopping Excel,and use MLOpen or matlabinit to restart MATLAB in the same Excel session.Data Management FunctionsExcel Link provides the following data management functions to copy data between Excel and MATLAB and to execute MATLAB commands from Excel.Function Purposematlabfcn Evaluate MA TLAB command given Excel data.matlabsub Evaluate MATLAB command given Excel data and designate output location. MLAppendMatrix Create or append MA TLAB matrix with data from Excel worksheet. MLDeleteMatrix Delete MA TLAB matrix.MLEvalString Evaluate command in MATLAB.MLGetFigure Import current MATLAB figure into Excel spreadsheet.MLGetMatrix Write contents of MA TLAB matrix in Excel worksheet.MLGetVar Write contents of MATLAB matrix in Excel VBA variable.MLPutMatrix Create or overwrite MATLAB matrix with data from Excel worksheet.MLPutVar Create or overwrite MATLAB matrix with data from Excel VBA variable. MLShowMatlabErrors Used by MLEvalString to return standard Excel Link errors or full MATLAB errors.MLStartDir Specify current working directory of MATLAB after startup.MLUseFullDesktop Specify whether to use full MA TLAB desktop or only Command window. You can invoke any data management function except MLPutVar as a worksheet cell formula or in a macro. You can invoke MLPutVar only in a macro.Use MLAppendMatrix, MLPutMatrix, and MLPutVar to copy data from Excel to MA TLAB.Use MLEvalString to execute MA TLAB commands from Excel.Use MLDeleteMatrix to delete a MATLAB variable.Use matlabfcn, matlabsub, MLGetMatrix,and MLGetVar to copy data from MATLAB to Excel.matlab与excel数据交换的有利工具——excel link(3) Tips and RemindersThis section covers the following topics:Syntax 语法Worksheets 工作表Macros 宏Data Types 数据类型Dates 日期Saved Worksheets 保存工作表Information for International Users 国际用户信息These tips and reminders help you use Excel Link efficiently.Excel Link functions perform an action, while Microsoft Excel functions return a value. Keep this distinction in mind as you use Excel Link. Excel operations and function keys may behave differently with Excel Link functions.Syntax 语法Function NamesExcel Link function names are not case sensitive; that is, MLPutMatrix and mlputmatrix are the same.MATLAB function names and variable names are case sensitive; that is, BONDS, Bonds, and bonds are three different MA TLAB variables. Standard MATLAB function names are always lower case; for example, plot(f).Worksheet Formulas1. Begin worksheet formulas with + or =. For example:=mlputmatrix("a", C10)2 .In worksheet formulas, enclose function arguments in parentheses. In macros, leave a space between the function name and the first argument; do not use parentheses.Variable Names1. You can directly or indirectly specify a variable-name argument in most Excel Link functions.(1.) To specify a variable name directly, enclose it in double quotes; for example, MLDeleteMatrix("Bonds").(2.).A variable-name argument without quotes is an indirect reference.The function evaluates the contents of the argument to get the variable name.The argument must be a worksheet cell address or range name.2. A data-location argument must be a worksheet cell address or range name. Do not enclose a data-location argument in quotes (except in MLGetMatrix, which has unique argument conventions).3.A data-location argument can include a worksheet number; for example, Sheet3!B1:C7 orSheet2!OUTPUT.(注意You can use virtually any special character as part of a worksheet name if you embed the sheet name within single quotes ('') when referencing it in MLGetMatrix or MLPutMatrix.) Worksheets 工作表1. After an Excel Link function successfully executes as a worksheet formula, the cell contains the value 0. While a functionis executing, the cell may continue to show the entered formula.2.We suggest selecting Move Selection after Enter on the Excel Tools Options > Edit tab. The active cell changes when an operation is complete, providing a useful confirmation for lengthy operations.3.We recommend using Excel Link functions in automatic calculation mode. If you use MLGetMatrix in manual calculation mode,enter the function in a cell, then press F9 to execute it. However, pressing F9 in this situation may also reexecute other worksheet functions and generate unpredictable results.4.To recalculate Excel Link functions in a worksheet, reexecute each function by pressing F2, then Enter.5.Pressing F9 to recalculate a worksheet affects only Excel functions (which return a value). F9 does not operate on Excel Link functions, which perform an action.6.To "automate" the recalculation of an Excel Link function, add to it some cell whose value changes. For example:=MLPutMatrix("bonds", D1:G26) + C1When the value in cell C1 changes, Excel reexecutes the MLPutMatrix function. Be careful, however, not to create endless recalculation loops.7.Excel Link functions expect A1-style worksheet cell references (columns designated with letters and rows with numbers). This is the default reference style. If your worksheet shows columns designated with numbers instead of letters, select Tools > Options andclick the General tab. Under Settings, clear the R1C1 reference style check box.8.If you use explicit cell addresses in MLGetMatrix and later insert or delete rows or columns, or move or copy the function to another cell, edit the argument to correct the addresses. Excel Link does not automatically adjust cell addresses in MLGetMatrix.9.Enter (type) Excel Link functions directly in worksheet cells.Do not use the Excel Function Wizard; it generates unpredictable results.Macros 宏1.To create macros that use Excel Link functions, you must first configure Excel to reference the functions from the Excel Link add-in. From the Visual Basic environment, select Insert > Module. When the Module page opens, select Tools > References.In the References dialog box, select the box for excllink.xla and click OK. You may have to use Browse to find the excllink.xla file.2.If you use MLGetMatrix in a macro subroutine, enter MatlabRequest on the line after MLGetMatrix. MatlabRequest initializesinternal Excel Link variables and enables MLGetMatrix to function in a subroutine. For example: Sub Get_RangeA()MLGetMatrix "A", "RangeA"MatlabRequestEnd SubDo not include MatlabRequest in a macro function unless the macro function is called from a subroutine.Data Types 数据类型Excel Link handles only MATLAB two-dimensional numeric arrays,one-dimensional character arrays (strings), and two-dimensional cell arrays.It does not work with MATLAB multidimensional arrays and structures.Dates 日期Default Excel date numbers start from January 1, 1900, while MATLAB date numbers start from January 1, 0000. Thus May 15, 1996 is 35200 in Excel and 729160 in MATLAB, a difference of 693960. If you use date numbers in MA TLAB calculations, apply the 693960 constant: add it to Excel date numbers going into MATLAB, or subtract it from MATLAB date numbers coming into Excel. If you use the optional Excel 1904 date system, the constant is 695422.Saved Worksheets Saved Worksheets 保存工作表1.When you open an Excel worksheet that contains Excel Link functions, Excel tries to execute the functions from the bottom up and right to left, thus possibly generating cell error messages (#COMMAND!, #NONEXIST!, etc.). Such behavior is usual for Excel. Simply ignore the messages, close any MATLAB figure windows, and reexecute the cell functions one at a time in the correct order by pressing F2, and then Enter.2.If you save an Excel worksheet containing Excel Link functions and later open it under a different computer environment where the excllink.xla add-in is in a different location, Excel may display a message box. Click No. Then select Edit > Links. In the Links dialogbox, click Change Source. In the Change Links dialog box, find and select excllink.xla under matlabroot/toolbox/exlink and click OK. Excel executes each function as it changes its link. You may see MATLAB figure windows and hear error beeps as the links change and functions execute; ignore them. Back in the Links dialog box, click OK. The worksheet now correctly connects to the Excel Link add-in.Or, instead of using the Edit Links menu, you can manually edit the link location in each affected worksheet cell to show the correct location of excllink.xla.Information for International Users 国际用户信息This document uses Excel with an English?(United States) Windows regional setting for illustrative purposes. If you use Excel Link with a non-English?(United?States) Windows desktop environment, certain syntactical elements may not work as illustrated. For example, you may have to replace the comma (,) delimiter within the Excel Link commands with a semicolon (;) or other operator. Please consult your Windows documentation to determine which regional setting differences exist among various international versions.matlab与excel数据交换的有利工具——excellink(4)Example 1: Regression and Curve FittingRegression techniques and curve fitting attempt to find functions that describe the relationshipamong variables. In effect, they attempt to build mathematical models of a data set. MATLAB provides many powerful yet easy-to-use matrix operators and functions to simplify the task.This example does both data regression and curve fitting. It also executes the same example in a worksheet version and a macro version. The example uses Excel worksheets to organize and display the data. Excel Link functions copy the data to MATLAB and execute MATLAB computational and graphic functions. The macro version also returns outputdata to an Excel worksheet.Worksheet VersionTo try the worksheet-only version of this example, click the Sheet1 tab on the ExliSamp.xls window.The worksheet contains one named range: A4:C28 is named DATA and contains the sample data set:1.Make E5 the active cell. Press F2, then Enter to execute the Excel Link function that copies the sample data set to MATLAB.The data set contains 25 observations of three variables. There is a strong linear dependence among the observations; in fact, they are close to being scalar multiples of each other.2.Move to cell E8 and press F2, then Enter. Repeat with cells E9 and E10. These Excel Link functions tell MATLAB to regress the third column of data on the other two columns. They createa single vector y containing the third-column data, and a new three-column matrix A consisting ofa column of ones followed by the rest of the data.3.Execute the function in cell E13. This function computes the regression coefficients by using the MATLAB backslash operation to solve the (overdetermined) system of linear equations, A*beta = y.4.Execute the function in cell E16. MATLAB matrix-vector multiplication produces the regressed result (fit).5.Execute the functions in cells E19, E20, and E21. These functions compare the original data with fit; sort the data in increasing order and apply the same permutation to fit; and create a scalar for the number of observations.6.Execute the functions in cells E24 and E25. Often it is useful to fit a polynomial equation to data. To do so, you would ordinarily have to set up a system of simultaneous linear equations and solve for the coefficients. The MA TLAB polyfit function automatesthis procedure, in this case for a fifth-degree polynomial. The polyval function then evaluates the resulting polynomial at each data point to check the goodness of fit (newfit).7.Execute the function in cell E28. The MA TLAB plot function graphs the original data (blue circles), the regressed result fit (dashed red line), and the polynomial result (solid green line); and adds a legend. Data plots.Since the data is closely correlated but not exactly linearly dependent, the fit curve (dashed line)shows a close, but not an exact,fit. The fifth-degree polynomial curve, newfit, represents a more accurate mathematical model for the data.When you have finished this version of the example, close the figure window.Macro VersionTo try the macro-and-worksheet version of this example, click the Sheet2 tab on ExliSamp.xls.Make cell A4 the active cell, but do not execute it yet.Cell A4 calls the macro CurveFit, which you can examine from the Visual Basic environment.While this module is open, select Tools > References. In the References dialog box, make sure that the excllink.xla check box is selected. If not, select the check box and click OK. You may have to use Browse to find the excllink.xla file.Back in cell A4 of Sheet2, press F2, then Enter to execute the CurveFit macro. The macro executes the same functions as in Step 1 through Step 7 of the worksheet version (in a slightly different order), including plotting the graph. Plus, it copies the original data y (sorted), the corresponding regressed data fit, and the polynomial data newfit, to the worksheet. (The last three MLGetMatrix unctions in the CurveFit macro copy data to the Excel worksheet.)When you have finished the example, close the figure window.matlab与excel数据交换的有利工具——excellink(5)插值Interpolation is a process for estimating values that lie between known data points. It is important for applications such as signal and image processing and data visualization. MATLAB provides a number of interpolation functions that let you balance the smoothness of data fit with execution speed and efficient memory use.This example uses a two-dimensional data-gridding interpolation function on thermodynamic data, where volume has been measured for time and temperature values. It finds the volume values underlying the two-dimensional time-temperature function for a new set of time and temperature coordinates.The example uses an Excel worksheet to organize and display the original data and the interpolated output data. Excel Link functions copy the data to and from MATLAB, execute the MATLAB interpolation function, and invoke MATLAB graphics to display the interpolated data in a three-dimensional color surface.To try this example, click the Sheet3 tab on ExliSamp.xls.The worksheet contains the measured thermodynamic data in cells A5:A29, B5:B29, and C5:C29. The time and temperature values for interpolation are in cells E7:E30 and F6:T6 respectively:1.Make A33 the active cell. Press F2, then Enter to execute the Excel Link function that passes the Time, Temp, and Volume labels to MATLAB.2.Make A34 the active cell. Press F2, then Enter to execute the Excel Link function that copies the original time data to MATLAB.Move to cell A35 and execute the function to copy the original temperature data. Execute the function in cell A36 to copy the original volume data.3.Move to cell A39 and press F2, then Enter to copy the interpolation time values to MATLAB. Execute the function in cell A40 tocopy the interpolation temperature values.4.Execute the function in cell A43. griddata is the MATLAB two-dimensional interpolation function that generates the interpolatedvolume data using the inverse distance method.5.Execute the functions in cells A46 and A47 to transpose the interpolated volume data and copy it to the Excel worksheet.The data fills cells F7:T30, which are enclosed in a border.6.Execute the function in cell A50. MA TLAB plots and labels the interpolated data on a three-dimensional colorsurface, with the color proportional to the interpolated volume data.When you have finished with the example, close the figure window.matlab解经典符号方程solve()solveSymbolic solution of algebraic equationsSyntaxsolve(eq)solve(eq,var)solve(eq1,eq2,...,eqn)g = solve(eq1,eq2,...,eqn,var1,var2,...,varn)DescriptionSingle Equation/Expression2The input to solve can be either symbolic expressions or strings. If eq is a symbolic expression(x^2-2*x+1) or a string that does not contain an equal sign ('x^2-2*x+1'), then solve(eq)solves the equation eq=0 for its default variable (as determined by findsym). solve(eq,var) solves the equation eq (or eq=0 in the two cases cited above) for the variablevar.System of EquationsThe inputs are either symbolic expressions or strings specifying equations. solve(eq1,eq2,...,eqn) or solves the system of equations implied by eq1,eq2,...,eqn inthe n variables determined by applying findsym to the system.g = solve(eq1,eq2,...,eqn,var1,var2,...,varn) finds the zeros for the system ofequations for the variables specified as inputs.Three different types of output are possible. For one equation and one output, the resultingsolution is returned with multiple solutions for a nonlinear equation. For a system of equations andan equal number of outputs, the results are sorted alphabetically and assigned to the outputs. Fora system of equations and a single output, a structure containing the solutions is returned.For both a single equation and a system of equations, numeric solutions are returned if symbolicsolutions cannot be determined.Examplessolve('a*x^2 + b*x + c') returns[ 1/2/a*(-b+(b^2-4*a*c)^(1/2)),1/2/a*(-b-(b^2-4*a*c)^(1/2))]solve('a*x^2 + b*x + c','b') returns-(a*x^2+c)/xS = solve('x + y = 1','x - 11*y = 5') returns a structure S withS.y = -1/3, S.x = 4/3solve :: Functions (Symbolic Math Toolbox) text://2 of 2 2012-7-26 9:A = solve('a*u^2 + v^2', 'u - v = 1', 'a^2 - 5*a + 6')returnsA =a: [4x1 sym]u: [4x1 sym]v: [4x1 sym]whereA.a =[ 2][ 2][ 3][ 3]A.u =[ 1/3+1/3*i*2^(1/2)][ 1/3-1/3*i*2^(1/2)][ 1/4+1/4*i*3^(1/2)][ 1/4-1/4*i*3^(1/2)]A.v =[ -2/3+1/3*i*2^(1/2)][ -2/3-1/3*i*2^(1/2)][ -3/4+1/4*i*3^(1/2)][ -3/4-1/4*i*3^(1/2)]关于使用solve()时产生x: [1x1 sym]的解决亲爱的同学们,你有没有在使用matlab过这样类似的情况呢?>> solve('x + y = 1','x - 11*y = 5')ans =x: [1x1 sym]y: [1x1 sym]为什么会出现这样的现象呢?这是因为你的默认输出格式是结构体,你想看的是单个的元素。
如何将Excel中的数据导入MATLAB并在MATLAB中画出图象
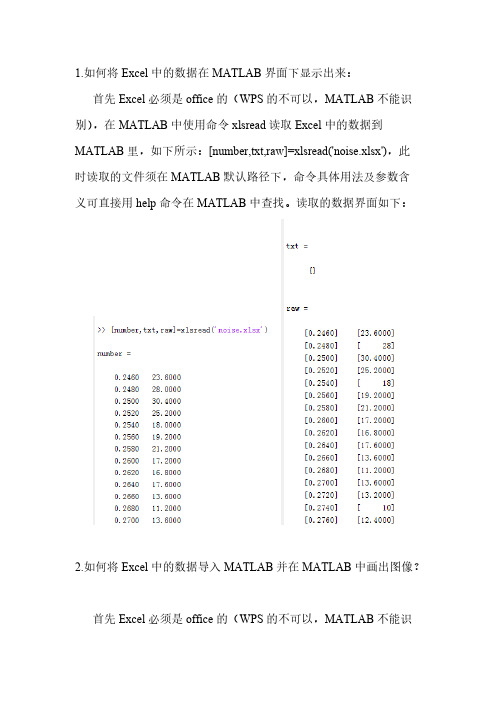
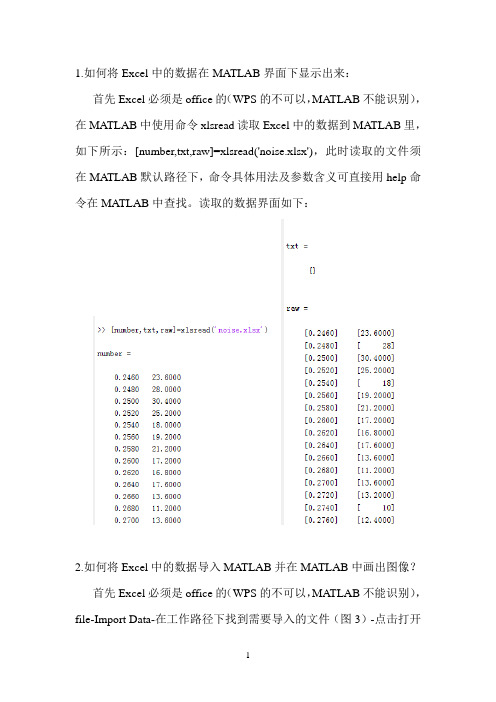
1.如何将Excel中的数据在MATLAB界面下显示出来:
首先Excel必须是office的(WPS的不可以,MATLAB不能识别),在MATLAB中使用命令xlsread读取Excel中的数据到MATLAB里,如下所示:[number,txt,raw]=xlsread('noise.xlsx'),此
时读取的文件须在MATLAB默认路径下,命令具体用法及参数含
义可直接用help命令在MATLAB中查找。
读取的数据界面如下:
2.如何将Excel中的数据导入MATLAB并在MATLAB中画出图像?
首先Excel必须是office的(WPS的不可以,MATLAB不能识
别),file-Import Data-在工作路径下找到需要导入的文件(图3)-点击打开(图4)-点击next-点击finish-导入成功-在workspace中看到图5(导入的数据)。
至此数据导入成功。
下面是如何利用该数据绘图:
法一:双击workspace中的data打开如图6,选中要画图的数据如图7(数据范围可以根据需要随便选择),点击上方的
plot(data(1:874,1:2),画出图像如图8,并且在工作空间中自动显示画图命令。
法二:直接在工作空间中写画图命令。
图3
图4
图5
图6
图7
图8。
如何将Excel中的数据导入MATLAB并在MATLAB中画出图像
1.如何将Excel中的数据在MATLAB界面下显示出来:
首先Excel必须是office的(WPS的不可以,MATLAB不能识别),在MATLAB中使用命令xlsread读取Excel中的数据到MATLAB里,如下所示:[number,txt,raw]=xlsread('noise.xlsx'),此时读取的文件须在MATLAB默认路径下,命令具体用法及参数含义可直接用help命令在MATLAB中查找。
读取的数据界面如下:
2.如何将Excel中的数据导入MATLAB并在MATLAB中画出图像?
首先Excel必须是office的(WPS的不可以,MATLAB不能识别),file-Import Data-在工作路径下找到需要导入的文件(图3)-点击打开
(图4)-点击next-点击finish-导入成功-在workspace中看到图5(导入的数据)。
至此数据导入成功。
下面是如何利用该数据绘图:法一:双击workspace中的data打开如图6,选中要画图的数据如图7(数据范围可以根据需要随便选择),点击上方的plot(data(1:874,1:2),画出图像如图8,并且在工作空间中自动显示画图命令。
法二:直接在工作空间中写画图命令。
图3
图4
图5
图6
图7
图8。
如何将Excel中的数据导入MATLAB并在MATLAB中画出图像
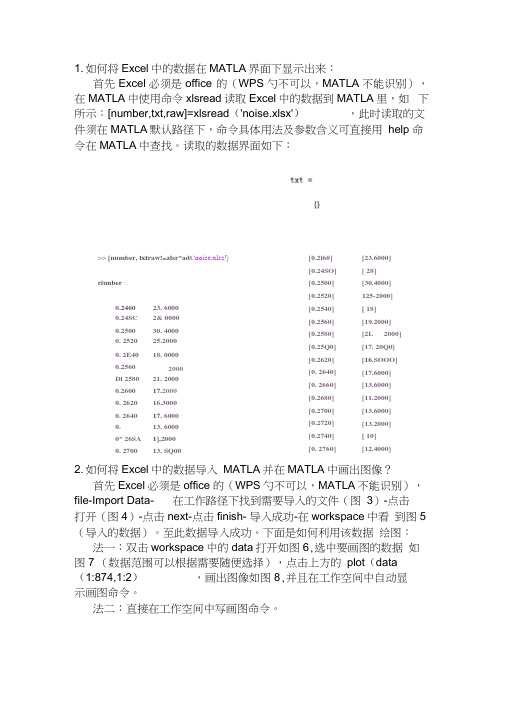
1. 如何将Excel中的数据在MATLA界面下显示出来:首先Excel必须是office 的(WPS勺不可以,MATLA不能识别),在MATLA中使用命令xlsread读取Excel中的数据到MATLA里,如下所示:[number,txt,raw]=xlsread('noise.xlsx'),此时读取的文件须在MATLA默认路径下,命令具体用法及参数含义可直接用help 命令在MATLA中查找。
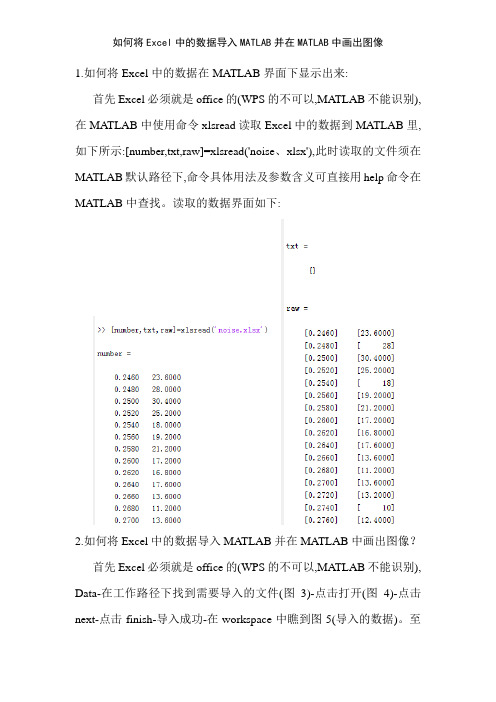
读取的数据界面如下:[0.2i60][0.24SO][0.2500][0.2520][0.2540][0.2560][0.2580][0.25Q0][0.2620][0. 2640][0. 2660][0.2680][0.2700][0.2720][0.2740][0. 2760][23.6000][ 28][30.4000]125-2000][ 18][19.2000][2L 2000][17. 20Q0][16.SOOO][17.6000][13.6000][11.2000][13.6000][13.2000][ 10][12.4000]2. 如何将Excel中的数据导入MATLA并在MATLA中画出图像?首先Excel必须是office 的(WPS勺不可以,MATLA不能识别),file-Import Data- 在工作路径下找到需要导入的文件(图3)-点击打开(图4)-点击next-点击finish- 导入成功-在workspace中看到图5 (导入的数据)。
至此数据导入成功。
下面是如何利用该数据绘图:法一:双击workspace中的data打开如图6,选中要画图的数据如图7 (数据范围可以根据需要随便选择),点击上方的plot(data(1:874,1:2),画出图像如图8,并且在工作空间中自动显示画图命令。
法二:直接在工作空间中写画图命令。
>> [number, txt raw!=zlsr*ad C noise.xlsz J)riunber 二0.246023. 60000.24SC 2& 00000.2500 30. 40000. 2520 25.20000. 2E40 18. 00000.2560 2000Di 2580 21. 20000.2600 17.20000. 2620 16.30000. 2640 17. 60000. 13. 60000* 26SA 1],20000. 2700 13. SQ00Import Data査找范圉(X):库计算机网貉名称'悸改日期,,noise.rriat2014/3/1S 19:181^gnoisenKlsx2014/3/1& 19:01I HKTIAB ▼> ®文件名曲):iriOL XISX文件类型⑴;Recognized Filww取消 |JJWorkspace圄■鱼1鲂I^Lr Select data ...〒Name *田[甌Value<874x2 double* rrrCommand Window■+* □ ? X>> plol (datadia?^ I. = 2), J DisplayMafte J p J dataCl;874? 1;2)a ? J YDataSource 1/ data(i:B74? 1:2^ ) .f igurt (ecf)九—K —图81 f 4New to MATLAB? Watch thi$ Sdg see 口旳口轧 or read Getting 5t^rt 亡cLNew Parallel D”ktq 因❼Ctirrent F file Edit 0ew Ins-ert lo&ls Desktop Window Help□ U 矗B |輿耳U 物穏摇TO □囲I ■口IXCommaHd Window。
在Excel中使用MATLAB

专题十外部程序接口10.1 在Excel中使用MATLAB☐Spreadsheet Link程序☐将Excel表格中的数据导出到MATLAB工作空间中☐从MATLAB工作空间导入数据到Excel表格中☐在Excel中调用MATLAB函数进行运算1. Spreadsheet Link程序Spreadsheet Link程序是MATLAB提供的Excel与MATLAB的接口,通过Spreadsheet Link,可以在Excel工作区和MATLAB工作区之间进行数据交换,也可以在Excel中调用MATLAB的函数。
(1)安装Spreadsheet Link的安装是在MATLAB安装过程中,随其他组件一起安装的。
安装完成后,还需要在Excel中进行一些设置后才能使用。
(2)设置选 Excel “文件”菜单的“选项”菜单项,打开“Excel选项”对话框。
在“Excel选项”对话框中,选左边栏的“加载项”,然后单击右边面板下部的“转到”按钮,弹出“加载宏”对话框。
(2)设置在“加载宏”对话框中,单击“浏览”按钮,打开文件“浏览”对话框。
在文件“浏览”对话框,选MATLAB的安装文件夹的子文件夹toolbox\exlink。
在文件夹exlink中选excllink.xlam文件,单击“确定”按钮返回。
(2)设置“加载宏”对话框的“可用加载宏”列表中多了一个“Spreadsheet Link 3.2.5 for use with MATLAB and Excel”选项。
选中该项,返回Excel窗口。
(3)MATLAB命令组加载Spreadsheet Link 后,在Excel窗口“开始”选项卡中多了一个MATLAB命令组。
命令组中包含的一组命令项,分别用于实现启动MATLAB、导入和导出数据、调用MATLAB函数等。
2. 将Excel表格中的数据导出到MATLAB工作空间例1 文件“测试数据.xlsx”存储某门店销售数据,将其中的A~E列的数据导出MATLAB工作区,存入变量sale。
matlab与excel

8.[num, txt]= xlsread(filename, …) 返回数字矩阵 num 和文本数据 txt. txt 是一个元胞数组,如同例 7.1-1 中的 textdata,txt 中与数字对应 位置的元胞为空字符串( '')。 9.[num, txt, raw] = xlsread(filename, …) num 和 txt 的解释同上,返回的 raw 为未经处理的元胞数组,既包含数字,又包含文本数据。
第 7 章 MATLAB 与 Excel 文件的数据交换
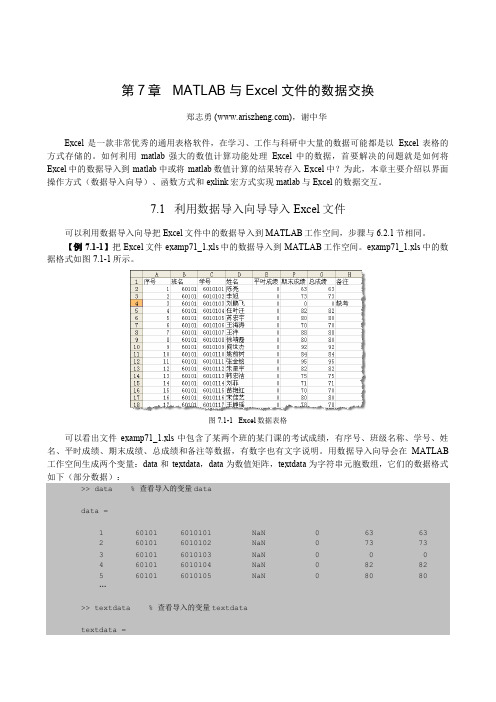
郑志勇 (),谢中华 Excel 是一款非常优秀的通用表格软件,在学习、工作与科研中大量的数据可能都是以 Excel 表格的 方式存储的。如何利用 matlab 强大的数值计算功能处理 Excel 中的数据,首要解决的问题就是如何将 Excel 中的数据导入到 matlab 中或将 matlab 数值计算的结果转存入 Excel 中?为此,本章主要介绍以界面 操作方式(数据导入向导)、函数方式和 exlink 宏方式实现 matlab 与 Excel 的数据交互。
>> data data = 1 2 3 4 5 … >> textdata textdata = 60101 60101 60101 60101 60101 6010101 6010102 6010103 6010104 6010105 NaN NaN NaN NaN NaN 0 0 0 0 0 63 73 0 82 80 63 73 0 82 80 % 查看导入的变量 data
7.1 利用数据导入向导导入 Excel 文件
可以利用数据导入向导把 Excel 文件中的数据导入到 MATLAB 工作空间,步骤与 6.2.1 节相同。 【例 7.1-1】把 Excel 文件 examp71_1.xls 中的数据导入到 MATLAB 工作空间。examp71_1.xls 中的数 据格式如图 7.1-1 所示。
如何将matlab中的数据导入excel的方法

如何将matlab中的数据导入excel的方法
如何将matlab中的数据导入excel的方法
如何将matlab中的数据导入excel的方法:
matlab中的数据导入excel步骤2:然后找到你要存放文件的位置复制绝对路径(致谢文件名的话就会存放在当前目录中),如图以f盘根目录为例)
matlab中的数据导入excel步骤3:然后写xlswrite函数,格式如图,具体格式课参看helpxlswrite,如图
matlab中的数据导入excel步骤4:xlswrite函数前一项是路径,后一项是要输出的矩阵。
matlab中的数据导入excel步骤5:然后点击执行,等待一下,就会在指定位置新建xls文件,打开如图:
matlab中的数据导入excel步骤6:如要竖着输出数据的话,将矩阵转置即可
matlab中的数据导入excel步骤7:在后面可控制输出数据在xls 中的范围,如A:D,2:16等
注意:转置后原来的数据只会被覆盖不会消失
matlab中的数据导入excel步骤8:要读出xls中的文件时可用函数xlsread用法相同。
MATLAB与excel混合使用
本章主要介绍如何在excel平台下使用MA TLAB资源。
MA TLAB提供的Spreadsheet Link 将Microsoft Excel和MA TLAB完美结合,即在Excel表单中利用MA TLAB资源,包括科学计算和绘图功能。
其工作原理是:首先在Excel表单中创建命令,然后传递给MA TLAB后台处理,最后将后台处理结果回传到Excel表单中。
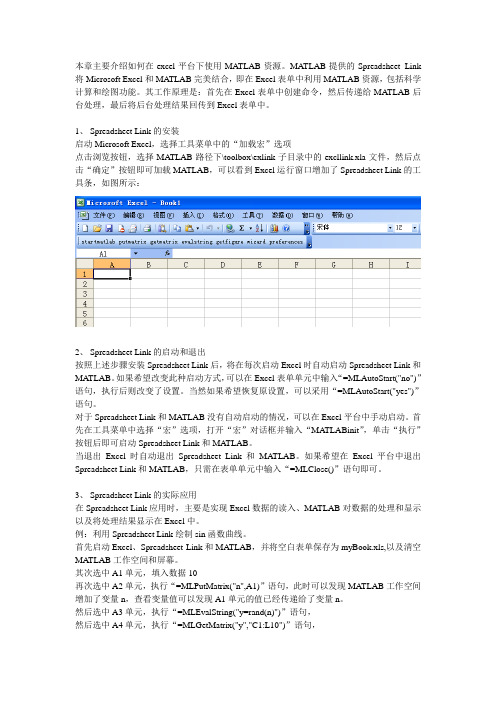
1、Spreadsheet Link的安装启动Microsoft Excel,选择工具菜单中的“加载宏”选项点击浏览按钮,选择MA TLAB路径下\toolbox\exlink子目录中的excllink.xla文件,然后点击“确定”按钮即可加载MA TLAB,可以看到Excel运行窗口增加了Spreadsheet Link的工具条,如图所示:2、Spreadsheet Link的启动和退出按照上述步骤安装Spreadsheet Link后,将在每次启动Excel时自动启动Spreadsheet Link和MA TLAB。
如果希望改变此种启动方式,可以在Excel表单单元中输入“=MLAutoStart("no")”语句,执行后则改变了设置。
当然如果希望恢复原设置,可以采用“=MLAutoStart("yes")”语句。
对于Spreadsheet Link和MA TLAB没有自动启动的情况,可以在Excel平台中手动启动。
首先在工具菜单中选择“宏”选项,打开“宏”对话框并输入“MA TLABinit”,单击“执行”按钮后即可启动Spreadsheet Link和MA TLAB。
当退出Excel时自动退出Spreadsheet Link和MA TLAB。
如果希望在Excel平台中退出Spreadsheet Link和MA TLAB,只需在表单单元中输入“=MLClose()”语句即可。
3、Spreadsheet Link的实际应用在Spreadsheet Link应用时,主要是实现Excel数据的读入、MA TLAB对数据的处理和显示以及将处理结果显示在Excel中。
如何将Excel中的数据导入MATLAB并在MATLAB中画出图像
1.如何将Excel中的数据在MATLAB界面下显示出来:
首先Excel必须就是office的(WPS的不可以,MATLAB不能识别),在MATLAB中使用命令xlsread读取Excel中的数据到MATLAB里,如下所示:[number,txt,raw]=xlsread('noise、xlsx'),此时读取的文件须在MATLAB默认路径下,命令具体用法及参数含义可直接用help命令在MATLAB中查找。
读取的数据界面如下:
2.如何将Excel中的数据导入MATLAB并在MATLAB中画出图像?
首先Excel必须就是office的(WPS的不可以,MATLAB不能识别), Data-在工作路径下找到需要导入的文件(图3)-点击打开(图4)-点击next-点击finish-导入成功-在workspace中瞧到图5(导入的数据)。
至
此数据导入成功。
下面就是如何利用该数据绘图:
法一:双击workspace中的data打开如图6,选中要画图的数据如图7(数据范围可以根据需要随便选择),点击上方的plot(data(1:874,1:2),画出图像如图8,并且在工作空间中自动显示画图命令。
法二:直接在工作空间中写画图命令。
图3
图4 图5
图6
图7
图8。
MATLAB与Excel交互

MATLAB与Excel交互一、仅数据交互功能Xlsreaddata = xlsread('C:\Users\Administrator\Desktop\test.xls');Xlswritedata1 = [1 2 3; 4 5 6];xlswrite('data1.xlsx', data1);Xlsfinfo二、MATLAB作为自动化客户端调用Excel服务器打开自动化he = actxserver('Excel.Application');//创建一个excel实例对象he.Visible = 1;//用get(handle)来获取句柄为handle对象的属性,用invoke(handle)来获取handle对象的方法,通过设置属性和方法实现对Excel的操作。
其实从上面的第一行之后就已经创建了Excel对象,但我们并没有看到Excel,因此不方便对其进行操作,这是因为默认情况下Excel对象的’Visible’属性默认值为0,将其设为1才能可见建立工作表hw = he.Workbooks.Add;//创建一个活动工作组对象及增加一个工作本(簿)对象数据交互获取工作表和激活的一个工作表hs = hw.Worksheets;//获得当前工作本句柄hs1 = Item(hs, 1);写入一个数到Excel中hr = hs1.Range('A1');hr.Value = 1;写入一个矩阵hr2 = hs1.Range('A1:A10');hr2.Value = randi([0 1],10,10);图表交互利用Excel表格的矩阵数据画出一个折线图hshape = hs1.Shapes;hchart = hshape.AddChart(hr2);theChart = hchart.Chart;set(theChart, 'ChartType', 'xlLine');plot(randi([0 1],10,10));hgexport(gcf, '-clipboard');hs1.Range('C3').PasteSpecial;thefigure = Item(hshape, 2); IncrementLeft(thefigure, 10); IncrementTop(thefigure, 10);x = -2*pi:0.1*pi:2*pi;y = sin(x);plot(x,y);hgexport(gcf, '-clipboard');//复制到粘贴板hs1.Range('C3').PasteSpecial;//粘贴到指定位置thefigure = Item(hshape, 2); IncrementLeft(thefigure, 10); IncrementTop(thefigure, 10);。
MATLAB与Excel文件的数据交换
%code by ariszheng@ %2010-6-22 %% %文件名称“excel.xls” [typ, desc, fmt] = xlsfinfo('excel.xls') %文件在当前工作目录下,直接输入文件名称即可。 system('taskkill /F /IM EXCEL.EXE');
注释:在用 matlab2009a 与 Excel2007 进行数据交互时,每次使用 xls 类函数,都会重新开启一个 Excel 进程,若反复使用 xls 类函数会导致系统中多个 Excel 进程并存,消耗系统资源,导致系统运行速度 下降,故作者使用 system('taskkill /F /IM EXCEL.EXE')调用 windows 的 taskkill 函数关闭刚使用的 Excel 进 程。 本例输出结果如下:
'总成绩' '' '' '' '' ''
'备注' '' '' '缺考' '' ''
7.2 调用函数读写 Excel 文件
7.2.1 调用 xlsfinfo 函数获取文件信息 在读取 Excel 目标数据文件前,可以通过 xlsfinfo 函数获取该文件的相关信息,为后续操作获得有效 信息(例如,文件类型、文件内部结构、相关的软件版本等)。 xlsinfo 函数的调用格式如下:
matlab与excel连接matlab画图
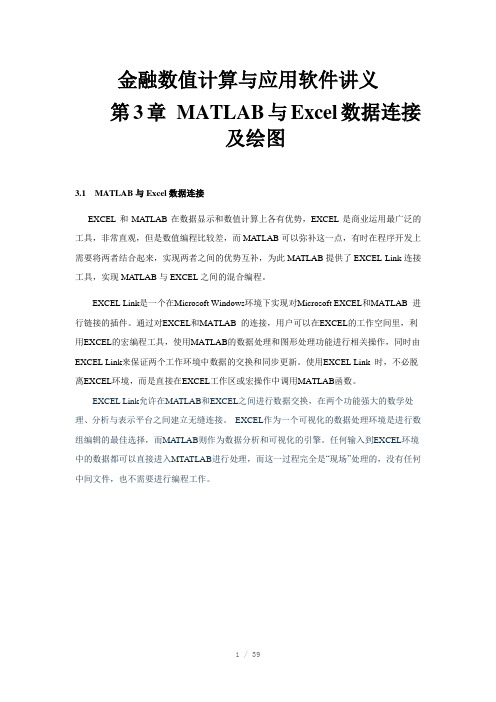
金融数值计算与应用软件讲义第3章MATLAB与Excel数据连接及绘图3.1 MATLAB与Excel数据连接EXCEL和MATLAB在数据显示和数值计算上各有优势,EXCEL是商业运用最广泛的工具,非常直观,但是数值编程比较差,而MA TLAB可以弥补这一点,有时在程序开发上需要将两者结合起来,实现两者之间的优势互补,为此MATLAB提供了EXCEL Link连接工具,实现MA TLAB与EXCEL之间的混合编程。
EXCEL Link是一个在Microsoft Windows环境下实现对Microsoft EXCEL和MATLAB 进行链接的插件。
通过对EXCEL和MATLAB 的连接,用户可以在EXCEL的工作空间里,利用EXCEL的宏编程工具,使用MATLAB的数据处理和图形处理功能进行相关操作,同时由EXCEL Link来保证两个工作环境中数据的交换和同步更新。
使用EXCEL Link 时,不必脱离EXCEL环境,而是直接在EXCEL工作区或宏操作中调用MATLAB函数。
EXCEL Link允许在MATLAB和EXCEL之间进行数据交换,在两个功能强大的数学处理、分析与表示平台之间建立无缝连接。
EXCEL作为一个可视化的数据处理环境是进行数组编辑的最佳选择,而MA TLAB则作为数据分析和可视化的引擎。
任何输入到EXCEL环境中的数据都可以直接进入MTA TLAB进行处理,而这一过程完全是“现场”处理的,没有任何中间文件,也不需要进行编程工作。
3.1.1 MATLAB和Excel的接口安装:. Excel Link的安装和和设置首先,在系统中安装Excel软件。
然后安装Matlab和Excel Link,用Matlab安装盘开始安装,选择自定义安装中,在选中组件ExcelLink,如下图所示:安装完Excel Link后还需要在Excel中进行一些设置后才能使用。
启动Excel,选择菜单“工具”项下的“加载宏”项,弹出如下对话框:选中Excel Link项。
MATLAB与Excel间的数据交换

陈爵 安 疆门鹭江职业大学讲师 . 福州大学电气系 电器专业在职博士研 究生(605 3 10 )
・ 3 4 ・
维普资讯
22 M T A . A L B与 E cl xe 问实现数据 交抉的方法 所有 E clLn xe i k的操作均 在 E cl xe 环境 下进行。 xe Ecl Ⅱ 共有 1 1个函数 。其 中 4个为 L l k管理 函数 , 7个为 Da t a管理函数.除 了 m bn qi“外 , 其它所有函数 的调用 方 法 与 E【 l 】e 函数的使用一样 . c 即在 E cl xe 工作 表的某一 单元 格 中键入 =u c o_ a ev lbe) fn tn n m ( als i m 即可 , 是括 号 内的 只 变量需加双 引号 。 MA L T AB与 E cl xe 问进 行数据 交抉最常 用的两 个 函数 为 mg ta x及 m pt a l, 者是将 M T A l mt e d lum tx 前 r A L B中的矩阵
t =0: 2: . 0. I 4:
u +2: =t
Y e t; = 叩{ )
A= Lu v; 【; ;l
运行 eqll, lnDe 可知矩阵变量 A为 3 8矩 阵; k x ( ) 回至 E cl在 单元 格 B 3返 xe, 6中键入 = l ta i mg m tx e r ( ^ B ) , “ , 2 ” 当按回车键时 . 阵变量 A的 内容便写入 矩 至工 作表的区域 B : 21 4中. 同时单元格 B 6的返 回值为 O ( )用类 似的方法 在单 元格 B ~ 9中链人 m p ta 4 7B lum — t茸函数 。 函数 将 E e f i 该 xd工作表 中区域 B : 、 3I 、 4I 2I B : 1 : 2 31 4 的数据分别写入 M T A A L B的矩 阵变量 x Y z中。运行后进 ., 入 MA L B环境 , TA 查看变量 z Y z的内容 , 们应与 Ecl ,, 它 xe 工作表中的数据相对应 ; ( )单元格 B 0 B 中所用的 函数 ml slg意为在 5 1、 1 1 e tn wlr E cl xe 环境 中调用 MA L B命令。这两个命 令执 行后, TA 生成 图形 F ̄r o1 打 开图形可看 到一条 直线及一 条指 数 曲 i e N 、, , u
- 1、下载文档前请自行甄别文档内容的完整性,平台不提供额外的编辑、内容补充、找答案等附加服务。
- 2、"仅部分预览"的文档,不可在线预览部分如存在完整性等问题,可反馈申请退款(可完整预览的文档不适用该条件!)。
- 3、如文档侵犯您的权益,请联系客服反馈,我们会尽快为您处理(人工客服工作时间:9:00-18:30)。
2 读取数据xlsread函数
xlsread函数语法 1.[ data,textdate]= xlsread(filename) 输入参数: Filename:目标文件地址(若文件在matlab当前 的工作目录中,Filename为’文件名’,如果文件 不在matlab当前的工作目录中,filename为’文件 路径\文件名’) 输出参数: Data: 数值数据 Textdate: 文字数据
2.data= xlsread(filename, sheet, raቤተ መጻሕፍቲ ባይዱge) 输入参数:
Filename:目标文件地址(若文件在matlab当前的 工作目录中,Filename为’文件名’,如果文件 不在matlab当前的工作目录中,filename为’文 件路径\文件名’)
Sheet:数据表名称,例如excel默认表名称sheet1。 Range:数据所在位置,例如A1,B13等 输出参数:
4.3 Excel2007加载与使用宏 加载方法: 点击excel的office按钮点击excel选项在加载项中 点击 转到见下图
浏览(matlab的安装路径)toolbox文件夹 exlink文件夹 excllink.xla文件(打开)
使用方法: excel2007加载项下可以发现exlink相关的按钮, 具体使用方法与exlink在excel2003中的使用方 法一样。
目录
中,filename为’文件路径\文件名’); M: 写入excel中的数据,M存储数据的变量名称; Sheet: 写入excel中的sheet名称( 可选,若空默认sheet1); Range:写入excel中的单元格区域(可选,若空默认’A1’); 输出参数: status: 写入状态 “1”表示写入成功“0”表示写入失败 message: 若失败,则显现失败信息
1.获取文件信息xlsfinfo函数
xlsinfo函数语法: [typ, desc, fmt] = xlsfinfo(filename)
输入参数: Filename:目标文件地址(若文件在matlab当前的 工作目录中,Filename为’文件名’,如果文件不在 matlab当前的工作目录中,filename为’文件路径\ 文件名’,例如:E:\other\案例书籍\abc.xls) 输出参数: Typ:目标文件类型 Desc:目标文件内部表名称(sheetname) Fmt:支持目标文件的软件版本
'sheet2', 'B1:E1') [status, message] = xlswrite ('funddata.xls', textdate’,
'sheet2', 'A2:A5') %textdate’ 表示转置即将行变为列
%计算相关性 R = corrcoef(data)
%写入到excel数据 [status, message] = xlswrite ('funddata.xls', R, 'sheet2‘
, 'B2:E5') %行名称与列名称
textdate=textdate(2,2:5) [status, message] = xlswrite ('funddata.xls', textdate,
5.交互实例
例:funddata.xls中存储着沪深300指数的价 格与博时主题行业、嘉实沪深300、南方绩优成长 的复权数据,要求计算出每只基金的与沪深300指 数的相关性。
%文件信息 [typ, desc, fmt] = xlsfinfo('funddata.xls')
%读取数据 [data,textdate]= xlsread('funddata.xls');
4.Excel-Link宏
4.1加载Excel-link宏
加载方法:在excel工具 加载宏 浏览 (matlab的安装路径)toolbox文件夹 exlink文件夹 excllink.xla文件(双击打
开)。
回到加载宏界面:在Excel link2.3 for use with matlab 选项上打勾,点击确定。
4.2使用Excel-link宏 Startmatlab:点击启动matlab Putmatrix: 将Excel的数据传输到matlab中
在matlab中:可看到传入到matlab中的矩阵x,计算 y=sin(x)
Getmatrix:将matlab的数据传输到excel中
点击getmatrix出入要传入的矩阵变量名称,确定得
Data: 数值数据
3.写入数据xlswrite函数 xlswrite函数语法
[status, message] = xlswrite (filename, M, sheet, range) 输入参数:
Filename:目标文件地址(若文件在matlab当前的工作目录 中,Filename为’文件名’,如果文件不在matlab当前的工作