高考英语写作之图表作文(格式与范例)
(完整)高考英语写作图表说明文模板范文
高考英语指导写作专题:图表说明文一,图表说明1,分类:数字表、函数关系图、曲线图(graph);表格(table);几何图形(figure);图形表、饼状图(pie chart);条状图、柱状图(bar chart);平面图、示意图、外形图(diagram)。
2,一般可分三个层次来写:按照题目要求描述图表反映的总情况,即概括大意。
对数字进行仔细的比较,抓住特点进行分析、归纳并找出产生变化的原因。
读图表后的想法、结论、评论或针对反映出的问题采取的解决措施。
二.表达方式:1,常用的描述句型The table/chart/diagram/graph shows that ...According to the table/chart/diagram/graph...As is shown in the table/chart/diagram/graph...As can be seen from the table/chart/diagram/graph/figures...We can see from the figures/statistics...It is clear/ apparent from the figures/statistics...2.图表中数据(data)的具体表达法数据(data)在某一个时间段固定不变:fixed in time在一系列的时间段中转变:changes over time增加:increase/raise/rise/...减少:decrease/grow down/drop/fall/decline稳定:remain stable3.描写变化的形容词及副词rapid/rapidly,dramatic/dramatically,significant/significantly,sharp/sharplysteep/steeply,steady/steadily,gradual/gradually,slow/slowly,slight/slightly三、写作模板As (is) shown/indicated by the figure/in the table/graph/pie chart/chart,_____ has been increased/decreased significantly/steadily from _____ to_____. From the sharp decline/rise in the chart,it goes without saying that_____.There are at least two reasons accounting for / contributing to ____. On the one hand, _____ On the other hand, _____. _____is due to the fact that_____. In addition,_____is responsible for_____. Maybe there are other reasons to show. But it is generally believed that the above mentioned reasons are commonlyconvincing/persuasive.As far as I am concerned,I hold the view that_____. I am sure my opinion is both sound and well-grounded.四,作文范例1,最近你校对中学生的消费情况进行了调查。
图表型英语作文模板
图表型英语作文模板篇一:英语作文图表类提纲类作文写作模板第一部分、写作模板——图表式作文It is obvious in the graphic/table that the rate/number/amount of Y has undergone dramatic changes. It has gone up/grown/fallen/dropped considerably in recent years (as X varies). At the point of X1, Y reaches its peak of …(多少).What is the reason for this change? Mainly there are …(多少) reasons behind the situation reflected in the graphic/table. First of all, …(第一个原因). More importantly, …(第二个原因). Most important of all, …(第三个原因).From the above discussions, we have enough reason to predict what will happen in the near future. The trend described in the graphic/table will continue for quite a long time (if necessary measures are not taken括号里的使用于那些不太好的变化趋势).第二部分、写作模板——提纲式作文一、说明原因型模块(一)Nowadays , there are more and more XX in some big cities . It is estimated that ( 1 ). Why have there been so many XX ? Maybe thereasons can be listed as follows.The first one is that ( 2 ) .Besides, ( 3 ) . The third reason is ( 4 ). To sum up , the main cause of XX is due to ( 5 ) .It is high time that something were done upon it. For one thing , ( 6 ). On the other hand , ( 7 ). All these measures will certainly reduce the number of XX .注释:(1)用具体数据说明XX现象;(2)原因一;(3)原因二;(4)原因三(5)指出主要原因;(6)解决建议一;(7)解决建议二。
高中英语2023新高考图表类作文素材和写作模板整理

新高考英语图表类作文素材一、常用素材Recently a survey has been done to find out ... In this survey, ...were interviewed. Most of the surveyed answered...为了找出/发现……,最近做了一项调查。
在这项调查中,……接受了采访。
大多数受访者回答说……The results are as follows.结果如下。
As is apparently shown in the table above, ...正如上表所突显的那样,……As is shown in the table(chart)/As can be indicated in the table(chart)/According to the figures given in thetable(chart), ...如表(图)所示,……It can be seen from the table that.../From the table we can see that...从表中可看出…/从表中我们可知……As is shown in the(pie/bar)chart/graph/diagram/table ...如图(饼图/条形图)图表/图形/表格所示……As we can see from the table that...正如我们从表中看到的那样……As can be seen from the diagram, great changes have taken place in ...从图表中可以看出,……发生了巨大的变化……As is shown by the graph, we can easily find out that...如图所示,我们可以很容易找到发现……It is expected to increase ... times.预计将/有望增加……倍。
英语作文图表作文(五篇范文)

英语作文图表作文(五篇范文)第一篇:英语作文图表作文图表分析作文1As is clearly shown in the table/ figure/ graph / chart, 图表总体描述 between 年代 and 年代.Especially, 突出的数据变化.There are three reasons for 具体表示急剧上升、下降或特殊现象的词.To begin with, 原因一.In addition / Moreover, 原因二.For example, 具体例证.Last but no least, 原因三.In short,总结上文.As far as I am concerned, / For my part, / As for me,作者自己的观点.On the one hand, 理由一.On the other hand, 理由二.In brief,总结上文.图表分析作文2The table / figure / graph / chart shows that 图表总述from 年代to年代.It is self-evident that突出的数据变化.Three possible reasons contribute to 具体表示急剧上升、下降或特殊现象的词或代词代替上文内容.One reason is that原因一.Another reason is that 原因二.For instance,举例证.What’s more原因三.As a result, 重述上文之趋势.However, in my opinion 作者观点.For one thing,理由一.For another, 理由二.T o sum up,总结上文.图表分析作文3It can be seen from the table / figure / graph / chart that图表总述between年代and年代.Especially,突出的数据变化.Why are there such great changes during 图表涉及的年头数years? There are mainly two reasons explaining具体表示急剧上升、下降或特殊现象的词或代词代替上文内容.First,原因一.In the old days,比较法说明过去的情况.But now,说明现在的情况.Second,原因二.As a result,总结上文.In my viewpoint,作者自己的观点.On the one hand,论点一.On the other hand,论点二.图表分析作文4As the table / figure / graph / chart shows,图表总述in the past years年代.Obviously,突出的数据变化.Why are there suchsharp contrasts during 图表涉及的年头 years?Two main factors contribute to具体表示急剧上升、下降或特殊现象的词或代词代替上文内容.First of all,原因一.In the past,比较法说明过去的情况.But now 说明现在的情况.Moreover,原因二.Therefore,总结上文.As I see it,作者自己的观点.For one thing,论点一.For another,论点二.图表作文补充句型• As is shown in the graph…如图所示…•The graph shows that…图表显示…•As can be seen from the table,…从表格中可以看出…•From the chart, we know that…从这张表中,我们可知…• All these data clearly prove the fact that… 所有这些数据明显证明这一事实,即…• The increase of ….In the ci ty has reached to 20%.….在这个城市的增长已达到20%.• In 1985, the number remained the same.1985年,这个数字保持不变.• There was a gradual decline in 1989.1989年,出现了逐渐下降的情况.第二篇:英语图表作文图表描述专题训练(一)这类作文时,注意以下几点:第一,审题时,除了要把握好图表的表层信息外,还要分析图标的深层含义,如原因、根源、可能的发展趋势等。
英语图表作文模板及精选4篇

英语图表作文模板及精选4篇(经典版)编制人:__________________审核人:__________________审批人:__________________编制单位:__________________编制时间:____年____月____日序言下载提示:该文档是本店铺精心编制而成的,希望大家下载后,能够帮助大家解决实际问题。
文档下载后可定制修改,请根据实际需要进行调整和使用,谢谢!并且,本店铺为大家提供各种类型的经典范文,如总结报告、合同协议、规章制度、条据文书、策划方案、心得体会、演讲致辞、教学资料、作文大全、其他范文等等,想了解不同范文格式和写法,敬请关注!Download tips: This document is carefully compiled by this editor. I hope that after you download it, it can help you solve practical problems. The document can be customized and modified after downloading, please adjust and use it according to actual needs, thank you!Moreover, our store provides various types of classic sample essays, such as summary reports, contract agreements, rules and regulations, doctrinal documents, planning plans, insights, speeches, teaching materials, complete essays, and other sample essays. If you want to learn about different sample formats and writing methods, please pay attention!英语图表作文模板及精选4篇学而不思则罔,思而不学则殆,以下是本店铺给大伙儿收集整理的英语图表作文模板及精选4篇,欢迎参考。
高考英语图表作文模板

高考英语图表作文模板Introduction:The following essay template is designed to guide students through the process of writing a descriptive essay based on a chart or graph, which is a common task in the English section of the Chinese National College Entrance Examination (Gaokao).Paragraph 1: Introduction- Begin with a general statement about the chart or graph.- Introduce the main trends or features that will be discussed.Example:The chart illustrates the changes in the number of peopleusing public transportation in a city from the year 2000 to 2010.Paragraph 2: Describing Trends- Describe the overall trend or trends in the data.- Use comparative language to compare different data points.Example:An overall upward trend is observed, with the number of users increasing steadily each year. Notably, there was asignificant surge in 2005, followed by a slight decline inthe subsequent year.Paragraph 3: Highlighting Specific Data Points- Discuss specific data points that are particularlyinteresting or relevant.- Use a variety of vocabulary to describe changes (e.g., rise, fall, peak, drop).Example:In 2000, only 20,000 people used public transportation, but this figure rose to 50,000 by 2008. The highest number of users, 70,000, was recorded in 2009, indicating a substantial preference for public transport during that year.Paragraph 4: Possible Explanations- Offer potential reasons for the trends or data points observed.- Use conditional or hypothetical language to discuss these possibilities.Example:The increase in public transportation users could beattributed to the government's campaign to promote greener commuting options. Additionally, the introduction of new bus routes and the expansion of the subway system may have contributed to the rise in popularity.Conclusion:- Summarize the main points discussed in the essay.- Restate the significance of the trends or data without introducing new information.Example:In conclusion, the chart clearly demonstrates a growingreliance on public transportation over the decade. The data not only reflects the success of environmental initiatives but also the city's commitment to improving itstransportation infrastructure.Vocabulary and Grammar Tips:- Use a range of vocabulary to describe trends (e.g., fluctuate, stabilize, decline).- Employ comparative and superlative forms (e.g., higher, the highest).- Utilize appropriate time markers (e.g., during, between, over the period).- Practice using passive voice where appropriate (e.g., was recorded, has been observed).Remember to practice writing essays using different types of charts and graphs to familiarize yourself with various data presentations. This will prepare you for the Gaokao English writing section and enhance your overall descriptive writing skills.。
英语图表高中作文【优秀3篇】
英语图表高中作文【优秀3篇】(经典版)编制人:__________________审核人:__________________审批人:__________________编制单位:__________________编制时间:____年____月____日序言下载提示:该文档是本店铺精心编制而成的,希望大家下载后,能够帮助大家解决实际问题。
文档下载后可定制修改,请根据实际需要进行调整和使用,谢谢!并且,本店铺为大家提供各种类型的经典范文,如工作资料、求职资料、报告大全、方案大全、合同协议、条据文书、教学资料、教案设计、作文大全、其他范文等等,想了解不同范文格式和写法,敬请关注!Download tips: This document is carefully compiled by this editor.I hope that after you download it, it can help you solve practical problems. The document can be customized and modified after downloading, please adjust and use it according to actual needs, thank you!In addition, this shop provides you with various types of classic model essays, such as work materials, job search materials, report encyclopedia, scheme encyclopedia, contract agreements, documents, teaching materials, teaching plan design, composition encyclopedia, other model essays, etc. if you want to understand different model essay formats and writing methods, please pay attention!英语图表高中作文【优秀3篇】There are differences between high school in China and that in the United States。
高考英语作文实用模板

高考英语作文实用模板一.高考英语作文图表作文实用模板As is shown / indicated (显示)/ illustrated (阐述、展示)by the figure (数字)/percentage in the table (表格) / graph (图表)/picture /pie /chart (图表), 作文题目的议题__ has been on the rise ( 上升) / on the decrease (在下降)( has been going up / increasing / dropping /decreasing ) significantly (显著地) /steadily (稳定地)from 数据1 __ to数据2 . From the sharp / marked (显著的)decline (下降)/ rise in the chart, it goes without saying that 结论(作文论点).There are at least two good reasons accounting for(说明;解释)结论(作文论点. On the one hand, 原因之一. On the other hand,作文论点is due to the fact that 原因之二.In addition, 原因之三is responsible for 结论(作文论点). Maybe there are some other reasons .But it is generally believed that the above mentioned reasons are commonly convincing (令人信服的) .As far as I am concerned, I hold the point of view that 自己的观点和看法. I am sure my opinion is both sound and well-grounded (有充分根据的)二. 高考英语作文模板:现象说明文Recently ,what amazes (是惊讶) us most is________. There are many reasons explaining _____.The main reason is______. what is more, _________.thirdly_____.As a result_______. Considering all these,_____________.For one thing________,for anothe r____________.In Conclusion______.三. 高考英语话题作文模版:话题作文Nowadays, there are more and more (某种现象) in (某种场合). It is estimated(估计) that (相关数据). Why have there been so many (某种现象)? Maybe the reasons can be listed as follows. The first one is (原因一). Besides, (原因二). The third one is (原因三). To sum up, the main cause of (某种现象) is due to (最主要原因). It is high time that s omething were done upon it. For one thing, (解决办法一). besides, (解决办法二). All these measures will certainly reduce the number of (某种现象)热点话题作文范文A recent survey analyzed the change in number of film-goers and TV watchers in X city. As is shown by the graph, there has been a sharp decline in the number of film-goers during the period from 1992 to 2002, adding up to / amounting to (总计达到) 20,000 in 2002. On the other hand, the number of TV watchers has steadily increased in the last decade(十年), reaching 150,000 in 2002. Finally, it is interesting to note(注意)that there were as many film-goers as TV watchers in year 1998.In my opinion, there might be two reason accounting for (解释说明) the change. Firstly, Watching TV is not only a convenient but cheaper way of enter tainment. One needn’t pay forexpensive seats at the cinema. Secondly, TV makes it possible for people to keep track of (跟踪了解) current events (时世) and the latest developments in science and technology. As a consequence (因此) , most people prefer to stay at home, watching TV, rather than go out to the cinema, which is viewed as a waste of time and money.Personally, there are still a lot of people who enjoy watching films. They argue that the film is a fascinating(迷人的)form of art. Sitting comfortably in the cinema, one can appreciate the latest movies, which will usually be shown on TV far later on. Therefore, I believe that the number of film-goers will be on the rise (增长) in the future.其二:What is shown in the table above indicates (表明) that dramatic changes have taken place in the daily expenses in Xi’an from 1995 to 1999. The expenses on food have declined by 30% (下降) while those on clothing and recreation have increased respectively by 9% and 7%.(分别上升9%和7%)There are two factors(因数) accounting for(说明;解释) these changes. In the first place, the risen income resulting from (由于) economic growth plays a vital role in the less expense on food. In the second place, when food presents no worry to the average, people begin to focus more of their interest on handsome appearance and happy leisure(休闲) time. As a result of such a shift, spending on clothing and recreation increases year by year.From the analyses made above, with the further growth in economy and more changes in life style, the tendency (表明) indicated in the table will continue in the better direction. .创新预测:说明文/图画式/调查报告1. 根据所给表格,为某城市市报写一篇新闻报道,简要描述该市近年家用电脑用户增长情况,并分析其增长原因。
英语图表作文模板及范文(通用12篇)

英语图表作文模板及范文(通用12篇)(经典版)编制人:__________________审核人:__________________审批人:__________________编制单位:__________________编制时间:____年____月____日序言下载提示:该文档是本店铺精心编制而成的,希望大家下载后,能够帮助大家解决实际问题。
文档下载后可定制修改,请根据实际需要进行调整和使用,谢谢!并且,本店铺为大家提供各种类型的经典范文,如工作总结、工作计划、合同协议、条据文书、策划方案、句子大全、作文大全、诗词歌赋、教案资料、其他范文等等,想了解不同范文格式和写法,敬请关注!Download tips: This document is carefully compiled by this editor. I hope that after you download it, it can help you solve practical problems. The document can be customized and modified after downloading, please adjust and use it according to actual needs, thank you!Moreover, our store provides various types of classic sample essays for everyone, such as work summaries, work plans, contract agreements, doctrinal documents, planning plans, complete sentences, complete compositions, poems, songs, teaching materials, and other sample essays. If you want to learn about different sample formats and writing methods, please stay tuned!英语图表作文模板及范文(通用12篇)英语图表作文模板及范文第1篇The table/chart diagram/graph shows (that)According to the table/chart diagram/graphAs (is)shown in the table/chart diagram/graphAs can be seen from the table/chart/diagram/graph/figures,figures/statistics shows (that)……It can be seen from the figures/statisticsWe can see from the figures/statisticsIt is clear from the figures/statisticsIt is apparent from the figures/statisticstable/chart/diagram/graph figures (that)……table/chart/diagram/graph shows/describes/illustrates图表类英语作文范文The past years have witnessed a mounting number of Chinese scholars returning from overseas.As is lively illustrated by the column chart, the number of returnees climbed from a mere thousand in 20XX to over thousand in 20XX, at an annual increase rate of around 50%.A multitude of factors may have led to the tendency revealed by the chart, but the following are the critical ones from my perspective.First and foremost, along with the development ofChinese economy and society, the number of Chinese studying abroad has been soaring in the past years, which has provided an eXpanding base for the number of returnees.In the second place, the government has enacted a series of preferential policies to attract overseas Chinese scholars back st but not least, the booming economy, science and technology in this country have generated more attative job opportunites for scholars returning from overseas.The waves of returnees will definitely contribute to this nation’s development, since they have brought back not only advanced science and technology but also pioneering concepts of education and management.With more scholars coming back from overseas, and with the concerted efforts of the whole nation,we have reasons to eXpect a faster rejuvenation of this country.更多培训课程:苏州个人提升英语更多学校信息:苏州虎丘区朗阁教育机构咨询电话:英语图表作文模板及范文第2篇Students tend to use computers more and more frequently nowadays.Reading this chart, we can find that the average number of hours a student spends on the computer per week has increased sharply.In 1990, it was less than 2 hours; and in 1995, it increased to almost 4 hours, and in 2000, the numbersoared to 20 hours.Obviously computers are becoming increasingly popular.There are several reasons for this change.First,computers facilitate us in more aspects of life.Also, the fast development of the Internet enlarges our demands for using computers.We can easily contact with friends in remote places through the Internet.Besides, the prices of computers are getting lower and lower,which enables more students to purchase them.However, there still eXist some problems, such as poor quality, out-of-date designs and so on.And how to balance the time between using computers and studying is also a serious problem.Anyhow, we will benefit a lot from computers as long as we use them properly.英语图表作文模板及范文第3篇As can be clearly seen from the graph/table/chart (As is shown in the table/figure), great changed have taken place in_______,The_________have/has skyrocketed/jumped from _____to _____.When it comes to the reasons for the changes,different people give different eXplanations.Here I shall just give a begin with, ______What’s more,___________, Last but not least, ________.While it is desirable that ___________,there are still some problems and difficulties for __________Firstly, __________,In addition, __________,In a word, __________.以上就是为大家整理的英语专四图表作文范文模板,希望能够对大家有所帮助。
高考英语图表作文详解+万能必背模板

(万能模板+模板句型+详细指导+举例范文+满分范文)
目录
一.万能模板 .............................................................................................................................................. 2 二.模板表述方法 .............................................................................................................................能模板
As is shown/ indicated/illustrated by the figure/percentage in the table (graph/picture/pie/chart), __作文题目的议题__has been on rise/ decrease (goes up/increases/drops/decreases), significantly/ dramatically /steadily rising/decreasing from__ in __ to __ in __. From the sharp/marked decline/ rise in the chart, it goes without saying that (毫无疑 问的看出) _________________________. There are at least two good reasons accounting for (这里至少有两个原因可以对 X X 作出解释) ______________________. On the one hand(一方面), ______. On the other hand(另一方面), ______ is due to the fact that ________(原因是). In addition(而且), _______ is responsible for _______. Maybe there are some other reasons to show (也许有其他原因要展示)_______. But it is generally believed that the above mentioned reasons are commonly convincing. As far as I am concerned, I hold the point of view that _______. I am sure my opinion is both sound and well-grounded.
高考英语表格类作文模板

高考英语表格类作文模板表格类作文在高考英语考试中是一个常见的题型,通常要求考生根据所给的表格数据,进行分析和总结,并撰写一篇短文。
下面是一个典型的表格类作文模板,供考生参考:第一段,介绍表格内容。
The table/chart shows the (具体内容) from (具体时间/地点/调查对象). It can be seen from the table that (具体数据). The purpose of this table/chart is to (表格/图表目的).第二段,总结表格内容。
From the table/chart, we can see that (总结表格内容). It is clear that (总结内容). This indicates that (总结内容).第三段,分析表格内容。
The reasons for the trend/changes in the table/chart are various. First of all, (原因一). In addition, (原因二). Moreover, (原因三).第四段,个人观点。
In my opinion, (个人观点). This is because (理由一). Furthermore, (理由二). Therefore, I believe that (个人观点).第五段,建议/展望。
Based on the analysis above, it is suggested that (建议一). In addition, (建议二). It is hoped that (展望).以上就是一个典型的高考英语表格类作文模板,考生可以根据具体的表格内容进行相应的调整和拓展。
在写作时,要注意语法准确、用词恰当,同时要保持逻辑清晰,结构完整。
希望考生们在备考时能够充分利用这个模板,提高自己的写作水平,取得理想的成绩。
图表英文作文格式范文
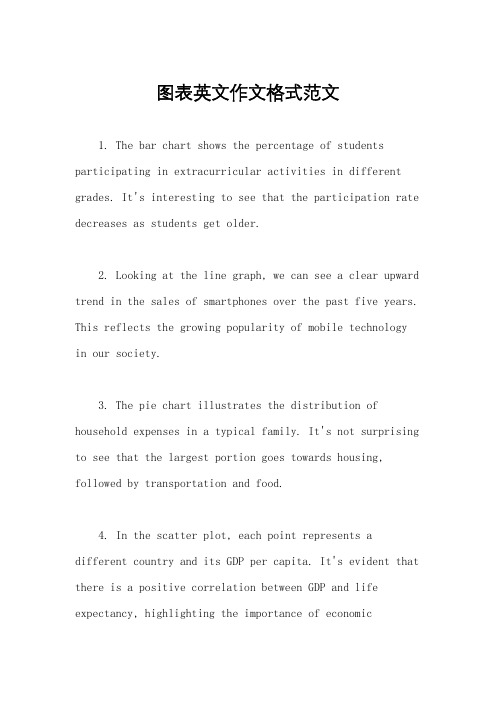
图表英文作文格式范文1. The bar chart shows the percentage of students participating in extracurricular activities in different grades. It's interesting to see that the participation rate decreases as students get older.2. Looking at the line graph, we can see a clear upward trend in the sales of smartphones over the past five years. This reflects the growing popularity of mobile technologyin our society.3. The pie chart illustrates the distribution of household expenses in a typical family. It's not surprising to see that the largest portion goes towards housing, followed by transportation and food.4. In the scatter plot, each point represents a different country and its GDP per capita. It's evident that there is a positive correlation between GDP and life expectancy, highlighting the importance of economicdevelopment in improving quality of life.5. The table provides information on the top five tourist destinations in the world. It's fascinating to see how many millions of visitors each location attracts annually, showcasing the diversity of travel preferences among global tourists.6. The radar chart compares the performance of different departments within a company across various metrics. It's clear that each department has its strengths and weaknesses, emphasizing the need for collaboration and resource allocation.7. The histogram displays the distribution of test scores among students in a class. It's evident that the majority of students fall within the average range, with fewer outliers on either end of the spectrum.8. The line graph compares the changes in temperature over the four seasons in a particular region. It's interesting to note the fluctuations in temperaturethroughout the year, reflecting the dynamic nature of climate patterns.。
英语图表类作文(万能套用模式)

Observe the chart carefully and describe the main trend.
An example
The No. of Students Learning Chinese
12000 10000
8000 6000 4000 2000
0 Jun-94 Jan-95 Jun-95 Jan-96 Jun-96 Jan-97
A similar pattern is also recorded / discovered for…
A similar pattern is also recorded in Japan for the first half of 1995.
Large difference
There is a significant difference between…
An example
The No. of Students Learning Chinese
12000 10000
8000 6000 4000 2000
0 Jun-94 Jan-95 Jun-95 Jan-96 Jun-96 Jan-97
Japan France
Many reasons may account for the new trend. Firstly,…. secondly,….. Thirdly…
_g_r_a_d_u_a_l_/_s_t_e_a_d_y_ decrease reach the __b_o_t_t_o_m__/ _fl_o_o_r___ of…
Fluctuation (波动)
vary / range between 数字A and 数字B vary / range from 数字A to 数字B
高中英语图表类作文万能模板_高中英语作文_
高中英语图表类作文万能模板英语能力是展现一个学生综合英语水平的重要方式,学生词汇量的多少、语法知识的掌握程度和运用水平、英语思维能力和文化积淀都能在写作中得以体现。
下面,是小编为你整理的高中英语图表类作文万能模板,希望对你有帮助!图表类作文万能模板1. As is shown by the graph,(in the table.)… (概述图表)正如曲线所示,最近54年来该国人口飞速增长。
As is shown by the graph,there has been a rapid increase in the population of the country in the past five years.2. It can be seen from the table that(shown graph/concluded figures/estimatedstatistics) … (得出结论)A. 从表中所给的统计数字可以看出,从1985年到1990年中国的人均收入迅速提高。
From the statistics given in the table it can be seen that the average personal income of the Chinese people increased (grew 、rose) rapidly from 1985 to 1990.B. 从曲线图可以得出结论,最近5年来中国人口的出生率已经大大下降。
It can be concluded from the graph that there has been a great decline in birth rates in China in the past five years.3. …amount to … (数量总计)(add up to/come to/sum up to)全部费用合计200美元。
高考英语图表作文模板和范例
图表式作文It is obvious in the graphic/table that the rate/number/amount of Y has undergone dramatic changes. It has gone up/grown/fallen/dropped considerably in recent years (as X varies). At the point of X1, Y reaches its peak value of ...(多少).What is the reason for this change? Mainly there are ... (多少) reasons behind the situation reflected in the graphic/table. First of all, ...(第一个原因). More importantly, ...(第二个原因). Most important of all, ...(第三个原因).第一段:The table/graph/chart shows, as far as ______(is/are)concerned, _______________________.第二段:(第二段分为三种情况:1、一直上升;2、一直下降;3、一部分上升,一部分下降。
下面针对这三种情况进行结构模仿)。
1、(以1978年到1998年城镇乡村收入的稳步较长图为例)。
a.一直上升According to the figures show in the graph, we can see that________, had been increasing at a steady rate from the year of 1978 to 1998. In addition, during the period, ____________had raise from 349.9 Yuan to 5425 Yuan, morethan 5 times .Meanwhile, _______had also grown from 133.6 Yuan to 2100 Yuan.b. 一直下降According to the figures show in the graph, we can see that___________, had been decreasing at e steady rate from the year of 1978 to 1998. In addition, during the periond,____________had reduced from 349.9 Yuan to 5425 Yuan, more than 5 times .Meanwhile ,_______had also gone down 133.6 Yuan to 2100 Yuan.2、[以从1995年到1999年西安人的日常生活支出(食物、服装和娱乐)的变化为例]c. 一部分上升,一部分下降:According to the figures in the graph, we can see that__________had been increasing by 9% and 7%, respectively from the year of 1995 to1999. However,___________(the expenses on food)had been decline by30% ,during the same period. The statistics of rise and fall seem to exist in isolation but closely to one another. 第三段:There are several reasons for that phenomenon. On the hand, _____;On the other hand,_________,___________.注:横线部分为自己需填充的内容,这只是整篇文章的格式,红色横线部分视考题而定,可填充的内容经济类/发展类/旅游类/文化交流类:1. The policy of reformation and opening spreader widely in China should be taken into account firstly, when considering the reason for the steady increase of the citizen's income.2. The people of China has the spirit of working hard in order to improve their living.3. China's rapid economic development lays the base.4. In the past twenty five years, remarkable changes have taken place in China's tourism rank in the world.5. The economy of China has developed so fast in twenty years that China now becomes more and more important in the world.6. I'm confident that with the development of China the numbers of visitors and the foreign exchange earrings will certainly continues to increase in the future.7. With the rapid development of technology and the global economy ,the world is becoming international, cultural exchanges are becoming more and more frequent ,which is inevitably improving our mutual understanding and friendship with other countries.食品类:1、In order to live a healthy long life, we have to restrict our calorie intake eating the food with less fat.2、We should make our diet more nutritional and balance the calorie intake to enjoy a healthy life.3、To improve the bad situation, people should eat calcium-enriched food, such as fish,milk,beancurd and so on . 娱乐类/体育类:如看书/看电视1、We should make a balance between them to benefit themselves.2、The age in which we live now is an information one.3、People should go to the gym and take part in some sports, such as basketball, volleyball, swimming and so .All the exercise help people keep healthy.友谊类/文化交流类:1、People all over the world love and respect each other. The best way to show our love is to help others when they are in difficulties.2、Everyone should be encouraged required to try to be self-reliant.3、When one in trouble, others should help him.PS:经典句子:1、Scientists have warned that unless effective measures are taken, the problem of pollution will eventually get out of hand.2、For citizens ,they are supposed to conform to rules and regulations of the traffic.3、And the government should educate people in this respect ,which will draw people's attention of the serious problem.4、For drivers their speed should be restricted . Otherwise, they should be punished severely.5、It is time the anchorites concerned took proper steps the traffic problem.6、As long as each of us takes actions. I deeply believe the problem will be well resolved to an extend作文中可用的谚语或句子:As a saying goes:俗话说1、A good beginning is half done. 良好的开端是成功的一半。
高考英语作文万能模板:图表类作文

高考英语作文万能模板:图表类作文下面是整理的“高考英语作文万能模板:图表类作文”,欢迎阅读参考,更多有关内容请继续关注本网站高考栏目。
高考英语作文万能模板:图表类作文图表作文写作模板:The chart gives us an overall picture of the 图表主题. The first thing we notice is that 图表最大特点 . This means that as (进一步说明).We can see from the statistics given that 图表细节一 . After 动词-ing 细节一中的第一个变化, the动词-ed+幅度+时间(紧跟着的变化) . The figures also tell us that图表细节二 . Inthe column, we can see that accounts for (进一步描述).Judging from these figures, we can draw the conclusion that (结论). The reason for this, as far as I am concerned is that (给出原因). / It is high time that we (发出倡议).图画类写作模板:1.开头Look at this picture./The picture shows that.../From this picture, we can see.../As is shown in the picture.../As is seen in the picture...2.衔接句As we all know, .../As is known to all,.../It is well known that.../In my opinion,.../As far as I am concerned,.../This sight reminds me of something in my daily life.3.结尾句In conclusion.../In brief.../On the whole.../In short.../In a word.../Generally speaking.../As has been stated...。
高中英语写作万能模板(图表作文)
高中英语写作万能模板1、图表作文万能模板类型:柱状图、折线图、扇形图、表格考情分析:描述表格+分析原因(已知或未知),开头给定或者不给,若给定开头,则根据开头续写剩下的内容,若不给开头,利用本文总结的万能开头。
第一段:描述题目内容There is a pie chart/table/diagram/graph showing 题目描述的主题,as can be seen, during the whole period, all the 描述的对象displayed/showed some kinds of changes at different levels.第二段:描述图形的变化For 描述的图表in 图表所处的时间,compared with the others, 最大的项目showed significant advantage and owned 最大的数字,on the other extreme, 最小的项目only showed 最小的数字.As for the others, they distributed between these two poles.第三段:解释原因On the one hand/Above all/Initially/First of all/Beforehand, 某一个原因is a basic reason/root/ultimate cause/key part of 图表反映的现象,the cause/principle/explanation is that 解释现象的原因1;On the other hand/Besides/Adittionally/Furthermore, the appearance/emergence/occurence of 解释现象的原因 2 should be ascribed/attibutd to 图表反映的现象,for explainations/to understand why/behind it, a truth/reality should be noticed /recognized that 深入解释为什么原因2导致图表反映的现象第四段:(万能结尾)最大值无变化:In conclusion/All in all/Altogether, 最大值描述的对象has remained the obvious/advantaged position over the whole period.最大值有变化:In conclusion/All in all/Altogether, as shown in the graph, 终点最大值描述的对象has replaced起点最大值描述的对象and become 最占优势的项目during the whole period2、练一练例:根据所给表格,为某城市时报写一篇新闻报道,简要描述该市今年家用电脑用户增长情况,并分析其增长原因。
高考英语写作之图表作文(格式与范例)
图表类作文模板句型As can be seen from/in the chart/diagram/table/graph... 从表格/图形中我们可以看到……According to /As is shown in the Table /Figure/Chart...如表格/图表中显示…… It can be seen from the chart/diagram/table/graph/figures/statistics that... 从表格/图表/数据中我们可以看到……From the table/figures/data/results/information above, it can/may be seen/concluded/shown/estimated/calculated/inferred that... 从以上的表格/图表/数据/结果/信息中,我们可以看到/总结/预测/计算/得出……The table shows the changes in the number of...over the period from...to... 该表格描述了在……年之……年间……数量的变化。
As can be seen from the graph, the two curves show the fluctuation of...如图所示,两条曲线描述了……的波动情况。
The pie charts show the changes on... in some place in 2000. 此饼形图显示了2000年一些地方……的变化。
The table shows a three times increase over that of last year. 表格显示比去年上升了3倍。
The number is 5 times as much as that of... 此数字是……的5倍。
- 1、下载文档前请自行甄别文档内容的完整性,平台不提供额外的编辑、内容补充、找答案等附加服务。
- 2、"仅部分预览"的文档,不可在线预览部分如存在完整性等问题,可反馈申请退款(可完整预览的文档不适用该条件!)。
- 3、如文档侵犯您的权益,请联系客服反馈,我们会尽快为您处理(人工客服工作时间:9:00-18:30)。
图表类作文模板句型As can be seen from/in the chart/diagram/table/graph... 从表格/图形中我们可以看到……According to /As is shown in the Table /Figure/Chart...如表格/图表中显示…… It can be seen from the chart/diagram/table/graph/figures/statistics that... 从表格/图表/数据中我们可以看到……From the table/figures/data/results/information above, it can/may be seen/concluded/shown/estimated/ca lculated/inferred that... 从以上的表格/图表/数据/结果/信息中,我们可以看到/总结/预测/计算/得出……The table shows the changes in the number of...over the period from...to... 该表格描述了在……年之……年间……数量的变化。
As can be seen from the graph, the two curves show the fluctuation of...如图所示,两条曲线描述了……的波动情况。
The pie charts show the changes on... in some place in 2000. 此饼形图显示了2000年一些地方……的变化。
The table shows a three times increase over that of last year. 表格显示比去年上升了3倍。
The number is 5 times as much as that of... 此数字是……的5倍。
It has increased by three times as compared with that of ... 同……相比,增长了3倍。
The figure of A is about twice as much as that of B. A的数字是B的两倍。
A has the highest sales figure in the three departments, followed byB and C. 在3个部门中,A的销售额最高,其次是B和C。
The rise lasted for two weeks and then began to level off in August. 上升两个星期后,8月份开始平稳。
It accounts for 30% of the total population. 占到总人口的30%。
The number of students has reached 500, indicating a rise of 20%, compared to last semester. 学生人数达到500人,与上个学期相比上升了20%。
It picked up speed at the end of this month. 这个月底加快了速度。
from this year on,there was a gradual declined reduction in the..., reaching a figure of... 从这年起,……逐渐下降至……There are a lot of similarities/differences between...and... ……与……之间有许多相似(不同)之处It can be drawn from the chart that the proportions of A and B are going down, though the falling leve l of the latter is a lot lower/higher than that of the former. 尽管B的下降速度比A要慢/快,从表中我们可以看到A和B的比例都在下降。
The increase/decrease is more noticeable during the second half of the 5year period. 在5年期限的后半段,增长/降低比较明显。
It falls from 50% in 2000 to 30% in 2004, and then the trend reverse, finishing at 58% in 2005. 从2000年的50%降到2004年的30%,然后形势逆转,2005年达到了58%。
写作详细指导图表作文至少包含描述图表与解释原因两个部分,而当前的图表作文大多还有第三个段落。
图表作文的规律性很强,不像图画式作文那样富于变化。
1.首段的写作图表作文有表格(table)、柱形图(bar chart)、饼状图(pie chart)和折线图(diagram)之分,后三种都属于图表的畴(chart)。
不管是chart还是table,都需要进行描述,一般放在文章的第一部分,长度宜适中。
描述数据我们要首先看看是几个变量(A),每个变量有几个数据(B),不妨以A*B表示。
如果只有一个变量,有三个数据,可以描述如下:From the chart we can see clearly that the average number of hours a student spends on Internet per week has increased from less than two hours in 1998 to nearly four hours in 2000, and then to 20 hours in 2004.如果是最常见的是2*3的情形,可以描述如下:From the chart, we can see clearly that in a big city in China, state-owned houses declined from 75% in 1990 to 60% in 1995 and then to 20% in 2000, while private houses rose from 25% to 40% and then to 80% during the same period.这里用了while引起从句来突显对比,是一种非常好的办法,如果用两句话来描述,也完全可以。
如果是1*n(n>3)的情形,将头与尾描述出来即可,比较好的方法就是在句中描述最后一个与第一个相比变化了多少。
碰到多变量、每个变量多数据的情形,大家应首先进行分类,分成上升、下降两类,或者上升、下降、不变三类,这样问题就迎刃而解了。
2.第二段的写作第二段是解释原因的段落。
我们谈谈两个问题。
首先是过渡句这个问题。
这里不大可能放在第一段,因为第一段不可能像某些命题作文那样简洁(如只有一句)——例如提纲式作文中的批驳类文章中除第二段首句批驳之外还有首段末句批驳,效果很强烈。
其次就是此段的主题句(topic sentence)的问题。
此句或主观或客观,并无拘束,只要上下文风格统一即可。
主观:We believe that three reasons can account for this phenomenon. I believe that three reasons can acco unt for this phenomenon.In my mind, the reasons why the overseas students are on the rise are as follows.主观之变体(使用插入语,突显主语):Three reasons, we believe, can account for this phenomenon. Three reasons, I believe, can account fo r this phenomenon.Three reasons, I firmly believe, can account for this phenomenon.注意:插入语的使用属于看似平淡却极富功力的技巧,可以达到很好的效果。
主观之变体(使用插入语):Three reasons, in my mind, can account for this phenomenon.客观:Several reasons can account for this phenomenon.在主题句之后,可以使用连接词分两个、三个或四个方面来写,其中分三个方面来写最为常见。
这里就与普通的说明文与议论文一样了——可以由最重要的到最不重要的,也可以由最不重要的到最重要的,也可能平行分布,依具体情况而定,不一而足。
3.第三段的写作第三段直接写结论的情况已基本没有了。
如果这篇文章讲的是一个令人担忧的问题,那么这一段写解决办法的可能性最大。
如果这篇文章讲的是一个好的变化,那么这一段很可能是两种情况——可能写负面的影响或存在的问题,或者写未来趋势或发展方向。
注意事项写图表作文,并不是单纯的用语言文字把图表里的所有数字信息一一摊摆,逐条列出,而是利用这些数据,经常还得筛选,将该图表所要说明的主要问题阐述清楚。
就这个意义上说,图表作文属于说明文。
如果图表信息是用来论证某一观点,则图表作文属于议论文。
因此,图表作文在结构处理和写法上与说明文或议论文是相同的。
它通常必须1. 用一个主题句或引言段,综述全图表的中心信息(也就是考生在审阅图表后形成的结论)。
2. 列举三组左右的相关数据来说明或证实主题句或引言段所提及的要点。
分析产生这一图表结论的原因或联想推测可能引起的后果。
文(一)A recent survey analyzed the change in number of film-goers and TV watchers in X city. As is shown by the graph, there has been a sharp decline in the number of film-goers during the period from 1992 to 2 002, adding up to 20,000 in 2002. On the other hand, the number of TV watchers has steadily increase i n the last decade, reaching 150,000 in 2002. Finally, it is interesting to note that there were as man y film-goers as TV watchers in year 1998.There might be two reasons, I think, for the change. Firstly, TV is not only a convenient source of en tertainment, but a comparatively cheap one. There is no point in arranging transport. And one needn’t pay for expensive seats at the cinema. Secondly, TV makes it possible for one to keep track of curren t events and the latest developments in science and technology. As a consequence, most people prefer t o stay at home, watching TV, rather than go out to the cinema, which wastes both time and money.Personally, there are still a lot of people who enjoy watching films. They argue that the film is a fa scinating form of art. Sitting comfortably in the cinema, one can appreciate the latest movies, which will usually be shown on TV far later on. Therefore, I trust the number of film-goers will be on the r ise in the future.文(二):What is shown in the table above indicates that dramatic changes have taken place in the daily expense s in Xi’an from 1995 to 1999. The expenses on food have declined by 30% while those on clothing and r ecreation have increased respectively by 9% and 7%.There are two factors accounting for these changes. In the first place, the risen income resulting from economic growth plays a vital role in the less expense on food. In the second place, when food pr esents no worry to the average, people begin to focus more of their interest on handsome appearance an d happy leisure time. As a result of such a shift, spending on clothing and recreation increases year by year.From the analyses made above, with the further growth in economy and more changes in life style, th e tendency indicated in the table will continue in the better direction.高考英语书面表达练习——图表作文(格式与例)作文一假如你是华,在最近的研究性学习当中,受《21世纪中学生英语报》(The 21st Century)之邀,你对你所在的班60名同学(男女各半)进行了上网目的的调查。