图说meta十四:漏斗图暨Stata软件使用方法简介
statacom 图形分析工具用户指南说明书
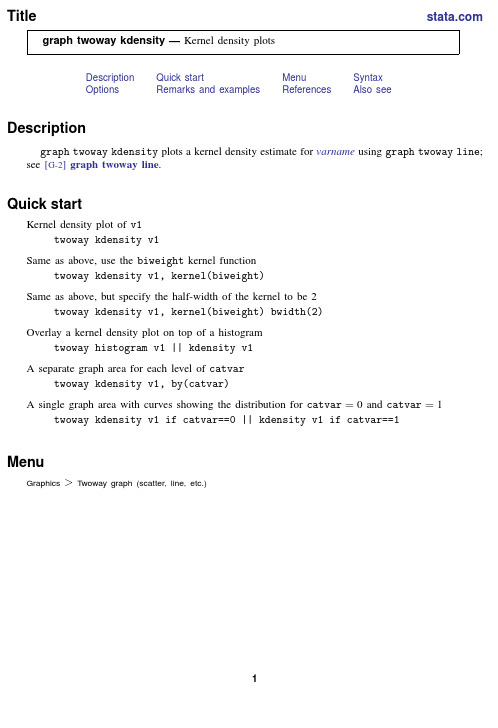
Title graph twoway kdensity—Kernel density plotsDescription Quick start Menu SyntaxOptions Remarks and examples References Also seeDescriptiongraph twoway kdensity plots a kernel density estimate for varname using graph twoway line;see[G-2]graph twoway line.Quick startKernel density plot of v1twoway kdensity v1Same as above,use the biweight kernel functiontwoway kdensity v1,kernel(biweight)Same as above,but specify the half-width of the kernel to be2twoway kdensity v1,kernel(biweight)bwidth(2)Overlay a kernel density plot on top of a histogramtwoway histogram v1||kdensity v1A separate graph area for each level of catvartwoway kdensity v1,by(catvar)A single graph area with curves showing the distribution for catvar=0and catvar=1twoway kdensity v1if catvar==0||kdensity v1if catvar==1MenuGraphics>T woway graph(scatter,line,etc.)12graph twoway kdensity—Kernel density plots Syntaxtwoway kdensity varnameifinweight,optionsoptions Descriptionkernel(kernel)specify kernel function;default is kernel(epanechnikov)bwidth(#)smoothing parametern(#)number of points to evaluaterange(##)range for plot,minimum and maximumrange(varname)range for plot obtained from varnameboundary estimate density one bwidth()beyond maximum and minimum;not allowed with range()horizontal graph horizontallyarea(#)rescaling parametercline options change look of the lineaxis choice options associate plot with alternative axistwoway options titles,legends,axes,added lines and text,by,regions,name,aspect ratio,etc.kernel Descriptionepanechnikov Epanechnikov kernel function;the defaultepan2alternative Epanechnikov kernel functionbiweight biweight kernel functioncosine cosine trace kernel functiongaussian Gaussian kernel functionparzen Parzen kernel functionrectangle rectangle kernel functiontriangle triangle kernel functionfweight s and aweight s are allowed;see[U]11.1.6weight.Optionskernel(kernel)and bwidth(#)specify how the kernel density estimate is to be obtained and are in fact the same options as those specified with the command kdensity;see[R]kdensity.kernel(kernel)specify the kernel-weight function to be used.The default iskernel(epanechnikov).bwidth(#)specifies the smoothing parameter.See[R]kdensity for more information about these options.All the other graph twoway kdensity options modify how the result is displayed,not how it is obtained.n(#)specifies the number of points at which the estimate is evaluated.The default is n(300).graph twoway kdensity—Kernel density plots3 range(##)and range(varname)specify the range of values at which the kernel density estimates are to be plotted.The default is range(m M),where m and M are the minimum and maximum of the varname specified on the graph twoway kdensity command.range(##)specifies a pair of numbers to be used as the minimum and maximum.range(varname)specifies another variable for which its minimum and maximum are to be used.boundary specifies that the result be estimated for one bwidth()beyond the maximum and minimum value of varname.boundary cannot be specified with range().horizontal specifies that the result be plotted horizontally(that is,reflected along the identity line).area(#)specifies a multiplier by which the density estimates are adjusted before being plotted.The default is area(1).area()is useful when overlaying a density estimate on top of a histogram that is itself not scaled as a density.For instance,if you wished to scale the density estimate as a frequency,area()would be specified as the total number of nonmissing observations.cline options specify how the density line is rendered and its appearance;[G-3]cline options.axis choice options associate the plot with a particular y or x axis on the graph;see [G-3]axis choice options.twoway options are a set of common options supported by all twoway graphs.These options allow you to title graphs,name graphs,control axes and legends,add lines and text,set aspect ratios, create graphs over by()groups,and change some advanced settings.See[G-3]twoway options. Remarks and examples graph twoway kdensity varname uses the kdensity command to obtain an estimate of the density of varname and uses graph twoway line to plot the result.Remarks are presented under the following headings:Typical useUse with by()4graph twoway kdensity—Kernel density plotsTypical useThe density estimate is often graphed on top of the histogram:.use https:///data/r18/lifeexp(Life.Notice the and make the line stand out;see[G-4]colorstyle.You can modify the text for the keys in the legend using the legend()option;see[G-3]leg-end options.graph twoway kdensity—Kernel density plots5 Use with by()graph twoway kdensity may be used with by():.use https:///data/r18/lifeexp,clear(Life expectancy,1998).Because we have only three graphs,we will move the legend to the empty cell,which is the fourth position of our2×2array.The pos(0)suboption moves the legend to the middle position within the cell:.twoway histogram lexp,color(*.5)||kdensity lexp||,To learn more about modifying the legend when using the by()option,see Use of legends with by()in[G-3]by option.6graph twoway kdensity—Kernel density plotsReferencesCox,N.J.2005.Speaking Stata:Density probability plots.Stata Journal5:259–273..2007.Software Updates:Speaking Stata:Density probability plots.Stata Journal7:593.Also see[R]kdensity—Univariate kernel density estimation[G-2]graph twoway histogram—Histogram plotsStata,Stata Press,and Mata are registered trademarks of StataCorp LLC.Stata andStata Press are registered trademarks with the World Intellectual Property Organization®of the United Nations.Other brand and product names are registered trademarks ortrademarks of their respective companies.Copyright c 1985–2023StataCorp LLC,College Station,TX,USA.All rights reserved.。
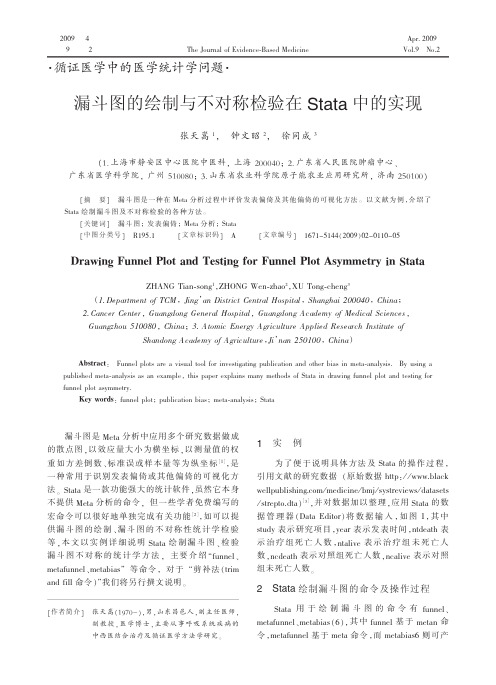
漏斗图的绘制与不对称检验在Stata中的实现
[作者简介]
张 天 嵩 (1970- ), 男 , 山 东 昌 邑 人 , 副 主 任 医 师 , 副教授,医学博士,主要从事呼吸系统疾病的 中西医结合治疗及循证医学方法学研究。
1实例
为 了 便 于 说 明 具 体 方 法 及 Stata 的 操 作 过 程 , 引用文献的研究数据 (原始数据 http: / / www.black wellpublishing.com / medicine / bmj / systreviews / datasets / strepto.dta)[3],并对数据加 以整理 ,应用 Stata 的数 据 ห้องสมุดไป่ตู้ 理 器 (Data Editor) 将 数 据 输 入 , 如 图 1, 其 中 study 表示研究项目,year 表示发 表时间,ntdeath 表 示 治 疗 组 死 亡 人 数 ,ntalive 表 示 治 疗 组 未 死 亡 人 数,ncdeath 表示对照组死亡 人数,ncalive 表示对 照 组未死亡人数。
间 线 及 总 效 应 量 线 、Egger 回 归 方 法 检 验 漏 斗 图 不 对 称 的 相 应 回 归 直 线 , 在 x 轴 上 标 注 “log odds ratio”,在 y 轴 上 标 注 “standard error of log OR”,命 令如下:
stata软件meta分析操作详细攻略

2020/3/5
21
4. 1 亚组分析
按照用药方式 分为两个亚组
*
4. 1 亚组分析菜单命令
输入亚组命令 *
4. 1 亚组分析森林图
不同亚组的异 质性
总的异质性
*
4. 2 meta回归菜单操作
因变量 协变量
标准误 ReML法
*
4. 2 meta回归结果
*
P值大于0.05,提示发 表年限与研究间异质性 无关。
发表偏倚的检验方法:漏斗图法、Begg和Egger法、 剪补法和失安全系数法。
*
5.1 漏斗图法检测发表偏倚
只能定性的识别发 表偏倚。
*
5.2 Begg法检测发表偏倚(二分类)
方法选择 *
5.2 Begg法结果输出
*
调整统计量Z值及 P值。
5.2 Begg法漏斗图
Begg's funnel plot with pseudo 95% confidence limits 4
读书报告
Stata软件在Meta分析中的运用
2020/3/5
1
目录
1 Stata软件简介 2 Stata中二分类资料的Meta分析 3 Stata中连续性资料的Meta分析 4 异质性的处理 5 发表偏倚检验
*
1 第一部分
Stata软件简介
2020/3/5
3
3
1.1 stata软件简介
Stata是一个功能强大而又小巧玲珑的统计分析软 件,最初由美国计算机资源中心(Computer Resource Center)研制,现为Stata公司的产品。从1985年1.0 版 问世以来,通过不断的更新和扩充,软件功能已日趋完善。
Stata软件使用指南说明书

18Learning more about StataWhere to go from hereYou now know plenty enough to use Stata.There is still much,much more to learn because Stata is a rich environment for doing statistical analysis and data management.What should you do to learn more?•Get an interesting dataset and play with Stata.e the menus and dialog system to experiment with commands.Notice what commandsshow up in the Results window.You willfind that Stata’s simple and consistent commandsyntax will make the commands easy to read so that you will know what you have doneand easy to remember so that typing some commands will be faster than using menus.b.Play with graphs and the Graph Editor.•If you venture into the Command window,you willfind that many things will go faster.You will alsofind that it is possible to make mistakes where you cannot understand why Stata is balking.a.Try help commandname or Help>Stata command...and entering the command name.b.Look at the command syntax and the examples in the helpfile,and compare themwith what you pare them closely:small typographical errors make commandsimpossible for Stata to parse.•Explore Stata by selecting Help>Search....You will uncover many statistical routines that could be of great use.•Look through the Combined subject table of contents in the Stata Index.•Read and work your way through the User’s Guide.It is designed to be read from cover to cover,and it contains most of the information you need to become an expert Stata user.It is well worth reading.If you are not this ambitious and instead prefer to sample the User’s Guide and the references,there is some advice later in this chapter for you.•Browse through the reference manuals to read about statistical methods you like to use,making use of the links to jump to other topics.The reference manuals are not meant to be read from cover to cover—they are meant to be referred to as you would an encyclopedia.You canfind the datasets used in the examples in the manuals by selecting File>Example datasets...and then clicking on Stata18manual datasets.Doing so will enable you to work through the examples quickly.•Stata has much information,including answers to frequently asked questions(FAQ s),at https:///support/faqs/.•There are many useful links to Stata resources at https:///links/.Be sure to look at these materials because many outstanding resources about Stata are listed here.•Join Statalist,a forum devoted to discussion of Stata and statistics.•Read The Stata Blog:Not Elsewhere Classified at https:// to read articles written by people at Stata about all things Stata.•Visit Stata on Facebook at https:///statacorp,join Stata on Instagram at https:///statacorp,find Stata on LinkedIn at https:///company/statacorp,and follow Stata on Twitter at https:///stata to keep up with Stata.•Subscribe to the Stata Journal,which contains reviewed papers,regular columns,book reviews, and other material of interest to researchers applying statistics in a variety of disciplines.Visit https://.12[GSM]18Learning more about Stata•Many supplementary books about Stata are available.Visit the Stata Bookstore athttps:///bookstore/.•Take a Stata NetCourse R .NetCourse101is an excellent choice for learning about Stata.See https:///netcourse/for course information and schedules.•Attend a classroom or a web-based training course taught by StataCorp.Visithttps:///training/classroom-and-web/for course information and schedules.•View a webinar led by Stata developers.Visit https:///training/webinar/for the current list of topics and schedule.•Watch Stata videos at https:///user/statacorp.Suggested reading from the User’s Guide and reference manuals The User’s Guide is designed to be read from cover to cover.The reference manuals are designed as references to be sampled when necessary.Ideally,after reading this Getting Started manual,you should read the User’s Guide from cover to cover,but you probably want to become at least somewhat proficient in Stata right away.Here isa suggested reading list of sections from the User’s Guide and the reference manuals to help you onyour way to becoming a Stata expert.This list covers fundamental features and points you to some less obvious features that you might otherwise overlook.Basic elements of Stata[U]11Language syntax[U]12Data[U]13Functions and expressionsData management[U]6Managing memory[U]22Entering and importing data[D]import—Overview of importing data into Stata[D]append—Append datasets[D]merge—Merge datasets[D]compress—Compress data in memory[D]frames intro—Introduction to framesGraphics[G]Stata Graphics Reference ManualReproducible research[U]16Do-files[U]17Ado-files[U]13.5Accessing coefficients and standard errors[U]13.6Accessing results from Stata commands[U]21Creating reports[RPT]Dynamic documents intro—Introduction to dynamic documents[RPT]putdocx intro—Introduction to generating Office Open XML(.docx)files[RPT]putexcel—Export results to an Excelfile[RPT]putpdf intro—Introduction to generating PDFfiles[R]log—Echo copy of session tofile[GSM]18Learning more about Stata3Useful features that you might overlook[U]29Using the Internet to keep up to date[U]19Immediate commands[U]24Working with strings[U]25Working with dates and times[U]26Working with categorical data and factor variables[U]27Overview of Stata estimation commands[U]20Estimation and postestimation commands[R]estimates—Save and manipulate estimation resultsBasic statistics[R]anova—Analysis of variance and covariance[R]ci—Confidence intervals for means,proportions,and variances[R]correlate—Correlations of variables[D]egen—Extensions to generate[R]regress—Linear regression[R]predict—Obtain predictions,residuals,etc.,after estimation[R]regress postestimation—Postestimation tools for regress[R]test—Test linear hypotheses after estimation[R]summarize—Summary statistics[R]table intro—Introduction to tables of frequencies,summaries,and command results [R]tabulate oneway—One-way table of frequencies[R]tabulate twoway—Two-way table of frequencies[R]ttest—t tests(mean-comparison tests)Matrices[U]14Matrix expressions[U]18.5Scalars and matrices[M]Mata Reference ManualProgramming[U]16Do-files[U]17Ado-files[U]18Programming Stata[R]ml—Maximum likelihood estimation[P]Stata Programming Reference Manual[M]Mata Reference ManualSystem values[R]set—Overview of system parameters[P]creturn—Return c-class values4[GSM]18Learning more about StataInternet resourcesThe Stata website(https://)is a good place to get more information about Stata.You willfind answers to FAQ s,ways to interact with other users,official Stata updates,and other useful information.You can also join Statalist,a forum devoted to discussion of Stata and statistics.You will alsofind information on Stata NetCourses R ,which are interactive courses offered over the Internet that vary in length from a few weeks to eight weeks.Stata also offers in-person and web-based training sessions,as well as webinars on Stata features.Visit https:///learn/ for more information.At the website is the Stata Bookstore,which contains books that we feel may be of interest to Stata users.Each book has a brief description written by a member of our technical staff explaining why we think this book may be of interest.We suggest that you take a quick look at the Stata website now.You can register your copy of Stata online and request a free subscription to the Stata News.Visit https:// for information on books,manuals,and journals published by Stata Press.The datasets used in examples in the Stata manuals are available from the Stata Press website.Also visit https:// to read about the Stata Journal,a quarterly publication containing articles about statistics,data analysis,teaching methods,and effective use of Stata’s language.Visit Stata’s official blog at https:// for news and advice related to the use of Stata.The articles appearing in the blog are individually signed and are written by the same people who develop,support,and sell Stata.The Stata Blog:Not Elsewhere Classified also has links to other blogs about Stata,written by Stata users around the world.Follow Stata on Facebook at https:///statacorp,Twitter at https:///stata, Instagram at https:///statacorp,and LinkedIn athttps:///company/statacorp.You may also follow Stata on Twitter athttps:///stata fr or https:///stata es.These are good ways to stay up-to-the-minute with the latest Stata information.Watch short example videos of using Stata on YouTube at https:///user/statacorp.See[GSM]19Updating and extending Stata—Internet functionality for details on accessing official Stata updates and free additions to Stata on the Stata website.[GSM]18Learning more about Stata5 Stata,Stata Press,and Mata are registered trademarks of StataCorp LLC.Stata andStata Press are registered trademarks with the World Intellectual Property Organization®of the United Nations.Other brand and product names are registered trademarks ortrademarks of their respective companies.Copyright c 1985–2023StataCorp LLC,College Station,TX,USA.All rights reserved.。
Stata 数据分析软件用户指南说明书
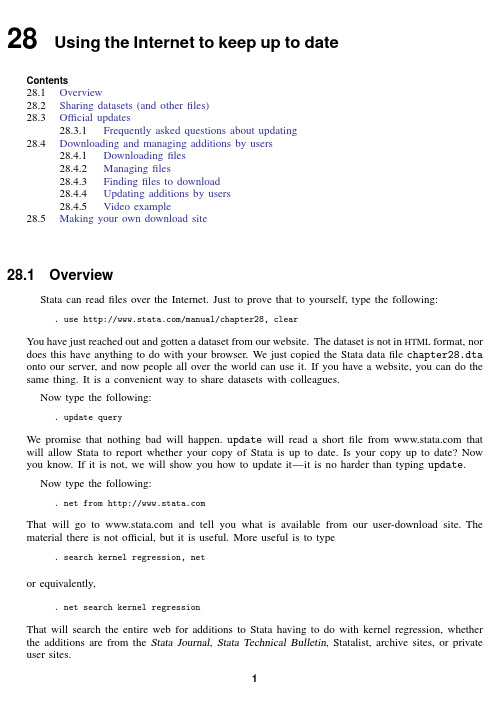
28Using the Internet to keep up to dateContents28.1Overview28.2Sharing datasets(and otherfiles)28.3Official updates28.3.1Frequently asked questions about updating28.4Downloading and managing additions by users28.4.1Downloadingfiles28.4.2Managingfiles28.4.3Findingfiles to download28.4.4Updating additions by users28.4.5Video example28.5Making your own download site28.1OverviewStata can readfiles over the Internet.Just to prove that to yourself,type the following: .use /manual/chapter28,clearYou have just reached out and gotten a dataset from our website.The dataset is not in HTML format,nor does this have anything to do with your browser.We just copied the Stata datafile chapter28.dta onto our server,and now people all over the world can use it.If you have a website,you can do the same thing.It is a convenient way to share datasets with colleagues.Now type the following:.update queryWe promise that nothing bad will happen.update will read a shortfile from that will allow Stata to report whether your copy of Stata is up to date.Is your copy up to date?Now you know.If it is not,we will show you how to update it—it is no harder than typing update.Now type the following:.net from That will go to and tell you what is available from our user-download site.The material there is not official,but it is useful.More useful is to type.search kernel regression,netor equivalently,.net search kernel regressionThat will search the entire web for additions to Stata having to do with kernel regression,whether the additions are from the Stata Journal,Stata Technical Bulletin,Statalist,archive sites,or private user sites.12[U]28Using the Internet to keep up to dateTo summarize:Stata can readfiles over the Internet:1.You can share datasets,do-files,etc.,with colleagues all over the world.This requires no specialexpertise,but you do need to have a website.2.You can update Stata;it is free and easy.3.You canfind and add new features to Stata;it is also free and easy.Finally,you can create a site to distribute new features for Stata.28.2Sharing datasets(and otherfiles)There is just nothing to it:you copy thefile as-is(in binary)onto the server and then let your colleagues know thefile is there.This works for.dtafiles,.dofiles,.adofiles,and,in fact,all files.On the receiving end,you can use thefile(if it is a.dta dataset)or you can copy it: .use /manual/chapter28,clear.copy /manual/chapter28.dta mycopy.dtaStata includes a copy-file command and it works over the Internet just as use does;see[D]copy.28.3Official updatesAlthough we follow no formal schedule for the release of updates,we typically provide updates to Stata approximately once a month.You do not have to update that often,although we recommend that you do.There are two ways to check whether your copy of Stata is up to date: select or typeHelp>Check for Updates.update queryAfter that if an update is available,you shouldclick on or typeInstall available updates.update allAfter you have updated your Stata,tofind out what has changedselect or typeHelp>What’s New?.help whatsnew28.3.1Frequently asked questions about updating1.Could something go wrong and make my Stata become unusable?No.The updates are copied to a temporary place on your computer,Stata examines themto make sure they are complete before copying them to the official place.Thus either theupdates are installed or they are not.2.I do not have access to the Internet from within Stata.Is there a way to update Stata manually?Yes.Open your web browser to /support/updates/and follow theinstructions on that page.[U]28Using the Internet to keep up to date3 28.4Downloading and managing additions by usersTry the following:selectHelp>SJ and User-written Programsor type.net from and click on one of the links.28.4.1DownloadingfilesWe are not the only ones developing additions to Stata.Stata is supported by a large and highly competent user community.An important part of this is the Stata Journal(SJ)and the Stata Technical Bulletin(STB).The Stata Journal is a refereed,quarterly journal containing articles of interest to Stata users.For more details and subscription information,visit the Stata Journal website at .The Stata Journal is a printed and electronic journal with corresponding software.If you want the journal,you must subscribe,but the software is available for free;see the instructions below.The predecessor to the Stata Journal was the Stata Technical Bulletin(STB).The STB was alsoa printed and electronic journal with corresponding software.Individual STB issues are available forfree at /bookstore/individual-stata-technical-bulletin-issues/.The STB software is available for free;see the instructions below.Installing software from the Stata Journal1.From within Stata,select Help>SJ and User-written Programs.2.Click on Stata Journal.3.Click on sj2-2.4.Click on st00011.5.Click on click here to install.or from /software cd sj2-2 describe st00011 install st00011The above could be shortened to.net from /software/sj2-2.net describe st0001_1.net install st0001_1You could also type.net sj2-2.net describe st0001_1.net install st0001_14[U]28Using the Internet to keep up to dateInstalling software from the STB1.From within Stata,select Help>SJ and User-written Programs.2.Click on STB.3.Click on stb58.4.Click on sg843.5.Click on click here to install.or from cd stb cd stb58 describe sg843 install sg843The above could be shortened to.net from /stb/stb58.net describe sg84_3.net install sg84_328.4.2ManagingfilesYou now have the concord command,because we just downloaded and installed it.Convince yourself of this by typing.help concordand you might try it out,too.Let’s now list the additions you have installed—that is probably just concord—and then get rid of concord.In command mode,you can type.ado dir[1]package sg84_3from /stb/stb58STB-58sg84_3.Concordance correlation coefficient:minor corrections If you had more additions installed,they would be listed.Now knowing that you have sg843installed, you can obtain a more thorough description by typing[U]28Using the Internet to keep up to date5 .ado describe sg84_3[1]package sg84_3from /stb/stb58TITLESTB-58sg84_3.Concordance correlation coefficient:minor corrections DESCRIPTION/AUTHOR(S)STB insert by Thomas J.Steichen,RJRTNicholas J.Cox,University of Durham,UKSupport:****************,*****************.ukAfter installation,see help concordINSTALLATION FILESc/concord.adoc/concord.sthlpINSTALLED ON5Oct2002You can erase sg843by typing.ado uninstall sg84_3package sg84_3from /stb/stb58STB-58sg84_3.Concordance correlation coefficient:minor corrections (package uninstalled)You can do all of this from the point-and-click interface,too.Pull down Help and select SJ and User-written Programs and then click on List.From there,you can click on sg843to see the detailed description of the package and from there you can click on click here to uninstall if you want to erase it.For more information on the ado command and the corresponding menu,see[R]net.28.4.3Findingfiles to downloadThere are two ways tofind usefulfiles to download.One is simply to thumb through sites.That is inefficient but entertaining.If you want to do that,1.Select Help>SJ and User-written Programs.2.Click on Other Locations.3.Click on links.What you are doing is starting at our download site and then working out from there.We maintaina list of other sites and those sites will have more links.You can do this from command mode,too:.net from .net cd linksThe efficient way tofindfiles is to search;that is,use Stata’s search command: .search concordance correlationEquivalently,you could select Help>Search....Either way,you will learn about sg843and you can even click to install it.6[U]28Using the Internet to keep up to date28.4.4Updating additions by usersAfter you have installed some user-written features,you should periodically check whether any updates or bugfixes are available for those commands.You can do this with the adoupdate command.Simply type adoupdate to see if any updates are available,and if they are,type adoupdate,update to obtain the updates.See[R]adoupdate for more details.28.4.5Video exampleHow to download and install user-written commands in Stata28.5Making your own download siteThere are two reasons you may wish to create your own download site:1.You have datasets and the like,you want to share them with colleagues,and you want to makeit easier for colleagues to download thefiles.2.You have written Stata programs,etc.,that you wish to share with the Stata user community.Before you create your own download site,you may wish to submit a command you have written to the Statistical Software Components(SSC)archive.The SSC archive contains the largest repository of user-written Stata software on the web.Stata has a command(see[R]ssc)that makes it easy to find and install packages from the SSC.For information about submitting a command you have written to the SSC,see /bocode/s/sscsubmit.html.If you do wish to create your own download site,making one is easy;the full instructions are found in[R]net.At the beginning of this chapter,we pretended that you had a dataset you wanted to share with colleagues.We said you just had to copy the dataset onto your server and then let your colleagues know the dataset is there.Let’s now pretend that you had two datasets,ds1.dta and ds2.dta,and you wanted your colleagues to be able to learn about and fetch the datasets by using the net command or by pulling down Help and selecting SJ and User-written Programs.First,you would copy the datasets to your home page just as before.Then you would create three morefiles,one to describe your site named stata.toc and two more to describe each“package”you want to provide:begin stata.toc v3d My name and affiliation(or whatever other title I choose)d Datasets for the PAR studyp ds1The base datasetp ds2The detail datasetend stata.toc[U]28Using the Internet to keep up to date7begin ds1.pkg v3d ds1.The base datasetd My name or whatever else I wanted to putd This dataset contains the baseline values for...d Distribution-Date:26sep2011p ds1.dtaend ds1.pkgbegin ds2.pkg v3d ds1.The detail datasetd My name or whatever else I wanted to putd This dataset contains the follow-up information...d Distribution-Date:26sep2011p ds2.dtaend ds2.pkgThe Distribution-Date line in the description should be changed whenever you change your package.This line is used by adoupdate to determine if a user who has installed your package needs to update it.Here is what users would see when they went to your site:.net from /hande/~aparker/hande/~aparkerMy name and whatever else I wanted to putDatasets for the PAR studyPACKAGES you could-net describe-:ds1The base datasetds2The detail dataset.net describe ds1package ds1from /hande/~aparkerTITLEds1.The base datasetDESCRIPTION/AUTHOR(S)My name and whatever else I wanted to putThis dataset contains the baseline values for...Distribution-Date:26sep2011ANCILLARY FILES(type net get ds1)ds1.dta.net get ds1checking ds1consistency and verifying not already installed...copying into current directory...copying ds1.dtaancillary files successfully copied..See[R]net.。
《2024年Stata在Meta分析中的应用》范文

《Stata在Meta分析中的应用》篇一一、引言Meta分析是一种综合多个独立研究结果的方法,旨在通过合并不同研究的数据来得出更全面、更准确的结论。
随着统计软件的发展,Stata作为一种强大的统计分析工具,在Meta分析中得到了广泛应用。
本文将介绍Stata在Meta分析中的应用,并探讨其优势和局限性。
二、Stata在Meta分析中的应用1. 数据准备与处理在Meta分析中,首先需要收集各个独立研究的数据,包括研究设计、样本大小、实验组和对照组的效应指标等。
Stata提供了强大的数据处理功能,可以方便地导入和处理这些数据。
同时,Stata还支持多种数据格式的转换和整合,使得数据准备和处理的流程更加高效。
2. 模型选择与构建Meta分析中常用的模型包括固定效应模型和随机效应模型。
Stata提供了多种Meta分析模型的选择和构建功能,用户可以根据研究特点和数据特征选择合适的模型。
此外,Stata还支持模型的扩展和调整,如考虑异质性、发表偏倚等。
3. 效应指标计算与合并效应指标是Meta分析的核心内容之一,常用的效应指标包括相对危险度、比值比、加权平均数等。
Stata提供了多种效应指标的计算和合并方法,包括固定效应法、随机效应法等。
用户可以根据需要选择合适的效应指标和合并方法,得出更准确的综合结果。
4. 结果解释与可视化Stata具有强大的结果解释和可视化功能,可以将Meta分析的结果以图表的形式展示出来,使得结果更加直观易懂。
同时,Stata还支持多种结果解释的方法,如森林图、漏斗图等,帮助用户更好地理解Meta分析的结果。
三、Stata在Meta分析中的优势1. 强大的统计分析功能:Stata具有丰富的统计分析功能,可以满足Meta分析的各种需求。
2. 操作简便:Stata的界面友好,操作简便,用户可以快速上手。
3. 数据处理能力强:Stata支持多种数据格式的转换和整合,使得数据准备和处理的流程更加高效。
《2024年Stata在Meta分析中的应用》范文

《Stata在Meta分析中的应用》篇一摘要:本文将介绍Stata软件在Meta分析中的应用。
首先概述Meta 分析的概念、背景及其重要性。
然后介绍Stata软件的基本功能和其在Meta分析中的应用优势。
通过一个实际案例,详细阐述Stata在Meta分析中的具体操作步骤和结果解读。
最后,总结Stata在Meta分析中的价值和未来发展趋势。
一、引言Meta分析是一种通过综合多个独立研究结果来得出综合结论的统计方法。
在医学、社会科学等领域,Meta分析被广泛应用于证据综合和系统评价。
Stata作为一种功能强大的统计分析软件,在Meta分析中发挥着重要作用。
本文将详细介绍Stata在Meta分析中的应用。
二、Meta分析概述2.1 定义与背景Meta分析是一种通过收集、整理和综合多个独立研究结果来得出综合结论的统计方法。
它可以帮助研究者对多个研究结果进行定量综合,提高证据的可靠性和说服力。
2.2 Meta分析的重要性Meta分析在医学、社会科学等领域具有重要价值。
通过对多个研究的综合分析,可以更准确地评估干预措施的效果,为政策制定和临床实践提供有力依据。
三、Stata软件基本功能及其在Meta分析中的应用优势3.1 Stata软件基本功能Stata是一款功能强大的统计分析软件,具有数据管理、描述性统计、推断性统计等功能。
它支持多种统计方法,包括回归分析、方差分析、生存分析等。
3.2 Stata在Meta分析中的应用优势Stata在Meta分析中具有以下优势:(1)操作简便:Stata具有友好的用户界面和丰富的命令系统,使得操作简便快捷。
(2)功能全面:Stata支持多种Meta分析方法,包括固定效应模型、随机效应模型等。
(3)结果直观:Stata可以生成直观的图表和统计结果,便于结果解读。
四、Stata在Meta分析中的具体应用案例4.1 案例背景以一项关于药物治疗糖尿病效果的Meta分析为例,介绍Stata在Meta分析中的具体应用。
手把手教你用Stata进行Meta分析Meta简明教程(7)

手把手教你用Stata进行Meta分析Meta简明教程(7)Meta简明教程目录1. 认识一下meta方法! | Meta简明教程(1)2. 一文初步学会Meta文献检索| Meta简明教程(2)3. 如何搞定“文献筛选” | Meta简明教程(3)4.Meta分析文献质量评价 | Meta简明教程(4)5.Meta分析数据提取| Meta简明教程(5)6.一文学会revman软件| Meta简明教程(6)Meta简明教程(7)上一期介绍了Revman 软件对二分类数据、连续型数据、诊断性试验数据、生存-时间数据进行meta分析,本期将利用Stata对以上数据进行meta分析。
大家可以到本公众号下载Stata软件(重磅推荐:分类最全的统计分析相关软件,了解一下?请关注、收藏以备用)Stata12.0 界面一、二分类数据分析数据形式例:研究阿司匹林(aspirin)预防心肌梗死(MI)7个临床随机对照试验,观察死亡率,数据提取如下:操作步骤1.构建数据1)启动Stata 12.0 软件后,可以直接点击工具栏中DataEditor (edit)按钮。
也可在在菜单栏中点击Data→Data Editor→ DataEditor (edit),出现以下界面。
2)点击变量名位置,依次输入研究名称(research),阿司匹林组死亡数(a),阿司匹林组存活数(b),安慰剂组死亡数(c),安慰剂组存活数(d)3)录入数据:在变量值区域输入数据2. 数据分析1)导入meta模块:在Command窗口中进行编程,首先需要在Stata中安装meta 模块:在Command窗口输入“ssc install metan”,选中点回车。
结果窗口中出现下面的结果,说明已经安装了meta模块。
2)输入meta分析代码:在Command窗口输入“Command窗口输入“metan a b c d, or fixed”,点回车,完成结果分析。
漏斗图的使用技巧
漏斗图的使用技巧之前,有很多人咨询我DataFocus的漏斗图怎么使用。
今天正好有时间,那就来给大家讲一讲DataFocus中漏斗图的使用技巧。
首先,要想很好地运用漏斗图,必须先要了解清楚漏斗图是什么以及这个图形的特点。
这边先科普一下,漏斗图又叫倒三角图,其是由堆积条形图演变而来的,就是由占位数把条形图挤成一个倒三角的形状儿形成。
该图形便于进行业务流程比较规范,周期长、环节多等分析时,能直观地发现和说明问题在哪里。
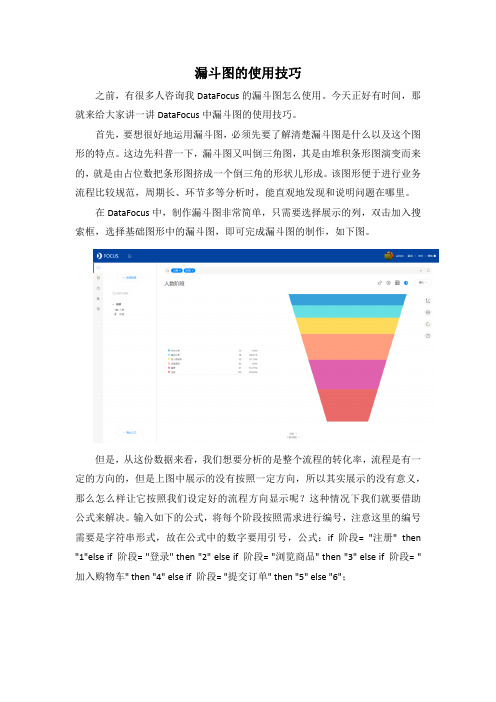
在DataFocus中,制作漏斗图非常简单,只需要选择展示的列,双击加入搜索框,选择基础图形中的漏斗图,即可完成漏斗图的制作,如下图。
但是,从这份数据来看,我们想要分析的是整个流程的转化率,流程是有一定的方向的,但是上图中展示的没有按照一定方向,所以其实展示的没有意义,那么怎么样让它按照我们设定好的流程方向显示呢?这种情况下我们就要借助公式来解决。
输入如下的公式,将每个阶段按照需求进行编号,注意这里的编号需要是字符串形式,故在公式中的数字要用引号,公式:if 阶段= "注册" then "1"else if 阶段= "登录" then "2" else if 阶段= "浏览商品" then "3" else if 阶段= "加入购物车" then "4" else if 阶段= "提交订单" then "5" else "6";然后我们将公式加入到搜索款内,按照公式进行升序排列,再将图形转换成以漏斗图显示,即可看到我们要的漏斗图效果,按照一定的流程显示每个流程之间的转换率。
至此,一个真正有意义的漏斗图才算完成,但是也很简单不是吗?现在,大家对于漏斗图的应用有没有更了解一些呢?。
《2024年Stata在Meta分析中的应用》范文

《Stata在Meta分析中的应用》篇一一、引言Meta分析是一种综合多个独立研究结果的方法,旨在通过合并不同研究的数据来得出更可靠的结论。
随着科研领域的发展,Meta分析在医学、社会科学、心理学等多个领域得到了广泛应用。
Stata作为一种强大的统计分析软件,在Meta分析中扮演着重要角色。
本文将探讨Stata在Meta分析中的应用及其相关注意事项。
二、Stata在Meta分析中的应用1. 数据导入与处理在Meta分析中,首先需要将多个独立研究的数据导入到Stata软件中。
Stata提供了便捷的数据导入功能,支持多种数据格式的导入,如Excel、SPSS等。
导入数据后,需要对数据进行清洗、整理和格式化,以便进行后续的Meta分析。
2. 描述性统计分析在Meta分析前,可以进行描述性统计分析,了解各个研究的特征、样本量、效应大小等。
Stata提供了丰富的描述性统计分析功能,如计算均值、标准差、相关性等,帮助研究者了解数据的分布情况和研究特征。
3. 随机效应模型与固定效应模型Meta分析中常用的模型包括随机效应模型和固定效应模型。
Stata提供了相应的命令和函数,可以方便地实现这两种模型的估计和比较。
随机效应模型考虑了研究间的异质性,而固定效应模型则假设所有研究具有相同的效应。
根据研究目的和数据特点,选择合适的模型进行Meta分析。
4. 亚组分析与meta回归Stata还支持亚组分析和meta回归等更复杂的Meta分析方法。
亚组分析可以根据某些特征将研究分为不同的亚组,分别进行Meta分析。
而meta回归则可以在Meta分析的基础上,进一步探讨影响因素对效应大小的影响。
这些方法可以帮助研究者更深入地了解研究间的异质性来源和影响因素。
5. 结果的可视化展示Stata提供了丰富的图形功能,可以将Meta分析的结果以图表的形式展示出来。
如森林图可以直观地展示各个研究的效应大小及其可信区间,以及合并效应大小的可信区间。
Stata 简介及基本操作ppt课件

精选版课件ppt
9
Stata 的主界面
精选版课件ppt
10
三、Stata 操作
1.将数据导入Stata 打开Stata 软件后,点击Data → Data Editor 图标,即可打
开一个类似Excel的空白表格。然后,用Excel 打开文件“实 验数据.xls”,复制文件中的相关数据,并粘贴到Data Editor 中。
单、功能强大的特点。由于使用Stata 的用户很多,对于 最新的计量方法,常常可以下载由用户写的Stata 命令程 序,十分方便。而官方的Stata版本也经常更新,以适应计 量经济学迅猛发展的需要。
Stata 11 已于2009 年出版,但由于在中国普遍使用 的仍是Stata 10,我们主要介绍Stata 10。
理功能,精致的作图,强大的统计与计量分析功能,简练 标准的程序与矩阵运算功能、丰富的网络资源,在统计学、 经济学、金融学、心理学、计算机科学、物理、化学等多 个学科领域得到广泛使用。 请浏览:/whystata/field.htm史
也可以通过逻辑关系来定义数据集的子集。如果要 列出所有满足条件“year ≥1995”的变量gov与gdp 的数 据,则可以使用以下命令: . list year gov gdp if year>=1995
其中,“>=”表示“大于等于”。其他表示关系的逻辑 符号为“= =”(等于),“>”(大于),“<”(小于), “<=”(小于等于),“~=”或“!=”(不等于)。查看 具体数据的一个直接方法是,点击Data Editor 图标。
精选版课件ppt
19
5.画图 Stata 具有很强的画图功能。如果想看变量q 的直方图
(假定组宽为1000),可输入以下命令:
stata使用技巧

stata使用技巧Stata是一种常用的统计分析软件,广泛应用于各个领域的数据分析和研究工作中。
以下是一些Stata使用的技巧和建议,可以帮助用户更高效地进行数据处理和分析。
1.熟悉常用命令和函数:Stata提供了丰富的命令和函数,用户应该熟悉常用的命令和函数,并掌握它们的用法,以便能够快速完成数据分析任务。
2.使用数据清洗命令:在进行数据分析之前,通常需要对原始数据进行清洗,去除异常值、缺失值等。
Stata提供了许多数据清洗命令,如drop、keep、replace等,用户可以灵活运用。
3.灵活使用数据合并命令:Stata提供了丰富的数据合并命令,如merge、append等,可以将多个数据源合并成一个数据集。
用户应熟悉这些命令的用法,并根据实际情况选择合适的命令。
4.利用循环命令加快处理速度:对于大规模的数据分析任务,使用循环命令可以大大提高处理效率。
Stata提供了多种循环命令,如forvalues、foreach等,用户可以根据具体情况选择合适的循环命令进行数据处理。
5.运用图表功能进行数据可视化:Stata提供了强大的图表功能,用户可以通过绘制图表来进行数据可视化分析。
通过图表分析可以更直观地理解数据的分布和相关关系,并发现潜在的规律和趋势。
6.使用Stata的矩阵运算功能:Stata具有强大的矩阵运算功能,可以方便地进行矩阵计算。
用户可以利用矩阵运算完成复杂的统计模型分析和计算,提高分析的准确性和效率。
7.使用自定义命令简化操作:Stata允许用户自定义命令,通过将常用的操作封装成命令,可以简化数据分析过程。
用户可以编写自己的命令,并将其保存在.do文件中,以便将来重复使用。
8.充分利用Stata的帮助文档:Stata提供了详细的帮助文档,用户可以通过查阅帮助文档来解决遇到的问题和了解更多的功能。
阅读帮助文档可以帮助用户熟悉Stata各种命令的用法,并学习到一些高级的技巧和技巧。
总之,熟练掌握Stata的使用技巧和功能,可以提高数据处理和分析工作的效率和准确性。
Meta分析中漏斗图的绘制

Meta分析中漏斗图的绘制一、本文概述在科学研究领域,Meta分析是一种非常重要的统计方法,用于综合多个独立研究结果,从而得出更为准确和可靠的结论。
然而,在进行Meta分析时,我们需要注意潜在的偏倚和异质性,以确保结果的准确性和可靠性。
其中,漏斗图是一种常用的可视化工具,用于检测和识别Meta分析中的偏倚和异质性。
本文将详细介绍漏斗图的绘制方法,包括其基本概念、绘制步骤以及注意事项,帮助读者更好地理解和应用漏斗图,提高Meta分析的质量和准确性。
二、漏斗图的基本原理漏斗图(Funnel Plot)在Meta分析中扮演着重要的角色,它的基本原理主要基于假设检验和偏倚识别。
漏斗图是一种直观的图形表示,主要用于展示各个独立研究的结果效应量及其精度(通常以样本量大小或效应量估计的精度,如标准误的倒数来表示)。
这种图形呈现出的形状类似于一个漏斗,因此得名。
在漏斗图中,每个点代表一个独立的研究,横坐标通常表示研究结果的效应量(例如,两组之间的平均差异或某种干预措施的效果大小),而纵坐标则表示该效应的精度。
由于大样本研究通常具有更高的精度(即更小的标准误),因此它们的结果更可能接近于真实效应,这些点就会更靠近漏斗图的顶部。
相反,小样本研究的结果则可能更加分散,因此它们位于漏斗图的底部,形成一个相对宽阔的基部。
理想情况下,如果所有的研究都没有偏倚,并且具有足够的样本量,那么这些点应该围绕一个共同的效应量值形成一个对称的漏斗形状。
然而,在实际应用中,由于各种潜在的偏倚和异质性,漏斗图可能会呈现出不对称或非线性的形状。
这些偏离理想形状的模式可以帮助研究者识别潜在的偏倚来源,例如发表偏倚(只发表阳性结果的研究)或选择性报告偏倚(只报告对自己有利的结果)。
因此,漏斗图不仅是Meta分析中的一个重要工具,用于直观地展示研究结果,还是一种用于识别和评估偏倚的重要方法。
通过仔细审查和解释漏斗图的形状和模式,研究者可以更加深入地理解各个研究之间的关系和潜在偏倚,从而提高Meta分析的准确性和可靠性。
Stata软件教程:初步了解Stata软件的使用方法说明书
. generate wtsq = weight^2
[ GSW ] 1 Introducing Stata—sample session 19
Now that we have all the variables we need, we can run a linear regression. We will use the
Syntax note: To make the graphs for the combined subgroups, we ended up using a by() option, not a by prefix. If we had used a by prefix, separate graphs would have been generated instead of the combined graph created by the by() option.
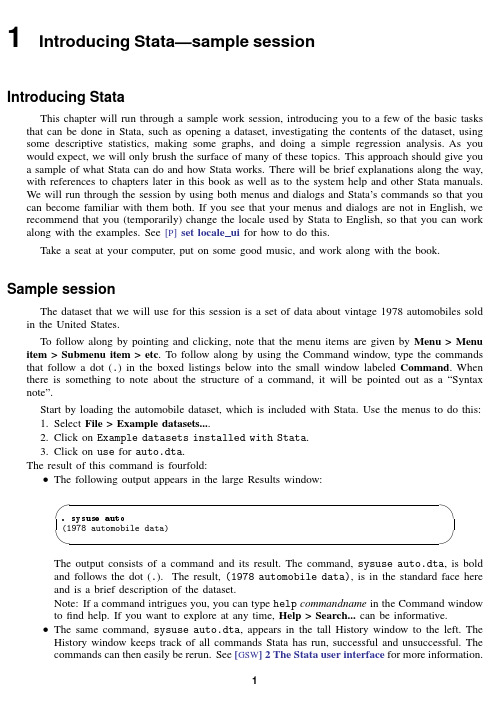
Start by loading the automobile dataset, which is included with Stata. Use the menus to do this: 1. Select File > Example datasets.... 2. Click on Example datasets installed with Stata. 3. Click on use for auto.dta. The result of this command is fourfold: • The following output appears in the large Results window:
menus and see that the command is also simple. To use the menus, select Statistics > Linear models
图说meta十四:漏斗图暨Stata软件使用方法简介

图说meta十四:漏斗图暨Stata软件使用方法简介系统评价/Meta分析指全面收集所有相关研究并逐个进行严格评价和分析,再用定量或定性合成的方法对资料进行处理得出综合结论的研究方法。
在meta分析受到关注的同时也出现了不同的声音,本系列推送将介绍meta分析的实施步骤,希望帮助了解meta分析,规范meta分析的撰写。
本期推送将介绍如何用stata软件实现森林图的制作,希望各位老师批评指正。
>>>> 漏斗图最常见的识别发表性偏倚的方法就是漏斗图法, 以样本含量(或效应量标准误的倒数)与效应量(或效应量对数)作的散点图, 效应量可以为RR ,OR ,RD 和死亡比或者其对数值等。
漏斗图所基于的假设是效应量估计值的精度随着样本量的增加而增加, 其宽度随精度的增加而逐渐变窄, 最后趋近于点状, 其形状类似一个对称倒置的漏斗,故称为漏斗图。
即样本量小的研究, 数量多、精度低, 分布在漏斗图的底部呈左右对称排列;样本量大的研究, 精度高, 分布在漏斗图的顶部, 且向中间集中。
利用漏斗图可以直接观察原始研究的效应量估计值是否与其样本含量有关。
但当存在发表性偏倚时, 则表现为漏斗图出现不对称, 则呈偏态分布。
绘制漏斗图, 需要纳入较多的研究个数,原则上需纳入9篇研究以上才能进行。
>>>> 漏斗图的制作流程Step1:Stata软件下载与安装Stata软件为收费软件,目前该软件已更新至14.0,我们公众号本着“自由分享,人人平等,共求真理”的宗旨,为大家免费准备了Stata12.0版本,公众号后台回复stata即可获取(积极宣传公众号,推动20人关注公众号者微信添加1606093959可获取stata14.0版本)Step2:Meta面板加载•创建profile.do文件1.点击菜单栏Help→Search→Search all(Keywords: meta_dialog)2.选择加载包进行安装(click here to install)3.输入命令help meta_dialog4.复制代码5.点击菜单栏Window→Do.file Editor→ New Do.file Editor,粘贴代码6.点击保存,选择存储至stata安装位置,命名为profile•重新打开 Users次级菜单出现Meta-AnalysisStep3:整理纳入文献格式需要注意的是,Stata软件中数据分析格式与RevMan数据格式是不一致的,RevMan中二分类变量表示为研究事件发生数与样本量,而Stata软件中为试验组发生事件数与试验组未发生事件数,在整理数据时需表示为如下格式,示例:Step4:数据输入1.点击菜单栏Data Editor(Edit)2.输入数据或复制粘贴数据。
使用stata进行meta分析的详细具体过程和方法
使用stata进行meta分析的详细具体过程和方法meta, stata最近使用stata 8进行meta分析,之前已经使用refman 5进行了初步处理,但是refman 的漏斗图只能粗略看是否对称,无法定量,据说stata可以进行发表性偏倚定量评价,所以自己摸索stata中的meta分析方法,在DXY中学习了不少战友的帖子(zhangdog战友),都感觉不是很系统,有的还有些问题。
结合自己的体会,写个详细的总结,希望对像我一样的初学者有所帮助,尤其对很多非统计学专业的人员有用,当然我也不是统计学专业的,问题再所难免,共同学习,还望战友指点。
1.stata的安装,建议下载8.0的版本,有战友反映9.0和10.0的版本好象有些问题,反正基本功能有了,meta分析的菜单在8.0以后版本都有了,所以不必追求最新的。
我是在上下载的。
baidu,google上都能找到。
2.原始数据的录入,这是应用stata进行分析的基础。
(1)命令窗口输入:Input no study event1 total1 event0 total0: |( g; m- [2 `; b3 `(分别表示纳入研究序号,名称,暴露组或处理组例数,总例数,对照组例数,对照组总例数,因为我是用refman中导出数据,这后4项可以直接输出),作用是产生变量。
然后可以逐行输入数据,以end命令结束,我建议初学者跳到下面的输入更简单。
* s# ?- w; d: B6 v$ L- j(2)点Data——Data editor(或ctrl+7快捷键),可以直接录入数据,可以直接复制,粘贴数据。
输完后点击preserve保存退出Data editor 窗口。
6 z7 T5 M3 H5 ~%第一步(1)也可以省略,进入第二步后,先输入数据,然后双击自动产生的变量var1,var2....进行变量名称的修改,个人感觉这样快捷。
1 Deng SL 2004 31 114 8 100* Z4 U' m+ R$ i4 i8 V( P&2 Ding HF 2006 19 25 5 8^3 h2 l* t6 W9 ?" \$ _" o- S3 Fang ZL 2002 35 36 20 35+ C& ?* ^) Q3 y! l R, F' F14 Ito K 2006 36 40 31 40@5 ?* E& [!5 Kao JH 2003 81 127 4 35m/ y4 w2 R. y: h4 ~5 a6 Yuen MF 2004 60 66 101 1351 V3 [0 M& Y4 ~. B. x- a. B% l*完毕在命令窗输入list命令查看数据。
图说meta十三:漏斗图简介

图说meta十三:漏斗图简介发表性偏倚简介发表性偏倚是指有统计学意义的研究结果比无统计学意义的研究更容易投稿和被发表,对于无统计学意义的研究, 研究者可能认为意义不大,不发表或推迟发表;作为杂志编辑则更有可能对这类论文退稿。
发表偏倚的产生有三个来源, 分别为作者、研究的赞助者和杂志社的编辑。
因为存在发表性偏倚, 即使具备周密的检索策略和手段(如与研究者个人联系),也不可能完全地纳入所有相关研究。
发表性偏倚可使Meta 分析过分夸大治疗效应量或危险因素的关联强度, 导致临床个体治疗与卫生决策的失误。
常见的发表偏倚表现在: 1 ) 阳性结果的研究比阴性结果的研究容易发表, 而且有较多机会发表在高影响因子的期刊上, 因而会有更高的引用率; 2 )有基金资助的研究常常有较高的发表率, 受国家级基金资助的研究的发表率最高, 且其研究结果常常是阳性的。
但是由药厂资助的研究的发表率远低于政府或其他团体资助的研究, 这可能与药厂不鼓励发表阴性结果有关; 3) 随机对照试验的阳性结果常常低于非随机对照试验; 且盲法的随机对照试验的阳性结果通常低于非盲法的的随机对照试验; 4) 大样本的研究较易发表, 不管其研究结果在统计学上是否有差异, 而小样本的研究结果往往在该研究还未有大样本结果时才有较高的可能性被发表; 5) 观察性研究和实验研究较临床研究更容易出现发表偏倚。
漏斗图简介最常见的识别发表性偏倚的方法就是漏斗图法, 以样本含量(或效应量标准误的倒数)与效应量(或效应量对数)作的散点图, 效应量可以为RR ,OR ,RD 和死亡比或者其对数值等。
漏斗图所基于的假设是效应量估计值的精度随着样本量的增加而增加, 其宽度随精度的增加而逐渐变窄, 最后趋近于点状, 其形状类似一个对称倒置的漏斗,故称为漏斗图。
即样本量小的研究, 数量多、精度低, 分布在漏斗图的底部呈左右对称排列;样本量大的研究, 精度高, 分布在漏斗图的顶部, 且向中间集中。
Meta分析中漏斗图的绘制
LDL-C
Strokes Stroke Stroke
y
( A /C)
y
% mg /dL Reduction % ( A /C) ( A /C) ( A /C)
ASCOT-LLA
2003 Atorvastatin 3.3
5168 /5137 63
81
133
- 32
89 /121
…
…
ALLHAT-LLT
2007年 4 月 第 7 卷第 2 期
循证医学 The Journal of Evidence-Based Medicine
·循证医学中的医学统计学问题·
Apr. 2007 Vol.7 No.2
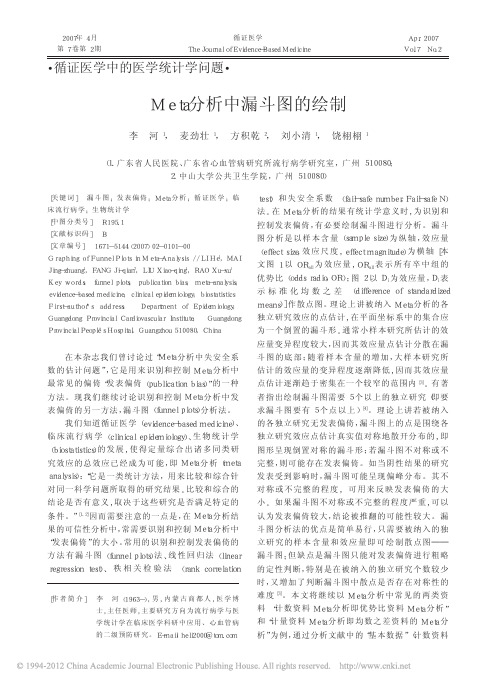
Me ta 分析中漏斗图的绘制
李 河 1, 麦劲壮 1, 方积乾 2, 刘小清 1, 饶栩栩 1
( 1. 广东省人民医院、广东省心血管病研究所流行病学研究室, 广州 510080; 2. 中山大学公共卫生学院, 广州 510080)
2002 Pravastatin 4.8
5170 /5185 66
50
146
PROSPER
2002 Pravastatin 3.2
2891 /2913 75
48
147
- 16
209 /231 53 /56
…
- 27!
135 /131 22 /14
…
HPS
2002 Simvastatin 5.0 10269 /10267 65
2001 Atorvastatin 0.3
1538 /1548 65
65
124
- 52
12 /24
3 /2
0 /3
L-CAD
- 1、下载文档前请自行甄别文档内容的完整性,平台不提供额外的编辑、内容补充、找答案等附加服务。
- 2、"仅部分预览"的文档,不可在线预览部分如存在完整性等问题,可反馈申请退款(可完整预览的文档不适用该条件!)。
- 3、如文档侵犯您的权益,请联系客服反馈,我们会尽快为您处理(人工客服工作时间:9:00-18:30)。
图说meta十四:漏斗图暨Stata软件使用方法简介
图说meta十四:漏斗图暨Stata软件使用方法简介2017-05-06 科研创新服务平台弗雷赛斯弗雷赛斯微信号freescience 功能介绍Freescience由浙江大学医学院几个硕博士发起创建,旨在最广泛分享有价值的科研技能和知识;FreeScience的宗旨:“科学自由分享、人人平等,共求真理”。
>>>> 漏斗图最常见的识别发表性偏倚的方法就是漏斗图法, 以样本含量(或效应量标准误的倒数)与效应量(或效应量对数)作的散点图, 效应量可以为
RR ,OR ,RD 和死亡比或者其对数值等。
漏斗图所基于的假设是效应量估计值的精度随着样本量的增加而增加, 其宽度随精度的增加而逐渐变窄, 最后趋近于点状, 其形状类似一个对称倒置的漏斗,故称为漏斗图。
即样本量小的研究, 数量多、精度低, 分布在漏斗图的底部呈左右对称排列;样本量大的研究, 精度高, 分布在漏斗图的顶部, 且向中间集中。
利用漏斗图可以直接观察原始研究的效应量估计值是否与其样
本含量有关。
但当存在发表性偏倚时, 则表现为漏斗图出现不对称, 则呈偏态分布。
绘制漏斗图, 需要纳入较多的研究个数,原则上需纳入9篇研究以上才能进行。
>>>> 漏斗图的制作流程Step1:Stata软件下载与安装Stata软件为收费软件,目前该软件已更新至14.0,我们公众号本着“自由分享,
人人平等,共求真理”的宗旨,为大家免费准备了Stata12.0版本,公众号后台回复stata即可获取(积极宣传公众号,推动20人关注公众号者微信添加1606093959可获取
stata14.0版本)
Step2:Meta面板加载
创建profile.do文件1.点击菜单栏Help→Search→Search all (Keywords: meta_dialog) 2.选择加载包进行安装(click here to install)3.输入命令help meta_dialog 4.复制代码5.点击菜单栏Window→Do.file Editor→ New Do.file Editor,粘贴代码6.点击保存,选择存储至stata安装位置,命名为profile重新打开Users次级菜单出现Meta-AnalysisStep3:整理纳入文献格式需要注意的是,Stata软件中数据分析格式与RevMan数据格式是不一致的,RevMan中二分类变量表示为研究事件发生数与样本量,而Stata软件中为试验组发生事件数与试验组未发生事件数,在整理数据时需表示为如下格式,示例:
Step4:数据输入1.点击菜单栏Data Editor(Edit)2.输入数据或复制粘贴数据。
.复制粘贴整理格式后的数据,选择将第一行变为变量名称
Step5:制作漏斗图1.进行二分类变量meta分析,计算效应量OR(具体方法参见:)2.计算logOR:gen log_ES=log( _ES);重命名log_ES:rename log_ES logOR(图形显示需要,
_selogES系统默认,可不进行重命名)3.依次点击
Users→Meta-Analysis→Funnel Graph,vertical(metafunnel)进入漏斗图制作面板。
4. 选择logOR,selog_ES进行数据分析。
5.漏斗图制作完毕(重命名保证横纵坐标变量说明一致)
6. 点击保存,选择*.png进行图形的保存与查看,或选择保存为矢量图。
附1:Egger 回归法或Begg秩相关法1.进行二分类变量meta分析,计算效应量OR(具体方法参见:)2.计算logOR:gen log_ES=log( _ES);重命名log_ES:rename
log_ES logOR(图形显示需要,_selogES系统默认,可不进行重命名)3.输入命令:metabias6 logOR
_selogES ,graph ( begg)或metabias6 logOR
_selogES ,graph ( egger).(若菜单栏Publishion Bias (metabias)支持,也可选择metabias 命令,P>0.05,无明显发表性偏倚)4.漏斗图制作完毕(以Begg's为例)本文选自公众号:科研创新服务平台科研创新服务平台旨在帮助研究生快速提高科研能力,搭建交流平台,帮助本科生学好医学知识,提供接触科研的机会。
Freescience精彩内容回顾(点击即达)论文信号通路图,模式图,全搞定| 谷歌不能上?有这个,一劳永逸| 临床统计傻瓜式解决| 外文写作润色神器| 不花钱下载SCI全文黄金攻略!| PubMed有
哪些被你忽视的细节?| SCI文献管理之黄金攻略!| 卸载Visio—超赞的在线流程图制作工具| 论文查重!关键是不要钱!| 神器!分分钟找到高质量的目标文献!|生存分析从理解到作图妥妥的| 科研作图神器GraphPad |菜鸟写国自然-4:立项依据的写作| 零基础不一样的实验protocol:开篇引言| 引物设计?现成的随便拿啦!| 实验技能:小鼠尾静脉注射| Western百败百战老学姐的心酸笔记|零基础Meta系列(十):一般套路(纯干货)一盏茶一篇meta(四)—SNP Meta,数据库寻找靶基因|网状meta分析(NMA)-第一卷基本技能| 段子手韩春雨老师| 不得不扒的女神--胡海岚|扒一扒你所不知道的浙大PMCB团队(内嵌新春大红包!)实例讲解:基因数据库的利用(二)| 生物医学大数据解读和分析——构建生物网络实践科研路,不孤单!^ ^Freescience 医学科研联盟全国火热招募ing50家高校及医院的小伙伴已经加入啦,点这里长按二维码向我转账受苹果公司新规定影响,微信iOS 版的赞赏功能被关闭,可通过二维码转账支持公众号。
阅读微信扫一扫关注该公众号。