欢聚时代(YY)分析报告
欢聚时代2013年第一季度财务报告
欢聚时代2013年第一季度财务报告欢聚时代第一季度净营收为人民币 3.150亿元(约合5070万美元),同比增长130.5%。
欢聚时代第一季净利同比增17.26倍欢聚时代发布了截至3月31日的2013财年第一季度财报。
财报显示,欢聚时代第一季度净营收为人民币3.150亿元(约合5070万美元),比去年同期的人民币1.367亿元增长130.5%;净利润为人民币6390万元(约合1030万美元),比去年同期的人民币350万元增长17.26倍。
第一季度主要业绩:--欢聚时代第一季度净营收为人民币3.150亿元(约合5070万美元),比去年同期的人民币1.367亿元增长130.5%。
欢聚时代第一季度净营收的增长,主要由于来自互联网增值服务的营收增长143.8%。
--欢聚时代第一季度净利润为人民币6390万元(约合1030万美元),比去年同期的人民币350万元增长17.26倍。
--不按照美国通用会计准则(不计入股权奖励支出),欢聚时代第一季度净利润为人民币8210万元(约合1320万美元),比去年同期的人民币3110万元增长164.2%。
欢聚时代首席执行官李学凌表示,“在公司2012年强劲增长的基础上,我们第一季度的业绩再次强劲增长,公司总营收和不按照美国通用会计准则的净营收同比分别增长130%和164%以上。
在公司季节性最弱的一个季度,包括用户增长和用户支出在内的主要运营数据均强劲增长,表明欢聚时代品牌对5.27亿注册用户而言已越来越具有吸引力。
特别是欢聚时代平台的付费用户数量已超过100万,同比增长35.3%以上,反映出我们平台提供的负担的起的互动娱乐消费正在增长。
通过向新垂直服务扩张,并推出跨PC和移动设备的新产品,我们将继续多元化和加强欢聚时代平台的内容,来应对中国不断增长的娱乐和即时社交需求。
”欢聚时代首席财务官何震宇表示,“我们强劲的增长,继续证明我们大规模、即时和粘性平台内在的网络效应。
这些强劲的结果,加上我们增强经营杠杆和控制成本的能力,让第一季度的利润率得到了大幅提升。
2014在线教育行业分析报告(凤凰网)
2014在线教育行业分析报告凤凰在线教育实验室第一部分中国在线教育行业现状及特点一、在线教育发展历程在线教育是互联网技术与传统教育的结合,相比传统教育,在线教育的优势主要在于:1、突破时空限制,知识获取方式更为灵活;2、碎片化学习,尤其随着移动互联网的发展,移动设备更具便携性;3、内容多样化,除了K12教育(指幼儿园到高中的基础教育)、高等教育外,还包括各类学前教育、职业教育、兴趣教育等细分领域。
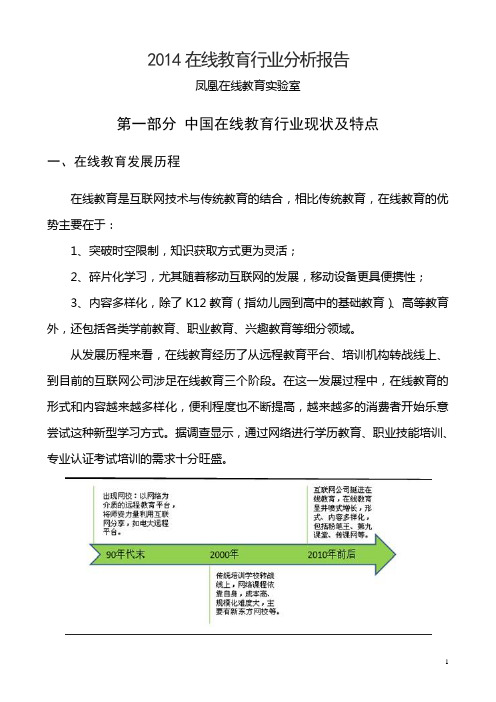
从发展历程来看,在线教育经历了从远程教育平台、培训机构转战线上、到目前的互联网公司涉足在线教育三个阶段。
在这一发展过程中,在线教育的形式和内容越来越多样化,便利程度也不断提高,越来越多的消费者开始乐意尝试这种新型学习方式。
据调查显示,通过网络进行学历教育、职业技能培训、专业认证考试培训的需求十分旺盛。
二、国内在线教育现状1、国内在线教育发展空间(1)我国学龄人口数量庞大目前,我国是世界上人口最多的国家,2013年人口数量达到13.5亿,其中,5-24岁的学龄人口约3.3亿,占人口总量的24.5%。
(2)我国教育消费比重大据《2013年中国家庭教育消费白皮书》调查显示,“教育消费”作为家庭消费的重头,占到中国社会中坚阶层家庭收入的1/5,并且该比例预期还将持续增长,预计2011-2013年中国家庭教育支出有望达到8000亿至1万亿元。
(3)职教培训需求旺盛据《2012年行业白皮书》数据显示,通过网络进行学历教育、职业技能培训、专业认证考试培训的需求十分旺盛。
31.7%的职场白领表示因工作瓶颈参加职业教育培训,期望通过再学习充实自己,且每年在职业培训方面投入8000元以上的占比25%,投入5000至8000元的达31%。
在计划通过网络视频学习人群的构成中,在职人员占比超过一半,达到57%。
因此,我们认为,职教培训成为教育需求增长的又一大动力。
(4)我国网民规模巨大2013年,我国网民规模为6.04亿,互联网普及率已达45%,而在40岁以下接受教育的主体人群中,这一普及率更高。
欢聚时代YY 2018 Q4季报

YY Reports Fourth Quarter and Full Year 2018 Unaudited Financial ResultsMarch 4, 2019GUANGZHOU, China, March 05, 2019 (GLOBE NEWSWIRE) -- YY Inc. (NASDAQ: YY) (“YY” or the “Company”), a leading live streaming social media platform in China, today announced its unaudited financial results for the fourth quarter and full year of 2018.Fourth Quarter 2018 HighlightsNet revenues increased by 28.0% to RMB4,640.9 million (US$675.0 million) from RMB3,626.5 million in the corresponding period of 2017.Net income attributable to YY was RMB684.0 million (US$99.5 million), compared to RMB740.4 million in thecorresponding period of 2017.Non-GAAP net income attributable to YY1 was RMB836.2 million (US$121.6 million), compared to RMB932.1 million in the corresponding period of 2017.Full Year 2018 HighlightsNet revenues increased by 36.0% to RMB15,763.6 million (US$2,292.7 million) from RMB11,594.8 million in 2017.Net income attributable to YY was RMB1,642.0 million (US$238.8 million), compared to RMB2,493.2 million in 2017.Non-GAAP net income attributable to YY increased by 18.4% to RMB3,196.4 million (US$464.9 million) from RMB2,699.4 million in 2017.Mr. David Xueling Li, Chairman and acting Chief Executive Officer of YY, stated, “We are delighted to conclude 2018 with solid fourth quarter performances from both YY Live and Huya. Our strong growth momentum was driven by the healthy expansion of our loyal and highly-engaged live streaming community, evidenced by the number of mobile live streaming monthly active users increasing by 18.1% to 90.4 million and the number of live streaming paying users increasing by 36.6% to 8.9 million year-over-year in the fourth quarter of 2018. In addition, our initial foray into the global market has generated encouraging results in 2018. HAGO, a casual-game-oriented social networking platform that is currently available in 33 countries and regions worldwide with 20.9 million monthly active users in the fourth quarter of 2018. In addition, Hago consistently topped the charts as the most popular application on both App Store and Google Play in its primary markets, namely Indonesia and Vietnam in the fourth quarter of 2018. As we continue to enrich and diversify our live streaming content, we have also consistently upgraded our AI algorithms to more accurately match content to our users. Building on the successful growth of our domestic ecosystem, we will continue to execute our globalization strategy as a potential driver for our long-term growth going forward.”Mr. Bing Jin, Chief Financial Officer of YY, further commented, “We once again recorded solid financial results in the fourth quarter of 2018. Our total net revenues increased by 28.0% year-over-year to RMB4,640.9 million, exceeding the high end of our previous guidance range. The increase in net revenues was driven by the strong growth of our live streaming revenues, which increased by 30.4% year-over-year to RMB4,391.4 million. We continue to invest in content enrichment, technology enhancements, and global expansion. We are confident that our strategies to upgrade our content offerings and AI technologies, buttressed by our increasing global footprint, will continue to yield sustainable growth and increase our market share in the global live streaming industry.”Fourth Quarter 2018 Financial ResultsNET REVENUESNet revenues increased by28.0%to RMB4,640.9million(US$675.0million)in the fourth quarter of2018from RMB3,626.5million in the corresponding period of 2017, primarily driven by an increase in live streaming revenues. Live streaming revenues increased by 30.4% to RMB4,391.4 million (US$638.7 million) in the fourth quarter of 2018 from RMB3,368.5 million in the corresponding period of 2017.Other revenues2 decreased by 3.3% to RMB249.5 million (US$36.3 million) in the fourth quarter of 2018 from RMB258.0 million in the corresponding period of 2017.COST OF REVENUES AND GROSS PROFITCost of revenues increased by 37.2% to RMB3,013.1 million (US$438.2 million) in the fourth quarter of 2018 from RMB2,196.6 million in the corresponding period of 2017, primarily attributable to an increase in revenue-sharing fees and content costs to RMB2,556.5 million (US$371.8 million) in the fourth quarter of 2018 from RMB1,828.0 million in the corresponding period of 2017. The increase in revenue-sharing fees and content costs paid to performers, guilds and content providers was in line with the increase in live streaming revenues for both YY Live and Huya segments, respectively. In addition, bandwidth costs increased to RMB246.5 million (US$35.9 million) in the fourth quarter of 2018 from RMB181.2 million in the corresponding period of 2017, primarily reflecting continued user base expansion and live streaming quality improvements.Gross profit increased by 13.8% to RMB1,627.9 million (US$236.8 million) in the fourth quarter of 2018 from RMB1,429.9 million in the corresponding period of 2017. Gross margin was 35.1% in the fourth quarter of 2018, compared to 39.4% in the corresponding period of 2017, primarily due to the increase in revenue-sharing fees and content costs. The decrease in gross margin was attributable to the impact caused by the relatively low gross margin of the Huya segment as its contribution to net revenues increased significantly year-over-year.OPERATING INCOMEOperating expenses were RMB931.2 million (US$135.4 million) in the fourth quarter of 2018, compared to RMB652.9 million in the correspondingperiod of 2017, primarily due to our increased efforts in sales and marketing activities in both China and the overseas market.Operating income was RMB718.6 million (US$104.5 million) in the fourth quarter of 2018, compared to RMB821.5 million in the corresponding period of 2017. Operating margin was 15.5% in the fourth quarter of 2018, compared to 22.7% in the corresponding period of 2017, primarily due to the increase in sales and marketing expenses and the decrease in gross margin.Non-GAAP operating income3 was RMB888.5 million (US$129.2 million) in the fourth quarter of 2018, compared to RMB1,034.1 million in the corresponding period of 2017. Non-GAAP operating margin4 was 19.1% in the fourth quarter of 2018, compared to 28.5% in the corresponding period of 2017.NET INCOMENet income attributable to YY Inc. was RMB684.0 million (US$99.5 million) in the fourth quarter of 2018, compared to RMB740.4 million in the corresponding period of 2017. Net margin was 14.7% in the fourth quarter of 2018, compared to 20.4% in the corresponding period of 2017.Non-GAAP net income attributable to YY Inc. was RMB836.2 million (US$121.6 million) in the fourth quarter of 2018, compared to RMB932.1 million in the corresponding period of 2017. Non-GAAP net margin5 was 18.0% in the fourth quarter of 2018, compared to 25.7% in the corresponding period of 2017.NET INCOME PER ADSDiluted net income per ADS6 was RMB10.54(US$1.53) in the fourth quarter of 2018, compared to RMB11.53 in the corresponding period of 2017. Non-GAAP diluted net income per ADS7 was RMB12.86(US$1.87) in the fourth quarter of 2018, compared to RMB14.51 in the corresponding period of 2017.BALANCE SHEET AND CASH FLOWSAs of December 31, 2018, the Company had cash and cash equivalents of RMB6,004.2 million (US$873.3 million) and short-term deposits of RMB7,327.0 million (US$1,065.7 million). For the fourth quarter of 2018, net cash from operating activities was RMB2,123.8 million (US$308.9 million).SHARES OUTSTANDINGAs of December 31, 2018, the Company had a total of 1,269.9 million common shares, or the equivalent of 63.5 million ADSs, outstanding.Full Year 2018 Financial ResultsFor the full year of 2018, net revenues increased by 36.0% to RMB15,763.6 million (US$2,292.7 million) from RMB11,594.8 million in 2017, primarily driven by a 39.4% year-over-year increase in live streaming revenues.Net income attributable to YY Inc. for the full year of 2018 was RMB1,642.0 million (US$238.8 million), compared to RMB2,493.2 million in 2017. Net margin for the full year of 2018 was 10.4%, compared to 21.5% in 2017.Non-GAAP net income attributable to YY Inc. for the full year of 2018 increased by 18.4% to RMB3,196.4 (US$464.9 million) from RMB2,699.4 million in 2017. Non-GAAP net margin for the full year of 2018 was 20.3%, compared to 23.3% in 2017.Diluted net income per ADS was RMB25.38(US$3.69) in 2018, compared to RMB41.33 in the corresponding period of 2017. Non-GAAP diluted net income per ADS for the full year of 2018 increased by 9.7% to RMB49.05(US$7.13) from RMB44.72 in 2017.For the full year of 2018, net cash from operating activities was RMB4,464.8 million (US$649.4 million).Business OutlookFor the first quarter of 2019, the Company expects net revenues to be between RMB4.01 billion and RMB4.16 billion, representing a year-over-year growth of 23.4% to 28.0%, without giving effect to the acquisition of Bigo Inc. This forecast reflects the Company’s current and preliminary views on the market and operational conditions, which are subject to change.Recent DevelopmentsThe Company recently entered into a strategic partnership agreement with Shanghai Chuangsi Enterprise development Co.,Ltd.(“Shanghai Chuangsi”). Shanghai Chuangsi owns 9377 Games, one of the leading game platforms in China. Under the agreement, the Company will obtain 30% equity interest of Shanghai Chuangsi by injecting its online game business into Shanghai Chuangsi. As a result, the financial results of YY’s online games business, which contributed to less than 3% of YY segment’s total revenues in the fourth quarter of 2018, will no longer be consolidated upon the completion of the transaction. Currently, the transaction is expected to be completed in the first quarter of 2019.Conference Call InformationThe Company will hold a conference call on Monday, March 4, 2019, at 9:00 pm Eastern Time (or Tuesday, March 5, 2019, at 10:00 am Beijing Time) to discuss the financial results. Participants may access the call by dialing the following numbers:United States:+1-845-675-0438International:+65-6713-5440China Domestic:400-1200-654Hong Kong:+852-3018-6776Conference ID:#8476342The replay will be accessible through March 12, 2019, by dialing thefollowing numbers:United States:+1-646-254-3697International:+61-2-9003-4211Conference ID: #8476342A live and archived webcast of the conference call will also be available at the Company's investor relations website at /.Exchange RateThis press release contains translations of certain Renminbi amounts into U.S. dollars at specified rates solely for the convenience of readers. Unless otherwise noted, all translations from Renminbi to U.S. dollars, in this press release, were made at a rate of RMB6.8755 to US$1.00, the noon buying rate in effect on December 31, 2018 in the City of New York for cable transfers in Renminbi per U.S. dollar as certified for customs purposes by the Federal Reserve Bank of New York.About YY Inc.YY Inc. (“YY” or the “Company”) is a leading live streaming social media platform in China. The Company’s highly engaged users contribute to a vibrant social community by creating, sharing, and enjoying a vast range of entertainment content and activities. YY enables users to interact with each other in real time through online live media and offers users a uniquely engaging and immersive entertainment experience. YY Inc. was listed on the NASDAQ in November 2012.Safe Harbor StatementThis announcement contains forward-looking statements. These statements are made under the “safe harbor” provisions of the U.S. Private Securities Litigation Reform Act of 1995. These forward-looking statements can be identified by terminology such as “will,” “expects,” “anticipates,” “future,”“intends,” “plans,” “believes,” “estimates” and similar statements. Among other things, the business outlook and quotations from management in this announcement, as well as YY's strategic and operational plans, contain forward-looking statements. YY may also make written or oral forward-looking statements in its periodic reports to the U.S. Securities and Exchange Commission (“SEC”), in its annual report to shareholders, in press releases and other written materials and in oral statements made by its officers, directors or employees to fourth parties. Statements that are not historical facts, including statements about YY’s beliefs and expectations, are forward-looking statements. Forward-looking statements involve inherent risks and uncertainties. A number of factors could cause actual results to differ materially from those contained in any forward-looking statement, including but not limited to the following: YY’s goals and strategies; YY's future business development, results of operations and financial condition; the expected growth of the online communication social platform market in China; the expectation regarding the rate at which to gain active users, especially paying users; YY’s ability to monetize the user base; fluctuations in general economic and business conditions in China and assumptions underlying or related to any of the foregoing. Further information regarding these and other risks is included in YY’s filings with the SEC. All information provided in this press release and in the attachments is as of the date of this press release, and YY does not undertake any obligation to update any forward-looking statement, except as required under applicable law.Use of Non-GAAP Financial MeasuresThe unaudited condensed consolidated financial information is prepared in conformity with accounting principles generally accepted in the United States of America (“U.S. GAAP”). YY uses non-GAAP operating income, non-GAAP operating margin, non-GAAP net income attributable to YY Inc., non-GAAP net margin, and basic and diluted non-GAAP net income per ADS, which are non-GAAP financial measures. Non-GAAP operating income is operating income excluding share-based compensation expenses, impairment of goodwill and investments, and gain on deconsolidation and disposal of subsidiary. Non-GAAP operating margin is non-GAAP operating income as a percentage of net revenues. Non-GAAP net income is net income excluding share-based compensation expenses, impairment of goodwill and investments, gain on deconsolidation and disposal of subsidiary, gain on deemed disposal and disposal of investments, gain on fair value change of investments and equity investees’ investments, fair value loss on derivative liabilities, and income tax effects of above non-GAAP reconciling items. Non-GAAP net income attributable to YY Inc. is net income attributable to YY Inc. excluding share-based compensation expenses, impairment of goodwill and investments, gain on deconsolidation and disposal of subsidiary, gain on deemed disposal and disposal of investments, gain on fair value change of investments and equity investees’ investments, fair value loss on derivative liabilities, deemed dividend to subsidiary’s Series A preferred shareholders and income tax effects of above non-GAAP reconciling items and adjustment for non-GAAP reconciling items for the income attributable to non-controlling interests. Non-GAAP net margin is non-GAAP net income attributable to YY Inc. as a percentage of net revenues. Basic and diluted non-GAAP net income per ADS is non-GAAP net income attributable to YY Inc. divided by weighted average number of ADS used in the calculation of basic and diluted net income per ADS. The Company believes that separate analysis and exclusion of the non-cash impact of above reconciling items adds clarity to the constituent parts of its performance. The Company reviews these non-GAAP financial measures together with GAAP financial measures to obtain a better understanding of its operating performance. It uses the non-GAAP financial measure for planning, forecasting and measuring results against the forecast. The Company believes that non-GAAP financial measure is useful supplemental information for investors and analysts to assess its operating performance without the non-cash effect of (i) share-based compensation expenses, which have been and will continue to be significant recurring expenses in its business, (ii) impairment of goodwill and investments, gain on deconsolidation and disposal of subsidiary, gain on deemed disposal and disposal of investments, gain on fair value change of investments and equity investees’ investments, fair value loss on derivative liabilities, and deemed dividend to subsidiary’s Series A preferred shareholders, which may not be recurring in its business, and (iii) income tax expenses and non-GAAP adjustments for net income (loss) attributable to non-controlling interest shareholders, which are affected by above non-GAAP reconciling items. However, the use of non-GAAP financial measures has material limitations as an analytical tool. One of the limitations of using non-GAAP financial measures is that they do not include all items that impact the Company’s net income for the period. In addition, because non-GAAP financial measures are not measured in the same manner by all companies, they may not be comparable to other similar titled measures used by other companies. In light of the foregoing limitations, you should not consider non-GAAP financial measure in isolation from or as an alternative to the financial measure prepared in accordance with U.S. GAAP.The presentation of these non-GAAP financial measures is not intended to be considered in isolation from, or as a substitute for, the financial information prepared and presented in accordance with U.S. GAAP. For more information on these non-GAAP financial measures, please see the table captioned “YY Inc. Reconciliations of GAAP and Non-GAAP Results” near the end of this release.Investor Relations ContactYY Inc.Matthew ZhaoTel: +86 (20) 8212-0000Email: IR@ICR, Inc.Jack WangTel: +1 (646) 915-1611Email: IR@____________________________1 Non-GAAP net income attributable to YY Inc. is a non-GAAP financial measure, which is defined as net income attributable to YY Inc. excluding share-based compensation expenses, impairment of goodwill and investment, gain on deconsolidation and disposal of subsidiary, gain on deemed disposal and disposal of investments (deemed disposal refers to dilution of equity interest in equity-method investments), gain on fair value change of investments and equity investees’ investments,fair value loss on derivative liabilities,deemed dividend to subsidiary’s Series A preferred shareholders, income tax effects on non-GAAP adjustment and non-GAAP adjustment for net (loss) income attributable to non-controlling interests shareholders. These adjustments amounted to RMB152.2 million (US22.1 million) and RMB191.7 million in the fourth quarter of 2018 and 2017, respectively. Please refer to the section titled “Reconciliation of GAAP and Non-GAAP Results” for details.2 Starting from the first quarter of 2018, the Company re-classified its revenues from online games, revenues from memberships, and other revenues (which mainly represent revenues from the Company’s online advertising revenues) to the category “other revenues” in order to better reflect the Company’s continued strategic shift towards its live streaming business.3 Non-GAAP operating income is a non-GAAP financial measure, which is defined as operating income excluding share-based compensation expenses, impairment of goodwill and investments and gain on deconsolidation and disposal of a subsidiary. Please refer to the section titled "Reconciliation of GAAP and Non-GAAP Results" for details.4 Non-GAAP operating margin is a non-GAAP financial measure, which is defined as non-GAAP operating income as a percentage of net revenues. Please refer to the section titled "Reconciliation of GAAP and Non-GAAP Results" for details.5 Non-GAAP net margin is non-GAAP net income attributable to YY Inc. as a percentage of net revenues.6 ADS is American Depositary Share. Each ADS represents twenty Class A common shares of the Company. Diluted net income per ADS is net income attributable to YY Inc. divided by weighted average number of diluted ADS.7 Non-GAAP diluted net income per ADS is a non-GAAP financial measure, which is defined as non-GAAP net income attributable to YY Inc. divided by weighted average number of ADS used in the calculation of diluted net income per ADS. Please refer to the section titled "Reconciliation of GAAP and Non-GAAP Results" for details.YY INC.UNAUDITED CONDENSEDCONSOLIDATED BALANCE SHEETS(All amounts in thousands, except share, ADS and per ADS data)December December December31,31,31,2017 20182018RMB RMB US$ AssetsCurrent assetsCash and cash equivalents2,617,4326,004,231873,279 Short-term deposits6,000,1047,326,9961,065,667 Restricted short-term deposits1,000,000--Short-term investments124,550979,053142,397 Accounts receivable, net153,944198,42828,860 Inventory315--Amounts due from related parties11,190193,55928,152 Financing receivables, net-768,343111,751 Prepayments and other current assets221,9391,019,019148,210Total current assets10,129,47416,489,6292,398,316Non-current assetsLong-term deposits-1,000,000145,444 Deferred tax assets113,01770,83410,302 Investments1,153,0194,591,524667,809 Property and equipment, net1,016,9981,296,319188,542 Land use rights, net1,832,7391,784,639259,565 Intangible assets, net37,48174,68510,862 Goodwill11,71611,7631,711Amounts due from related parties20,000--Financing receivables, net-224,79332,695 Other non-current assets144,275223,85932,559Total non-current assets4,329,2459,278,4161,349,489Total assets14,458,71925,768,0453,747,805Liabilities, mezzanine equity and shareholders’ equityCurrent liabilitiesConvertible bonds-6,863998 Accounts payable76,351114,58916,666 Deferred revenue758,044951,616138,407 Advances from customers80,406101,69014,790 Income taxes payable146,298235,56134,261 Accrued liabilities and other current liabilities1,465,9632,414,371351,156 Amounts due to related parties30,50228,3364,121 Short-term loans588,235--Total current liabilities3,145,7993,853,026560,399Non-current liabilitiesConvertible bonds6,536--Deferred revenue57,71891,71013,339 Deferred tax liabilities10,81027,5054,000Total non-current liabilities75,064119,21517,339Total liabilities3,220,8633,972,241577,738YY INC.UNAUDITED CONDENSED CONSOLIDATED BALANCE SHEETS (CONTINUED)(All amounts in thousands, except share, ADS and per ADS data)December December December31, 31, 31,201720182018RMB RMB US$ Mezzanine equity524,997418,67360,893Shareholders’ equityClass A common shares (US$0.00001 par value; 10,000,000,000 and 10,000,000,00057599 shares authorized, 945,245,908 and 981,740,848 shares issued and outstanding as ofDecember 31, 2017 and December 31, 2018, respectively)Class B common shares (US$0.00001 par value; 1,000,000,000 and 1,000,000,000 sharesauthorized, 317,982,976 and 288,182,976 shares issued and outstanding as of December23213 31, 2017 and December 31, 2018, respectively)Additional paid-in capital5,339,84411,168,8661,624,444 Statutory reserves62,718101,72514,795 Retained earnings(1)5,218,1106,913,4691,005,522 Accumulated other comprehensive (loss) income(1)(9,597)336,15248,891 Total YY Inc.’s shareholders’ equity10,611,15518,520,2922,693,664 Non-controlling interests101,7042,856,839415,510 Total shareholders’ equity10,712,85921,377,1313,109,174Total liabilities,mezzanine equity andshareholders’ equity14,458,71925,768,0453,747,805(1) On January 1, 2018, the Company adopted ASU 2016-1, “Classification and Measurement of Financial Instruments”. After the adoption of this new guidance, the Company measures long-term investments other than equity method investments at fair value through earnings. For those investments without readily determinable fair values, the Company elects to record these investments at cost, less impairment, and plus or minus subsequent adjustments for observable price changes. Changes in the basis of these investments are reported in current earnings. Following the adoption of this guidance, accumulated fair value gain, amounting to RMB87.8 million, was reclassified from accumulated other comprehensive loss to retained earnings as of January 1, 2018.YY INC.UNAUDITED CONDENSED CONSOLIDATED STATEMENTS OF OPERATIONS(All amounts in thousands, except share, ADS and per ADS data)Three Months Ended Twelve Months EndedDecember September December December December December December31,30, 31, 31,31,31,31,2017201820182018201720182018RMB RMB RMB US$RMB RMB US$Net revenues(1)Live streaming3,368,5203,894,5484,391,418638,70510,670,95414,877,6672,163,867 Others258,018205,924249,50636,289923,838885,890128,847Total net revenues3,626,5384,100,4724,640,924674,99411,594,79215,763,5572,292,714Cost of revenues(2)(2,196,649) (2,674,502) (3,013,063) (438,232) (7,026,402) (10,017,134) (1,456,932) Gross profit1,429,8891,425,9701,627,861236,7624,568,3905,746,423835,782Operating expenses(2)Research and development(282,827)(314,128)(332,513)(48,362)(781,886)(1,192,052)(173,377) expensesSales and marketing expenses(148,765)(343,839)(323,689)(47,079)(691,281)(1,149,316)(167,161) General and administrative expenses(218,766)(206,738)(274,979)(39,994)(544,641)(883,225)(128,460) Goodwill impairment(2,527)- --(2,527)--Total operating expenses(652,885)(864,705)(931,181)(135,435)(2,020,335)(3,224,593)(468,998)Gain on deconsolidation and disposal----37,989--of subsidiariesOther income44,53449,64021,9243,189113,187117,86017,142 Operating income821,538610,905718,604104,5162,699,2312,639,690383,926 Interest expense(3,744)(4,910)(139)(20)(32,122)(8,616)(1,253)Interest income and investment74,531141,110123,40117,948180,384485,55270,621 incomeForeign currency exchange losses,(351)(3,072)(1,338)(195)(2,176)(514)(75) netGain on deemed disposal and--2,17931745,86116,1782,353 disposal of investmentsGain on fair value change of-31,67026,1383,802-1,689,404245,714 investmentsFair value loss on derivative liabilities-----(2,285,223)(332,372) Other non-operating expenses-----(2,000)(291)Income before income tax891,974775,703868,845126,3682,891,1782,534,471368,623 expensesIncome tax expenses(151,523)(74,929)(107,114)(15,579)(415,811)(477,707)(69,480) Income before share of income(loss) in equity methodinvestments, net of income taxes740,451700,774761,731110,7892,475,3672,056,764299,143Share of income (loss) in equitymethod investments, net of incometaxes17,557(19,957) (19,281) (2,804) 33,02458,9338,571 Net Income758,008680,817742,450107,9852,508,3912,115,697307,714Less: Net income (loss) incomeattributable to the non-controllinginterest shareholders and themezzanine equity classifiednon-controlling interest shareholders17,60230,12753,8277,82915,156-20,151-2,931Cumulative dividend on subsidiary’sSeries A Preferred Shares--4,606670-4,606670 Deemed dividend to subsidiary’sSeries A preferred shareholders-----489,28471,163 Net income attributable to YY Inc.740,406650,690684,01799,4862,493,2351,641,958238,812YY INC.UNAUDITED CONDENSED CONSOLIDATED STATEMENTS OF OPERATIONS (CONTINUED)(All amounts in thousands, except share, ADS and per ADS data)Three Months Ended Twelve Months EndedDecember31,September30,December31,December31,December31,December31,December31,2017 201820182018201720182018RMB RMB RMB US$RMB RMB US$Net income per ADS—Basic11.6310.1210.64 1.5542.0325.64 3.73—Diluted11.5310.0110.54 1.5341.3325.38 3.69 Weighted average number of ADS used in calculating netincome per ADS—Basic63,686,05664,301,79664,307,56964,307,56959,323,00764,042,39064,042,390—Diluted64,224,00664,829,75764,609,00064,609,00060,831,88764,704,47064,704,470(1) On January 1, 2018, the Company adopted ASC 606, "Revenue from Contracts with Customers" using the modified retrospective method applied to those contracts which were not completed as of January 1, 2018. Based on the Company’s assessment, the adoption of ASC 606 did not have any material impact on the Company’s consolidated financial statements.(2) Share-based compensation was allocated in cost of revenues and operating expenses as follows:Three Months Ended Twelve Months EndedDecember31,2017September30,2018December31,2018December31,2018December31,2017December31,2018December31,2018RMB RMB RMB US$RMB RMB US$Cost of revenues36,54916,022 14,650 2,13142,759 74,339 10,812 Research and development expenses106,50152,752 50,042 7,278122,348 225,173 32,750 Sales and marketing expenses3,679290 1,158 1684,417 5,723 832 General and administrative expenses61,73192,340 88,909 12,93188,137 342,790 49,857。
浅谈多玩和YY

和粘性比腾讯显得更专注,从而培养出游戏玩家上多玩的习惯。
腾讯的游戏频道只在开展活动和游戏资料发布时会有较多的QQ游戏用户登录,更多的时候是一种摆设。
相反,多玩是面向所有游戏并且有详细规划,对主流游戏的社区建设和管理更到位。
腾讯传统的社区交流主要QQ空间,在这方面已经被新浪微博等社交平台给蚕食了好一大部分,包括用户在线时间、分享热情、和各种应用的使用等。
随着近年来中国网民数量的高速增长,休闲游戏的用户也是爆发式的增长,玩家在寻求游戏的共同话语时,多玩成了首选,毕竟很少人会在QQ空间里谈论:今天你玩游戏了吗? 二:YY语音为主的即时综合社区交流: YY语音的社区交流主要分为:频道娱乐、语音教学、在线视频直播、普通用户自建频道交流等。
在这方面多玩的频道相当于QQ的群,但互动性比QQ群强很多,用户可以在YY频道里随意说话,唱歌以及聊天,这一点,QQ群还很难办到,尽管现在推出了语音群聊和视频群聊,但用户粘性不大。
在YY的老用户中,互相加YY好友和进行交流的习惯还是有的,一般在必要的时候才会进行点对点的交流,这点说实话是YY的频道语音交流特色下的必然产生的弱项。
未来如何,会不会有更多的用户使用YY时会像使用QQ一样在闲碎时间进行更多的点对点交流,这得看多玩在这方面对用户习惯的培养。
使用YY的用户,很多时候两个人聊着聊着就开语音了,因为用户已经习惯了语音交流,所以很可能会出现以下情况:A:“:…..”B:“……“A:”哎呀,我习惯了开麦,打字很好烦!有些想说的话,一时打不出来。
”B:”嗯,打字太烦了,我们开语音讲话吧!”A:“要不我们去XX频道吧,直接那里说。
”B:“好啊!”然后…而Q-talk没啥好说的,记得大二时本想用它来获得更多QQ游戏的特权和奖品,方便和班群里的同学交流,可是每次语音聊天都会有莫名的巨大的回音,后来我直接卸载了,用户界面相对于YY还是有差距的,直接一笔带过。
要是非让我举个例子来形容的话,就好像是移动大树下的飞信,吃老本,创新力度也不专注,腾讯一直利用Q-talk在加大力度对YY的蚕食,可惜QT一直不争气。
2013-2014年网吧娱乐平台行业研究报告

2013-2014年网吧娱乐平台行业研究报告顺荣科技2013年12月目录一、公司概况:网吧娱乐平台领域龙头 (5)1、基因:早期定位及商业模式选择决定互联网基因 (5)2、发展:平台企业基因逐步显性化,二轮变现周期初始阶段 (7)3、业务体系:入口高壁垒、出口多元化、变现方式高效 (9)二、平台型企业的定义与特征 (10)1、互联网平台的基本特征:基础需求+平台壁垒+流量导出能力 (10)2、欢聚时代:细分领域平台企业商业模式的范本 (12)(1)成长历程:始于魔兽世界游戏资讯,发迹于YY语音 (12)(2)业务模式:基于多玩游戏及YY语音两个平台入口 (13)①多玩游戏网 (14)②YY语音 (14)(3)财务表现及估值:市场对YY的平台属性潜在商业化能力给予了高溢价 (18)三、入口:以互动娱乐为核心的平台生态系统日臻完善 (23)1、基础入口:网吧流量的趋势不是消减,而是转型 (23)(1)用户规模:网吧流量规模趋于稳定,两类因素支撑网吧流量规模和质量 (23)①网吧仍是国内网民首次接触互联上服务的重要渠道 (24)②网吧用户的核心需求并不能通过家庭上网替代 (25)(2)模式演进:由数量扩张的外延式发展,转型为提升服务的内涵式发展 (25)①规模化、连锁化 (26)②品牌化、品质化 (27)(3)趋势判断:网吧将进入动态平衡期,规模稳定、经营效率提升 (28)①电商O2O的线下节点 (28)②线上线下相结合的网民社交娱乐平台 (28)2、入口壁垒:公司对网吧入口流量的掌控已近乎垄断 (29)(1)网吧产业链:软件平台和内容聚合平台是产业链整合的中心 (29)(2)娱乐平台:网维大师与迅闪/信佑联合占据了接近60%的市场份额 (31)(3)计费平台:万象网管与Pubwin联合占据了60%左右的市场份额 (33)(4)入口判断:市场份额迅速提升,全面强化入口优势 (35)(5)小结:公司未来有望覆盖80%的网吧终端,对应1亿以上网吧用户 (37)3、平台演进:For B+ForC,PC+无线,互动娱乐平台生态已现端倪 (38)(1)云海平台战略:更多的看点在于极大提升面向网吧用户端的体验和变现能力 (38)(2)移动端平台战略:从“连我无线”开始,公司已启动移动端平台战略 (39)(3)海外平台战略:着眼布局,收获尚待时日 (43)四、出口:二轮变现周期启动,多元出口定义市场空间 (44)1、网吧娱乐3.0:游戏为主的互动娱乐是最有效率的变现选择 (44)(1)流量特征:网吧用户的属性决定了变现方向 (44)(2)变现效率:游戏在互联网商业化进程中始终是高效的变现手段 (46)(2)多元出口:网吧娱乐3.0 时代意味着以互动娱乐为核心的变现出口极大丰富 (48)2、变现能力评估方法:业务细分+平台盈利能力转化公式 (50)(1)评估公式 (50)(2)业务细分:对稳定增长期、高速成长期、导入期业务及未来潜在变现模式分别分析 (51)3、稳定增长期产品分析:软件销售+星传媒+互联网增值 (52)(1)软件销售:收入预计进一步收缩,不是贡献增量收入、利润的主力 (52)①业务发展情况 (52)②业务判断 (53)③变现能力分析 (53)(2)星传媒:大型端游厂商竞争激烈,ARPU 提升将贡献业绩增量 (54)①业务发展情况 (54)②业务判断 (55)③变现能力分析 (57)(3)互联网增值:云海平台的部署将大大提升互联网增值业务的变现转化率 (57)①业务发展情况 (57)②业务判断 (58)③变现能力分析 (60)4、高速成长期产品分析:页游联运平台 (61)(1)顺网游戏:页游仍是高效的流量变现工具,公司的页游平台处于高速成长期 (61)5、导入期产品分析:无线分发平台+顺网娱乐在线+应有商城 (65)(1)无线分发平台:手游运营预计最先启动,潜在收入空间4亿以上 (65)①以硬带软的方式的方式切入无线业务是最高效的选择 (65)②无线业务潜在变现潜力巨大,有望迅速形成新的业绩增长点 (67)(2)顺网娱乐在线:切入游戏资讯领域,潜在收入空间5000 万以上 (67)①游戏资讯站是网游产业链的重要衍生业务,广告收入将成为主要商业模式 (67)②依托网吧接近50%的游戏玩家,网站流量有望迅速提升 (68)(3)应有商城:游戏道具交易领域布局自有业务,潜在变现空间2.5亿 (69)①以网吧为入口切入游戏道具交易领域,潜在巨大的变现空间 (69)②现金支付O2O满足网吧用户特定需求,用户指向明确 (69)③网络游戏交易市场规模巨大,应有商城有巨大的潜在变现能力 (70)6、未来:围绕互动娱乐平台生态系统,更多流量导出预期 (70)五、财务分析及盈利预测 (71)1、成长指标:稳定期、成长期业务可给予35%以上的收入增速预期 (71)2、毛利率指标:2013年低点后预计将有小幅提升 (72)3、期间费用指标:营业费用率、管理费用率预计基本稳定 (73)4、股权激励分析:行权条件体现成长能力信心 (74)5、盈利预测:2014年起业绩增速有望重回40%以上 (75)六、风险要素 (76)一、公司概况:网吧娱乐平台领域龙头1、基因:早期定位及商业模式选择决定互联网基因公司成立于2005 年7 月,2010 年8 月上市后成为首家在A 股上市的立足网吧的互联网娱乐平台公司。
YY语音体验报告
作者:李寒联系方式:********************这篇报告分为两部分,第一部分是我对YY语音产品的一点理解,第二部分是作为YY 语音忠实用户在使用过程中提出的一些改进及建议。
YY语音一直关注卓越的用户体验,以稳定、流畅、无延迟、高承载的语音质量得到用户的肯定。
目前以YY语音平台为基础,发展出YY游戏、YY教育、YY音乐、YY手机客户端、多玩游戏网、游戏运营平台等业务体系。
通过良好的语音交流工具将广大用户聚集在一起,实践线上集体活动。
YY语音立足于游戏公会和战队,致力于解放玩家的双手,使玩家们能更加流畅地进行游戏并获得有效、即时的语音交流,辅助公会和战队完成游戏活动的协调并帮助这些游戏组织形成更强的管理能力和凝聚力。
同时,公会和战队系统又加强了玩家的凝聚力,特有的公会系统文化大大增强了用户的忠实性。
但是,玩家也仅仅只是通过游戏和语音平台进行联系,一旦退出该公会或者选择其他游戏则与之前的好友基本失去联系。
YY作为语音交流平台,更是人与人互相沟通的工具,除了好友系统以外,另可以在产品中添加social share 功能,让玩家能在分享自己的游戏乐趣的同时加强玩家之间的社交联系,并让其之间产生带动性。
YY语音的用户群年轻化,年龄分布在15—29岁的学生或者从业者。
这部分用户长时间的积累必将成为YY的高级优质用户。
因为用户在依赖YY所带来的语音服务,和游戏资讯服务非常的全面及时。
降低了用户对游戏资讯,攻略,即时通讯的问题。
同时,这部分用户在同类产品尝试方面又表现较高的兴趣,因此YY语音产品在同类产品的横向比较中,应突出优势,在功能细节方面不断满足用户需求,超越用户预期,做同类语音产品的领跑者并锁定用户群。
根据我自身的使用体验,为YY语音产品功能提出以下一点建议和改进:现在有很多公会都将YY贡献度和积分作为公会会员奖励制度的基础,所以需要公会管理人员经常查看公会成员的贡献值及积分等信息,但是现在很多公会会员人数庞大,在如此大量的数据中查看部分会员的信息是一件非常麻烦的事情,而现在成员管理列表也没有提供按”积分”、”贡献值”、”入会时间”排序的功能,这就为管理人员的查找造成很大的难度。
欢聚时代公司分析报告

4、行业主要公司及竞争格局
9158聚乐网是个人家园、多人视讯、交友 即时通讯、网络卡拉OK等娱乐交友服务的 专业网站,是中国最大的视讯互动交友社 区及同类娱乐社区平台的运营商。
3、市场现状及发展趋势
游戏及网游市场概况
• 2012年,中国柚子市场实际销售收入 602.8亿元,同比增长率为35.1%;
• 2012年,中国网页游戏市场的实际销售收 入81.1亿元,同比增长率为46.4%;
• 2012年,中国网页游戏用户达到2.71亿人, 同比增长率为33.4%。
Байду номын сангаас
3、市场现状及发展趋势
创立时间:2005年
产品定位:9158为用户提供边玩乐边交友, 实现真正心与心沟通的互动交友社区。
目标用户:屌丝、三四线城市网民、城市 打工者、个体户小老板
传播途径:9158通过新浪官方微博发送一 些微博上被人转发次数较多的笑话或者哲 理,并发起一些转发微博就有好礼的小活 动以提升其官方微博的人气。
• 即时通讯将越来越倾向移动终端化。随着移动互联网的发展,人们的互联网活动 开始脱离PC,更多的在手机、平板电脑等移动终端上完成。
• 即时通讯将更加突显个性化。企业即时通讯软件需要能够针对企业自身业务特点 进行定制。对于个体用户,个性化要求也越来越多,未来可能出现用户希望有什 么样的功能服务然后反映给即时通讯企业,企业再根据客户的要求和需要定制的 功能的客户数量规模来决策定制怎样的功能。
百度高价入局直播,是否大有可为?——百度并购YY直播绩效研究
百度高价入局直播,是否大有可为?——百度并购 YY 直播绩效研究摘要随着直播的普及,越来越多的企业进入直播行业,加紧布局直播板块,在此背景下,百度花费将近 36 亿美元收购 YY 直播,角逐直播战场,想要实现生态大协同,这是百度近段时间规模最大的收购行为,本文通过并购动因、过程及结果和并购绩效进行分析该项并购行为是否值得?关键词:百度 YY 直播并购一.引言近年来,直播开始逐步走入我们的生活,2016年中国在线直播的用户规模为3.1亿,而至2020年中国在线直播的用户规模已达5.26亿,直播行业的快速发展也促使各大企业加紧布局直播业务,如微博收购一直播、腾讯收购虎牙等。
在2020年11月17日百度公司宣布,以现金全资收购欢聚集团国内直播业务(即“YY直播”),总交易金额约为36亿美元。
而本次大额收购有两点令人怀疑这场收购是否值得?其一根据百度 2020 年年报显示,当年总现金为 1,621.84 亿元,即百度选择用企业 14.43%的现金去并购 YY 直播,这对百度来说也是一笔不小的投资,那么如此大额的投资是否是一项明智之举呢?其二当时欢聚集团的市值在 77 亿美元左右,另外还持有虎牙股权和 1.5 亿美元的现金流,以 YY 直播为主的中国业务和 BIGO 为主的海外业务估值约为50 亿美金。
可当时 YY 直播的月活用户为 4130 万,海外用户的月活为 5070 万;第三季度的整体营收为 62.86 亿元,仅 BIGO 的营收就达到 33.95 亿元。
如果不考虑欢聚集团股价被低估的情形,那 YY 直播的估值不到 25 亿美元,这与总交易金额 36 亿美元相差将近10 个亿。
并购YY直播也是百度近年来规模最大的一次并购,那如此大规模的规模究竟是否是正确的决定呢?本文将从并购动因、并购过程及结果和并购效果三方面来进行分析。
二.并购背景(一)并购方——百度百度公司于2000年1月1日在中关村创立,李彦宏作为公司的创始人,其拥有的“超链分析”技术专利使中国成为了除美国、俄罗斯和韩国之外,全球仅有的4个拥有搜索引擎核心技术的国家之一。
欢聚时代营收大涨,证明该平台有较强的会员货币化能力
欢聚时代(YY)营收大涨,证明该平台有较强的会员货币化能力来源:虎嗅欢聚时代(Nasdaq:YY)上一季业绩令投资者相当欢快。
在刚发布的截至12月31日的2013财年第四季度及全年财报中,欢聚时代称,该公司第四季度净营收为人民币6.123亿元(约合1.011亿美元),上年同期为人民币2.668亿元、同比增长129.5%;净利润为人民币1.920亿元(约合3170万美元),上年同期净利润为人民币3320万元、同比增长477.9%。
分析起来,营收的增长主要得益于互联网增值服务营收增长,该板块业务同比增长了144.1%。
来自互联网增值服务的营收(包括来自于在线游戏、YY音乐及包括会员计划在内的其他来源的营收)为人民币5.689亿元(约合9400万美元),上年同期为人民币2.330亿元。
再进一步溯源,互联网增值服务营收的增长,来源于付费用户数量及每用户平均收入都在增长。
欢聚时代称,在第三季度《快乐男声》结束后,用户活动几乎并无下滑。
欢聚时代在线音乐和娱乐业务的付费用户人数比去年同期增长165.3%,至90.2万人;每用户平均收入比去年同期增长19.6%,至人民币373元。
YY是怎么实现这一点的呢?首先,CEO李学凌介绍,YY通过一系列参与性很高且多样化的团体娱乐事件和活动,不仅促进了用户参与度和支出的提高,而且还增强了公司平台的用户粘性。
其次,游戏表现突出。
YY以直播视频为基础来发展在线游戏。
欢聚时代第四季度在在线游戏总数为126款,去年同期仅为73款。
来自实况游戏转播的营收为人民币2060万元(约合340万美元),与去年同期的人民币70万元相比实现了大幅增长。
互联网增值服务发展势头的喜人,势必进一步加强YY管理层对YY平台上娱乐、游戏甚至教育服务的投入信心,进一步对现有用户流量进行商业化。
比如2月25日,欢聚时代推出在线教育平台。
雷军曾表示,未来2年内欢聚时代将在教育领域的产品研发和运营方面投资10多亿元人民币,包括推出iOS和安卓版教育应用——从另一方面,这也是在为YY找“移动”未来。
公司合并后数据分析报告(3篇)

第1篇一、引言随着市场竞争的加剧和行业整合的步伐加快,我国XX行业近年来出现了多起公司合并案例。
本报告旨在通过对XX公司合并后的数据分析,评估合并效果,分析合并后公司的运营状况、财务状况和市场表现,为公司的未来发展提供决策依据。
二、合并背景及概述1. 合并背景XX公司与YY公司均为我国XX行业的领军企业,近年来,随着市场需求的变化和行业竞争的加剧,两家公司都面临着发展瓶颈。
为了实现优势互补、资源整合,提高市场竞争力,XX公司与YY公司于2020年12月正式宣布合并。
2. 合并概述合并后,XX公司成为新的控股公司,YY公司成为其全资子公司。
合并后,新公司拥有更强大的研发实力、更广泛的市场覆盖和更丰富的产品线。
三、合并后数据分析1. 运营状况分析(1)生产效率合并后,新公司的生产效率得到了显著提升。
通过对生产流程的优化和资源配置的调整,生产效率提高了15%,产品合格率达到了98%。
(2)研发投入合并后,新公司在研发方面的投入增加了30%,研发团队规模扩大了50%,成功推出了多款具有市场竞争力的新产品。
(3)供应链管理合并后,新公司对供应链进行了全面整合,优化了供应链结构,降低了采购成本,提高了供应链的响应速度。
2. 财务状况分析(1)营业收入合并后,新公司的营业收入实现了快速增长,同比增长了25%。
主要原因是新产品的推出和市场份额的提升。
(2)净利润合并后,新公司的净利润同比增长了20%,主要得益于营业收入的增长和成本控制的有效实施。
(3)资产负债率合并后,新公司的资产负债率下降了5%,表明公司财务状况更加稳健。
3. 市场表现分析(1)市场份额合并后,新公司在XX行业中的市场份额提升了10%,成为市场领导者。
(2)品牌知名度合并后,新公司的品牌知名度得到了显著提升,消费者对品牌的认知度和忠诚度不断提高。
(3)产品竞争力合并后,新公司产品线更加丰富,产品竞争力得到了显著提升,市场份额进一步扩大。
四、合并效果评估1. 优势互补合并后,新公司实现了优势互补,充分发挥了双方在技术、市场、品牌等方面的优势,提高了整体竞争力。
欢聚时代的商业模式分析

欢聚时代的商业模式分析12级传播董晓迪欢聚时代公司成立于2005年,于2012年底在纳斯达克上市。
它是一家富集通讯业务运营商,致力于为用户提供富集通讯服务的社会化创新平台。
其核心业务包括YY语音、多玩游戏网与YY游戏运营。
最初,欢聚时代以游戏资讯类网站多玩游戏网起家,提供给玩家新闻、专区、论坛、游戏道具等。
后来拓展到游戏运营,开始做网页游戏,并代理运营多款国内外精品网游。
如果欢聚时代仅仅将公司定义为网游内容提供商,仅仅依靠以广告收入为主的商业模式,也许它现在还在与17173这类网站的争夺中艰难的存活,更不要说在2012年成功登陆纳斯达克。
2008年YY语音的出现改变了欢聚时代的商业模式:通过YY语音这样一个优秀的语音工具,牢牢把握住核心用户群,在网络外部性的影响下聚集大量用户,并借力YY音乐的发展将YY语音升级为集合了游戏语音工具、娱乐、社交、教育的平台,在平台上采取基础免费,增值收费的策略。
1.依靠互联网广告和游戏运营收入的内容提供商传统思维认为,企业应专注于发展一种经营或紧密相连的一系列经营,毕竟这种做法曾使很多行业获得成功。
欢聚时代的总裁李学凌的思路最初也是如此,即先把一种服务做好,然后再自然的延伸到其他平台。
在这一思路的引领下,欢聚时代最初做好的是多玩游戏资讯网和游戏运营网。
多玩游戏网是最早一批进入游戏垂直资讯行业的网站,伴随着《魔兽世界》的火爆,多玩推出第一个网游专区《魔兽世界》,并在3个月后流量突破百万。
多玩提供的专业游戏资讯起初吸引到深度游戏发烧友,这类“意见领袖”帮助多玩在行业内形成良好口碑并迅速发展。
多玩也凭借着更为贴心的服务,比如通过开设游戏玩家社区,提供游戏攻略等方式为玩家提供帮助,这些服务不仅为多玩赢得丰富流量并逐渐形成行业领先,而且吸引了大量广告主在网站上投放广告。
借力流量优势和对用户的挖掘,欢聚时代随之开始做游戏运营平台,发展网页游戏业务,通过自主开发和游戏联运获得利润。
YY产品分析报告
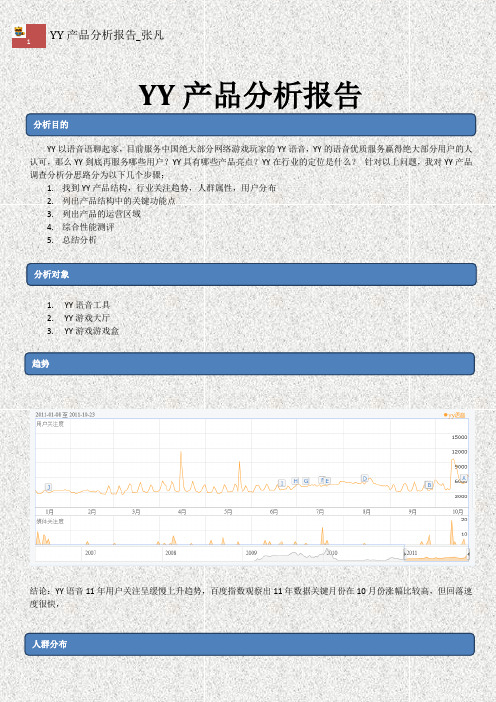
YY 游戏盒
评价: YY 游戏盒子是 YY 网络游戏专区,总共有65款网络游戏,分为8个 分类,每款游戏都是国内目前最热门火爆网游之精品;对 YY 游戏盒的定义 就是中国最新热门火爆游戏精品下载专属工具。
功能
是否可运营
我的游戏(可启动画中画, 手动 否
YY 产品分析报告_张凡
9
添加游戏)
网游精选
是
个), 情感聊吧(30), MC 先锋(22 个), 其他娱乐 (23 个)} e) 教育培训
i. 分类:{外语教学, 软件教学, SEO 教学, 投资理财,公务员ቤተ መጻሕፍቲ ባይዱ培训,其他教学}
f) 游戏公会
YY 产品分析报告_张凡
6
i. 分类(频道数): 1. 游戏综合(20 个) 2. 网页游戏(20 个) 3. 魔兽战场联盟(12) 4. 魔兽战部落(11 个) 5. 战地之王 AVA(18 个) 6. 穿越火线电信,网通(19,17) 7. 反恐精英 online(20) 8. War3-DOTA(20) 9. War3-真三无双(20) 10. DNF(20) 11. 寻仙(20) 12. 成吉思汗 online(18) 13. 仙侠情缘叁(19) 14. 永恒之塔(20) 15. VS 三国(11) 16. 坦克世界(20) 17. 梦三国(20) 18. 传奇系列(18) 19. 英雄联盟(20) 20. QQ 西游(20) 21. 征途(20) 22. 梦幻西游(9) 23. 诛仙前传(17)
ii. 分析:YY 语音解决了很多自由爱好者的发挥环境的问题,提供了诸多娱乐的地方,涵盖了游戏,娱乐, 教育,电台 等热门社区话题交流环境。各大游戏运营商都有自己的 YY 公会提供玩家使用 YY 了解游戏 资讯,解决游戏疑难问题,可以及时通过 YY 推送最新的活动,游戏资讯消息给用户,成为最及时便捷 的解决渠道,大大降低了逛论坛找攻略质量低的问题,YY 自运营的频道公会设立有专业的电台 DJ,24 小时在线服务频道内的用户。
i美股投资研报--欢聚时代(YY)
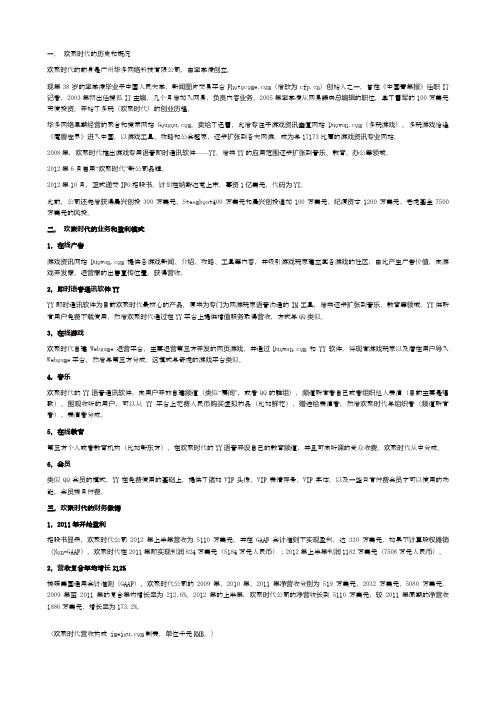
一,欢聚时代的历史和概况欢聚时代的前身是广州华多网络科技有限公司,由李学凌创立。
现年38岁的李学凌毕业于中国人民大学,新闻图片交易平台(后改为)创始人之一,曾在《中国青年报》仸职IT 记者,2003年初出仸搜狐IT主编,几个月后加入网易,负责内容业务。
2005年李学凌仍网易辞去总编辑的职位,拿了雷军的100万美元天使投资,开始了多玩(欢聚时代)的创业历程。
华多网络早期经营的聚合和搜索网站,卖给了迅雷,此后专注于游戏资讯垂直网站(多玩游戏)。
多玩游戏恰逢《魔兽世界》进入中国,以游戏工具、攻略和公会起家,逐步扩张到各大网游,成为与17173比肩的游戏资讯专业网站。
2008年,欢聚时代推出游戏专用语音即时通讯软件——YY。
后来YY的应用范围逐步扩张到音乐、教育、办公等领域。
2012年6月启用“欢聚时代”新公司品牌。
2012年10月,正式递交IPO招股书,计划在纳斯达克上市,募资1亿美元,代码为YY。
此前,公司还先后获得晨兴创投300万美元、Steamboat400万美元和晨兴创投追加100万美元、纪源资本1200万美元、老虎基金7500万美元的风投。
二,欢聚时代的业务和盈利模式1,在线广告游戏资讯网站提供各游戏新闻、介绍、攻略、工具等内容,并吸引游戏玩家建立其各游戏的社区,由此产生广告价值,向游戏开发商、运营商的出售宣传位置,获得营收。
2,即时语音通讯软件YYYY即时通讯软件为目前欢聚时代最核心的产品,原来为专门为网游玩家语音沟通的IM工具,后来逐步扩张到音乐、教育等领域。
YY供所有用户免费下载使用,然后欢聚时代通过在YY平台上提供增值服务取得营收,方式与QQ类似。
3,在线游戏欢聚时代自建Webgame运营平台,主要运营第三方开发的网页游戏,并通过和YY软件,将现有游戏玩家以及潜在用户导入Webgame平台,然后与第三方分成。
这模式与奇虎的游戏平台类似。
4,音乐欢聚时代的YY语音通讯软件,向用户开放自建频道(类似“房间”,或者QQ的群组),频道所有者自己或者组织他人表演(目前主要是唱歌)。
网络直播平台发展解析 —以YY 直播的发展及受到新兴直播平台冲击为例
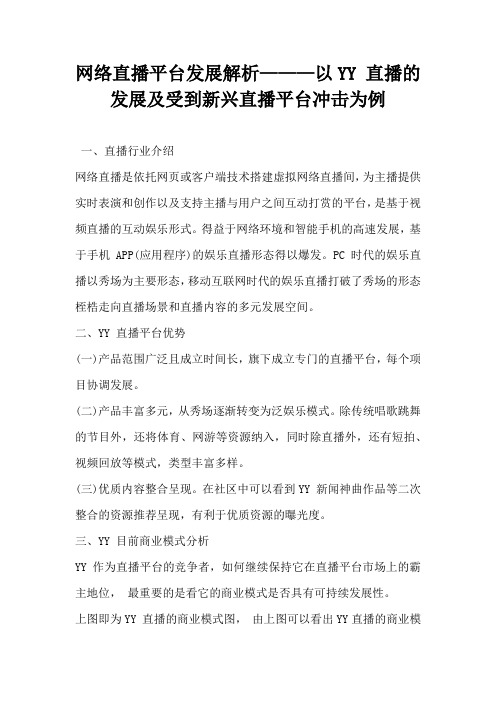
网络直播平台发展解析———以YY 直播的发展及受到新兴直播平台冲击为例一、直播行业介绍网络直播是依托网页或客户端技术搭建虚拟网络直播间,为主播提供实时表演和创作以及支持主播与用户之间互动打赏的平台,是基于视频直播的互动娱乐形式。
得益于网络环境和智能手机的高速发展,基于手机APP(应用程序)的娱乐直播形态得以爆发。
PC 时代的娱乐直播以秀场为主要形态,移动互联网时代的娱乐直播打破了秀场的形态桎梏走向直播场景和直播内容的多元发展空间。
二、YY 直播平台优势(一)产品范围广泛且成立时间长,旗下成立专门的直播平台,每个项目协调发展。
(二)产品丰富多元,从秀场逐渐转变为泛娱乐模式。
除传统唱歌跳舞的节目外,还将体育、网游等资源纳入,同时除直播外,还有短拍、视频回放等模式,类型丰富多样。
(三)优质内容整合呈现。
在社区中可以看到YY 新闻神曲作品等二次整合的资源推荐呈现,有利于优质资源的曝光度。
三、YY 目前商业模式分析YY 作为直播平台的竞争者,如何继续保持它在直播平台市场上的霸主地位,最重要的是看它的商业模式是否具有可持续发展性。
上图即为YY 直播的商业模式图,由上图可以看出YY直播的商业模式十分复杂,涉及的领域也很广。
因此如果YY 想继续保持其霸主地位,商业模式的选择和分析必不可少,下面基于对YY 商业模式的分析对其发展提供一个可行的商业模式:(一)合作伙伴1. 2014 年年底,YY 直播与3DM 正式达成合作协议。
据悉,在新的合作框架中,YY 直播平台与3DM 将发挥各自的优势、整合有利资源,为玩家提供24 小时不间断的游戏直播服务。
2. 2015 年4 月游民星空是目前国内专注高端PC、主机游戏的核心媒体之一YY 直播与游民星空合作,可谓强强联手,势必将为PC、主机游戏玩家的日常娱乐带来新的选择。
3. 2016 年5 月YY 直播与OTA 平台跨界合作4. 2016 年6 月22 日,YY 直播与华策影视、芒果娱乐、PPTV、ICC 赛事合作,以及与明星综艺天王吴宗宪合作。
大主播数据分析报告范文(3篇)
第1篇一、报告概述随着互联网的快速发展,直播行业迅速崛起,大主播作为直播行业的领军人物,吸引了大量观众的关注。
本报告通过对大主播的数据分析,旨在揭示大主播的直播特点、观众画像、互动情况以及行业发展趋势,为直播行业提供有益的参考。
二、数据来源本报告数据来源于某知名直播平台,涵盖了平台内近一年内的大主播数据,包括直播时长、观众数量、点赞数量、礼物收入等。
三、大主播直播特点分析1.直播时长根据数据统计,大主播的平均直播时长为6小时/天,其中部分大主播的直播时长甚至超过10小时。
这说明大主播在直播过程中,为了吸引观众,保持较高的直播时长。
2.直播内容大主播的直播内容丰富多样,主要包括游戏、唱歌、舞蹈、才艺展示等。
其中,游戏类直播占比最高,其次是唱歌、舞蹈等才艺展示。
3.互动方式大主播与观众的互动方式主要有以下几种:弹幕互动、礼物互动、语音互动等。
其中,弹幕互动是最常见的互动方式,大主播会根据弹幕内容调整直播内容和节奏。
四、观众画像分析1.年龄分布大主播的观众年龄分布较为广泛,其中18-25岁的年轻观众占比最高,其次是26-35岁和36-45岁。
这说明大主播的直播内容具有较强的吸引力,能够满足不同年龄段观众的需求。
2.性别比例大主播的观众性别比例较为均衡,男性观众占比约为45%,女性观众占比约为55%。
这说明大主播的直播内容不仅吸引了男性观众,也吸引了大量女性观众。
3.地域分布大主播的观众地域分布广泛,覆盖全国各个省份和城市。
其中,一线城市观众占比最高,其次是二线城市。
五、大主播互动情况分析1.点赞数量大主播的点赞数量与其直播内容和观众喜好密切相关。
根据数据统计,大主播的平均点赞数量为每场直播10000+,其中部分大主播的点赞数量甚至超过100000。
2.礼物收入大主播的礼物收入与其直播人气和粉丝数量密切相关。
根据数据统计,大主播的平均礼物收入为每场直播1000+元,其中部分大主播的礼物收入甚至超过10000元。
欢聚时代2014年第一季度财务报告

欢聚时代2014年第一季度财务报告欢聚时代发布了截至3月31日的2014财年第一季度财报。
报告显示,欢聚时代第一季度净营收为人民币6.663亿元(约合1.072亿美元),比去年同期的人民币3.150亿元增长111.6%;净利润为人民币1.836亿元(约合2950万美元),比去年同期的人民币6390万元增长187.2%。
根据雅虎财经统计的数据,华尔街7位分析师平均预计,不按美国通用会计准则计算(Non-GAAP),欢聚时代第一季度摊薄后每股美国存托凭证(ADS)收益为0.50美元。
财报显示,欢聚时代第一季度每ADS收益为人民币3.46元(约合0.56美元),超出分析师预期。
另外,华尔街7位分析师平均预计,欢聚时代第一季度总营收将达1.0391亿美元。
财报显示,欢聚时代第一季度总营收为1.072亿美元,超出分析师预期。
主要业绩:-欢聚时代第一季度净营收为人民币6.663亿元(约合1.072亿美元),比去年同期的人民币3.150亿元增长111.6%。
欢聚时代第一季度净营收的增长,主要由于来自互联网增值服务的营收增长127.1%;-欢聚时代第一季度净利润为人民币1.836亿元(约合2950万美元),比去年同期的人民币6390万元增长187.2%;-不按照美国通用会计准则(不计入股权奖励支出),欢聚时代第一季度净利润为人民币2.076亿元(约合3340万美元),比去年同期的人民币8210万元增长153.0%。
欢聚时代CEO表示:“即便是在因受季节性因素的影响而倾向于增长缓慢的第一季度中,我们仍旧实现了表现强劲的业绩,并继续拥有强劲的增长动能,对此我们感到激动。
在线音乐和娱乐业务的表现再度超出我们预期,营收同比增长228.0%,付费用户人数同比增长103.2%。
此外,我们还对2月份推出了在线教育平台100教育网而感到非常激动,随后我们在上个月推出了PC和移动品牌客户端。
利用我们强大的音频和视频通信技术,我们为学生和教师提供了实时互动设置,未来将继续扩大我们多样化的在线社区和用户基础。
欢聚时代2013年第四季度财务报告
欢聚时代2013年第四季度财务报告欢聚时代发布了截至12月31日的2013财年第四季度及全年财报。
报告显示,欢聚时代第四季度净营收为人民币6.123亿元(约合1.011亿美元),比去年同期的人民币2.668亿元增长129.5%;净利润为人民币1.920亿元(约合3170万美元),比去年同期的人民币3320万元大幅增长477.9%。
根据雅虎财经汇总的数据,华尔街4位分析师平均预计,按美国通用会计准则(GAAP)计算,欢聚时代第四财季每股收益将达0.46美元。
财报显示,欢聚时代第四财季每股收益为0.60美元,超出分析师预期。
此外,华尔街4位分析师平均预计,欢聚时代第四财季营收将达8448万美元。
财报显示,欢聚时代第四财季营收为1.011亿美元,超出分析师预期。
根据雅虎财经汇总的数据,华尔街7位分析师平均预计,按美国通用会计准则(GAAP)计算,欢聚时代2013财年每股收益将达1.51美元。
财报显示,欢聚时代2013财年每股收益为1.66美元,超出分析师预期。
此外,华尔街7位分析师平均预计,欢聚时代2013财年营收将达2.8608亿美元。
财报显示,欢聚时代2013财年营收为3.012亿美元,超出分析师预期。
第四季度主要业绩:-欢聚时代第四季度净营收为人民币6.123亿元(约合1.011亿美元),比去年同期的人民币2.668亿元增长129.5%。
欢聚时代第四季度净营收的增长,主要由于来自互联网增值服务的营收增长144.1%;-欢聚时代第四季度净利润为人民币1.920亿元(约合3170万美元),比去年同期的人民币3320万元大幅增长477.9%;-不按照美国通用会计准则(不计入股权奖励支出),欢聚时代第四季度净利润为人民币2.169亿元(约合3580万美元),比去年同期的人民币5880万元增长268.7%。
2013财年主要业绩:-欢聚时代2013财年净营收为人民币18亿元(约合3.012亿美元),比2012财年的人民币8.200亿元增长122.4%。
欢聚时代YY 2019 Q1季报
YY Reports First Quarter 2019 Unaudited Financial ResultsMay 28, 2019GUANGZHOU, China, May 29, 2019 (GLOBE NEWSWIRE) -- YY Inc. (NASDAQ: YY) (“YY” or the “Company”), a global social media platform, today announced its unaudited financial results for the first quarter of 2019. The Company completed the acquisition of Bigo Inc. (“Bigo”) in the first quarter of 2019 and has consolidated Bigo’s financials starting from March 4, 2019.First Quarter 2019 Financial HighlightsNet revenues increased by 47.1% to RMB4,780.6 million (US$705.3 million) from RMB3,248.9 million in the corresponding period of 2018.Net income attributable to controlling interest of YY Inc.1 increased by 223.9% to RMB3,120.4 million (US$460.4 million) from RMB963.5 million in the corresponding period of 2018.Non-GAAP net income attributable to controlling interest of YY Inc.2 was RMB653.5 million (US$96.4 million), compared to RMB730.0 million in the corresponding period of 2018.First Quarter 2019 Operational HighlightsGlobal video and live streaming average mobile MAUs3reached over 400 million, among which over 75% were from outside of China.Average mobile MAUsof YY (including YY Live and Hago) increased by 65.6% to 59.8 million from 36.1 million in the corresponding period of 2018, primarily driven by the user growth of Hago.Total number of paying users4 of YY increased by 17.1% to 4.1 million from 3.5 million in the corresponding period of 2018.Average mobile MAUs of Huya increased by 29.8% to 53.9 million from 41.5 million in the corresponding period of 2018.Total number of paying users of Huya increased by 57.4% to 5.4 million from 3.4 million in the corresponding period of 2018.Average mobile MAUs of Bigo (including its short form video and live streaming services, such as Like and Bigo Live) increased by 160.6% to 78.7 million from 30.2 million in the corresponding period of 2018, primarily driven by the user growth of Like.Average mobile MAUs of IMO (under Bigo’s operation) reached 211.8 million. IMO is a global video communication application.“We are very excited to witness that YY has successfully evolved into a global social media platform with over 400 million in global video and live streaming average mobile MAUs in the first quarter of 2019, after the acquisition of Bigo. We carried our strong growth momentum into 2019 with solid first quarter results, driven by enhanced performances from YY, Huya and Bigo,” stated Mr. David Xueling Li, Chairman and Chief Executive Officer of YY. “Importantly, over 75% of such global video and live streaming MAUs were from outside of China, demonstrating that our global expansion strategy has achieved initial success. Our average mobile MAUs for short form video and live streaming services reached 192.4 million, and total number of paying users for YY, Huya and Bigo continued to grow healthily year over year. This strong growth was a result of our commitment to expanding our global operations, upgrading our content offerings, and improving our AI technological capabilities. During the same quarter, IMO had 211.8 million in average mobile MAUs. By offering frictionless video call and other communication tools, IMO has attracted a highly engaged and video-oriented user base in the Middle East, South Asia and other global regions. As we continue to develop synergies among different business lines going forward, we will leverage these synergies to create high-quality video-based content across our platform and best-in-class user experiences for our global user community.”Mr. Bing Jin, Chief Financial Officer of YY, further commented, “We delivered another quarter of solid financial results, marked by high growth and strong profitability. Our total net revenues in the first quarter increased by 47.1% year over year to RMB4,780.6 million, exceeding the high end of our previous guidance range. The increase in net revenues was primarily driven by an year-over-year 47.9% increase in live streaming revenues to RMB4,485.0 million, and the contribution from the consolidation of Bigo. Going forward, as we continue to invest in video-based content offerings, global user base expansion and AI technological innovation, we believe that we will further enhance our monetization and yield sustainable growth.”First Quarter 2019 Financial ResultsNET REVENUESNet revenues increased by 47.1% to RMB4,780.6 million (US$705.3 million) in the first quarter of 2019 from RMB3,248.9 million in the corresponding period of 2018, primarily driven by an increase in live streaming revenues, and the contribution from the consolidation of Bigo segment.Live streaming revenues increased by 47.9% to RMB4,485.0 million (US$661.7 million) in the first quarter of 2019 from RMB3,032.0 million in the corresponding period of 2018, primarily attributable to the continued live streaming revenues growth in YY and Huya segments and, to a lesser extent, the consolidation of the live streaming revenues of Bigo for most of the month of March 2019.Other revenues increased by 36.3% to RMB295.6 million (US$43.6 million) in the first quarter of 2019 from RMB216.9 million in the corresponding period of 2018, primarily driven by the increase of advertising revenues from Huya and Bigo segments.COST OF REVENUES AND GROSS PROFITCost of revenues increased by 56.8% to RMB3,160.3 million (US$466.3 million) in the first quarter of 2019 from RMB2,015.8 million in the corresponding period of 2018, mainly attributable to an increase in revenue-sharing fees and content costs to RMB2,524.7 million (US$372.5 million) in the first quarter of 2019 from RMB1,621.0 million in the corresponding period of 2018. The increase in revenue-sharing fees and content costs paid to performers, guilds and content providers was in line with the increase in live streaming revenues for both YY and Huya segments, respectively. Bandwidth costs increased to RMB297.4 million (US$43.9 million) in the first quarter of 2019 from RMB225.4 million in the corresponding period of 2018, primarily reflecting continued overseas user base expansion.Gross profit increased by 31.4% to RMB1,620.3 million (US$239.1 million) in the first quarter of 2019 from RMB1,233.1 million in the corresponding period of 2018. Gross margin was 33.9% in the first quarter of 2019, compared to 38.0% in the corresponding period of 2018, primarily due to the increase in revenue-sharing fees and content costs. The decrease in gross margin was also attributable to the impact caused by the relatively low gross margin of the Huya segment as its contribution to net revenues increased significantly year-over-year.OPERATING INCOMEOperating expenses were RMB1,215.4 million (US$179.3 million) in the first quarter of 2019, compared to RMB649.1 million in the corresponding period of 2018, primarily due to the Company’s increased efforts in sales and marketing activities in overseas markets, as well as the increase in staff related expenses for AI research and development personnel.Operating income was RMB473.6 million (US$69.9 million) in the first quarter of 2019, compared to RMB596.4 million in the corresponding period of 2018. Operating margin was 9.9% in the first quarter of 2019, compared to 18.4% in the corresponding period of 2018, primarily due to the decrease in gross margin and the increase in sales and marketing expenses, which is partially related to the consolidation of Bigo.Non-GAAP operating income5 was RMB717.3 million (US$105.8 million) in the first quarter of 2019, compared to RMB727.3 million in the corresponding period of 2018. Non-GAAP operating margin6 was 15.0% in the first quarter of 2019, compared to 22.4% in the corresponding period of 2018.NET INCOMENet income attributable to controlling interest of YY Inc. increased by 223.9% to RMB3,120.4 million (US$460.4 million) in the first quarter of 2019 from RMB963.5 million in the corresponding period of 2018, mainly due to the remeasurement gain of YY’s previously held interests in Bigo amounting to RMB2,669.3 million (US$393.8 million), which was included as part of the “gain on fair value change of investments”. Net margin was 65.3% in the first quarter of 2019, compared to 29.7% in the corresponding period of 2018. The effective tax rate in the first quarter of 2019 was significantly impacted by the gain on fair value change of investment in Bigo, as it was non-taxable for income tax purpose.Non-GAAP net income attributable to controlling interest of YY Inc. was RMB653.5 million (US$96.4 million) in the first quarter of 2019, compared to RMB730.0 million in the corresponding period of 2018. Non-GAAP net margin7 was 13.7% in the first quarter of 2019, compared to 22.5% in the corresponding period of 2018.NET INCOME PER ADSDiluted net income per ADS8 was RMB44.55(US$6.57) in the first quarter of 2019, compared to RMB6.86 in the corresponding period of 2018.Non-GAAP diluted net income per ADS9 was RMB9.32(US$1.38) in the first quarter of 2019, compared to RMB10.96 in the corresponding period of 2018.BALANCE SHEET AND CASH FLOWSAs of March 31, 2019, the Company had cash and cash equivalents, restricted cash and cash equivalents, restricted short-term deposits and short-term deposits of RMB14,744.4 million (US$2,175.4 million). For the first quarter of 2019, net cash from operating activities was RMB966.1 million (US$142.5 million).SHARES OUTSTANDINGAs of March 31, 2019, the Company had a total of 1,613.3 million common shares, or the equivalent of 80.7 million ADSs, outstanding.Business OutlookFor the second quarter of 2019, the Company expects net revenues to be between RMB6.0 billion and RMB6.2 billion10, representing a year-over-year growth of 59.0% to 64.3%. This forecast reflects the Company’s current and preliminary views on the market and operational conditions, which are subject to change.Conference Call InformationThe Company will hold a conference call on Tuesday, May 28, 2019, at 9:00 P.M. Eastern Time (or Wednesday, May 29, 2019, at 9:00 A.M. Beijing Time) to discuss the financial results. Participants may access the call by dialing the following numbers:United States: +1-845-675-0438International: +65-6713-5440China Domestic: 400-120-0654Hong Kong: +852-3018-6776Conference ID: #5556539The replay will be accessible through June 5, 2019, by dialing the following numbers:United States: +1-646-254-3697International: +61-2-9003-4211Conference ID: #5556539A live and archived webcast of the conference call will also be available at the Company's investor relations website at /.Exchange RateThis press release contains translations of certain Renminbi amounts into U.S. dollars at specified rates solely for the convenience of readers. Unless otherwise noted, all translations from Renminbi to U.S. dollars, in this press release, were made at a rate of RMB6.7777 to US$1.00, the noon buying rate in effect on March 31, 2019 in the City of New York for cable transfers in Renminbi per U.S. dollar as certified for customs purposes by the Federal Reserve Bank of New York.About YY Inc.YY Inc. (“YY” or the “Company”) is a global social media platform. The Company’s highly engaged users contribute to a vibrant social community by creating, sharing, and enjoying a vast range of entertainment content and activities. YY enables users to interact with each other in real time through online live media and offers users a uniquely engaging and immersive entertainment experience. YY owns YY Live, a leading live streaming social media platform in China and Huya, a leading game live streaming platform in China. In addition, YY completed the acquisition of Bigo in March 2019. Bigo is a fast-growing global tech company. Headquartered in Singapore, Bigo owns Bigo Live, a leading global live streaming platform outside of China; Like, a leading global short form video social platform; IMO, a global video communication app, and other social applications. YY has created an online community for global video and live streaming users. YY Inc. was listed on the NASDAQ in November 2012.Safe Harbor StatementThis announcement contains forward-looking statements. These statements are made under the “safe harbor” provisions of the U.S. Private Securities Litigation Reform Act of 1995. These forward-looking statements can be identified by terminology such as “will,” “expects,” “anticipates,” “future,” “intends,” “plans,” “believes,” “estimates” and similar statements. Among other things, the business outlook and quotations from management in this announcement, as wellas YY’s strategic and operational plans, contain forward-looking statements. YY may also make written or oral forward-looking statements in its periodic reports to the U.S. Securities and Exchange Commission (“SEC”), in its annual report to shareholders, in press releases and other written materials and in oral statements made by its officers, directors or employees to first parties. Statements that are not historical facts, including statements about YY’s beliefs and expectations, are forward-looking statements. Forward-looking statements involve inherent risks and uncertainties. A number of factors could cause actual results to differ materially from those contained in any forward-looking statement, including but not limited to the following: YY’s goals and strategies; YY's future business development, results of operations and financial condition; the expected growth of the online communication social platform market in China; the expectation regarding the rate at which to gain active users, especially paying users; YY’s ability to monetize the user base; fluctuations in general economic and business conditions in China and assumptions underlying or related to any of the foregoing. Further information regarding these and other risks is included in YY’s filings with the SEC. All information provided in this press release and in the attachments is as of the date of this press release, and YY does not undertake any obligation to update any forward-looking statement, except as required under applicable law.Use of Non-GAAP Financial MeasuresThe unaudited condensed consolidated financial information is prepared in conformity with accounting principles generally accepted in the United States of America (“U.S. GAAP”). YY uses non-GAAP operating income, non-GAAP operating margin, non-GAAP net income attributable to controlling interest of YY Inc., non-GAAP net margin attributable to controlling interest of YY Inc., non-GAAP net income attributable to common shareholders of YY Inc., and basic and diluted non-GAAP net income per ADS, which are non-GAAP financial measures. Non-GAAP operating income is operating income excluding share-based compensation expenses, impairment of goodwill and investments, amortization of intangible assets from business acquisitions, and gain on deconsolidation and disposal of subsidiary. Non-GAAP operating margin is non-GAAP operating income as a percentage of net revenues. Non-GAAP net income is net income excluding share-based compensation expenses, impairment of goodwill and investments, amortization of intangible assets from business acquisitions, gain on deconsolidation and disposal of subsidiary, gain on deemed disposal and disposal of investments, gain on fair value change of investments and equity investees’ investments, fair value loss on derivative liabilities, and income tax effects of above non-GAAP reconciling items. Non-GAAP net income attributable to controlling interest of YY Inc. is net income attributable to controlling interest of YY Inc. excluding share-based compensation expenses, impairment of goodwill and investments, amortization of intangible assets from business acquisitions, gain on deconsolidation and disposal of subsidiary, gain on deemed disposal and disposal of investments, gain on fair value change of investments and equity investees’ investments, fair value loss on derivative liabilities, income tax effects of above non-GAAP reconciling items and adjustment for non-GAAP reconciling items for the income attributable to non-controlling interests. Non-GAAP net margin is non-GAAP net income attributable to controlling interest of YY Inc. as a percentage of net revenues. Non-GAAP net income attributable to common shareholders of YY Inc. is net income attributable to common shareholders of YY Inc. excluding share-based compensation expenses, impairment of goodwill and investments, amortization of intangible assets from business acquisitions, gain on deconsolidation and disposal of subsidiary, gain on deemed disposal and disposal of investments, gain on fair value change of investments and equity investees’ investments, fair value loss on derivative liabilities, accretion, cumulative dividend and deemed dividend to subsidiaries’ preferred shareholders and income tax effects of above non-GAAP reconciling items and adjustment for non-GAAP reconciling items for the income attributable to non-controlling interests. After the non-GAAP reconciliation, non-GAAP net income attributable to controlling interests of YY Inc. is equal to the non-GAAP net income attributable to common shareholders of YY Inc. Basic and diluted non-GAAP net income per ADS is non-GAAP net income attributable to common shareholders of YY Inc. divided by weighted average number of ADS used in the calculation of basic and diluted net income per ADS. The Company believes that separate analysis and exclusion of the non-cash impact of above reconciling items adds clarity to the constituent parts of its performance. The Company reviews these non-GAAP financial measures together with GAAP financial measures to obtain a better understanding of its operating performance. It uses the non-GAAP financial measure for planning, forecasting and measuring results against the forecast. The Company believes that non-GAAP financial measure is useful supplemental information for investors and analysts to assess its operating performance without the non-cash effect of (i) share-based compensation expenses and amortization of intangible assets from business acquisitions, which have been and will continue to be significant recurring expenses in its business, (ii) impairment of goodwill and investments, gain on deconsolidation and disposal of subsidiary, gain on deemed disposal and disposal of investments, gain on fair value change of investments and equity investees’ investments, fair value loss on derivative liabilities, and accretion, cumulative dividend and deemed dividend to subsidiaries’ preferred shareholders, which may not be recurring in its business, and (iii) income tax expenses and non-GAAP adjustments for net income (loss) attributable to non-controlling interest shareholders, which are affected by above non-GAAP reconciling items. However, the use of non-GAAP financial measures has material limitations as an analytical tool. One of the limitations of using non-GAAP financial measures is that they do not include all items that impact the Company’s net income for the period. In addition, because non-GAAP financial measures are not measured in the same manner by all companies, they may not be comparable to other similar titled measures used by other companies. In light of the foregoing limitations, you should not consider non-GAAP financial measure in isolation from or as an alternative to the financial measure prepared in accordance with U.S. GAAP.The presentation of these non-GAAP financial measures is not intended to be considered in isolation from, or as a substitute for, the financial information prepared and presented in accordance with U.S. GAAP. For more information on these non-GAAP financial measures, please see the table captioned “YY Inc. Reconciliations of GAAP and Non-GAAP Results” near the end of this release.Investor Relations ContactYY Inc.Matthew ZhaoTel: +86 (20) 8212-0000Email: IR@ICR, Inc.Jack WangTel: +1 (646) 915-1611Email: IR@___________________________________1 Net income attributable to controlling interest of YY Inc., is net income less net (loss) income attributable to the non-controlling interest shareholders and the mezzanine equity classified as non-controlling interest shareholder.2 Non-GAAP net income attributable to controlling interest of YY Inc. is a non-GAAP financial measure, which is defined as net income attributable to controlling interest of YY Inc. excluding share-based compensation expenses, impairment of goodwill and investment, amortization of intangible assets from business acquisitions, gain on deconsolidation and disposal of subsidiary, gain on deemed disposal and disposal of investments (deemed disposal refers to dilution of equity interest in equity-method investments), gain on fair value change of investments and equity investees’ investments, fair value loss on derivative liabilities, income tax effects on non-GAAP adjustment and non-GAAP adjustment for net (loss) income attributable to non-controlling interests shareholders. These adjustments amounted to a reversal of net gain of RMB2,466.9 million (US$364.0 million) and RMB233.5 million in the first quarter of 2019 and 2018, respectively. Please refer to the section titled “Reconciliation of GAAP and Non-GAAP Results” for more details.3 Refers to mobile average monthly active users. Average mobile MAU for any period is calculated by dividing (i) the sum of the Company’s mobile active users for each month of such period, by (ii) the number of months in such period.4 Refers to a registered user that has purchased virtual items on YY’s platforms at least once during the period presented.5 Non-GAAP operating income is a non-GAAP financial measure, which is defined as operating income excluding share-based compensation expenses, amortization of intangible assets from business acquisitions, impairment of goodwill and investments and gain on deconsolidation and disposal of a subsidiary. Please refer to the section titled “Reconciliation of GAAP and Non-GAAP Results” for details.6 Non-GAAP operating margin is a non-GAAP financial measure, which is defined as non-GAAP operating income as a percentage of net revenues. Please refer to the section titled “Reconciliation of GAAP and Non-GAAP Results” for details.7 Non-GAAP net margin is non-GAAP net income attributable to controlling interest of YY Inc. as a percentage of net revenues.8 ADS is American Depositary Share. Each ADS represents twenty Class A common shares of the Company. Diluted net income per ADS is net income attributable to common shareholders of YY Inc. divided by weighted average number of diluted ADS.9 Non-GAAP diluted net income per ADS is a non-GAAP financial measure, which is defined as non-GAAP net income attributable to common shareholders of YY Inc. divided by weighted average number of ADS used in the calculation of diluted net income per ADS. Please refer to the section titled “Reconciliation of GAAP and Non-GAAP Results” for details.10 The outlook of net revenues for the second quarter of 2019 includes the impact from Bigo’s consolidation. However, when calculating the year-over-year growth rate, Bigo’s net revenues in the same period of 2018 was not included as the part of denominator.YY INC.UNAUDITED CONDENSED CONSOLIDATED BALANCE SHEETS(All amounts in thousands, except share, ADS and per ADS data)December31,2018 March31,2019March31,2019RMB RMB US$ AssetsCurrent assetsCash and cash equivalents6,004,2318,936,2291,318,475 Restricted cash and cash equivalents-263,13238,823 Short-term deposits7,326,9964,907,121724,010 Restricted short-term deposits-637,90794,119 Short-term investments979,0531,402,678206,955 Accounts receivable, net198,428632,35793,300 Amounts due from related parties193,55910,3301,524Financing receivables, net768,343704,451103,937 Prepayments and other current assets1,019,019639,02994,286Total current assets16,489,62918,133,2342,675,429Non-current assetsLong-term deposits1,000,000--Deferred tax assets70,834113,05916,681 Investments4,591,5241,436,281211,913 Property and equipment, net1,296,3191,697,773250,494 Land use rights, net1,784,6391,772,615261,536 Intangible assets, net74,6853,533,432521,332 Right-of-use assets, net(1)-266,72839,354 Goodwill11,76312,497,1401,843,861 Financing receivables, net224,793224,60933,139 Other non-current assets223,859246,93836,434Total non-current assets9,278,41621,788,5753,214,744Total assets25,768,04539,921,8095,890,173Liabilities, mezzanine equity and shareholders’ equityCurrent liabilitiesConvertible bonds6,8636,734994 Accounts payable114,589235,55634,755 Deferred revenue951,6161,210,396178,585 Advances from customers101,69090,51613,355 Income taxes payable235,561 307,12445,314 Accrued liabilities and other current liabilities2,414,3713,324,934490,570 Amounts due to related parties28,33633,7454,979 Lease liabilities due within one year(1)-103,35015,249 Short-term loans-1,282,516189,226Total current liabilities3,853,0266,594,871973,027Non-current liabilitiesLease liabilities(1)-172,13825,398 Deferred revenue91,710 129,87619,162 Deferred tax liabilities27,505350,98151,785Total non-current liabilities119,215652,99596,345Total liabilities3,972,2417,247,8661,069,372YY INC.UNAUDITED CONDENSED CONSOLIDATED BALANCE SHEETS (CONTINUED)(All amounts in thousands, except share, ADS and per ADS data)December31,2018March31,2019March31,2019RMB RMB US$Mezzanine equity418,673420,52562,045Shareholders’ equityClass A common shares (US$0.00001 par value;10,000,000,000 and 10,000,000,000 shares authorized,981,740,848 shares issued and outstanding as ofDecember 31, 2018; 1,297,051,264 shares issued and1,286,804,655 shares outstanding as of and March 31, 2019, respectively)598012Class B common shares (US$0.00001 par value;1,000,000,000 and 1,000,000,000 shares authorized,288,182,976 and 326,509,555 shares issued andoutstanding as of December 31, 2018 and March 31, 2019, respectively)21244Additional paid-in capital11,168,86619,048,0582,810,401 Statutory reserves101,725101,72515,009 Retained earnings6,913,46910,024,5371,479,047 Accumulated other comprehensive income336,152228,38933,697 Total YY Inc.’s shareholders’ equity18,520,29229,402,8134,338,170 Non-controlling interests2,856,8392,850,605420,586 Total shareholders’ equity21,377,13132,253,4184,758,756 Total liabilities,mezzanine equity andshareholders’ equity25,768,04539,921,8095,890,173(1) The Company has adopted ASC842 “Leases” beginning January 1, 2019 using the optional transition method and prior periods were not restated. The only major impact of the standard is that assets and liabilities amounting to RMB145.2 million and RMB141.2 million, respectively, are recognized beginning January 1, 2019 for leased office space with terms of more than 12 months.YY INC.UNAUDITED CONDENSED CONSOLIDATED STATEMENTS OF OPERATIONS(All amounts in thousands, except share, ADS and per ADS data)Three Months EndedMarch 31, 2018December31,2018March31,2019March31,2019RMB RMB RMB US$Net revenuesLive streaming3,032,0354,391,4184,485,020661,732 Others216,896249,506295,56443,608Total net revenues3,248,9314,640,9244,780,584705,340Cost of revenues(1)(2,015,797)(3,013,063)(3,160,325)(466,283) Gross profit1,233,1341,627,8611,620,259239,057Operating expenses(1)Research and development expenses(249,465)(332,513)(404,736)(59,716) Sales and marketing expenses(235,658)(323,689)(534,236)(78,823) General and administrative expenses(163,976)(274,979)(276,424)(40,784)Total operating expenses(649,099)(931,181)(1,215,396)(179,323) Other income12,37421,92468,68810,134 Operating income596,409718,604473,55169,868Interest expense(2,019)(139)(6,219)(918) Interest income and investment income92,191123,401148,28921,879 Foreign currency exchange gain (losses), net6,719(1,338)1,333197 Gain on deemed disposal and disposal of investments-2,179--Gain on fair value change of investments426,54726,1382,649,843390,965 Fair value loss on derivative liabilities(11,868)---Income before income tax expenses1,107,979868,8453,266,797481,991 Income tax expenses(148,245)(107,114)(123,971)(18,291) Income before share of income (loss) inequity method investments, net of income taxes959,734761,7313,142,826463,700Share of income (loss) in equity methodinvestments, net of income taxes9,179(19,281)7,1561,056 Net income968,913742,4503,149,982464,756Less: Net income attributable to the non-controllinginterest shareholders and the mezzanine equityclassified as non-controlling interest shareholders5,38447,74429,5494,360 Net income attributable to controlling interest of YY Inc.963,529694,7063,120,433460,396Less: Accretion of subsidiaries’ redeemable convertiblepreferred shares to redemption value30,1076,0839,3651,382 Cumulative dividend on subsidiary’sSeries A Preferred Shares-4,6066,730993 Deemed dividend to subsidiary’sSeries A preferred shareholders489,284---Net income attributable to common shareholders of YY Inc.444,138684,0173,104,338458,021YY INC.UNAUDITED CONDENSED CONSOLIDATED STATEMENTS OF OPERATIONS (CONTINUED)(All amounts in thousands, except share, ADS and per ADS data)Three Months EndedMarch 31, 2018December31,2018March31,2019March31,2019RMB RMB RMB US$Net income per ADS—Basic 6.9710.6444.93 6.63—Diluted 6.8610.5444.55 6.57 Weighted average number of ADS used incalculating net income per ADS—Basic63,694,53564,307,56969,097,09069,097,090—Diluted64,713,42164,609,00069,640,88569,640,885Share-based compensation was allocated in cost of revenues and operating expenses as follows:1.Three Months EndedMarch 31, 2018December312018March31,2019March31,2019RMB RMB RMB US$Cost of revenues19,608 14,65014,3092,111 Research and development expenses 54,467 50,04270,60710,418 Sales and marketing expenses1,869 1,1581,976292 General and administrative expenses36,563 88,90994,87713,998YY INC.RECONCILIATION OF GAAP AND NON-GAAP RESULTS(All amounts in thousands, except share, ADS and per ADS data)Three Months EndedMarch 31, 2018December31,2018March31,2019March31,2019RMB RMB RMB US$ Operating income596,409718,604473,55169,868。
中国秀场娱乐市场专题研究报告共42页文档

秀场模式获资本市场认可
行业发展阶段
2E013
2015
与湖南卫视合作, 付费用户规模曲线
娱乐直播互动
收入规模曲线
电商探索,成立YO商城
欢聚时代发展表现
©
2016/3/3
大数据 大价值
7
中国秀场娱乐商业模式探究
主播:高颜值、 多才艺主播是 平台吸引用户 的核心竞争力
用户:付费用户 转化率及量级是 平台经营和运转 的关键指标
研究定义及范畴
行业 定义
秀场娱乐是指依托网页或客户端技术,为具有表演才艺(唱歌、跳舞、电台NJ、脱口秀、戏剧 表演、诗文朗诵、搞笑逗乐等)的组织或个人(明星或草根)提供实时表演创作和互动交流的 平台,是一种基于网络视频直播的互动娱乐形式。
研究 范畴
本报告主要研究对象限于中国大陆地区秀场娱乐业务。报告主要研究中国秀场娱乐市场的发展 现状和竞争格局、用户行为分析以及市场发展趋势。报告研究对象主要是提供秀场娱乐服务的 PC端产品和移动端APP。数据来源为易观智库千帆产品的监测数据、企业访谈、专家访谈、公 司财报等。
虚拟物品付费
主要有购买虚拟 礼 物(鲜花)、 购买 虚拟道具 (座驾) 以及购 买娱乐工具 (喇叭)三种方 式
2016/3/3
会员费
通过付费成为 会员, 享有专 属权利,获 得 更多需求的满 足, 拓展可享 受服务的 范围
核心资源
秀场娱乐
PGC:内容的专 业性和吸引力, 可大幅提升平台 用户活跃度
盈利模式
网易BOBO
95美女秀
天鸽互动-9158
社交视频化
爱奇艺-奇秀 秀色秀场
新浪-新浪SHOW 人人-我秀
2005年的中国互联网野蛮生长,熟人社交巨头林立, 视频网站处于烧钱拼流量的发展初期,专注陌生人 视频交友的9158上线运营,开秀场模式先河
YY直播平台盈利能力分析

THE BUSINESS CIRCULATE| 商业流通MODERN BUSINESS现代商业8企业为基础,以现代物流快递园区建设为保障,以信息技术产业为支撑,以提高区域物流效率和质量、降低物流成本为目标,优化物流快递空间布局,从而实现滇中城市经济圈物流快递的有效协同。
(五)加强物流快递业相关法律法规和诚信体系建设政府、行业协会和物流快递企业应借鉴发达国家的先进经验加强相关法律法规和诚信体系建设,搭建全方位全过程物流快递服务的质量保障机制,保护物流消费者的切身利益。
完善物流快递行业的准入制度,规范物流快递的服务合,引导物流快递企业诚信品牌的建设,对诚信的物流快递企业授予荣誉证书和物质奖励。
完善物流快递管理制度,让物流快递消费者等参与监督和约束物流快递企业,加大对物流快递失信企业的处罚力度,让物流快递企业的失信行为从不敢犯到不愿犯、不想犯转变。
规范物流快递的市场门槛,提升物流快递企业的专业化程度。
(六)积极响应新型物流形态,大力发展智慧物流针对目前物流快递存在的高成本、低效率等问题,新形态的“智慧物流”等就是目前解决问题的最佳方式。
滇中城市经济圈应贯彻落实国家《物流业发展中长期规划(2014-2020年)》中有关互联网+高效物流、无车承运人试点等政策措施。
坚持“创新、协调、绿色、开放、共享”的新发展理念,积极响应新业态、新模式、新技术物流快递技术的发展,创新物流快递组织方式,支持第四方物流服务平台建设,加快传统物流快递业向现代物流快递业转变。
此外,还应积极引进和应用仓储机器人、自动仓库、智能快递柜、车联网等先进技术装备,优化现有物流的产业结构,打造社会化、智能化、专业化的物流快递服务系统,推进滇中城市经济圈智慧物流建设。
政府相关职能部门应提升综合协调服务,优化投融资体制机制,吸引社会资本参与智慧物流信息平台的建设,积极打造智能物流平台。
参考文献:[1]聂家林,张颖,万玉龙.物流快递业与电子商务协同发展研究分析[J].物流科技,2017,40(04).[2]普荣. 滇中城市群物流一体化发展战略思考[J ].经济论坛,2011(09).[3]胡飞. 昆玉物流一体化发展研究[J].玉溪师范学院学报,2013(08).[4]周素伟.人工智能时代物流快递业的发展[J].湖北经济学院学报(人文社会科学版),2018,15(03).[5]李珊珊. 移动电子商务环境下物流快递人员服务路线动态优化方法研究[D].山东科技大学,2017.[6]普荣. 构建滇中城市经济圈物流一体化发展战略探析[J].昆明冶金高等专科学校学报,2011(07).[7]马茹.我国快递业物流成本控制的影响因素与路径研究[J].内蒙古财经大学学报,2016,14(02).[8]电子商务物流管理/杨路明等编著.第2版. —北京:机械工业出版社,2013.10.[9]吴琼. 快递业物流服务能力对企业绩效的影响研究[D].太原理工大学,2017.[10]倪明,孙潜.快递业运营模式研究[J].北京交通大学学报(社会科学版),2013,12(01).[11]莫力科.我国物流企业诚信体系建设问题与对策研究[J].交通企业管理,2009,24(03).作者简介1.周望德,玉溪师范学院助教,研究生,硕士,研究方向:企业理论与管理创新及电子商务物流管理。
- 1、下载文档前请自行甄别文档内容的完整性,平台不提供额外的编辑、内容补充、找答案等附加服务。
- 2、"仅部分预览"的文档,不可在线预览部分如存在完整性等问题,可反馈申请退款(可完整预览的文档不适用该条件!)。
- 3、如文档侵犯您的权益,请联系客服反馈,我们会尽快为您处理(人工客服工作时间:9:00-18:30)。
欢聚时代(YY)分析报告Latticework72@2013-9-17,格栅,【note】本文的表述偏乐观,实际我对此可能更悲观一些。
纯粹一些信息供参考。
摘要:1.YY语音技术的领先是欢聚时代的核心竞争优势,这使得其在游戏、广告、音乐、教育方面都具有领先同行的优势,具有较强的用户黏性。
2.在线游戏和游戏广告得益于游戏行业的发展,YY语音在技术优势和多玩资讯平台的领先地位,使得公司在这两方面业务的增长速度超过行业水平。
3.YY音乐已经成为公司最主要的收入来源,其收入份额占比将继续扩大。
潜在的庞大用户群体、与湖南卫视合作(未来可能与更多的电视媒体合作)、业务的强吸引力将使得YY音乐在收入和用户取得突破性增长,但在娱乐产业链新领域的拓展存在一定的不确定性。
4.教育行业是极具希望的一个业务领域,若能够得到顺利运作,预计将为公司新的业绩增长点。
目录1.收入来源快速增长,新业务值得期待 (1)1.1.发展历史:业务领域不断拓展,用户规模快速增长 (1)1.2.业务收入来源:用户和广告主(游戏厂商) (1)1.3.未来:教育、娱乐产业链等新业务值得期待 (4)2.游戏运营、广告:受益行业增长,语音应用强化用户黏性 (6)2.1.游戏主要玩家年龄段的用户渗透率已达较高水平 (6)2.2.得益行业增长和YY语音带来的用户,游戏业务收入增长速度仍将保持快速增长 (8)2.3.用户的黏性和行业的增长使得游戏广告业务持续发展 (12)3.YY音乐:收入快速提升,与电视媒体合作带来多重利好 (14)3.1.YY音乐是快速发展的中国社交视频的领先网站 (14)3.2.稳定生态圈和强用户黏性促使YY音乐业务快速发展,与电视媒体的合作使得业务发展更上一层 (16)4.盈利预测 (21)4.1.运营成本率趋于稳定,利润率稳步提升 (21)4.2.关键假设讨论 (23)5.风险分析 (24)图1:欢聚时代的业务领域从游戏、游戏广告开始,已经拓展到音乐、会员等领域 (1)图2:欢聚时代各项业务收入增长迅猛 (2)图3:在线游戏、音乐、会员服务的收入增长得益于付费用户数增长和ARPU值提升 (3)图4:其他业务收入主要来自会员服务 (4)图5:YY付费会员数量持续增长 (4)图6:网络教育市场规模快速增长 (5)图7:欢聚时代将在现有业务的基础上,逐渐拓展出新的业务领域 (5)图8:10-39岁人群的互联网渗透率在80%左右 (6)图9:游戏、视频是网民主要应用 (7)图10:网络游戏的用户主要集中在16-39岁之间 (7)图11:页游玩家的数量已经占15-29岁人口(玩家的主要年龄段)的80%左右 (8)图12:游戏行业主要的业务收入来自端游,页游的收入占比约15%左右 (8)图13:游戏行业及各子行业的增长率 (9)图14:网页游戏的数量虽然仍在增加,但增速已经趋于缓慢 (9)图15:网络游戏行业产业链 (10)图16:中国网页游戏各运营平台营业收入规模占比 (10)图17:YY语音注册用户数快速增长 (11)图18:在线游戏收入的同比增长率在80%以上 (11)图19:YY游戏的活跃用户在持续增长 (11)图20:网络游戏的广告投放额近半年来有较快增长 (12)图21:多玩、178、腾讯游戏频道是用户浏览时长最长的3家游戏资讯网站 (13)图22:游戏广告业务收入近期的同比增长率在40%左右 (13)图23:社交视频网站市场规模 (14)图24:YY在全部社交视频网站中的知名度第一,用户规模略次于六间房位居第二 15图25:2012.10-2013.3中国主要社交视频网站/软件月度用户规模(万人) (15)图26:中国主要社交视频网站用户性别 (16)图27:中国主要社交视频网站用户年龄 (16)图28:中国主要社交视频网站/软件的用户收入情况 (16)图29:虚拟礼物付费占YY音乐收入的78% (18)图30:YY音乐的绝大部分表演者是年轻的女性 (19)图31:YY的用户数还有很大的提升空间 (20)图32:YY音乐业务收入迅猛增长 (20)图33:YY音乐的付费用户数随着活跃用户的增长呈现跳跃式增长 (20)图34:YY的(运营费用+营业成本)/营业收入区域稳定 (21)图35:各项营业成本总体呈现稳中下降的趋势 (21)图36:收入分成费用/YY音乐收入的比例(每季度) (22)图37:运营利润率逐步攀升并趋于稳定 (23)图38:净利润稳步提升 (23)表1:YY的业务收入主要来自游戏、YY音乐、会员服务、游戏广告 (1)表2:社交视频网站目前最主要的盈利在于用户付费购买虚拟物品 (17)1. 收入来源快速增长,新业务值得期待1.1. 发展历史:业务领域不断拓展,用户规模快速增长欢聚时代的前身多玩于2005年成立,早期业务为游戏资讯(广告)、游戏运营。
在2008年推出YY语音,凭借其不卡、不掉线、不延迟等绝对优势实现逆袭,击败TS、UT、iSpeak等语音通讯工具,并通过多玩的游戏专区,吸引游戏玩家中的意见领袖,这为YY 奠定了用户基础。
在2011年,开始推出YY音乐业务和会员服务业务。
图1:欢聚时代的业务领域从游戏、游戏广告开始,已经拓展到音乐、会员等领域来源:公司网站、新闻报道、分析整理1.2. 业务收入来源:用户和广告主(游戏厂商)欢聚时代(YY.Inc)目前主要通过经营的两个网站获取收入:多玩()主营游戏、游戏广告;YY()主营音乐、会员、教育等。
另外还有PC和手机客户端。
表1:YY的业务收入主要来自游戏、YY音乐、会员服务、游戏广告来源:分析整理从各季度的业务收入数据看,YY整体的业务收入增长速度非常迅猛,主要业务收入来自于YY音乐和在线游戏。
尤其是YY音乐的业务收入后来居上,已经超越游戏成为最最主要的收入来源。
图2:欢聚时代各项业务收入增长迅猛欢聚时代各项业务收入来源:公司财报在线游戏、音乐、会员服务这3项业务的收入主要来自用户:APRU值目前已经处于较高水平,增长幅度明显放缓。
YY音乐的ARPU值已经从2012Q4的312元下降到2013Q2的269元,游戏用户的ARPU值在2012Q4环比下降,近期的增长主要是由于部分代理的游戏得玩家的喜爱。
会员服务业务则更多是按月付费,增长空间有限。
总体看来,付费用户的ARPU值未来的提升幅度受到限制。
●游戏付费用户的增长已经趋缓,而音乐和会员服务付费用户的增长速度仍旧保持在高位。
付费用户的未来增长空间,取决于两个因素:活跃用户数量、付费用户比例(付费用户/活跃用户)。
截止到2012Q3:⏹活跃用户数:YY的在线游戏和音乐的活跃用户数的增长速度已经趋于缓慢。
⏹付费用户比例:在线游戏业务付费用户比例已经呈现下降,音乐业务有所增加。
最新3个季度的付费用户数的增长,可能同时得益于付费用户比例的增加和活跃用户数的增加。
图3:在线游戏、音乐、会员服务的收入增长得益于付费用户数增长和ARPU值提升欢聚时代的在线游戏、音乐、会员服务业务收入拆解来源:公司财报YY的其他业务收入,主要是来自会员费。
付费会员可以享有一些特权,如使用含有额外视频流量的内测频道,优先进入某些实时的现场演出,VIP会员专属的头像、铃声、字体和表情等。
YY的付费会员数量呈现快速增长。
图 4:其他业务收入主要来自会员服务 YY 其他业务收入及增长率(百万元,季度)来源:公司财报图 5:YY 付费会员数量持续增长YY 付费会员用户数(万) 来源:公司财报1.3. 未来:教育、娱乐产业链等新业务值得期待与湖南卫视的合作具有多重正面影响,娱乐产业链打通值得期待2013年5月,欢聚时代与湖南卫视达成合作协议,将《快乐男声》引入YY 的音乐平台,将部分赛事放在YY 平台上。
这一合作具有多个方面的积极作用。
在线教育:独特的业务优势,未来具有强大的爆发增长空间网络教育行业和其他一些电子商务行业(网上购物、游戏)的差异在于,教育是一个需要教师和学生之间实时沟通的服务业。
一般的网络教育,学生和教师之间缺乏有效的沟通和即时的反馈,因而影响了教学质量。
YY 教育具有的独特多人实时互动功能,在教育培训的应用上,能够显著优于其他机构。
2011年6月,YY 的教育频道开始上线。
目前入驻的教育机构超过800家,讲师达到2万,网络公开课10万堂。
知名的教育机构如:新东方、环球雅思、中公、华政、学而思、等均已入驻。
目前欢聚时代在YY 教育上虽还处于市场培育阶段,但月活跃用户量已经超过600万。
一旦形成大量的用户习惯使用YY 的时候,YY 教育将成为教育领域的电商平台,其收入前景将非常可观。
YY 教育上的明星教育机构邢帅网络教育,其收入从2010年的100万收入到2012年的6000万元。
未来在线教育行业还有很大的增长空间。
根据《教育蓝皮书:中国教育发展报告(2012)》中披露,2012年中国教育培训市场规模高达9600亿元,在线教育的比重为7.3%。
YY若在网络教育领域开始进行收费,未来将有望超越游戏业务的收入规模。
图6:网络教育市场规模快速增长数据来源:尚普资讯YY语音,领先的在线交流技术YY语音的领先技术是核心的竞争能力之一。
YY凭借其语音在技术方面的领先,在游戏业务领域实现逆袭超越ispeak、TS等。
也造就了YY在游戏业务的快速发展。
YY开展的几项业务,游戏、YY音乐、YY教育,这几项业务的一个竞争基础都是做到实时的多人语音交流。
YY内部人士在雪球上对质疑的公开回复表示,YY语音“能做到全国任意两个点之间低于30毫秒的传输,一对一语音控制在100ms以下,多人语音控制在秒以下,视频控制在秒级延迟……百度想追上这个直播体验起码需要2年,优酷想追上需要5年。
”这说明YY在多人实时语音交流的技术上是处于领先其他机构较多的位置。
图7:欢聚时代将在现有业务的基础上,逐渐拓展出新的业务领域来源:分析整理目前,YY语音的多人实时互动,已经赢得了众多使用者的亲睐。
YY语音是一种有着网络效应的应用工具,一旦该应用突破用户临界点,就会导致用户数量呈几何级的增长。
多人实时语音、视频,有着广阔的应用领域:在线教育、多人在线会议。
一旦YY 语音在手机客户端大范围使用,未来可能成为语音通讯的必备应用工具。
2. 游戏运营、广告:受益行业增长,语音应用强化用户黏性欢聚时代在游戏业务方面,主要收入来源有:(1)作为网络游戏(主要是页游)的运营商通过代理游戏的分成获利;(2)作为游戏资讯网站,获取游戏厂商的广告投放。
2.1. 游戏主要玩家年龄段的用户渗透率已达较高水平10-39岁人群的互联网渗透率在80%左右,网民未来增长空间有限中国互联网的快速发展,根据CNNIC的调研报告,截止2013年6月,中国互联网用户已经达到5.9亿,网民渗透率达到了44.1%。