第10章_LabVIEW常用工具包
LabVIEW常用工具包(PPT 61页)

LabVIEW数据库连接 工具包
9
报表生成例程
10
报表生成例程
该例程遵循“打开→操作→保存→关闭”的文件编程模式。首先使用新建报 表.vi建立Excel报表;后使用Excel Easy Title.vi设置报表标题为“IEI测试 报告”,同时将标题字体设置为“微软雅黑”,字号设置为24号;接下来使用 Excel Easy Text.vi插入报告概述,同时将报告概述的字体设置为“宋体”, 字号设置为12号;下一步使用Excel Easy Table.vi将表格插入到Excel报表中, 字体和字号依前设置;接下来使用Excel Easy Graph.vi将波形图插入到Excel 报表中;最后设置好报表的保存路径,保存完毕后使用处置报表.vi关闭报表, 释放资源。
11
LabVIEW数据库连接 工著名具的包商业用数据库管理系统有MS
SQL Server、Orace、DB2、Visual Foxpro、Microsoft Access等等。 另外,开源的数据库管理系统有 MySQL、Apache Derby、PostgreSQL、 Ingres等等。MS SQL Server是 Microsoft公司开发的商用数据库管 理系统,在工业测试应用中非常流 行,安装和使用都非常方便,并且 支持SQL语言,所以本节基于MS SQL 12
(5) 使用处置报表.vi关闭报表文件,释放资源。
7
基于模板的报表生成方 式
1.建立模板
(1) 打开Microsoft Excel程序, 新建空白工作簿;
(2) 将 A1 单 元 格 的 名 称 改 为 “ReportTitle”;
(3) 将 A2 单 元 格 的 名 称 改 为 “ReportTime”;
Labview所有的模块和工具包

Labview所有的模块和⼯具包NI LabVIEW Product FamilyThe NI LabVIEW product family consists of the LabVIEW development environment and add-on software tools that extend LabVIEW graphical programming for specific applications. Learn more about the LabVIEW product family or download fully-functional trials of more than 25 LabVIEW modules and toolkits.LabVIEW Core Development SystemLabVIEW is an award-winning development environment optimizedfor engineers and scientists creating test, measurement, and control applications. With LabVIEW, you can quickly and easily acquire real-world signals, perform analysis on your data, and store results in a variety of ways. Learn More | Try LabVIEW Now Add-On Modules and ToolkitsView more resources on virtually every product in the LabVIEW family or evaluate software immediately by downloading a fully-functional 30-day trial. Embedded DesignUse LabVIEW to design, prototype, and deploy embedded applications to a variety of processing targets, including off-the-shelf real-time and FPGA-based systems as well as custom microprocessor and microcontroller devices. NI Modules and Toolkits for Embedded Design:LabVIEW Real-Time Module NI Real-Time Execution Trace ToolkitLabVIEW FPGA ModuleLabVIEW Microprocessor SDKLabVIEW Statechart ModuleLabVIEW Mobile Module ? LabVIEW DSP ModuleLabVIEW Embedded Modulefor ARM MicrocontrollersLearn More | Evaluate NowControl Design and SimulationCombine algorithm development, analysis, and visualization in LabVIEW with tools for system identification, control design, simulation, and implementation.NI Modules and Toolkits for Control Design and Simulation:LabVIEW Control Design and Simulation ModuleLabVIEW PID and Fuzzy Logic ToolkitLabVIEW Real-Time ModuleReal-Time Execution Trace Toolkit LabVIEW FPGA ModuleLabVIEW Statechart ModuleLabVIEW Simulation Interface ToolkitLabVIEW System Identification ToolkitLearn More | Evaluate NowImage and Signal ProcessingIncorporate hundreds of application-specific image and signal processing functions into your LabVIEW applications.NI Modules and Toolkits for Image and Signal Processing:Vision Development Module for LabVIEWLabVIEW MathScript RT ModuleLabVIEW Advanced Signal Processing ToolkitLabVIEW Digital Filter Design ToolkitLabVIEW Adaptive Filter Toolkit Sound and Vibration Measurement SuiteSound and Vibration ToolkitSpectral Measurements Toolkit Modulation Toolkit for LabVIEWVision Builder for Automated InspectionLabVIEW Math Interface ToolkitLearn More | Evaluate NowIndustrial Monitoring and ControlDeploy LabVIEW to networked programmable automation controllers (PACs) to create reliable distributed monitoring and control systems, and connect to your existing programmable logic controllers (PLCs) and enterprise systems.NI Modules and Toolkits for Industrial Monitoring and Control:LabVIEW Real-Time ModuleReal-Time Execution Trace ToolkitLabVIEW FPGA ModuleLabVIEW Datalogging and Supervisory Control ModuleLabVIEW Wireless Sensor Network Module Pioneer LabVIEW Touch Panel Module LabVIEW Statechart ModuleNI Motion AssistantLabVIEW NI SoftMotion ModuleLearn More | Evaluate NowSoftware Development and DeploymentDevelop and deploy professional, higher-quality LabVIEW applications using a variety of software engineering tools.NI Modules and Toolkits for Software Development and Deployment:LabVIEW Application Builder for WindowsLabVIEW VI Analyzer Toolkit LabVIEW Statechart ModuleLabVIEW Desktop Execution Trace Toolkit LabVIEW Remote PanelsNI Requirements GatewayLabVIEW Unit Test Framework ToolkitLearn MoreReport Generation and Data StorageNI Modules and Toolkits for Report Generation and Data Storage: ?LabVIEW SignalExpress LabVIEW Report Generation Toolkit for Microsoft Office LabVIEW Database Connectivity Toolkit LabVIEW DataFinder ToolkitLabVIEW Internet Toolkit。
国家仪器(National Instruments)LabVIEW DSP测试集成工具包(LabVI

LabVIEW™, National Instruments™, ™, and NI™ are trademarks of National Instruments Corporation. Product and company names mentioned herein are trademarks or trade names of their respective companies. For patents covering National Instruments products, refer to the appropriate location: Help»Patents in your software, the patents.txt file on your CD, or /patents.September 2003323452B-01LabVIEW DSP Test Integration Toolkit for TI DSPThe LabVIEW DSP Test Integration Toolkit for TI DSP gives you theability to use LabVIEW and the TI Code Composer Studio™ (CCS)Integrated Development Environment (IDE) to create test systems for DSPtarget code.The LabVIEW DSP Test Integration Toolkit includes VIs to automateCCS IDE and VIs that use the TI Real-Time Data Exchange™ (RTDX™)software technology to communicate with TI DSP development boards thatsupport RTDX. Use the toolkit automation VIs to work with CCS IDEproject (.pjt) files programmatically. Use the toolkit RTDXcommunication VIs and the toolkit memory VIs to programmaticallyexchange data with target code. The LabVIEW DSP Test IntegrationToolkit also includes the LabVIEW Debugging Workbench for RTDX™Communication, which you can use to interact with RTDX channels ondevelopment boards that support RTDX.Refer to the LabVIEW DSP Test Integration Toolkit Help by selectingHelp»LabVIEW DSP Test Integration Toolkit Help for referenceinformation about the DSP Test Integration VIs.ContentsInstallation (2)Automating CCS IDE Functions (3)Exchanging Data with DSP Target Code (3)Writing and Reading Data from DSP Memory (4)Working with Target Code Data in LabVIEW (5)Using DSP Test Integration Advanced VIs (5)™© 2002–2003 National Instruments Corp. All rights reserved.InstallationComplete the following steps to install the LabVIEW DSP Test IntegrationToolkit for TI DSP.1.Verify the following components are installed before continuing withinstallation:7.0•LabVIEW•CCS IDE 2.2 or later•TI DSP development platform that you can configure with CCS.The C2000™ DSP platform is compatible only with the toolkitautomation VIs.Refer to the development board documentation for information aboutinstalling and configuring the development board.(Windows 2000/NT/XP) Log in as an administrator or as a user withadministrator privileges before you install the LabVIEW DSP TestIntegration Toolkit.2.Insert the LabVIEW DSP Test Integration Toolkit CD into theCD-ROM drive. The LabVIEW DSP Test Integration Toolkitinstallation program runs automatically.where x is the letter of the CD-ROM drive, and click the OK button.3.Follow the instructions that appear on the screen.The LabVIEW Debugging Workbench for RTDX™ Communicationinstalls with the LabVIEW DSP Test Integration Toolkit. Use theLabVIEW Debugging Workbench for RTDX™ Communication to quicklyinteract with target code RTDX channels using LabVIEW controls andindicators. Select Tools»RTDX»LabVIEW Debugging Workbenchfor RTDX Communication from CCS or select Programs»NationalInstruments»LabVIEW Debugging Workbench for RTDXCommunication from the Windows Start menu to launch the LabVIEWDebugging Workbench.LabVIEW DSP Test Integration Toolkit for TI Automating CCS IDE FunctionsUse the LabVIEW DSP Test Integration Toolkit VIs to control theCCS IDE and project files. You can launch CCS IDE, open a .pjt file,build the .pjt file, and download the resulting .out file to a developmentboard from a LabVIEW VI to automate CCS IDE functionality.The block diagram in Figure1 shows how you can automate the processof compiling DSP target code and embedding the code on a developmentboard. Wire the .pjt file path to the CCS Open Project VI to open the.pjt file in CCS IDE. The CCS Build VI builds the .pjt file to create theDSP target code .out file. The CCS Download Code VI downloads the.out file to the development board. The CCS Run VI runs the embedded.out file on the development board. You then can use the toolkit RTDXcommunication and the toolkit memory VIs to access data from the targetcode.Figure 1. LabVIEW Automation of CCS IDEThe CCS Halt VI and CCS Close Project VI stop the .out file running onthe development board and close the project in CCS IDE. Exchanging Data with DSP Target CodeAfter you create DSP target code in the CCS IDE and embed the .out fileon a development board, you can create LabVIEW VIs to test the targetcode. You can transfer simulation data to the DSP target code from a VI andanalyze output data from the target code on the development board.Use the RTDX communication VIs to send data to DSP target code RTDXinput channels and to receive data from RTDX output channels. RTDXallows system developers to transfer data between LabVIEW and the targetprocessor without interfering with target code execution. The data inputscan be any test values you want to pass to the target code with eachiteration, and the data outputs can be any values you want to retrieve foranalysis from the target code after each iteration.© National Instruments Corporation3LabVIEW DSP Test Integration Toolkit for TI DSPThe block diagram in Figure2 shows how to send data to and receive datafrom RTDX channels of DSP target code running on a development board.While running, the DSP target code for the example expects sine wave data.The Simulate Signal VI creates a test sine wave. The CCS RTDX Write VIwrites the test sine wave to the WaveIn RTDX channel of the DSP targetcode. The DSP target code uses the test sine wave data it receives from theWaveIn RTDX channel.The CCS RTDX Read VI reads waveform data from the WaveOut RTDXchannel of the DSP target code. This example VI displays the waveformdata on a waveform graph.Figure 2. RTDX Communication with DSP Target Code Writing and Reading Data from DSP MemoryYou can access data from the memory of target processors. The memoryVIs communicate with the development board slower than the RTDXcommunication VIs, but you can use them to perform simple codemonitoring and control.The following target code runs on the target processor and executes a loopthat increases the value of the counter symbol until the run_flag symbolequals 0.volatile Int16 run_flag = 1;Int16 counter = 0;void main(){while( run_flag ) {// loop executes until run_flag equals zero.// counter increases during each iteration.counter++;}}LabVIEW DSP Test Integration Toolkit for TI © National Instruments Corporation 5LabVIEW DSP Test Integration Toolkit for TI DSPIn Figure 3, the CCS Symbol to Memory Address VI returns the memory address of the counter symbol and passes the memory address to the CCS Memory Read VI. The CCS Memory Read VI reads the value of memory at the memory address and this example VI displays the value of the counter symbol on the front panel.Figure 3. Reading Data Values from MemoryYou can control the target code by changing the value of target codesymbols. In Figure 4, the CCS Symbol to Memory Address VI passes the current memory address of the run_flag symbol to the CCS Memory Write VI. The CCS Memory Write VI changes the value of run_flag to 0,stopping the target code loop.Figure 4. Writing Data Values to MemoryWorking with Target Code Data in LabVIEWYou can analyze, manipulate, and present test data the DSP target code returns. For example, on the block diagram in Figure 2, the DSP target code returns waveform test data to analyze in LabVIEW. A waveform graph displays the waveform data. Refer to the LabVIEW User Manual for information about the measurement, analysis, and presentation features of LabVIEW.Using DSP Test Integration Advanced VIsDenoted by a blue background, the DSP Test Advanced VIs handlelow-level CCS IDE and RTDX functionality, such as launching CCS IDE and enabling or disabling RTDX communication. Use the DSP Test Integration Advanced VIs when you want more control over CCS IDE andRTDX functionality.Use the LabVIEW ActiveX Property and Invoke nodes to control theCCS IDE functionality using the DSP Test Integration Advanced VIs.Refer to the the LabVIEW User Manual for information about using Invokeand Property nodes.LabVIEW DSP Test Integration Toolkit for TI 。
LabVIEW 多核分析和稀疏矩阵工具包介绍
LabVIEW多核分析和稀疏矩阵工具包介绍发布日期: 七月18, 2013 | 0 评级| 0.00 out of 5 |Read in English| PDF概览NI LabVIEW多核分析和稀疏矩阵工具包提供了高性能的LabVIEW多线程分析库,是在线或离线的大数据集处理应用的理想工具。
实际上,许多现实世界的问题可以表示为大型线性代数计算,而该工具包可以为这些运算减少所需的资源和总体的计算时间。
此外,该工具包包括稀疏线性代数函数,并支持单精度和双精度数据类型。
本文介绍了LabVIEW多核分析和稀疏矩阵工具包的用途和推荐用法。
目录1. 高性能多线程分析如前所述,NI LabVIEW多核分析和稀疏矩阵工具包提供了一系列高性能、多线程分析库,可以用来处理大型数据集。
这些库是专为基于英特尔®数学内核函数库(Intel® MKL)的Windows 操作系统而设计的。
该内核库是一个高度优化、多线程化的数学计算函数库,满足最高性能需求的应用。
此外,当您将这个工具包与LabVIEW实时模块一同使用时,这些库可以被扩展到LabVIEW实时(ETS)的目标中。
因此,用户能够使用多线程线性代数、基本线性代数子程序(BLAS)和基于快速傅立叶变换(FFT)的函数。
图1.多核分析和稀疏矩阵函数选板包含高性能、多线程分析以及稀疏矩阵代数函数。
该工具包提供了各种函数库,每个函数可以更好地利用多核CPU。
而且它还包含一组线程管理函数,因此用户可以调整应用程序的线程行为特性。
图2.线程管理函数选板包含有效管理线程的函数。
至页首2. 管理线程本节以两个矩阵相乘为例来介绍管理线程的方法。
管理线程时,首要考虑的是执行函数的系统中可用的内核数。
要获得目标系统的CPU特性,可以使用 CPU Information 函数。
此外,线程管理函数选板中的 Get Threads 函数可以在之后立即添加以获取可用线程的最大数量。
LabVIEW模块和工具包(图像和信号处理)

欢迎下载LabVIEW模块和工具包(图像和信号处理)
将数百种特定应用程序的图像和信号处理函数集成到NI LabVIEW应用程序中。
可将NI LabVIEW扩展至特定的应用,如:声音和振动测量、机器视觉、RF通信、瞬时与短时信号分析等。
NI LabVIEW模块和工具包, 用于图像和信号处理:
∙NI LabVIEW高级信号处理工具包
∙数字滤波器设计工具包
∙自适应滤波器工具包(Adaptive Filter Toolkit)
∙MathScript RT工具包
∙NI声音与振动测量套件
∙NI自动检测视觉生成器
∙NI视觉开发模块
报告生成工具包:
∙用于Microsoft Office的报告生成工具包(56 MB)
数据库和外部连接工具包:
∙数据库连接工具包(55 MB)
∙因特网工具包(58 MB)
数据存储和管理工具包:
∙DataFinder工具包(118MB)
∙NI实时执行追踪工具包(131MB)
其它相关模块工具包:
∙NI LabVIEW SignalExpress (779 MB)
更多LabVIEW相关资料
∙更多LabVIEW 模块产品
∙在线研讨会: LabVIEW 2011新特性
∙NI LabVIEW 中文主页
∙LabVIEW 视频教学中心
∙LabVIEW 中文资源库
联系NI
如有任何问题,请与NI上海市场部联系。
免费咨询电话800 820-3622,或021-5050 9800,或Email至@。
第10章LabVIEW常用工具包
17
LabVIEW数据库基本操作
数据库操作遵循“打开数据库→操作数据库→关闭数据库” 的基本流程。其中,使用DB Tools Open Connection.vi 来打开数据库连接,使用DB Tools Close Connection.vi 关闭数据库连接。在“操作数据库”步骤中可以对数据库 进行所需的操作。
14
使用DSN连接数据库
LabVIEW 数 据 库 连 接 工 具 包 基 于 ODBC ( Open Database Connectivity ) 技 术。在使用该工具包的时候,需要提 供数据源名DSN(Data Source Names) 才能连接到数据库,所以需要先创建 DSN 。 在 Windows 控 制 面 板 → 管 理 工 具 →数据源(ODBC)中打开数据源管理 器,在“用户DSN”选项卡中单击“添 加”按钮,选择“SQL Server”驱动, 输入用户名和密码后,点击“测试数 据源”,如果配置正确的话,就会弹 出“测试成功的提示”,本例中的DSN 配置如图所示。完成以上步骤后,就 可 以 在 “用 户 DSN” 中看到新建立的 DSN了。
(4) 将 该 工 作 簿 保 存 为 Excel972003模版的格式保存。本例中命 名为Excel template.xlt保存在C 盘根目录下。
8
基于模板的报表生成方式
2.使用交互式VI编程
MS Office Report.vi就会自动 添加两个变体数据类型的输入端, 名字分别为“ReportTitle”和 “ReportTime”,即为创建 Excel模版时定义好的名字。之 后可以通过分别为这两个输入端 赋值来生成所需要的报表。
15
使用udl文件连接数据库
LabVIEW入门指南从零开始学习电气工程师的必备工具

LabVIEW入门指南从零开始学习电气工程师的必备工具LabVIEW入门指南LabVIEW(Laboratory Virtual Instrument Engineering Workbench)是一款由美国国家仪器公司(National Instruments)开发的图形化编程环境和开发平台。
它被广泛应用于电气工程领域,为电气工程师提供了一个强大而易于使用的工具。
本文将以LabVIEW入门为主题,从零开始指导电气工程师学习LabVIEW,帮助他们更好地掌握这一必备工具。
一、LabVIEW的基本概念和特点1.1 什么是LabVIEWLabVIEW是一款基于图形化编程的软件工具,用户可以通过拖拽和连接图形元件来进行程序设计。
与传统的文本式编程语言相比,LabVIEW的图形化编程方式更加直观和易于理解,使得用户能够更快速地开发和调试程序。
1.2 LabVIEW的特点LabVIEW具有以下几个特点:(1)图形化编程:通过将各种功能模块以图形元件的方式组合起来,用户可以直观地表示程序的逻辑和功能。
(2)虚拟仪器:LabVIEW提供了大量的仪器模块和工具箱,可以方便地模拟各种实际仪器,如示波器、函数发生器等。
(3)数据流编程:LabVIEW采用数据流的方式进行编程,即当数据准备好时,相应的程序模块才会执行,这种方式减少了程序的冗余和资源的浪费。
二、LabVIEW的安装和基本操作2.1 安装LabVIEW首先,您需要从美国国家仪器公司的官方网站下载LabVIEW的安装包。
安装过程相对简单,按照提示一步步进行即可。
2.2 LabVIEW界面概述打开LabVIEW后,您将看到一个由工具栏、面板、功能栏等组成的界面。
工具栏提供了常用操作的快捷方式,面板用于显示程序的输入和输出,功能栏包含了各种功能模块和工具。
2.3 创建一个简单的LabVIEW程序接下来,我们将创建一个简单的LabVIEW程序,以帮助您初步了解LabVIEW的基本操作。
第10章 LabVIEW常用工具包

15
使用udl文件连接数据库
Microsoft 公司设计的 ODBC 标准只能访问 关系型数据库,对非关系型数据库则无能 为力。为了解决这个问题, Microsoft 公 司另外提供了一种技术: Active数据对象 ADO ( Active Data Objects )技术。 ADO 使用通用数据连接 UDL ( Universal Data Link)来获得数据库信息以实线数据库连 接。 udl 文件的创建方法非常简单,可以 在任意文件夹下建立一个文本文件,然后 将其后缀名改为 udl 即可,本例中将此文 件命名为 IEI_Measurements.udl ,双击打 开 udl 文件进行配置,在“提供程序”选 项 卡 中 选 择 “ Microsfot OLE DB Provider for SQL Server ” , 然 后 在 “连接”选项卡中设置好数据库服务器的 相关信息,点击“测试连接”按钮,如果 配置没有问题,则会提示“测试连接成 功”,至此udl文件配置完成。
6
Word报表生成
Word报表的生成方式和Excel报表类似。该例程的编写步骤如下: (1) 使用新建报表 .vi 进行报表建立,报表类型选择为“Word ”,同时为了使程序运行时不会弹出 Excel软件窗口,窗口状态选项要选择为“minimized”; (2) 放入Word Easy Title.vi,该VI可以在Word Specific目录下找到,使用本VI可以给给当前Word 报表设置标题。在本例中,将报表标题设置为“IEI系统测试报告”,另外,使用本VI还可以设 置标题的字体等等; (3) 放入Word Easy Text.vi,该VI可以在Word Specific目录下找到,使用本VI即可以将所需内容 添加至Word报表中。在本例中,需要将报表日期插入当前报表,则需要将报表日期字符串连接 至“text”端。另外,使用本VI还可以设置报表的字体、背景颜色以及对齐方式等等; (4) 使用报表保存至文件.vi将报表保存为.doc格式。本例中将报表命名为 IEI Report.doc保存在C 盘根目录下; (5) 使用处置报表.vi关闭报表文件,释放资源。
第10章 LabVIEW常用工具包精编版
11
LabVIEW数据库连接工具包
数据库分类:关系型数据库;非关系型数据库
著名的商业用数据库管理系统有MS SQL Server、 Orace、DB2、Visual Foxpro、Microsoft Access 等等。另外,开源的数据库管理系统有MySQL、 Apache Derby、PostgreSQL、Ingres等等。MS SQL Server是Microsoft公司开发的商用数据库管理系 统,在工业测试应用中非常流行,安装和使用都非 常方便,并且支持SQL语言,所以本节基于MS SQL Server 2005为例介绍数据库连接工具包的操作方 式。
9
报表生成例程
10
报表生成例程
该例程遵循“打开→操作→保存→关闭”的文件编程模式。首先使用新建报 表.vi建立Excel报表;后使用Excel Easy Title.vi设置报表标题为“IEI测 试报告”,同时将标题字体设置为“微软雅黑”,字号设置为24号;接下来 使用Excel Easy Text.vi插入报告概述,同时将报告概述的字体设置为“宋 体”,字号设置为12号;下一步使用Excel Easy Table.vi将表格插入到 Excel报表中,字体和字号依前设置;接下来使用Excel Easy Graph.vi将波 形图插入到Excel报表中;最后设置好报表的保存路径,保存完毕后使用处置 报表.vi关闭报表,释放资源。
16
LabVIEW数据库基本操作
建立好数据源之后,使用LabVIEW数据库连接工具包就可以 非常方便的对数据库进行操作了。LabVIEW数据库连接工具 包安装完成后,可以在背面板的函数→互联接口 →Database面板下找到所有的相关VI。
LabVIEW模块和工具包(控制设计和仿真)
欢迎下载LabVIEW模块和工具包(控制设计和仿真)
NI 提供完整的系统辨识,控制设计,仿真和控制器执行模块工具,利用这些模块和工具包能方便客户进行算法开发、分析和验证
∙LabVIEW 控制设计和仿真模块
∙LabVIEW PID 控制工具包
∙LabVIEW Real-Time 模块
∙Real-Time 实时执行跟踪工具包
∙LabVIEW FPGA 模块
∙LabVIEW 状态图模快
∙LabVIEW 仿真接口工具包
∙LabVIEW 系统辨识工具包
下载控制设计模块工具包:
∙LabVIEW 控制设计和仿真模块(336 MB)
∙PID和Fuzzy Logic工具包(61 MB)
∙LabVIEW 系统辨识工具包(111 MB)
∙LabVIEW 状态图模块(72 MB)
下载开发和部署实时对象模块工具包:
∙LabVIEW Real-Time 模块(644 MB)
∙Real-Time 实时执行跟踪工具包(131 MB)
下载开发和部署FPGAs模块工具包:
∙LabVIEW FPGA 模块(556 MB)
∙Virtex II目标FPGA编译工具包(1.8 GB)
∙Virtex II其他目标FPGA编译工具包(2.95 GB)
更多LabVIEW相关资料
∙更多LabVIEW 模块产品
∙NI LabVIEW 中文主页
∙LabVIEW 2011 新特性
∙LabVIEW 视频教学中心
∙LabVIEW 中文资源库
联系NI
如有任何问题,请与NI上海市场部联系。
免费咨询电话800 820-3622,或021-5050 9800,或Email至@。
LabVIEW执行跟踪工具包用户指南说明书
LabVIEW™, National Instruments™, NI™, and ™ are trademarks of National Instruments Corporation. Product and company names mentioned herein are trademarks or trade names of their respective companies. For patents covering National Instruments products, refer to the appropriate location: Help»Patents in your software, the patents.txt file on your CD, or /patents.April 2004 323738A-01LabVIEW Execution Trace ToolkitUser GuideThis document provides an overview of the LabVIEW Execution TraceToolkit. The LabVIEW Execution Trace Toolkit is a real-time event andexecution tracing tool that allows you to capture and display the timing andevent data of applications you build with the LabVIEW Real-Time Module.Refer to the LabVIEW Real-Time Module User Manual for informationabout developing deterministic applications using LabVIEW. ContentsInstallation Instructions (2)Introduction to the LabVIEW Execution Trace Toolkit (2)Capturing a Trace Session (2)Starting a Trace Session (2)Stopping a Trace Session (3)Viewing Trace Sessions (4)Viewing and Analyzing VI Events (5)Viewing and Analyzing Thread Events (8)Logging Analysis and Custom Events (9)Displaying Analysis Events (9)Logging and Displaying Custom Events (10)Working with Trace Sessions (11)Printing Trace Sessions (11)Saving Trace Sessions (12)Loading Trace Sessions (12)Troubleshooting (12)Where to Go from Here (12)™© 2004 National Instruments Corp. All rights reserved.Printed in Ireland.Installation InstructionsComplete the following steps to install the LabVIEW Execution TraceToolkit.1.(Windows 2000/NT/XP) Log in as an administrator or as a user withadministrator privileges before you install the LabVIEW ExecutionTrace Toolkit.2.Insert the LabVIEW Execution Trace Toolkit CD into the CD-ROMdrive. The LabVIEW Execution Trace Toolkit installation programruns automatically.3.Follow the instructions that appear on the screen. Introduction to the LabVIEW Execution Trace ToolkitThe LabVIEW Execution Trace Toolkit includes the LabVIEW ExecutionTrace Tool and the Execution Trace Tool VIs. The Execution Trace ToolVIs allow you to capture the timing and execution data of VI and threadevents for applications running on an RT target. The LabVIEW ExecutionTrace Tool displays the timing and event data, or trace session, on the hostcomputer. Launch the LabVIEW Execution Trace Tool by selectingTools»LabVIEW Execution Trace Tool in LabVIEW. Capturing a Trace SessionThe LabVIEW Execution Trace Tool displays trace sessions you captureusing the Execution Trace Tool VIs. You must add Execution Trace ToolVIs to the block diagram of an application running on the RT target to startand stop the logging of timing and event data from VIs and operatingsystem threads.Starting a Trace SessionThe TraceTool Start Trace VI starts logging event data on the RT target.Figure1 shows the block diagram of a VI with the TraceTool Start TraceVI added.The Buffer Size input of the TraceTool Start Trace VI sets the size ofthe memory buffer that collects all event data for the application on theRT target. Set the size of the memory buffer large enough to contain allevent data. If you reach the memory buffer limit when logging event data,the TraceTool Start Trace VI overwrites the oldest data in the buffer.Note You cannot change the size of the memory buffer on the RT target after you run theTraceTool Start Trace VI. You must reboot the RT target to resize the memory buffer.LabVIEW Execution Trace Toolkit User © National Instruments Corporation 3LabVIEW Execution Trace Toolkit User GuideFigure 1. Starting and Stopping a Trace SessionThe amount of time you can capture in a trace session depends on the sizeof the memory buffer and the type of events that you choose to capture. Youcan disable the logging of VI, thread, and detailed events. The ThreadTracing? and VI Tracing? inputs of the TraceTool Start Trace VI specifywhether to log thread and VI events. The Detailed Tracing? input of theTraceTool Start Trace VI specifies whether to log detailed events, which theLabVIEW Execution Trace Tool uses to display analysis and customevents. Refer to the Logging Analysis and Custom Events section forinformation about analysis and custom events.Stopping a Trace SessionThe TraceTool Stop Trace and Send VI stops logging event data on the RTtarget and then sends the trace session to the LabVIEW Execution TraceTool running on the host computer. Specify the IP address of the hostcomputer running the LabVIEW Execution Trace Tool using the TraceHost Network Address input of the TraceTool Stop Trace and Send VI.Figure 1 shows the block diagram of a VI with the TraceTool Stop Traceand Send VI added.NoteThe LabVIEW Execution Trace Tool must be running on the host computer to receive the trace session.The VI in Figure 1 uses a Flat Sequence structure to define the dataflow ofthe block diagram and force the TraceTool Start Trace VI to execute beforeVIs in the application. The TraceTool Stop Trace and Send VI executesafter the application completes. You can start and stop the trace session ina subVI of an application to target a specific section of code and to conservespace in the memory buffer.You also can use the TraceTool Stop Trace and Save VI to stop loggingevent data and save the trace session to a file on the RT target. You cantransfer the trace session file to the host computer using the TraceTool LoadTrace and Send VI. Refer to the Working with Trace Sessions section forinformation about working with trace sessions on the host computer. Referto the LabVIEW Help by selecting Help»VI, Function, & How-To Helpin LabVIEW for VI reference information about the Execution TraceTool VIs.Viewing Trace SessionsThe LabVIEW Execution Trace Tool displays a trace session graphicallyusing the VI Events and Thread Events views, as shown in Figure2.Figure 2. LabVIEW Execution Trace Tool ViewsWhen the LabVIEW Execution Trace Tool loads a trace session, it displaysthe entire trace session in the VI Events and Thread Events views. Todisplay only the Thread Events view or only the VI Events view in theLabVIEW Execution Trace Tool, deselect from the View menu the viewthat you want to hide.LabVIEW Execution Trace Toolkit User © National Instruments Corporation 5LabVIEW Execution Trace Toolkit User GuideYou can zoom in and out of a region of the trace session or measure thetiming of a specific range in the trace session using the following toolsavailable in the LabVIEW Execution Trace Tool palette:Use the Cursors tool to display two cursors in the VI Events or ThreadEvents view to measure the timing of the range contained between the twocursors. Click and drag each cursor on the VI Events or Thread Events viewto set the range you want to measure. Use the pull-down menu to the left ofthe Cursors tool to select the units for the timing measurement. The text boxto the left of the Cursors tool displays the measurement results.Use the Zoom Region tool to zoom into a region you select. Click and dragin the VI Events or Thread Events view to select a zoom range.Use the Zoom In tool to zoom into the VI Events and Thread Events view.Click on the VI or Thread Events view with the Zoom In tool to zoom intothe currently displayed range.Use the Zoom Out tool to zoom out of the VI Events and Thread Eventsviews. Click on the VI Events or Thread Events view with the Zoom Outtool to zoom out of the currently displayed range.Use the View Entire Session tool to display the entire trace session in theVI Events and Thread Events views.Viewing and Analyzing VI EventsThe LabVIEW Execution Trace Tool displays VI event data in the VIEvents view. The VI Events view shows all VIs in memory on the RT targetwhen you captured the trace session and when the VIs executed on the RTtarget with respect to time from left to right. The LabVIEW ExecutionTrace Tool displays VI events in different colors to distinguish theexecution priority of each VI. Table 1 lists the colors associated with eachLabVIEW priority.Table 1. Priority–Color Representation Priority ColorTime CriticalRed HighDark Pink Above NormalLight PinkNormalWhite BackgroundBlue Subroutine BlackLabVIEW Execution Trace Toolkit User Guide The LabVIEW Execution Trace Tool displays the time range for the currentview below the VI Events view. Figure 3 shows the VI Events view of thetrace session for the example application from Figure 1.Figure 3. Example Application VI Events ViewThe left pane of the VI Events view lists the names of all VIs in memoryon the RT target when you captured the trace session. The number thatprecedes the VI name is the dataspace ID assigned to the VI by the real-timeoperating system. The dataspace ID identifies the memory dataspaceassigned to a VI. The Execution Trace Tool lists reentrant subVIs more thanonce with a different dataspace ID for each copy of the VI in memory,as shown with the Shared VI in Figure 3.The LabVIEW Execution Trace Tool draws the events for each VI directlyto the right of the VI name with respect to time. You can click on a VI nameand drag it up or down in the list to rearrange the order of events in the VIEvents view. The LabVIEW Execution Trace Tool redraws the VI Eventsview to show the new order.You can use the tools in the LabVIEW Execution Trace Tool palette todisplay a specific region of the trace session. Figure 4 shows a zoomedregion of the trace session shown in Figure 3.Figure 4.Zoomed View of the VI Events View© National Instruments Corporation 7LabVIEW Execution Trace Toolkit User GuideThe zoomed region starts with the execution of the TimeCriticalLoop VIfrom Figure 5. The VI Events view shows that the TimeCriticalLoop VIlaunches three VIs that generate waveforms. The TimeCriticalLoop VI thenlaunches three copies of the reentrant Shared VI, one after another.Figure 5. TimeCriticalLoop VI Block DiagramThe TimeCriticalLoop VI sends the three waveforms to theNormalLoop VI, shown in Figure 6, using global variables. TheTimeCriticalLoop VI then sleeps, allowing other VIs to execute.Figure 6.NormalLoop VI Block DiagramLabVIEW Execution Trace Toolkit User Guide Note The LabVIEW Execution Trace Tool lists the VI names of global variables in the left pane of the VI Events view but does not draw events for the variables.Viewing and Analyzing Thread EventsThe LabVIEW Execution Trace Tool displays thread event data in theThread Events view. The Thread Events view shows the execution ofthreads in the real-time operating system of the RT target. The left pane ofthe Thread Events view lists the thread names preceded by a dataspace ID.The LabVIEW Execution Trace Tool shows the name of the executionsystem where a thread runs in brackets for all LabVIEW threads.The LabVIEW Execution Trace Tool displays thread events in differentcolors to distinguish the execution priority of each thread. Table 1 lists thecolors associated with each LabVIEW priority. The priority of threadevents matches the priority of VI events of the same color. Figure 7 showsa section of the example trace session.Figure 7.Thread Events ViewThe TimeCriticalLoop VI and the AboveNormalLoop VI appear to executeat the same time at about 206 ms. However, the Thread Events view showsa thread executed during this time running at a priority that matches thepriority of the AboveNormalLoop VI.The TimeCriticalLoop VI attempted to send a waveform to theNormalLoop VI using a global variable. The above normal priority threadrunning the AboveNormalLoop VI blocked the time-critical priority threadthat was executing the TimeCriticalLoop VI from accessing the globalvariable. This example illustrates how resource contention causesunexpected timing behavior. The real-time operating system allowed alower priority thread to block the time-critical thread in order to release theresource. Refer to the LabVIEW Real-Time Module User Manual forinformation about shared resources and resource contention. Logging Analysis and Custom EventsThe LabVIEW Execution Trace Tool can show when events such as sleepspans, memory manager calls, and resource mutexes occur in anapplication. You also can create custom events that you can log in a tracesession to show the execution of specific sections of an application.VI when you start the trace session to display analysis and custom events. Refer to theCapturing a Trace Session section for information about enabling detailed tracing whenstarting a trace session.Displaying Analysis EventsThe LabVIEW Execution Trace Tool can show the occurrence of specificanalysis events in the trace session of an application. Select the analysisevents you want to view from the Analysis menu of the LabVIEWExecution Trace Tool. The LabVIEW Execution Trace Tool displays a flagfollowed by a dashed line in the Thread Events view to indicate the timerange for the occurrence of the analysis event. You can show the followinganalysis events:•Sleep Span—Occurs when a thread sleeps to allow lower prioritythreads to execute. The LabVIEW Execution Trace Tool displaysSleep Span events using a blue flag.•WaitFor(*)Object Span—Occurs when a thread must wait for access toa low-level resource before executing. The LabVIEW Execution TraceTool displays WaitFor(*)Object Span events using a red flag.•WaitForMem Span—Occurs when a thread conducts any memorymanagement operation. The LabVIEW Execution Trace Tool displaysWaitForMem Span events using a green flag.© National Instruments Corporation9LabVIEW Execution Trace Toolkit User GuideFigure8 shows a Sleep Span event that begins in an unnamed threadrunning at normal priority. The unnamed thread sleeps and other threadsexecute during the Sleep Span event. The unnamed thread continues toexecute when the Sleep Span event ends.Figure 8. Analysis Event FlagLogging and Displaying Custom EventsThe LabVIEW Execution Trace Tool also can display custom user events.Select Analysis»Custom Event Flags to open the Customize Event Flagsdialog box. Use the Customize Events Flags dialog box to create a customevent flag. You must assign a color and event code for the custom eventflag. You can use any number from 0 to 255 to differentiate differentcustom events by event codes.Use the TraceTool Log User Event VI to log a custom event in the tracesession.The Event ID input of the TraceTool Log User Event VI mustcontain the event code of a custom event flag that you create in theCustomize Events Flags dialog box.Figure9 shows the block diagram of the AboveNormalLoop VI from theexample application with the TraceTool Log User Event VI added. TheEvent ID input receives the event code of 17. The trace session logs anyoccurrence of this custom event. You then can create a custom event flag inthe LabVIEW Execution Trace Tool with an event code of 17 to display theoccurrences of the custom event in the Thread Events view.LabVIEW Execution Trace Toolkit User © National Instruments Corporation 11LabVIEW Execution Trace Toolkit User GuideFigure 9. Logging Custom User Events in the AboveNormalLoop VIFigure 10 shows a custom event logged in the AboveNormalLoop VI. The AboveNormalLoop VI executed in a LabVIEW thread running at normal priority and assigned to the Standard execution system. The custom event flag shows the exact time when the TraceTool Log User Event VI executes in the application.Figure 10. Custom Event FlagRefer to the LabVIEW Execution Trace Toolkit Help for more information about how to create a custom event using the LabVIEW Execution Trace Tool.Working with Trace SessionsYou can print the current trace session from the LabVIEW Execution Trace Tool. You also can save a trace session and then load the session in the LabVIEW Execution Trace Tool at a later time.Printing Trace SessionsYou can print the current view of a trace session by selecting File»Print Window from the LabVIEW Execution Trace Tool. You can print the entire trace session, or you can print a specific range of the trace session by using the zoom tools to display the range before printing. Refer to the Viewing Trace Sessions section for information about using the tools on the LabVIEW Execution Trace Tool palette to display specific ranges of atrace session.323738A-01Apr04*323738A-01*Saving Trace SessionsAfter the LabVIEW Execution Trace Tool receives a trace session from the RT target, you can save the trace session on the host computer. Select File»Save Session to save the trace session to file. You can load the trace session into the LabVIEW Execution Trace Tool at a later time.Select File»Close Session to close a trace session. You must save the trace session before closing if you want to load the session into the LabVIEW Execution Trace Tool at a later time.Loading Trace SessionsYou can load saved trace sessions into the LabVIEW Execution Trace Tool by selecting File»Open Session . If you have more than one trace session open in the LabVIEW Execution Trace Tool, use the pull-down list at the top of the window to choose the trace session you want to view.TroubleshootingRefer to the Troubleshooting topic of the LabVIEW Execution Trace Toolkit Help , available by clicking the Troubleshooting button on the LabVIEW Execution Trace Tool palette, for answers to common questions you might have when using the LabVIEW Execution Trace Tool.Where to Go from HereThe LabVIEW Execution Trace Toolkit provides example VIs that you can explore to learn more about using the LabVIEW Execution Trace Tool and the Execution Trace Tool VIs to analyze LabVIEW applications.You can access the LabVIEW Execution Trace Toolkit examples by selecting Help»Find Examplesin LabVIEW.。
labview 教程
labview 教程LabVIEW教程:LabVIEW概述:LabVIEW是一种图形化编程语言和集成开发环境,一般用于数据采集、仪器控制、实时控制和模拟等工程应用。
它采用了数据流编程的方式,使用图形化的块状图形表示程序的结构,使得用户可以通过拖拽和连接各个图形块来实现程序的编写。
LabVIEW还提供了丰富的工具箱和函数库,可以轻松地进行信号处理、图像处理、控制算法实现等操作。
入门:1. 下载和安装LabVIEW软件2. 打开LabVIEW,并了解主界面的各个部分3. 创建一个新的LabVIEW项目LabVIEW界面与工具栏:1. 界面的各个部分介绍:前面板、块图、工具栏等2. 前面板的控件和指示器:按钮、开关、滑动条、数字显示等3. 块图的基本元素:数据线、函数、结构等4. 工具栏的常用功能介绍:保存、运行、调试等数据流编程:1. 数据流的概念和基本原理2. 如何在LabVIEW中实现数据流编程3. 数据流编程的优点和应用场景信号处理与数据分析:1. 在LabVIEW中进行数字信号处理的基本方法和工具2. 如何进行滤波、谱分析等常见信号处理操作3. 数据分析的方法和工具:统计分析、曲线拟合等仪器控制与数据采集:1. 如何使用LabVIEW控制外部仪器和设备2. 仪器通信的基本原理和常用接口:Serial、GPIB等3. 数据采集的方法和工具:传感器连接、数据存储等LabVIEW的高级功能:1. LabVIEW中的事件驱动编程方法和应用2. 多线程编程和并行计算的方法和工具3. LabVIEW中的高级图形显示和用户界面设计方法总结:LabVIEW是一个功能强大且易于学习和使用的图形化编程工具,适用于各种工程应用。
通过本教程的学习,你将能够掌握LabVIEW的基本操作和常用功能,为实际工程项目的开发和应用奠定基础。
祝你在LabVIEW的学习和实践中取得成功!。
LabVIEW常用工具包
(3) 放入Word Easy Text.vi,该VI可以在Word Specific目录下找到,使用本VI即可以将所需内容 添加至Word报表中。在本例中,需要将报表日期插入当前报表,则需要将报表日期字符串连接 至“text”端。另外,使用本VI还可以设置报表的字体、背景颜色以及对齐方式等等;
(4) 使用报表保存至文件.vi将报表保存为.doc格式。本例中将报表命名为IEI Report.doc保存在C 盘根目录下;
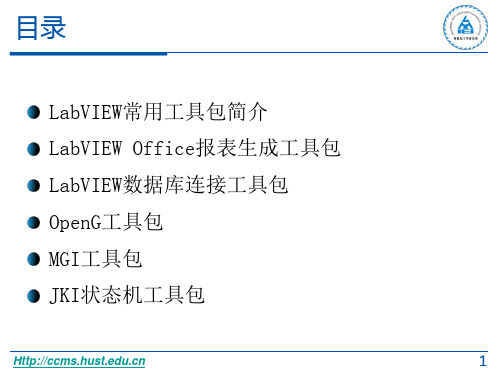
目录
LabVIEW常用工具包简介 LabVIEW Office报表生成工具包 LabVIEW数据库连接工具包 OpenG工具包 MGI工具包 JKI状态机工具包
1
LabVIEW常用工具包简介
工具包:具有专用功能的LabVIEW插件
NI官方工具包:
• LabVIEW OFFICE报表生成工具包 • LabVIEW 数据库连接工具包 • ……
第三方工具包:
• VI Package Manager • MGI工具包 • ……
2
LabVIEW Office报表生成工具包
函数→编程→报表生成
基础性的报 表生成VI
插入VI说明信 息及打印相关
VI
基于模板的 报表生成VI
WORD与EXCEL 相关操作VI
(3) 放入Excel Easy Text.vi,该VI可以在Excel Specific目录下找到,使用本 VI即可以告诉报表工具包在Excel的哪个位置放置上什么内容。在本例中,假设要在 Excel文件的A2单元格内放入“报告时间”这个字符串,则需要设定“name”值为 “A2”,“text”值为“报告时间”。另外,使用本VI还可以设置报表的字体以及 边框等等;
LabVIEW常用工具
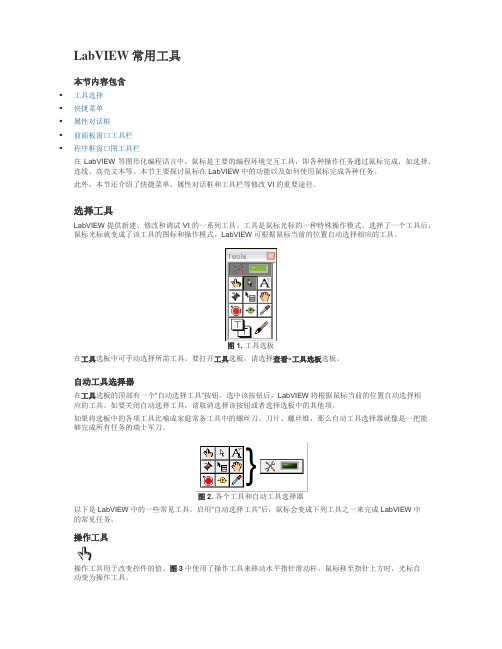
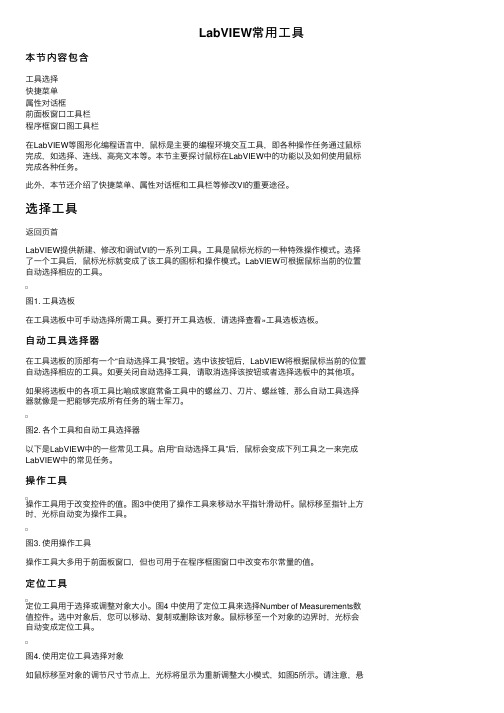
LabVIEW常用工具本节内容包含▪工具选择▪快捷菜单▪属性对话框▪前面板窗口工具栏▪程序框窗口图工具栏在LabVIEW等图形化编程语言中,鼠标是主要的编程环境交互工具,即各种操作任务通过鼠标完成,如选择、连线、高亮文本等。
本节主要探讨鼠标在LabVIEW中的功能以及如何使用鼠标完成各种任务。
此外,本节还介绍了快捷菜单、属性对话框和工具栏等修改VI的重要途径。
选择工具LabVIEW提供新建、修改和调试VI的一系列工具。
工具是鼠标光标的一种特殊操作模式。
选择了一个工具后,鼠标光标就变成了该工具的图标和操作模式。
LabVIEW可根据鼠标当前的位置自动选择相应的工具。
图1. 工具选板在工具选板中可手动选择所需工具。
要打开工具选板,请选择查看»工具选板选板。
自动工具选择器在工具选板的顶部有一个“自动选择工具”按钮。
选中该按钮后,LabVIEW将根据鼠标当前的位置自动选择相应的工具。
如要关闭自动选择工具,请取消选择该按钮或者选择选板中的其他项。
如果将选板中的各项工具比喻成家庭常备工具中的螺丝刀、刀片、螺丝锥,那么自动工具选择器就像是一把能够完成所有任务的瑞士军刀。
图2. 各个工具和自动工具选择器以下是LabVIEW中的一些常见工具。
启用“自动选择工具”后,鼠标会变成下列工具之一来完成LabVIEW中的常见任务。
操作工具操作工具用于改变控件的值。
图3中使用了操作工具来移动水平指针滑动杆。
鼠标移至指针上方时,光标自动变为操作工具。
图3. 使用操作工具操作工具大多用于前面板窗口,但也可用于在程序框图窗口中改变布尔常量的值。
定位工具定位工具用于选择或调整对象大小。
图4中使用了定位工具来选择Number of Measurements数值控件。
选中对象后,您可以移动、复制或删除该对象。
鼠标移至一个对象的边界时,光标会自动变成定位工具。
图4. 使用定位工具选择对象如鼠标移至对象的调节尺寸节点上,光标将显示为重新调整大小模式,如图5所示。
LabVIEW实用工具详解简版

❶畅销书的升级力作❷起底1000多个私房工具和源码文件❸10年LabVIEW资深工程经验❹全实例的讲解,学了就能用于具体项目II内容简介作为在一线摸爬滚打几十年的工程师,我们遇到过千千万万具体的问题,这些问题的解决往往具有一定的通用性,能够帮助读者解决很多问题,因此我们就有了出版这本《LabVIEW实用工具详解》的想法。
我们在本书中创建了大量的LabVIEW实用工具,并从读者非常熟悉的具体问题出发,说明了解决这些具体问题的方法。
这些实用工具包括数列工具、常用几何工具,等等。
在这个基础上,我们针对电子、测试测量以及工业自动化专业创建了大量的相关工具,比如寄存器、触发器、比较器、定时器、计数器,等等。
这些工具的实现原理,与相关的硬件基本原理是非常相似的,而且只要稍作修改就能应用到具体的工作、科研场景中。
本书中创建了多种常用的复杂数据结构工具,这些内容对于非计算机专业的工程技术人员来说,实现起来比较困难,但在实际编程中,又经常会遇到。
本书精心封装了这些常用的数据结构,读者可以直接在项目中使用。
本书针对LabVIEW工程技术人员详细介绍了各种界面布局技术以及常用的程序设计模式和框架,相信读者会找到适合自己实际需要的模式,不断提高解决具体问题的能力。
前言前言近年来,学习和使用LabVIEW的工程技术人员越来越多。
同时许多大专院校把LabVIEW列入了专业课内容,很多学生毕业设计的选题是与LabVIEW密切相关的。
自从《LabVIEW宝典》(ISBN:9787121129612)一书出版后,笔者经常与宝典读者相互交流。
在交流的过程中了解到LabVIEW虽然入门比较容易,但是遇到实际问题时,解决起来依然非常困难。
原因在于LabVIEW 的学习者大多不具有实际编程经验,往往把LabVIEW作为一种应用软件,而忽视了LabVIEW是一种成熟的编程语言这一特点。
本书是笔者自《LabVIEW宝典》之后,推出的第二本有关LabVIEW的专业书籍。
LabVIEW常用工具包
LabVIEW常用工具包介绍LabVIEW是一款流行的图形化编程语言和开发环境,用于控制、测量和数据采集等科学和工程应用。
LabVIEW拥有丰富的功能模块和工具包,可以极大地提高开发效率和精度。
本文将介绍一些常用的LabVIEW工具包,帮助开发人员更好地使用LabVIEW进行工程开发。
1. MathScript工具包MathScript工具包是在LabVIEW中进行数学和信号处理的工具包。
它提供了一整套数学和信号处理函数,包括基本的数学运算、线性代数、傅里叶变换、滤波器等。
使用MathScript工具包,开发人员可以在LabVIEW中直接编写MATLAB脚本,并与LabVIEW图形化编程进行无缝集成。
2. 数据显示和分析工具包数据显示和分析工具包是LabVIEW中一个常用的工具包,用于数据可视化和分析。
它包含了各种显示控件和分析函数,可以方便地将数据以图形的方式展示出来,并进行数据处理和分析。
例如,开发人员可以使用这个工具包绘制曲线图、直方图、饼图等,并对数据进行平滑、滤波、插值等处理。
3. 传感器和仪器工具包传感器和仪器工具包是用于与各类传感器和仪器进行交互的工具包。
它提供了各种常见的传感器和仪器的驱动程序和通信接口,方便开发人员进行数据采集和控制。
例如,通过这个工具包,可以轻松地与温度传感器、压力传感器、光传感器等进行通信,并实时获取数据和控制设备。
4. 数据库连接工具包数据库连接工具包是用于与数据库进行连接和操作的工具包。
LabVIEW支持与常用的数据库如MySQL、Oracle、SQLite等进行交互,通过这个工具包,开发人员可以轻松地进行数据库的查询、读写和更新操作。
这对于需要与数据库进行数据交互的应用程序非常有用,例如监测系统、数据采集系统等。
5. 通信和网络工具包通信和网络工具包是用于与外部设备进行通信和网络操作的工具包。
LabVIEW支持各种通信协议和网络协议,如TCP/IP、UDP、串口通信等。
LabVIEW常用工具
LabVIEW常⽤⼯具本节内容包含⼯具选择快捷菜单属性对话框前⾯板窗⼝⼯具栏程序框窗⼝图⼯具栏在LabVIEW等图形化编程语⾔中,⿏标是主要的编程环境交互⼯具,即各种操作任务通过⿏标完成,如选择、连线、⾼亮⽂本等。
本节主要探讨⿏标在LabVIEW中的功能以及如何使⽤⿏标完成各种任务。
此外,本节还介绍了快捷菜单、属性对话框和⼯具栏等修改VI的重要途径。
选择⼯具返回页⾸LabVIEW提供新建、修改和调试VI的⼀系列⼯具。
⼯具是⿏标光标的⼀种特殊操作模式。
选择了⼀个⼯具后,⿏标光标就变成了该⼯具的图标和操作模式。
LabVIEW可根据⿏标当前的位置⾃动选择相应的⼯具。
图1. ⼯具选板在⼯具选板中可⼿动选择所需⼯具。
要打开⼯具选板,请选择查看»⼯具选板选板。
⾃动⼯具选择器在⼯具选板的顶部有⼀个“⾃动选择⼯具”按钮。
选中该按钮后,LabVIEW将根据⿏标当前的位置⾃动选择相应的⼯具。
如要关闭⾃动选择⼯具,请取消选择该按钮或者选择选板中的其他项。
如果将选板中的各项⼯具⽐喻成家庭常备⼯具中的螺丝⼑、⼑⽚、螺丝锥,那么⾃动⼯具选择器就像是⼀把能够完成所有任务的瑞⼠军⼑。
图2. 各个⼯具和⾃动⼯具选择器以下是LabVIEW中的⼀些常见⼯具。
启⽤“⾃动选择⼯具”后,⿏标会变成下列⼯具之⼀来完成LabVIEW中的常见任务。
操作⼯具操作⼯具⽤于改变控件的值。
图3中使⽤了操作⼯具来移动⽔平指针滑动杆。
⿏标移⾄指针上⽅时,光标⾃动变为操作⼯具。
图3. 使⽤操作⼯具操作⼯具⼤多⽤于前⾯板窗⼝,但也可⽤于在程序框图窗⼝中改变布尔常量的值。
定位⼯具定位⼯具⽤于选择或调整对象⼤⼩。
图4 中使⽤了定位⼯具来选择Number of Measurements数值控件。
选中对象后,您可以移动、复制或删除该对象。
⿏标移⾄⼀个对象的边界时,光标会⾃动变成定位⼯具。
图4. 使⽤定位⼯具选择对象如⿏标移⾄对象的调节尺⼨节点上,光标将显⽰为重新调整⼤⼩模式,如图5所⽰。
- 1、下载文档前请自行甄别文档内容的完整性,平台不提供额外的编辑、内容补充、找答案等附加服务。
- 2、"仅部分预览"的文档,不可在线预览部分如存在完整性等问题,可反馈申请退款(可完整预览的文档不适用该条件!)。
- 3、如文档侵犯您的权益,请联系客服反馈,我们会尽快为您处理(人工客服工作时间:9:00-18:30)。
18
创建数据表
创建数据表是由LabVIEW数据库连接工具包中的DB Tools Create Table.vi来实现的。 首先使用DB Tools Open Connection.vi来打开数据库连接,连接文件使用前面创建的 IEI_Measurements.udl 文件;之后使用 DB Tools Create Table.vi来建立新的数据表 格,表格的名称设定为“ Device ”,其中包含 4 个字段,分别为“ DeviceName ”、 “DeviceType”、“DeviceID”和“Company”。
(4) 将 该 工 作 簿 保 存 为 Excel972003 模版的格式保存。本例中命 名为Excel template.xlt保存在C 盘根目录下。
8
基于模板的报表生成方式
2.使用交互式VI编程 MS Office Report.vi就会自动 添加两个变体数据类型的输入端, 名字分别为“ReportTitle”和 “ReportTime”,即为创建 Excel模版时定义好的名字。之 后可以通过分别为这两个输入端 赋值来生成所需要的报表。
3
LabVIEW Office报表生成工具包
函数→编程→报表生成
基础性的报 表生成VI 插入VI说明信 息及打印相关 VI
基于模板的 报表生成VI
WORD与 EXCEL相关 操作VI
4
EXCEL报表生成
要准确迅速的进行报表生 成工作需要进行两个主要 两个步骤“Where” 和”What”,即告诉报表 生成工具包,在Office文 档的“哪个位置”,放置 上“什么内容”。
17
LabVIEW数据库基本操作
数据库操作遵循“打开数据库→操作数据库→关闭数据库” 的基本流程。其中,使用 DB Tools Open Connection.vi 来打开数据库连接,使用DB Tools Close Connection.vi 关闭数据库连接。在“操作数据库”步骤中可以对数据库 进行所需的操作。
6
Word报表生成
Word报表的生成方式和Excel报表类似。该例程的编写步骤如下: (1) 使用新建报表 .vi 进行报表建立,报表类型选择为“Word ”,同时为了使程序运行时不会弹出 Excel软件窗口,窗口状态选项要选择为“minimized”; (2) 放入Word Easy Title.vi,该VI可以在Word Specific目录下找到,使用本VI可以给给当前Word 报表设置标题。在本例中,将报表标题设置为“IEI系统测试报告”,另外,使用本VI还可以设 置标题的字体等等; (3) 放入Word Easy Text.vi,该VI可以在Word Specific目录下找到,使用本VI即可以将所需内容 添加至Word报表中。在本例中,需要将报表日期插入当前报表,则需要将报表日期字符串连接 至“text”端。另外,使用本VI还可以设置报表的字体、背景颜色以及对齐方式等等; (4) 使用报表保存至文件.vi将报表保存为.doc格式。本例中将报表命名为 IEI Report.doc保存在C 盘根目录下; (5) 使用处置报表.vi关闭报表文件,释放资源。
20
添加数据记录
添加数据记录可以由 LabVIEW 数据库连接工具包中的 DB Tools Insert Data.vi 实现。 DB Tools Insert Data.vi 需要3个主要的参数:“table”参数确定将要插入的表格 名称;“data”参数确定将要插入的数据;“columns” 参 数 对 应 插 入 列 的 名 称 , 可 以 先 使 用 DB Tools List Columns.vi列出表格中列的名称,可以省去手动输入列名 的麻烦,以方便下一步的数据插入。
19
删除数据表
删除数据表格的过程与创建表格的过程类似,使用 DB Tools Drop Table.vi 实现。假设要删除前面建立好的表 格,只需要在DB Tools Drop Table.vi中指明要删除的表 格名称即可。另外,创建表格和删除表格的参数非常类似, 在实际工程应用中,一般将二者编写为同一个VI,在其中 实现表格的创建和删除操作。
13
LabVIEW数据库连接工具包
在使用LabVIEW数据库连接工具包操作数据 库之前,需要先连接数据库,这就像操作 文件之前,先要打开文件一样。连接数据 库主要有以下两种方式,分别为使用DSN连 接数据库和使用udl文件连接数据库。
14
使用DSN连接数据库
LabVIEW 数 据 库 连 接 工 具 包 基 于 ODBC ( Open Database Connectivity ) 技 术。在使用该工具包的时候,需要提 供数据源名 DSN ( Data Source Names ) 才能连接到数据库,所以需要先创建 DSN 。在 Windows 控制面板→管理工具 →数据源( ODBC )中打开数据源管理 器,在“用户DSN”选项卡中单击“添 加”按钮,选择“ SQL Server ”驱动, 输入用户名和密码后,点击“测试数 据源”,如果配置正确的话,就会弹 出“测试成功的提示”,本例中的DSN 配置如图所示。完成以上步骤后,就 可 以 在 “用 户 DSN ” 中看到新建立的 DSN了。
9
报表生成例程
10
报表生成例程
该例程遵循“打开→操作→保存→关闭”的文件编程模式。首先使用新建报 表.vi建立Excel报表;后使用Excel Easy Title.vi设置报表标题为“IEI测 试报告”,同时将标题字体设置为“微软雅黑”,字号设置为24号;接下来 使用Excel Easy Text.vi插入报告概述,同时将报告概述的字体设置为“宋 体”,字号设置为 12 号;下一步使用 Excel Easy Table.vi 将表格插入到 Excel报表中,字体和字号依前设置;接下来使用 Excel Easy Graph.vi将波 形图插入到Excel报表中;最后设置好报表的保存路径,保存完毕后使用处置 报表.vi关闭报表,释放资源。
2
LabVIEW常用工具包简介
工具包:具有专用功能的LabVIEW插件
NI官方工具包:
• • • • • •
LabVIEW OFFICE报表生成工具包 LabVIEW 数据库连接工具包 „„
第三方工具包:
VI Package Manager MGI工具包 „„
5
EXCEL报表生成
该例程的编写步骤如下: (1) 使用新建报表.vi进行报表建立,报表类型选择为“Excel”,同时为了使程 序运行时不会弹出Excel软件窗口,窗口状态选项要选择为“minimized”; (2) 放入Excel Easy Title.vi,该VI可以在Excel Specific目录下找到,使用本 VI可以给当前报表设置标题。在本例中,将报表标题设置为“IEI系统测试报告”, 标题位置为A1单元格,则需要设定“name”值为“A1”,“title”值为“IEI系统 测试报告”。另外,使用本VI还可以设置标题的字体等等; (3) 放入Excel Easy Text.vi,该 VI 可以在 Excel Specific 目录下找到,使用本 VI即可以告诉报表工具包在Excel的哪个位置放置上什么内容。在本例中,假设要在 Excel 文件的 A2 单元格内放入“报告时间”这个字符串,则需要设定“ name ”值为 “A2”,“text”值为“报告时间”。另外,使用本VI还可以设置报表的字体以及 边框等等; (4) 使用报表保存至文件 .vi 将报表保存为 .xls 格式。本例中将报表命名为 IEI Report.xls保存在C盘根目录下; (5) 使用处置报表.VI关闭报表文件,释放资源。
15
使用udl文件连接数据库
Microsoft 公司设计的 ODBC 标准只能访问 关系型数据库,对非关系型数据库则无能 为力。为了解决这个问题, Microsoft 公 司另外提供了一种技术: Active数据对象 ADO ( Active Data Objects )技术。 ADO 使用通用数据连接 UDL ( Universal Data Link)来获得数据库信息以实线数据库连 接。 udl 文件的创建方法非常简单,可以 在任意文件夹下建立一个文本文件,然后 将其后缀名改为 udl 即可,本例中将此文 件命名为 IEI_Measurements.udl ,双击打 开 udl 文件进行配置,在“提供程序”选 项 卡 中 选 择 “ Microsfot OLE DB Provider for SQL Server ” , 然 后 在 “连接”选项卡中设置好数据库服务器的 相关信息,点击“测试连接”按钮,如果 配置没有问题,则会提示“测试连接成 功”,至此udl文件配置完成。
11
LabVIEW数据库连接工具包
数据库分类:关系型数据库;非关系型数据库 著名的商业用数据库管理系统有MS SQL Server、 Orace、DB2、Visual Foxpro、Microsoft Access 等等。另外,开源的数据库管理系统有MySQL、 Apache Derby、PostgreSQL、Ingres等等。MS SQL Server是Microsoft公司开发的商用数据库管理系 统,在工业测试应用中非常流行,安装和使用都非 常方便,并且支持SQL语言,所以本节基于MS SQL Server 2005为例介绍数据库连接工具包的操作方 式。
7
基于模板的报表生成方式
1.建立模板
(1) 打开Microsoft Excel程序,新 建空白工作簿;
(2) 将 A1 单 元 格 的 名 称 改 为 “ReportTitle”; (3) 将 A2 单 元 格 的 名 称 改 为 “ReportTime”;
12