304不锈钢探伤方法
304不锈钢最简单检测方法
304不锈钢最简单检测方法
304不锈钢的简单检测方法主要包括以下几种:
1. 观察法:优质的不锈钢材料表面光亮,无明显锈迹和斑点,且含有纹理。
2. 磁铁检测法:由于304不锈钢是非磁性的,所以可以用磁铁来检测。
如
果材料被磁铁吸引,说明它不是304不锈钢。
3. 药水检测法:可以使用不锈钢检测液来进行检测。
根据药水的颜色变化,可以判断材料是否为304不锈钢。
4. 磨擦火花鉴别法:用高速旋转的砂轮机磨擦材料表面,观察产生的火花。
由于摩擦高温作用,各种元素微粒氧化时产生的火花数量、形状分叉等不同,可以鉴别材料化学成分和大致含量。
5. 硬度检测法:304不锈钢具有较高的硬度和韧性,可以通过硬度计进行检测。
6. 化学分析法:通过化学实验的方法,对不锈钢的成分进行分析,确定是否符合304不锈钢的标准。
以上方法仅供参考,建议在专业人士的指导下合理选择并使用上述工具。
检测304最科学的方法

检测304最科学的方法
在进行304不锈钢的科学检测时,我们需要采用一系列严谨的方法来确保检测
结果的准确性和可靠性。
下面,我将介绍一些最科学的方法,希望能够对您有所帮助。
首先,我们需要进行视觉检测。
通过肉眼观察304不锈钢的表面,可以初步判
断其表面是否存在明显的凹陷、裂纹或氧化现象。
这对于初步排除一些明显的质量问题非常有帮助。
其次,我们需要进行化学成分分析。
通过对304不锈钢样品进行化学成分的分析,可以确定其主要成分的含量,如铬、镍、锰等元素的含量是否符合标准要求。
这一步骤需要借助化学分析仪器,如光谱仪、电子探针等设备来进行分析。
接着,我们需要进行金相组织分析。
金相组织分析是通过对304不锈钢样品进
行金相显微镜观察和分析,来确定其晶粒大小、晶界清晰度、相组成等情况。
这一步骤可以帮助我们了解304不锈钢的组织结构是否符合标准要求。
另外,我们还需要进行力学性能测试。
通过对304不锈钢样品进行拉伸、弯曲、冲击等力学性能测试,可以得到其抗拉强度、屈服强度、延伸率等重要参数,从而评估其力学性能是否符合要求。
最后,我们需要进行腐蚀性能测试。
304不锈钢通常用于耐腐蚀的环境中,因
此腐蚀性能的测试非常重要。
可以通过盐雾试验、电化学极化曲线等方法来评估304不锈钢的耐腐蚀性能。
综上所述,通过视觉检测、化学成分分析、金相组织分析、力学性能测试和腐
蚀性能测试等一系列科学方法的综合应用,我们可以全面、准确地评估304不锈钢的质量和性能。
希望以上介绍的方法能够对您在304不锈钢检测工作中有所帮助。
检测不锈钢的方法
检测不锈钢的方法检测不锈钢的方法不锈钢是一种耐腐蚀的合金材料,它的主要成分是铁、铬、镍等元素。
不锈钢具有优越的耐腐蚀性和高温性能,因此在许多领域广泛应用。
检测不锈钢的质量,主要是为了保证其性能的可靠性、减少因质量问题产生的损失。
本文将介绍不锈钢的检测方法,包括通用的检测方法和针对不同类型不锈钢的专用检测方法。
一、不锈钢的通用检测方法1.外观检查外观检查是最常用的检测方法之一。
通过肉眼或显微镜检查表面是否有划痕、凹陷、氧化皮和烧结痕迹等表面缺陷,同时也要查看其表面是否均匀、光洁度是否符合要求。
2.磁性检测磁性检测可以判断不锈钢的物理性能,即是否为铁磁性或非铁磁性。
一般来说,304不锈钢为非铁磁性,而410不锈钢为铁磁性。
利用这一性质,可以用磁铁或手动磁检仪检测不锈钢是否符合要求。
3.化学分析化学分析是检测不锈钢的重要方法之一,通过分析其成分来判断不锈钢是否符合要求。
目前常用的化学分析方法主要有电感耦合等离子体质谱仪、原子吸收光谱法、感应耦合等离子体发射光谱法等。
4.厚度测量检测不锈钢的厚度也是一种通用方法,可以用万能卡尺、超声波测厚仪等工具来进行测量,主要用于管道、板材等大型工件的测量。
二、不锈钢的专用检测方法1.钼钢检测方法钼钢是一种含钼量高于4%的不锈钢,其使用范围较主流不锈钢更为广泛。
由于其成分中含有大量的钼元素,也使其更难以检测和加工。
下面将介绍钼钢的检测方法。
(1)X射线探伤钼钢在制造过程中容易产生缺陷,在使用中也容易出现裂纹、爆炸等问题,因此需要对其进行X射线探伤。
这种方法可以检测出钢材内部的脆性损伤、气孔和杂质等,确保其质量和使用安全。
(2)磁粉探伤钼钢中含有较多的钼元素,使其磁性较差,磁粉检测被广泛应用于钼钢的检测中。
磁粉检测方法简单,操作方便,能够有效地检测出钢材表面和内部的裂纹、夹杂和气孔等缺陷。
2.双相不锈钢检测方法双相不锈钢由铁素体和奥氏体两种组织组成,具有极高的强度和耐腐蚀性能。
不锈钢304检测报告

不锈钢304检测报告客户信息:客户名称:XXX公司客户地址:XXX城市XXX区XXX路XXX号产品信息:产品名称:不锈钢304材料产品批号:XXX检测标准:GB/T 3280-2015《不锈钢冷轧钢板和钢带》GB/T 4356-2016《金属材料透射电子显微镜探伤方法》检测结果:本次检测共涉及5个检测项目,检测结果如下:1. 成分检测根据GB/T 3280-2015的规定,采用X射线荧光光谱分析仪对不锈钢304材料的主要成分进行了检测。
检测结果表明,不锈钢304材料的成分符合标准要求,无异常情况。
2. 薄片厚度检测根据GB/T 3280-2015的规定,采用数字式薄片厚度计对不锈钢304材料的厚度进行了检测。
检测结果表明,不锈钢304材料的厚度符合标准要求,无异常情况。
3. 表面质量检测根据GB/T 3280-2015的规定,采用金相显微镜对不锈钢304材料的表面质量进行了检测。
检测结果表明,不锈钢304材料的表面质量符合标准要求,无异常情况。
4. 显微组织检测根据GB/T 3280-2015的规定,采用金相显微镜对不锈钢304材料的显微组织进行了检测。
检测结果表明,不锈钢304材料的显微组织符合标准要求,无异常情况。
5. 翘曲度检测根据GB/T 3280-2015的规定,采用数字式薄片厚度计对不锈钢304材料的翘曲度进行了检测。
检测结果表明,不锈钢304材料的翘曲度符合标准要求,无异常情况。
综上所述,经过本次检测,不锈钢304材料符合相关标准要求,客户可以放心使用。
检测人员签名:XXX检测时间:XXXX年XX月XX日。
不锈钢棒探伤

不锈钢棒探伤的方法有很多种,我们可以针对不同情况,选择具体的检测方法。
这些方法有优点,也有局限性,如果想要选择更正确、更合适的方法,需要我们对每一种方法都很了解。
下文将针对每种说法展开说明,希望对您有所帮助。
1、渗透探伤(PT)采用带有荧光染料(荧光法)或红色染料(着色法)的渗透剂的渗透作用,来显示焊接接头表面微小缺陷的无损检验法。
检测时要求被测表面平整光洁。
此方法分为荧光探伤和着色探伤,其中荧光探伤的测量精度较高,可达10μm。
焊接构件表面检查常用着色法渗透探伤。
2、磁粉探伤(MT)利用在强磁场中,铁磁材料表层缺陷产生的漏磁场吸附磁粉的现象而进行的无损检验方法。
在有缺陷处,由于漏磁的作用会集中吸附撒上的铁粉。
可根据吸附铁粉的形状、厚度和多少,来判断焊接缺陷的位置和大小。
该方法不适用无磁性的奥氏体型不锈钢。
3、射线探伤(RT)采用X射线或y射线照射焊接接头检查其内部缺陷的一种无损检验方法。
它能准确地显示出焊缝中焊接缺陷的种类、形状、尺寸、位置和分布情况。
评定标准按《钢熔化焊对接接头射线照相法和质量分级》(GB3329-87)进行。
该探伤方法长期操作,对操作者身体有一定的影响。
4、超声波探伤(UT)借助于超声波探伤仪来检测焊缝内部缺陷的一种无损探伤方法。
此法适用于探伤厚板,可确定5mm以内缺陷。
探伤周期短、成木低、设备简单,对操作者身体无害,但不能准确判断缺陷的性质。
5、涡流探伤(ET)涡流探伤是以电磁感应原理为基础,当钢管(指碳钢、合金钢和不锈钢)通过交流电的绕组时,钢管表面或近表面出现集肤效应,使其有缺陷部位的涡流发生变化,导致绕组的阻抗或感应电压产生变化,从而获得关于缺陷的信号。
从信号的幅值及相位等可以对缺陷进行判别,能有效地识别钢管内外表面的不连续性缺陷,如裂纹、未焊透、夹渣、气孔、点腐蚀等,对开放性线性缺陷较为敏感。
南京博克纳自动化系统有限公司总部位于美丽的中国古都南京,是国内专业研制无损检测仪器及设备的高科技企业。
304不锈钢验证方法
304不锈钢验证方法304不锈钢是一种非常常用的不锈钢材料,在我们的日常生活中经常能够看到其应用,如厨具、厨房用具、医疗器械等。
由于市面上的不锈钢品种繁多,质量也参差不齐,为了确保产品的质量和安全性,我们需要对不锈钢进行验证。
下面就针对304不锈钢材料的验证方法进行整体流程并详细描述。
一、外观检验外观检验是不锈钢材料验证的第一步,通过肉眼观察可以简单地判断不锈钢材料的表面是否均匀、光亮、无裂纹、褶皱、锈迹、气泡等缺陷,同时还需注意不锈钢的清洁度、平整度和规格等。
这一过程是非常简单的,只需要拿起需要检验的不锈钢材料,只需用肉眼观察,检验人员应该能够轻松地发现外观缺陷。
二、磁场测试下一步进行磁场测试。
由于304不锈钢近乎不对磁性有任何反应,因此磁性成为验证不锈钢材料的一种非常简便而又有效的方法。
验证的方法是使用磁棒在不锈钢材料表面滑动,如果磁棒被吸附了,则表明这个不锈钢材料是假的。
三、化学分析检验化学分析检验是确认不锈钢材料成分的标准化测试程序。
这种检验方法也可以被用在其他的合金物质上,但使用前,必须了解对于化学分析过程的正确操作步骤。
具体来说,化学分析检验包括三个部分:取样过程、样品熔融后的测定操作和计算分析。
取样过程能够从这个样品中取得一小部分用于测量和分析。
样品的熔融后的测定程序能够将样品化为液体,进行化学分析测量。
根据结果进行计算分析。
四、硫酸泡测试该测试在室温下进行,将硫酸倒在不锈钢板的表面,如果表面出现任何形状的腐蚀痕迹(包括不起泡的沾黄色痕迹),我们可以断定这种不锈钢材料是假的。
五、尺寸精度检测尺寸精度检测是通过测量不锈钢材料的长度、宽度、厚度等尺寸差异以判断不锈钢材料是否合格。
据了解,标准的304不锈钢板厚度一般为0.03mm-5.0mm,长度和宽度在各种类型的不锈钢材料上都有具体的要求。
对于304不锈钢的验证流程就是:外观检验->磁场测试->化学分析检验->硫酸泡测试->尺寸精度检测。
不锈钢304测试方法
不锈钢304测试方法
嘿,朋友们!今天咱就来讲讲不锈钢304 的测试方法,这可太重要啦!
比如说,你想知道你买的那个锅是不是真的不锈钢 304 材质,那下面
这些方法就能派上用场咯!
首先,有一种很简单的化学药水测试法。
就像医生给病人做检查一样,把药水滴在不锈钢上,看看它的反应。
哎呀,要是变色了,那可就得怀疑一下啦!比如你滴了药水,结果它变了色,那你心里会不会“咯噔”一下,心想:哎呀,不会买错了吧!
还有磁铁测试法,这就像找朋友一样,不锈钢 304 一般是不太会被磁
铁吸住的。
你拿个磁铁一试,如果一下子就吸住了,那你就得皱眉头啦,心里犯嘀咕:这真的是不锈钢 304 吗?
光谱分析法就比较高级啦,就好像用高科技放大镜去看不锈钢的本质!通过这个方法,能准确地知道里面的成分呢。
你想象一下,就像能看穿它的内心一样,厉害吧!
总之啊,这些测试方法都挺管用的。
咱可不能花了冤枉钱买个假的不锈钢 304 呀!所以,大家一定要记住这些测试方法哦!。
探伤方法、探伤标准及适用范围介绍
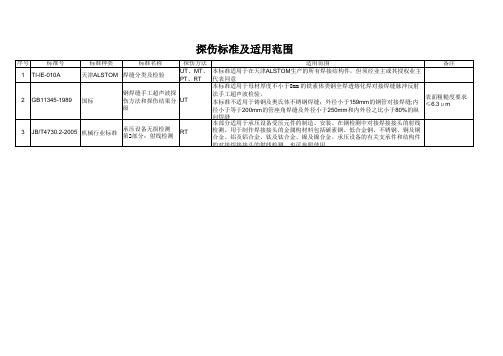
序号 1 探伤方法 适用范围 备注 UT、MT、 本标准适用于在天津ALSTOM生产的所有焊接结构件,但须经业主或其授权业主 TI-IE-010A 天津ALSTOM 焊缝分类及检验 PT、RT 代表同意 本标准适用于母材厚度不小于8mm 的铁素体类钢全焊透熔化焊对接焊缝脉冲反射 钢焊缝手工超声波探 法手工超声波检验, 表面粗糙度要求 GB11345-1989 国标 伤方法和探伤结果分 UT 本标准不适用于铸钢及奥氏体不锈钢焊缝;外径小于159mm的钢管对接焊缝;内 ≤6.3μ m 级 径小于等于200mm的管座角焊缝及外径小于250mm和内外径之比小于80%的纵 向焊缝 本部分适用于承压设备受压元件的制造、安装、在钢检测中对接焊接接头的射线 承压设备无损检测 检测。用于制作焊接接头的金属构材料包括碳素钢、低合金钢、不锈钢、铜及铜 JB/T4730.2-2005 机械行业标准 RT 第2部分:射线检测 合金、铝及铝合金、钛及钛合金、镍及镍合金。承压设备的有关支承件和结构件 的对接焊接接头的射线检测,也可参照使用 标准号 标准种类 标准名称
16 ASME第V卷
ASME
ASME锅炉及压力容器 UT、MT、 标准适用于检测材料、焊缝和加工零部件的表面和内在的瑕疵 无损检测 PT、RT
13 CCH70-3
水力机械铸钢件检验 规范
14 GB/T9443-2007
国标
铸钢件渗透探伤及缺 陷显示迹痕的评级方 法
15 GB/T9444-2007
国标
铸钢件磁粉探伤及质 量评级方法
PT:1级≤6.3μ m,2~5级≤12.5 MT:1 UT、MT、 本标准适用于铸钢件检验。PT探测表面开口型缺陷;MT探测表面及表面下的缺 μ m 级≤6.3μm,2~4 PT、RT 陷;UT、RT检测内部缺陷 级≤12.5μm ,5级 ≤25μ m UT:≤6.3μ m 001、01、1级表 面粗糙度要求≤ 本标准规定了铸钢件渗透探伤方法及缺陷显示迹痕的评级方法! PT 6.3μm,2、3级≤ 本标准适用于铸钢件表面开口缺陷的渗透探伤 50μ m,4、5级 ≤80μ m 001、01级≤3.2 μ m,1级≤6.3μ 本标准适用于导磁钢铸件表面及近表面缺陷的检验和质量评级,当磁场强度等于 m,2级≤12.5μ MT 2.4KA/m时,材料中磁感应强度大于1T的铸钢称为导磁钢" m,3级≤12.5μ m,4级≤50μ m,5级≤100μ m
不锈钢管 涡流探伤标准
不锈钢管涡流探伤标准
(1)不锈钢无缝钢管执行GB/T14976-2012《流体输送用不锈钢无缝钢管》,要求P≤0.035%,从而限制使用中频炉生产不锈钢无缝管坯料,中频炉为脱磷需额外补镍铁和铬铁;要求进行液压试验或涡流探伤、晶间腐蚀式验,以确保产品质量。
(2)双相不锈钢无缝钢管执行GB/T20833-2008《奥氏体-铁素体型双相不锈钢无缝钢管》,主要牌号有:S22253、S22053、S25073;要求进行液压试验或涡流探伤、压扁试验、扩口试验,以确保产品质量;规定组织应为奥氏体和铁素体,奥氏体含量应占40%-60%。
(3)不锈钢焊接钢管执行GB/T12771-2008《流体输送用不锈钢焊接钢管》,要求进行焊缝射线探伤,液压试验或涡流探伤、晶间腐蚀试验,压扁试验、焊缝横向弯曲试验,以确保产品质量。
(4)双相不锈钢焊接钢管执行GB/T20832-2008《奥氏体-铁素体型双相不锈钢焊接钢管》,主要牌号有:S22253、S22053、
S25073;要求进行焊缝射线探伤,液压试验或涡流探伤、压扁试验、焊缝横向弯曲试验,以确保产品质量;规定组织应为奥氏体和铁素体,奥氏体含量应占40%-60%。
不锈钢板材探伤标准

不锈钢板材探伤标准不锈钢板材是一种常见的金属材料,广泛应用于建筑、制造业、化工等领域。
然而,由于不锈钢板材的特殊性质,其质量问题一直备受关注。
在生产和使用过程中,不锈钢板材往往会出现各种缺陷,如裂纹、气孔、夹杂等,这些缺陷不仅影响了不锈钢板材的外观质量,还可能影响其使用性能和安全性。
因此,对不锈钢板材进行探伤是非常必要的,而探伤标准则是保证探伤质量和结果准确性的重要依据。
不锈钢板材探伤标准主要包括以下几个方面:1. 探伤方法。
目前,常见的不锈钢板材探伤方法包括超声波探伤、射线探伤和磁粉探伤等。
超声波探伤是利用超声波在材料中传播的特性来检测缺陷的一种方法,适用于各种形式的不锈钢板材。
射线探伤则是利用射线穿透材料,通过检测射线透射后的影像来发现缺陷。
而磁粉探伤则是利用磁粉在磁场作用下对不锈钢板材表面缺陷的吸引和聚集来检测缺陷。
不同的探伤方法适用于不同类型的不锈钢板材,因此在进行探伤时需要选择合适的方法。
2. 探伤标准。
不锈钢板材探伤标准是对不锈钢板材进行探伤的具体要求和规定。
探伤标准通常包括探伤的工艺流程、探伤设备的选择和使用、探伤人员的资质要求、探伤结果的判定标准等内容。
探伤标准的制定是为了保证不锈钢板材探伤的准确性和可靠性,对于生产企业和使用单位来说具有重要的指导意义。
3. 探伤人员培训。
不锈钢板材探伤需要专业的探伤人员进行操作,因此对探伤人员的培训是至关重要的。
探伤人员需要具备良好的专业知识和操作技能,能够熟练操作探伤设备,并能够准确判断不同类型的缺陷。
此外,探伤人员还需要了解和掌握不锈钢板材探伤标准,严格按照标准要求进行操作,确保探伤结果的准确性和可靠性。
4. 探伤结果评定。
探伤结果的评定是不锈钢板材探伤的最终目的。
根据探伤结果,可以对不锈钢板材的质量进行评定,判断是否符合要求。
在评定探伤结果时,需要参照相应的探伤标准,进行严格的判定和记录,确保评定结果的准确性和可靠性。
综上所述,不锈钢板材探伤标准对于保证不锈钢板材质量的稳定和可靠具有重要意义。
不锈钢焊缝超声波探伤标准

不锈钢焊缝超声波探伤标准不锈钢焊缝超声波探伤是一种常用的无损检测方法,其标准化是确保焊缝质量的重要手段。
本文将介绍不锈钢焊缝超声波探伤的标准要求,以及相关的操作规程和注意事项。
首先,不锈钢焊缝超声波探伤的标准主要包括国际标准、行业标准和企业标准。
国际标准通常是作为参考依据,行业标准则是根据特定行业的需求和实际情况而制定,而企业标准则是根据企业内部管理和生产情况而制定。
在进行不锈钢焊缝超声波探伤时,应当严格按照相关标准进行操作,以确保检测结果的准确性和可靠性。
其次,不锈钢焊缝超声波探伤的操作规程包括设备准备、检测参数设置、探头校准、扫描检测、数据分析等步骤。
在进行设备准备时,应当检查超声波探伤仪器和探头的状态,确保其正常工作;在进行检测参数设置时,应根据焊缝的类型和厚度等因素进行合理的参数选择;在进行探头校准和扫描检测时,应当按照标准要求进行操作,以获取准确的检测数据;最后,在进行数据分析时,应当结合实际情况进行判断,对焊缝的缺陷进行合理评定。
此外,不锈钢焊缝超声波探伤时需要注意的事项包括环境条件、人员素质、设备维护等方面。
在进行超声波探伤时,应当选择相对安静、无干扰的环境,以确保检测的准确性;在进行操作时,应当由经过专门培训的人员进行,以确保操作的规范性和准确性;在进行设备维护时,应当定期对超声波探伤仪器和探头进行检查和维护,以确保其正常工作。
总的来说,不锈钢焊缝超声波探伤是一项重要的无损检测方法,其标准化是确保焊缝质量的关键。
在进行超声波探伤时,应当严格按照相关标准进行操作,以确保检测结果的准确性和可靠性。
同时,也需要注意环境条件、人员素质、设备维护等方面的问题,以确保整个检测过程的顺利进行。
希望本文的介绍能够对不锈钢焊缝超声波探伤的标准化有所帮助,谢谢阅读!。
不锈钢超声波检测标准
不锈钢超声波检测标准不锈钢超声波检测是一种无损检测方法,用于检测不锈钢材料中的缺陷和异常。
通过使用超声波探头和仪器,可以检测到材料内部的结构和缺陷,以确保产品的质量和安全性。
以下是不锈钢超声波检测的标准。
一、检测设备不锈钢超声波检测需要使用专业的超声波探伤仪和探头。
探伤仪具有高精度的超声波信号发生器和接收器,可以产生和接收超声波信号。
探头是用来将超声波信号传输到被检测材料中的,通常采用水耦合或空气耦合的方式。
探头的频率通常为1-5 MHz,以获得更高的分辨率和灵敏度。
二、检测准备在进行不锈钢超声波检测前,需要做好以下准备工作:1.清理被检测材料表面,确保表面干净、干燥、无油污。
2.选择合适的探头和仪器参数,包括频率、灵敏度、增益等。
3.检查探头是否完好无损,确保探头的声学性能符合要求。
4.确定检测方法和检测区域,包括检测部位、方向、深度等。
三、检测方法不锈钢超声波检测可以采用以下方法:1.纵波检测:将探头垂直于材料表面放置,利用纵波对材料进行检测。
适用于检测厚度较小的材料,如薄板、薄管等。
2.横波检测:将探头平行于材料表面放置,利用横波对材料进行检测。
适用于检测厚度较大的材料,如厚板、厚管等。
3.表面波检测:将探头在材料表面放置,利用表面波对材料进行检测。
适用于检测表面缺陷和近表面缺陷。
4.多探头检测:将多个探头同时或依次放置在材料的不同部位,利用不同的探头对材料进行多角度的检测。
可以提高检测的全面性和可靠性。
四、检测参数不锈钢超声波检测的参数包括频率、灵敏度、增益、扫描速度、脉冲重复频率等。
这些参数的选择和调整直接影响检测结果的准确性和可靠性。
需要根据被检测材料的特性和要求,选择合适的参数并进行调整。
五、检测结果分析不锈钢超声波检测完成后,需要分析检测结果并给出评价报告。
评价报告应包括以下内容:1.检测部位和范围。
2.检测结果的描述和分析,包括缺陷的位置、大小、类型等。
3.缺陷评级和建议,根据缺陷的类型和严重程度进行评级,并提出相应的建议和措施。
201与304不锈钢检测方法
201与304不锈钢检测方法(实用版3篇)《201与304不锈钢检测方法》篇1不锈钢是一种高合金钢,由于其优异的耐腐蚀性、耐热性和耐磨性等特点,被广泛应用于各种领域。
201 不锈钢和304 不锈钢是两种常见的不锈钢材料,它们的化学成分和性能有所不同。
以下是几种常用的201 不锈钢和304 不锈钢检测方法:1. 化学成分检测:可以通过化学分析方法来检测不锈钢中的元素含量,包括镍、铬、钼、铁等元素。
201 不锈钢的化学式为17Cr-6Ni-2Mn,304 不锈钢的化学式为18Cr-8Ni-2Mn。
2. 光谱分析:可以通过光谱分析方法来检测不锈钢的化学成分和相组成。
这种方法可以快速、准确地分析不锈钢中的元素含量和种类。
3. 硬度测试:硬度是衡量不锈钢材料硬度的指标,可以通过硬度测试来检测不锈钢的硬度。
一般来说,不锈钢的硬度越高,其耐腐蚀性和耐磨性越好。
4. 盐雾试验:盐雾试验是一种测试不锈钢耐腐蚀性的方法。
通过将不锈钢样品放置在盐雾环境中,观察其表面腐蚀情况,可以测定不锈钢的耐腐蚀性能。
5. 显微镜检测:通过显微镜观察不锈钢的微观结构,可以检测不锈钢的组织结构和相组成。
这种方法可以确定不锈钢的强度、韧性和耐腐蚀性等性能。
《201与304不锈钢检测方法》篇2要检测201 和不锈钢304,可以采用以下几种方法:1. 化学分析方法:可以通过化学分析方法来检测不锈钢中的元素含量,例如镍、铬、钼、铁等。
常见的化学分析方法包括光谱分析、化学滴定法、离子色谱法等。
2. 金相检测方法:通过金相检测方法可以检测不锈钢的组织结构,例如晶粒度、相组成、析出相等。
常用的金相检测方法包括光学显微镜、电子显微镜、X 射线衍射等。
3. 硬度检测方法:硬度是衡量材料坚硬的程度,可以通过硬度检测方法来区分201 和不锈钢304。
常用的硬度检测方法包括布氏硬度、洛氏硬度、维氏硬度等。
4. 磁性检测方法:不锈钢304 具有磁性,而201 不具有磁性。
304不锈钢管检测依据

304不锈钢管检测依据304不锈钢管是一种广泛应用于工业领域的管材,在使用前需要进行检测,以确保其质量和安全性。
本文将以304不锈钢管检测为主题,介绍相关的检测依据和方法。
一、外观检测外观检测是对304不锈钢管外表面的检查,以确定是否存在明显的缺陷和损伤。
常见的外观缺陷包括裂纹、凹陷、疤痕等。
检测人员应仔细观察不锈钢管的外表面,排除以上缺陷的存在。
二、尺寸检测尺寸检测是对304不锈钢管的直径、壁厚、长度等尺寸参数进行测量,以确保其符合设计要求。
常用的测量工具有卷尺、游标卡尺等。
检测时应按照相关标准规定的测量方法进行,确保测量结果的准确性。
三、化学成分检测化学成分检测是对304不锈钢管中各元素的含量进行分析,以判断其是否符合相关标准要求。
常用的检测方法包括光谱分析、化学分析等。
检测结果应与标准要求进行比较,确保每个元素的含量都在允许范围内。
四、力学性能检测力学性能检测是对304不锈钢管的强度、韧性等性能进行测试,以评估其在使用过程中的可靠性。
常用的力学性能测试方法包括拉伸试验、冲击试验等。
检测结果应与相关标准进行比较,确保不锈钢管的力学性能符合要求。
五、耐腐蚀性检测耐腐蚀性检测是对304不锈钢管在特定环境中的腐蚀性能进行评估,以确定其能否满足特定使用条件下的要求。
常用的耐腐蚀性检测方法包括盐雾试验、腐蚀介质浸泡试验等。
检测结果应与相关标准进行比较,确保不锈钢管的耐腐蚀性能符合要求。
六、无损检测无损检测是通过对304不锈钢管进行超声波、射线、涡流等非破坏性检测,以发现隐蔽缺陷和内部结构的问题。
常用的无损检测方法包括超声波探伤、射线检测等。
检测结果应与相关标准进行比较,确保不锈钢管无明显的内部缺陷。
总结:通过外观检测、尺寸检测、化学成分检测、力学性能检测、耐腐蚀性检测和无损检测等多个方面的检测,可以全面评估304不锈钢管的质量和安全性。
检测结果应与相关标准进行比较,确保不锈钢管符合设计和使用要求。
在实际应用中,应根据具体情况选择合适的检测方法和设备,确保检测过程准确可靠。
检测304最科学的方法
检测304最科学的方法
首先,为了确保检测的科学性,我们需要准备好实验所需的设备和试剂。
在进行实验之前,务必保证实验室环境的洁净和安全。
选择高质量的实验设备和纯净的试剂是保证实验结果准确性的重要前提。
其次,我们需要选择合适的检测方法。
对于304材料的检测,常用的方法包括金相显微镜检测、扫描电子显微镜检测、X射线衍射分析等。
在选择检测方法时,需要根据实际情况和实验要求进行综合考虑,选择最适合的方法进行检测。
接着,进行样品的制备和处理。
在进行检测之前,需要对样品进行适当的制备和处理,以确保样品的表面光洁度和结构完整性。
制备和处理过程需要严格按照标准操作规程进行,避免样品受到外界污染或损坏。
然后,进行实验操作和数据采集。
在进行实验操作时,需要严格按照检测方法和操作规程进行,确保实验过程的准确性和可重复性。
在数据采集过程中,需要及时记录实验数据,并进行数据分析和处理。
最后,根据实验结果进行分析和判定。
根据实验数据和分析结果,对样品的性能和质量进行评估和判定。
在进行分析和判定时,
需要综合考虑各项因素,并进行科学客观的判断。
综上所述,选择合适的设备和试剂,选择科学可靠的检测方法,进行样品的制备和处理,严格进行实验操作和数据采集,以及科学
客观地分析和判定实验结果,是保证304最科学的检测方法的关键
步骤。
只有在每个环节都严格按照科学规范进行,才能得到准确可
靠的实验结果,为相关领域的科学研究和工程应用提供有力支撑。
不锈钢焊接钢管超声波探伤标准

不锈钢焊接钢管超声波探伤标准让我们从最基础的概念开始,了解一下什么是不锈钢焊接钢管超声波探伤标准。
不锈钢焊接钢管是一种常见的工程材料,而超声波探伤是一种非破坏性检测技术,将这两者结合起来进行探伤标准的制定,可以帮助检测不锈钢焊接钢管的质量和安全性。
在工程领域,不锈钢焊接钢管的质量直接关系到工程的安全和可靠性,因此制定相应的超声波探伤标准显得尤为重要。
基于以上的基础概念,我们可以开始探讨不锈钢焊接钢管超声波探伤标准的深度和广度。
我们可以从超声波探伤的原理和方法入手,介绍超声波探伤是如何应用在不锈钢焊接钢管上的,并阐述其检测原理和流程。
我们可以深入探讨不锈钢焊接钢管可能存在的缺陷和问题,例如焊接质量、裂纹、气孔等,以及这些问题对工程安全的影响。
我们还可以介绍当前国内外关于不锈钢焊接钢管超声波探伤标准的制定情况,探讨其差异和共性,以及如何进行标准的选择和应用。
接下来,我们可以讨论一些具体的案例和实践经验,例如在工程施工中如何进行不锈钢焊接钢管超声波探伤的实际操作、技术难点和注意事项。
通过具体的案例分析,我们可以更加深入地理解不锈钢焊接钢管超声波探伤标准的实际应用和意义。
我们也可以结合国内外的最新研究成果和发展动态,展望不锈钢焊接钢管超声波探伤标准未来的发展方向和趋势。
回顾总结起来,不锈钢焊接钢管超声波探伤标准是一个涉及工程安全和质量的重要领域,通过本文的全面探讨,我们对其深度和广度有了更加全面的了解。
在未来的工程实践中,我们可以更加灵活地运用不锈钢焊接钢管超声波探伤标准,提高工程质量和安全水平,为工程建设保驾护航。
以上就是本文对于不锈钢焊接钢管超声波探伤标准的全面评估和撰写,希望对你有所帮助。
在不锈钢焊接钢管超声波探伤标准的深入探讨中,我们可以对超声波探伤的原理和方法进行进一步的阐述。
超声波探伤是利用超声波在材料中的传播特性,通过检测材料内部的缺陷和异物等来实现对材料质量的评估。
在不锈钢焊接钢管的超声波探伤中,可以采用经验公式或者理论计算的方式确定探头的工作频率和入射角度,以达到最佳的探测效果。
不锈钢探伤检测标准
不锈钢探伤检测标准
不锈钢探伤检测标准主要有以下几种:
1. 美国材料与试验协会标准ASTM A370:采用超声波探伤(UT)或涡流探伤(ET)对不锈钢管道进行无损检测,主要检查材质均匀的材料裂纹缺陷和管表面缺陷。
2. 美国机械工程师协会标准ASME B31.3:规定了不锈钢管道的焊接检测要求,包括超声波探伤、磁粉探伤、射线探伤等。
3. 日本工业标准JIS G4304:提出了不锈钢管道的超声波探伤、磁粉探伤等无损检测方法,以及相应的合格评定标准。
4. 中国国家标准GB/T 23258:规定了不锈钢管道的焊接检测要求,包括超声波探伤、磁粉探伤、射线探伤等。
其中,渗透探伤(PT)、磁粉探伤(MT)、射线探伤(RT)、超声波探伤(UT)和涡流探伤(ET)等检测方法各有其优缺点,适用于不同的不锈钢管类型。
5. 欧洲标准EN10229:提出了不锈钢管道的超声波探伤、磁粉探伤等无损检测方法,以及相应的合格评定标准。
不同的标准对不锈钢探伤检测的要求有所不同,包括检测方法、检测频率、缺陷评定标准等。
在实际应用中,应根据具体项目和客户要求选择合适的不锈钢探伤检测标准,并根据检测结果进行质量控制和质量保证。
304不锈钢探伤方法
NDE for Type 304L Stainless Steel Material CharacterizationKenji KrzywoszEPRI NDE Center1300 West WT Harris Blvd.Charlotte, NC 28262USAAbstractThis paper summarizes the results of applying the combined eddy current and magnetic NDE techniques to evaluate and assess the changing material conditions due to fatigue, including emergence of cracking, in Type 304 low carbon stainless steel plate samples. This on-going work is done to help identify and mitigate degraded materials with flaws in their incipient stages rather than later, when the flaws have grown to critical flaw dimensions.Two separate AC eddy current and DC magnetic field measurement systems were utilized during the fatigue testing of “dog-bone” shaped stainless steel plate samples. The acquired NDE data consisted of both the DC magnetic field measurements by Feritscope MP30 and the normalized eddy current coil impedance measurements by a Swept-Frequency Eddy Current Tester. Individual measurements by AC eddy current and DC magnetic field measurements provided complementary information about the changing material conditions prior to and after the cracks were formed. AC eddy current measurements relied on the association of changing coil impedance to material conductivity values due to fatigue cycling and emergence of fatigue cracks. DC magnetic field measurements detected increased permeability due to austenitic stainless steel changing from nonmagnetic to magnetic martensitic conditions with increased fatigue cycles.BackgroundThe majority of mainstream NDE activities focus on flaw identification and flaw characterization. Most critical and essential components of a nuclear power plant are made of Alloy 600 and Type 304/316 materials, which are susceptible to stress corrosion cracking and fatigue cracking. There is a need to nondestructively detect, assess, and monitor incipient stages of material degradations to allow timely remedial measures. It makes more economic sense to detect and mitigate flaws in their incipient stages than later when the flaws have grown to some critical flaw dimensions.This paper summarizes the EPRI results (1) of applying the conventional eddy current and magnetic NDE techniques to evaluate and assess the different fatigue degradation stages of Type 304 Low (L) carbon stainless steel (SS) material. The primary focus was to obtain successive NDE data from the Type 304L SS “dog bone” samples, which weresubjected to life-cycle fatigue testing. The initial baseline NDE data consisted of both the DC magnetic field measurements by Feritscope MP30 and the normalized eddy current coil impedance measurements by Swept-Frequency Eddy Current Tester. The dog-bone configuration fatigue samples, 626 and 627, were approximately 590mm in length and 100mm in reduced width where it was subjected to cyclic fatigue testing.Fatigue Testing of 304 L #626 Plate SpecimenThe first sample, #626, was tested and data acquired at every 6000 cycles with the intention of failing the sample so that more detail testing can be done on the second sample at reduced cycle increments. Both the DC magnetic field and AC eddy current measurements were taken at 5,752 cycles and 10,000 cycles before the sample broke in half at 16,870 cycles. The sample was cycled at 30 cycles per minute with the total strain range held at 0.6%, which roughly equated to +/- 15.3mm deflection at the center of the specimen.Initially, the eddy current coil impedance changes corresponding to changes in the material conductivity values were obtained prior to fatigue testing at an operating frequency of 50 kHz. During the calibration process, the eddy current system was normalized such that “0” normalized impedance value represented a conductivity value of 0.738 megasiemens per meter (MS/m), while a “1” normalized impedance value represented a conductivity value of 0.831 MS/m. In general, the conductivity value of Type 316 SS material is listed as 1.5 MS/m. So, if this value holds true for the tested sample, this would result in the normalized impedance value of around 2.0. The actual value obtained from the baseline test showed the averaged normalized impedance value of around 3.0. It should be noted that normalized baseline impedance values ranged from 2.7 to 3.4 for the top surface and 2.8-3.5 for the bottom surface. The subsequent plots show reduced changes in the normalized impedance values from the baseline values with increasing fatigue cycles.At 10K fatigue cycles, the normalized impedance values decreased on both the top surface (2.3-3.0) and bottom surface (2.7-3.2). This decrease in the normalized impedance values was attributed to emergence of incipient cracks. At 16,870 cycles, the plate sample #626 broke in half as shown in Figure 1.IV Conferencia Panamericana de END Buenos Aires – Octubre 2007 2Figure 1Cracked Type 304 L specimen at 16,870 fatigue cyclesThe normalized impedance plots of the cracked specimens are shown as Figure 2. As expected, the overall reduction in the normalized impedance values was noted due mainly to the presence of multiple fatigue cracks. Negative impedance values were the results of the eddy current sensor placed in the immediate proximity to the opened crack. The overall reductions in the normalized coil impedance values were more in line or along the developed crack line shown in Figure 1.IV Conferencia Panamericana de END Buenos Aires – Octubre 2007 3Figure 2Normalized impedance values at 16,870 fatigue cyclesIt was interesting to note that at one point before the emergence of cracks, the normalized coil impedance values increased slightly. However, with emergence of cracks, the impedance values were reduced more by the presence of cracks thus overshadowing any impedance increase from the increased material permeability.Similarly, the percent ferrite content ranged from 1.3-1.6 on top surface and from 1.2-1.7 on bottom surface at the beginning. By the time the specimen broke at 16,870 fatigue cycles, more pronounced ferrite content increase was noted, especially on one side of the cracked interface as shown in Figure 3. It should be noted that Row1 Grid 11 of the top surface is same as Row 3 Grid 11 of the bottom surface.It should be noted that it is not possible to nondestructively determine the percent ferrite content directly. Therefore, a set of known reference standards was used to conduct this testing. The Feritscope instrument was calibrated first using a sample containing 100% ferrite, followed by three samples containing 0.54%, 2.64%, and 14.6% ferrite content. IV Conferencia Panamericana de END Buenos Aires – Octubre 2007 4Figure 3Percent ferrite content by DC field measurements after 16,870 fatigue cyclesFatigue Testing of Type 304 L #627 Plate SpecimenAfter the initial cracking of the specimen #626, more frequent measurements were made on the second plate specimen. The NDE measurements were taken from the same 6mm by 20mm rectangular area within the necked-down region of the dog bone plate specimen. As before, the measurements were taken from both the top and bottom sides ofIV Conferencia Panamericana de END Buenos Aires – Octubre 2007 5IV Conferencia Panamericana de END Buenos Aires – Octubre 2007 6 the sample. This second sample was fatigue cycled and data taken at 5,000, 7,000, 10,000, 12,000, 13,000, and 14,000 cycles before the sample cracked partially at 14,899 cycles. It was also necessary to cool the sample to room temperature before the data can be gathered after removing the sample from the tester.Figure 4 shows the area of interest containing multiple surface cracks from the top side of the sample. The fatigue process was stopped before the specimen cracked completely in half as was the case for specimen #626. The sample was cracked partially through wall at top mid-point of the inspected area. The sample cracked partially closer to Row 1 Grid 7 of the top surface – this crack location on the bottom side was associated to Row 3 and fell between Grids 6 and 7. The above locations applied to detail scan regions of the normalized impedance plots. For the percent ferrite content plots, the crack location was identified as Row 1 Grid 10 of the top surface. The similar crack location on the bottom side was at Row 3 and fell between Grids 9 and 10.Figure 4Partially cracked specimen #627 as viewed from the top sideTable 1 summarizes the range of normalized impedance values obtained after each fatigue cycles. Unlike the first specimen #626, no increase in the normalized impedance value was noted. Any increase in the normalized impedance due to increased permeability was more than offset by decrease in material conductivity caused by emergence of multiple fatigue cracks.Table 1Normalized impedance values of fatigued specimen #627Normalized Impedance Normalized Impedance Fatigue Cycles Bottom side of #627 Top Side of #6270 2.70 – 3.63 2.90 – 3.665K 2.70 – 3.57 2.70 – 3.397K 2.48 – 3.21 2.70 – 3.2710K 2.30 – 3.18 2.40 – 3.1412K 1.40 – 2.93 2.20 – 3.0913K 0.30 – 2.99 0.5 – 2.9414K -1.0 – 2.94 0.5 – 2.9415K -4.0 – 2.96 -3.15 – 2.89Figure 5 shows normalized impedance plots of the bottom line from top and bottom sides of specimen #627. They all indicate gradual progression of normalized impedance reduction with increasing fatigue cycles, especially after 10,000 cycles.The major crack location is indicated by the lowest normalized impedance value. For this specimen, the crack was located at the axial location of 6 as shown in the figure. This point is equivalent to axial location 9 of Figure 4 starting from the left-hand side of the plate. The corresponding top and bottom surface profiles were very close even though they were separated by 10mm thick plate width.IV Conferencia Panamericana de END Buenos Aires – Octubre 2007 7Figure 5Corresponding top line scans of normalized impedance plots with fatigue cycles Similarly as shown in Table 2, a gradual increase in the percent ferrite content was noted with increasing fatigue cycles. This increase in the ferrite content was attributed to austenitic SS changing into ferromagnetic martensitic condition with increasing fatigue cycles.IV Conferencia Panamericana de END Buenos Aires – Octubre 2007 8Table 2Percent ferrite content of fatigued specimen #627Percent Ferrite Content Percent Ferrite ContentFatigue Cycles Bottom side of #627 Top Side of #6275K 1.08 – 1.30 1.08 – 1.397K 1.20 – 1.51 1.20 – 1.4910K 1.10 – 1.90 1.30 – 1.6912K 1.38 – 2.38 1.30 – 1.8913K 1.30 – 3.02 1.30 – 2.0914K 1.30 – 2.89 1.40 – 3.0315K 1.30 – 3.48 1.38 – 2.95Unlike specimen #626, where the highest percent ferrite content was located at the crack initiation site, the higher percent ferrite contents for specimen #627 were found just outside of the crack initiation site. Figure 6 shows complex nature of the observed percent ferrite contents with increasing fatigue cycles. Higher fatigue cycles did result in higher percent ferrite contents but for this specimen, those higher values did not correspond with the major crack site. As shown in the figures, higher percent ferrite contents were noted adjacent to the observed crack locations.IV Conferencia Panamericana de END Buenos Aires – Octubre 2007 9Figure 6Corresponding top line scans of percent ferrite plots with fatigue cyclesSummaryIndividual measurements by AC eddy current and DC magnetic field measurements provided complementary information about the changing material conditions prior to and after the cracks were formed.The following observations were made from the analysis of separate AC eddy current and DC magnetic field measurements.IV Conferencia Panamericana de END Buenos Aires – Octubre 2007 10•AC normalized impedance values showed momentary increase in normalized impedance values during the initial fatigue cycling to 5K. This increase was due more likely to austenitic material changing into ferromagnetic martensitic condition. This increase was noted on both the top and bottom sides of specimen #626. Unfortunately, this increasing impedance condition was not noted from the normalized impedance measurements of specimen #627.•AC normalized impedance values decreased successively with increased fatigue cycles due mainly to appearance of fatigue cracking•The lowest impedance values were obtained along the crack line•Any increase in the normalized impedance due to martensitic condition was more than offset by emergence of surface cracking•Normalized impedance profiles of top and bottom sides were very similar despite the 10mm plate thickness•DC magnetic field measurements confirmed the emergence of ferromagnetic martensitic condition from nonmagnetic austenitic condition•The percent ferrite content increased with increasing fatigue cycling but the overall increase was about one-half the change noted in the normalized impedance values•No appreciable change in the percent ferrite content was noted in specimen #627 in the 5-7K fatigue cycles•Multiple sites of increased percent ferrite content were noted from both the top and bottom sides, indicating non-uniform application of fatigue cycling •Higher percent ferrite contents were noted at adjacent to crack sites and not at the crack initiation site for specimen #627Reference1 K. Krzywosz, Nondestructive Evaluation: NDE for Type 304/316 Stainless Steel Material Characterization, EPRI Report 1013528, November 2006IV Conferencia Panamericana de END Buenos Aires – Octubre 2007 11。
检测304最科学的方法
检测304最科学的方法304不锈钢是一种常见的金属材料,通常用于制作厨具、家具、建筑材料等。
然而,由于304不锈钢的特殊性质,有时候需要对其进行科学的检测,以确保其质量和性能达到要求。
那么,什么是最科学的方法来检测304不锈钢呢?首先,我们可以使用化学方法来检测304不锈钢的成分。
通过对304不锈钢样品进行化学分析,可以确定其主要成分和杂质含量,从而判断其质量和纯度。
这种方法通常需要使用化学试剂和仪器,需要在实验室环境下进行。
化学方法可以准确地分析304不锈钢的成分,但需要专业知识和设备支持。
其次,我们可以利用物理方法来检测304不锈钢的性能。
例如,可以通过金相显微镜观察304不锈钢的组织结构,以判断其晶粒大小和分布情况。
同时,还可以利用硬度计和拉伸试验机等设备,对304不锈钢的硬度和强度进行测试。
这些物理方法可以直观地了解304不锈钢的性能,对于工程和科研领域的人员来说,是非常重要的。
另外,我们还可以采用无损检测方法来检测304不锈钢的缺陷和隐患。
例如,可以利用超声波、X射线和磁粉检测等技术,对304不锈钢进行无损检测,以发现内部的裂纹、气孔和夹杂等缺陷。
这些无损检测方法不会对304不锈钢造成任何损伤,可以在生产现场进行,具有很高的实用性和可操作性。
最后,我们还可以结合多种方法来检测304不锈钢,以提高检测的准确性和全面性。
例如,可以先利用化学方法进行成分分析,再利用物理方法进行性能测试,最后再利用无损检测方法进行缺陷检测。
通过多种方法的综合应用,可以更全面地了解304不锈钢的质量和性能,为其在实际应用中的使用提供科学依据。
综上所述,对于304不锈钢的科学检测方法,我们可以采用化学方法进行成分分析,利用物理方法进行性能测试,应用无损检测方法进行缺陷检测,甚至结合多种方法进行综合检测。
这些方法各有特点,可以根据具体的检测需求和条件来选择合适的方法。
通过科学的检测方法,可以确保304不锈钢的质量和性能达到要求,为其在各个领域的应用提供保障。
- 1、下载文档前请自行甄别文档内容的完整性,平台不提供额外的编辑、内容补充、找答案等附加服务。
- 2、"仅部分预览"的文档,不可在线预览部分如存在完整性等问题,可反馈申请退款(可完整预览的文档不适用该条件!)。
- 3、如文档侵犯您的权益,请联系客服反馈,我们会尽快为您处理(人工客服工作时间:9:00-18:30)。
NDE for Type 304L Stainless Steel Material CharacterizationKenji KrzywoszEPRI NDE Center1300 West WT Harris Blvd.Charlotte, NC 28262USAAbstractThis paper summarizes the results of applying the combined eddy current and magnetic NDE techniques to evaluate and assess the changing material conditions due to fatigue, including emergence of cracking, in Type 304 low carbon stainless steel plate samples. This on-going work is done to help identify and mitigate degraded materials with flaws in their incipient stages rather than later, when the flaws have grown to critical flaw dimensions.Two separate AC eddy current and DC magnetic field measurement systems were utilized during the fatigue testing of “dog-bone” shaped stainless steel plate samples. The acquired NDE data consisted of both the DC magnetic field measurements by Feritscope MP30 and the normalized eddy current coil impedance measurements by a Swept-Frequency Eddy Current Tester. Individual measurements by AC eddy current and DC magnetic field measurements provided complementary information about the changing material conditions prior to and after the cracks were formed. AC eddy current measurements relied on the association of changing coil impedance to material conductivity values due to fatigue cycling and emergence of fatigue cracks. DC magnetic field measurements detected increased permeability due to austenitic stainless steel changing from nonmagnetic to magnetic martensitic conditions with increased fatigue cycles.BackgroundThe majority of mainstream NDE activities focus on flaw identification and flaw characterization. Most critical and essential components of a nuclear power plant are made of Alloy 600 and Type 304/316 materials, which are susceptible to stress corrosion cracking and fatigue cracking. There is a need to nondestructively detect, assess, and monitor incipient stages of material degradations to allow timely remedial measures. It makes more economic sense to detect and mitigate flaws in their incipient stages than later when the flaws have grown to some critical flaw dimensions.This paper summarizes the EPRI results (1) of applying the conventional eddy current and magnetic NDE techniques to evaluate and assess the different fatigue degradation stages of Type 304 Low (L) carbon stainless steel (SS) material. The primary focus was to obtain successive NDE data from the Type 304L SS “dog bone” samples, which weresubjected to life-cycle fatigue testing. The initial baseline NDE data consisted of both the DC magnetic field measurements by Feritscope MP30 and the normalized eddy current coil impedance measurements by Swept-Frequency Eddy Current Tester. The dog-bone configuration fatigue samples, 626 and 627, were approximately 590mm in length and 100mm in reduced width where it was subjected to cyclic fatigue testing.Fatigue Testing of 304 L #626 Plate SpecimenThe first sample, #626, was tested and data acquired at every 6000 cycles with the intention of failing the sample so that more detail testing can be done on the second sample at reduced cycle increments. Both the DC magnetic field and AC eddy current measurements were taken at 5,752 cycles and 10,000 cycles before the sample broke in half at 16,870 cycles. The sample was cycled at 30 cycles per minute with the total strain range held at 0.6%, which roughly equated to +/- 15.3mm deflection at the center of the specimen.Initially, the eddy current coil impedance changes corresponding to changes in the material conductivity values were obtained prior to fatigue testing at an operating frequency of 50 kHz. During the calibration process, the eddy current system was normalized such that “0” normalized impedance value represented a conductivity value of 0.738 megasiemens per meter (MS/m), while a “1” normalized impedance value represented a conductivity value of 0.831 MS/m. In general, the conductivity value of Type 316 SS material is listed as 1.5 MS/m. So, if this value holds true for the tested sample, this would result in the normalized impedance value of around 2.0. The actual value obtained from the baseline test showed the averaged normalized impedance value of around 3.0. It should be noted that normalized baseline impedance values ranged from 2.7 to 3.4 for the top surface and 2.8-3.5 for the bottom surface. The subsequent plots show reduced changes in the normalized impedance values from the baseline values with increasing fatigue cycles.At 10K fatigue cycles, the normalized impedance values decreased on both the top surface (2.3-3.0) and bottom surface (2.7-3.2). This decrease in the normalized impedance values was attributed to emergence of incipient cracks. At 16,870 cycles, the plate sample #626 broke in half as shown in Figure 1.IV Conferencia Panamericana de END Buenos Aires – Octubre 2007 2Figure 1Cracked Type 304 L specimen at 16,870 fatigue cyclesThe normalized impedance plots of the cracked specimens are shown as Figure 2. As expected, the overall reduction in the normalized impedance values was noted due mainly to the presence of multiple fatigue cracks. Negative impedance values were the results of the eddy current sensor placed in the immediate proximity to the opened crack. The overall reductions in the normalized coil impedance values were more in line or along the developed crack line shown in Figure 1.IV Conferencia Panamericana de END Buenos Aires – Octubre 2007 3Figure 2Normalized impedance values at 16,870 fatigue cyclesIt was interesting to note that at one point before the emergence of cracks, the normalized coil impedance values increased slightly. However, with emergence of cracks, the impedance values were reduced more by the presence of cracks thus overshadowing any impedance increase from the increased material permeability.Similarly, the percent ferrite content ranged from 1.3-1.6 on top surface and from 1.2-1.7 on bottom surface at the beginning. By the time the specimen broke at 16,870 fatigue cycles, more pronounced ferrite content increase was noted, especially on one side of the cracked interface as shown in Figure 3. It should be noted that Row1 Grid 11 of the top surface is same as Row 3 Grid 11 of the bottom surface.It should be noted that it is not possible to nondestructively determine the percent ferrite content directly. Therefore, a set of known reference standards was used to conduct this testing. The Feritscope instrument was calibrated first using a sample containing 100% ferrite, followed by three samples containing 0.54%, 2.64%, and 14.6% ferrite content. IV Conferencia Panamericana de END Buenos Aires – Octubre 2007 4Figure 3Percent ferrite content by DC field measurements after 16,870 fatigue cyclesFatigue Testing of Type 304 L #627 Plate SpecimenAfter the initial cracking of the specimen #626, more frequent measurements were made on the second plate specimen. The NDE measurements were taken from the same 6mm by 20mm rectangular area within the necked-down region of the dog bone plate specimen. As before, the measurements were taken from both the top and bottom sides ofIV Conferencia Panamericana de END Buenos Aires – Octubre 2007 5IV Conferencia Panamericana de END Buenos Aires – Octubre 2007 6 the sample. This second sample was fatigue cycled and data taken at 5,000, 7,000, 10,000, 12,000, 13,000, and 14,000 cycles before the sample cracked partially at 14,899 cycles. It was also necessary to cool the sample to room temperature before the data can be gathered after removing the sample from the tester.Figure 4 shows the area of interest containing multiple surface cracks from the top side of the sample. The fatigue process was stopped before the specimen cracked completely in half as was the case for specimen #626. The sample was cracked partially through wall at top mid-point of the inspected area. The sample cracked partially closer to Row 1 Grid 7 of the top surface – this crack location on the bottom side was associated to Row 3 and fell between Grids 6 and 7. The above locations applied to detail scan regions of the normalized impedance plots. For the percent ferrite content plots, the crack location was identified as Row 1 Grid 10 of the top surface. The similar crack location on the bottom side was at Row 3 and fell between Grids 9 and 10.Figure 4Partially cracked specimen #627 as viewed from the top sideTable 1 summarizes the range of normalized impedance values obtained after each fatigue cycles. Unlike the first specimen #626, no increase in the normalized impedance value was noted. Any increase in the normalized impedance due to increased permeability was more than offset by decrease in material conductivity caused by emergence of multiple fatigue cracks.Table 1Normalized impedance values of fatigued specimen #627Normalized Impedance Normalized Impedance Fatigue Cycles Bottom side of #627 Top Side of #6270 2.70 – 3.63 2.90 – 3.665K 2.70 – 3.57 2.70 – 3.397K 2.48 – 3.21 2.70 – 3.2710K 2.30 – 3.18 2.40 – 3.1412K 1.40 – 2.93 2.20 – 3.0913K 0.30 – 2.99 0.5 – 2.9414K -1.0 – 2.94 0.5 – 2.9415K -4.0 – 2.96 -3.15 – 2.89Figure 5 shows normalized impedance plots of the bottom line from top and bottom sides of specimen #627. They all indicate gradual progression of normalized impedance reduction with increasing fatigue cycles, especially after 10,000 cycles.The major crack location is indicated by the lowest normalized impedance value. For this specimen, the crack was located at the axial location of 6 as shown in the figure. This point is equivalent to axial location 9 of Figure 4 starting from the left-hand side of the plate. The corresponding top and bottom surface profiles were very close even though they were separated by 10mm thick plate width.IV Conferencia Panamericana de END Buenos Aires – Octubre 2007 7Figure 5Corresponding top line scans of normalized impedance plots with fatigue cycles Similarly as shown in Table 2, a gradual increase in the percent ferrite content was noted with increasing fatigue cycles. This increase in the ferrite content was attributed to austenitic SS changing into ferromagnetic martensitic condition with increasing fatigue cycles.IV Conferencia Panamericana de END Buenos Aires – Octubre 2007 8Table 2Percent ferrite content of fatigued specimen #627Percent Ferrite Content Percent Ferrite ContentFatigue Cycles Bottom side of #627 Top Side of #6275K 1.08 – 1.30 1.08 – 1.397K 1.20 – 1.51 1.20 – 1.4910K 1.10 – 1.90 1.30 – 1.6912K 1.38 – 2.38 1.30 – 1.8913K 1.30 – 3.02 1.30 – 2.0914K 1.30 – 2.89 1.40 – 3.0315K 1.30 – 3.48 1.38 – 2.95Unlike specimen #626, where the highest percent ferrite content was located at the crack initiation site, the higher percent ferrite contents for specimen #627 were found just outside of the crack initiation site. Figure 6 shows complex nature of the observed percent ferrite contents with increasing fatigue cycles. Higher fatigue cycles did result in higher percent ferrite contents but for this specimen, those higher values did not correspond with the major crack site. As shown in the figures, higher percent ferrite contents were noted adjacent to the observed crack locations.IV Conferencia Panamericana de END Buenos Aires – Octubre 2007 9Figure 6Corresponding top line scans of percent ferrite plots with fatigue cyclesSummaryIndividual measurements by AC eddy current and DC magnetic field measurements provided complementary information about the changing material conditions prior to and after the cracks were formed.The following observations were made from the analysis of separate AC eddy current and DC magnetic field measurements.IV Conferencia Panamericana de END Buenos Aires – Octubre 2007 10•AC normalized impedance values showed momentary increase in normalized impedance values during the initial fatigue cycling to 5K. This increase was due more likely to austenitic material changing into ferromagnetic martensitic condition. This increase was noted on both the top and bottom sides of specimen #626. Unfortunately, this increasing impedance condition was not noted from the normalized impedance measurements of specimen #627.•AC normalized impedance values decreased successively with increased fatigue cycles due mainly to appearance of fatigue cracking•The lowest impedance values were obtained along the crack line•Any increase in the normalized impedance due to martensitic condition was more than offset by emergence of surface cracking•Normalized impedance profiles of top and bottom sides were very similar despite the 10mm plate thickness•DC magnetic field measurements confirmed the emergence of ferromagnetic martensitic condition from nonmagnetic austenitic condition•The percent ferrite content increased with increasing fatigue cycling but the overall increase was about one-half the change noted in the normalized impedance values•No appreciable change in the percent ferrite content was noted in specimen #627 in the 5-7K fatigue cycles•Multiple sites of increased percent ferrite content were noted from both the top and bottom sides, indicating non-uniform application of fatigue cycling •Higher percent ferrite contents were noted at adjacent to crack sites and not at the crack initiation site for specimen #627Reference1 K. Krzywosz, Nondestructive Evaluation: NDE for Type 304/316 Stainless Steel Material Characterization, EPRI Report 1013528, November 2006IV Conferencia Panamericana de END Buenos Aires – Octubre 2007 11。
