Geosoft Oasis Montaj 7.51
GEOSOFT Oasis montaj各模块详细介绍
Oasis montaj软件各模块详细介绍Geosoft公司北京办事处目录一、 montaj地球物理模块 (1)二、 montaj地球化学模块 (7)三、 montaj钻孔成图模块 (12)四、 montaj航测遥感数据质量控制模块 (16)五、 montaj地球物理水准校正模块 (19)六、 montaj UX(未爆炸物)检测模块 (23)七、 montaj MAGMAP滤波模块 (28)八、 montaj 栅格图缝合模块 (31)九、 montaj重力/磁法解释模块 (33)十、 montaj 激发极化模块 (38)十一、 montaj 256道放射性测量数据处理模块 (41)十二、 montaj重力和地形校正模块 (43)十三、 合作伙伴开发的montaj扩展模块 (46)Oasis montaj模块介绍一、montaj地球物理模块特点说明montaj地球物理扩展模块提供了一组滤波器和统计工具,可以处理海量地球物理数据。
空间一维滤波器能让野域滤波器(线性和非线性)进行数据处理。
一维FFT滤波器可以应用多种傅里叶域滤波器对一维(线性)位场数据和其它数据进行滤波处理。
应用多种地质统计工具可以进行概要分析和高级的统计分析,包括直方图、散点图和三角剖分图分析,还可以进行基于编码或图群分类的数据子集划分。
montaj地球物理模块应用于:数据平滑处理,在平滑处理过程中,使用带有非线性滤波功能或不带有非线性滤波功能的一维空间滤波器。
实现褶积滤波,包括差分滤波、Fraser滤波、拉普拉斯滤波、低通滤波、带通滤波、高通滤波以及用户自定义滤波。
使用一维快速傅里叶滤波器(FFT)增强波长较短的数据特征。
这些滤波方法包括区域滤波、向上/向下延拓以及垂直与水平导数计算。
通过对指定的延迟数移动开始的基准点,将延迟校准加到数据道中.将场源校正应用到数据中进行系统位移,系统位移量是测线行程方向的函数。
对磁测道进行磁场基站校正。
Oasis_montaj_Work_withData
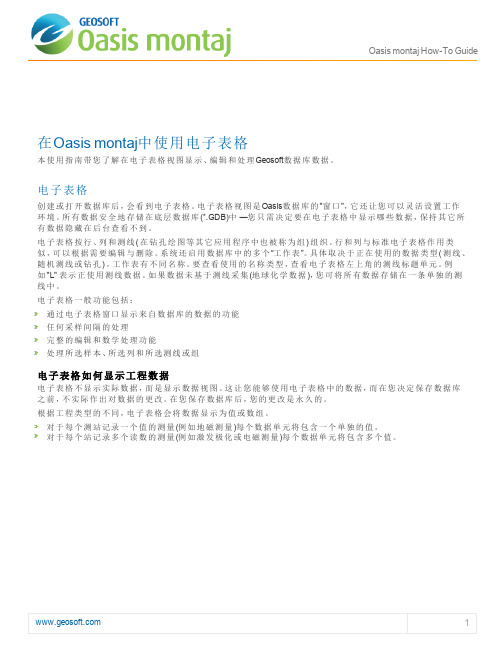
Oasis montaj How-To Guide在Oasis montaj中使用电子表格本使用指南带您了解在电子表格视图显示、编辑和处理Geosoft数据库数据。
电子表格创建或打开数据库后,会看到电子表格。
电子表格视图是Oasis数据库的"窗口",它还让您可以灵活设置工作环境。
所有数据安全地存储在底层数据库(*.GDB)中 —您只需决定要在电子表格中显示哪些数据,保持其它所有数据隐藏在后台查看不到。
电子表格按行、列和测线(在钻孔绘图等其它应用程序中也被称为组)组织。
行和列与标准电子表格作用类似,可以根据需要编辑与删除。
系统还启用数据库中的多个“工作表”。
具体取决于正在使用的数据类型(测线、随机测线或钻孔),工作表有不同名称。
要查看使用的名称类型,查看电子表格左上角的测线标题单元。
例如"L" 表示正使用测线数据。
如果数据未基于测线采集(地球化学数据),您可将所有数据存储在一条单独的测线中。
电子表格一般功能包括:通过电子表格窗口显示来自数据库的数据的功能任何采样间隔的处理完整的编辑和数学处理功能处理所选样本、所选列和所选测线或组电子表格如何显示工程数据电子表格不显示实际数据,而是显示数据视图。
这让您能够使用电子表格中的数据,而在您决定保存数据库之前,不实际作出对数据的更改。
在您保存数据库后,您的更改是永久的。
根据工程类型的不同,电子表格会将数据显示为值或数组。
对于每个测站记录一个值的测量(例如地磁测量)每个数据单元将包含一个单独的值。
对于每个站记录多个读数的测量(例如激发极化或电磁测量)每个数据单元将包含多个值。
Oasis montaj How-To Guide在电子表格中显示数据系统在电子表格窗口中自动显示所有数据。
当系统创建数据库时,其自动创建测线0 (L0:0)。
在数据导入过程中,如果导入的数据不包含测线0,并因此在该测线中没有数据,则会自动删除该测线。
Oasis_montaj_Get_Start

Oasis montaj How-To GuideOasis montaj入门Oasis montaj绘图与处理系统 (MAPS) 是针对处理大容量空间数据的Geosoft核心软件平台。
平台提供定位、管理、可视化、调整、显示和共享定位地球科学数据所需的功能。
Oasis montaj环境通过电子表格窗口和集成的剖面图显示窗口,提供对 Oasis数据库包含的数据的直接访问。
Oasis数据库是一个高效的数据库,提供对海量空间数据集的高效存储和访问。
元数据 (有关数据的数据)由Oasis montaj在第一次接触数据时捕捉。
基于ISO 19115标准的元数据信息被存储在数据内部(如果支持)或作为伴随的XML文件存储。
界面提供直观的数据链接,使您可以动态地连接电子表格、剖面图、图和ArcGIS MXD视图中的数据。
DAT技术(用于访问网格图和图像)使Oasis montaj中的界面可以使用各种各样的网格图与图像格式。
Oasis montaj核心平台为所有Geosoft应用程序和工具提供基本资源。
Geosoft提供各种致力于探测地球物理学、钻孔地质学、勘查地球化学和其它领域的特定应用的系统。
这些系统包含菜单和在核心平台上运行的相关Geosoft可执行文件(GX)。
Oasis montaj绘图和处理系统Oasis montaj绘图和处理系统包括各种各样内置数据导入、处理、分析、可视化、绘图和集成功能。
此系统使您可以执行复杂处理、编辑、绘图和解释任务,包括可以:创建、导入和导出:图、数据库、网格图、体元三维图、MXD文件、图像和剖面图自动元数据创建。
Oasis montaj在您使用数据、存储用户名、日期、时间和执行的操作时自动创建元数据。
XML元数据查看器和编辑器使您可以轻松访问元数据。
使用Geosoft的网格化、等值线绘制和一维滤波器算法处理数据高级网格图实用工具和网格化工具包包括一系列用于数据可视化选项的三维绘图,包括体元三维图、多表面和剖面,每种都有各自的起伏与内容,每种都有各自在三维空间的方向。
基于Oasismontaj平台的磁法数据处理解释研究
科技广场2015.10 引言Geosoft软件主要包括Oasis Montaj平台及有关模块。
Oasis Montaj平台对大量的地球物理、地球化学和地质数据进行综合、视图和比较。
它能够对数据进行快速分析,以帮助用户及时解决问题并作出决定。
montaj 扩展模块有地球物理和地球化学分析、三维钻孔成图、重力和磁力滤波、水平校准、解释和其他功能。
另外,由Geosoft公司的技术合作伙伴开发的montaj+扩展模块,采用Oasis Montaj平台在montaj环境下提供专业的重力和磁力数据处理和正演。
本次数据处理采用克里格网格化,并对其化磁极,垂向一阶导数得出成果图再将其3D成图,结合RGIS经同样的方法得出的成果图进行比较。
基于Oasis montaj平台的磁法数据处理解释研究Study on Accurate Interpretation of Magnetic Data Based on Oasis Montaj Platform汤乐峰Tang Lefeng(江西省煤田地质勘察研究院,江西南昌330001)(Jiangxi Research Institute of Coalfield Geological Survey,Jiangxi Nanchang 330001)摘要:高精度磁法勘探是常用的地球物理方法,随着新的数据处理的出现和资料解释技术的提高,其应用领域越来越广泛,并且数据处理软件也层出不穷,如RGIS、Geosoft等等。
本文通过对玉华山部分地区磁法数据利用Geosoft的Oasis montaj平台的数据存取、可视化、处理、成图及图形输出进行了解开发。
对其进行克里格(kringing)网格化、化磁极和垂向一阶导数成果图,并生成3D图。
再经过RGIS,用同样的方法得出成果图,并将其进行对比,突显出哪种软件效果更明显,对其解释更好,从而判断哪种软件在高精度磁法数据处理更有利。
关键词:Oasis montaj;化磁极;垂向一阶导数;3D中图分类号:P631 文献标识码:A 文章编号:1671-4792(2015)01-0076-05Abstract:High-precision magnetic exploration is one of the commonly used geophysical methods. With the e-mergence of new data processing and the improvement in data interpretation techniques, it has an increasingly more domains of application, and its data processing software is emerging, such as the RGIS, and Geosoft, etc. Based on the magnetic data of some areas in Yuhua Mountain, by using the Geosoft's Oasis montaj platform, the paper carries on data access, visualization, processing, mapping and understanding of graphics output. Through the kringing grid, the reduction to magnetic pole and the first derivative of the vertical obtained results map, we gener-ate the 3D map. In the same way, we obtain the final map from RGIS. We compare these two maps to determine the more advantageous software for high-precision magnetic data processing.Keywords:Oasis Montaj;Reduce to Magnetic Pole;First Derivative of the Vertical;3D76基于Oasis montaj 平台的磁法数据处理解释研究1 数据处理及3D 成图1.1克里格网格化对玉华山部分地区实测数据进行正常场校正和日变校正,得到该区域的每个测点的磁异常值,然后将这些点的异常值分别用Oasis motaj 和RGIS 软件进行克里格(Kringing )网格化处理后,分别得到该区域的磁异常等值线图,如图一和图二所示。
Oasismontaj模块介绍

学数据的高质量。易于使用的标准化 分析和复制制图工具简化了质量控制 过程。
·项目信息加载 ·提取和绘制标准化图,用于快 速显示新的和历史标准以及误差范 围。 ·提取和绘制复制试样,用于快速显示复制数据对。 嵌合体 QA/QC 模块包括易于使用的标准化分析和复制功能,这些功能简化了质量控 制过程。因而,使用户能够确认使用的实验室数据的有效性,这是一项基础工作。
一维快速傅里叶滤波器包括: 用于增强波长较短的数据特征的锐化 滤波器。这些滤波器包括:高通滤波器、向 下延拓处理和垂直与水平导数计算。这类滤 波器通常用于增强反映浅层地质特征的信 号。 用于增强波长较长的数据特征的平滑 滤波器。通常采用滤除或衰减波长较短的信 号的方法。这类滤波器包括:低通滤波器、
向上延拓处理和积分计算。平滑滤波器通常用于滤除短波长的噪音数据或者滤除浅层地质特 征的影响。
该扩展模块提供平面图、剖面图、叠加剖面和 3D 可视化功能。还提供了柱状录井图和 合成工具,用于显示柱状图,每张底图上最多能绘 16 个柱状图,还可以计算和注释柱状图 上的合成间距。
Montaj 钻孔绘图模块用于: 处理和分析大量钻孔数据 直接从采集数据库管理系统输入 数据 建立数据验证 QA/QC 报告 快速选择感兴趣的钻孔 建立钻孔平面图,剖面图和柱状 图 在真三维空间里从不同角度对钻 孔数据作可视化显示 产生高质量图像,用于解释和确定目标 建立和管理钻探项目
地质统计分析 Montaj 地球物理处理模块提供了多种处理海量地球物理数据的统计分析工具,包括:
概要分析和先进的统计分析,直方图分析、散点图分析和三角剖分分析工具,以及基于编码 或图群分类的数据子集划分。
直方图
散点图
Oasis montaj 7.3新功能
Oasis montaj7.3 新功能目录New Capabilities (4)Gridding enhancements (4)IDW gridding (4)Direct gridding (4)Sample density gridding (5)Anisotropic kriging (5)Multiple channel gridding improvements (6)Automatic grid display options (6)3D Visualization (7)Improved isosurface naming (7)Zoom to extents of visible groups (7)Improved display of level plans (7)Improved 3D DXF export (7)Improved 3D PDF export (8)3D view orientation buttons (8)3D Snapshots (8)Visual clipping of all groups in 3D view (8)New Voxel Utilities (9)Window a voxel (9)Re-project a voxel (10)Merge voxel models (10)Convert Thematic Voxels (10)Filter a voxel (11)Voxel display (11)Improved Target Project voxel gridding (11)Voxel to grid conversion (12)Language and Help Accessibility (12)New language interface (12)Improved Application Help (13)ArcGIS 10 Support (14)Support for ArcGIS 10 file formats (14)Drillhole (15)Additional subsurface profiles in sections (15)Improved drillhole label placement (15)New scaling options for downhole data (16)Improved drillhole planning tools (16)Drillhole trace colours (17)Drillhole report (17)GM-SYS Profile (18)GM-SYS Profile (18)Observations and calculations at arbitrary (x,y) locations (18)Plot station locations in Plan View (18)Support "dummy" observed data (19)Convert skewed models to equivalent geometry with stations off-section (19)Convert from MDI to SDI application (19)Obs/Calc stations decoupled from the model (20)Tie background properties and Earth's field info to survey data (20)Call IGRFPT to calculate Earth's field info (20)Steamline new model creation (21)Import observed data from database (22)Import horizons from a database (22)Support data imports from other coordinate systems (22)Export resampled model horizons to XYZ (23)Export selected Plan View extents as a polygon (23)GM-SYS 3D Modelling (23)Release 7.2 Enhancements for GM-SYS 3D Modelling (24)Draped surface FFT gravity calculations (24)Menu changes (24)Space-domain vertical prism calculation utilities (Gbox and MBox) (24)SEG-Y Reader (24)Improved XML Configuration (24)Induced Polarisation (25)QC channel separation (25)Improved workflow (25)Zonge import update (25)Schlumberger format support (26)Update Variable a spacing (26)Support for 3D IP (26)MAGMAP Filtering (26)Bandpass Tapered Filters (26)Differential Reduction to the Pole (26)Notch Filter (27)Convert from Pole to any inc/dec (27)DAP (28)Streamlined Data Management (28)DAP administration web application (28)DAP Catalog SQL server Database (29)Managed Exploration Information Repository (29)Simplified Architecture (29)Data Package (30)Index Map (30)Reports (30)Support for ESRI 10 (31)Web-based Metadata Editor (31)Flexible Presentation Hierarchy (32)Simplified Security Model (33)What's NewOasis montaj 7.3 includes important advancements that improve access to data and information, and expand 3D subsurface visualisation and analysis capabilities. This release also contains many new features and enhancements for the Oasis montaj extensions. Full release notes and downloads .∙New Capabilities∙ montaj Extensions∙ montaj plus Extensions New Capabilities∙ Gridding Enhancements∙ 3D Visualisation∙ New Voxel Utilities ∙Language and Help Accessibility ∙ ArcGIS 10 Support Gridding enhancementsIDW griddingCreates a grid from point data using an Inverse Distance Weighting (IDW) algorithm. IDW gridding is primarily used to interpolate geochemistry data.Direct griddingCreates a grid from highly sampled data without using any interpolation. Intended for use with over-sampled datasets such as LIDAR, it provides a quick gridded view ofthe datasets.Sample density griddingCreates a grid based on the density of sample locations, rather than the value recorded at each location. This is useful for determining the spatial distribution of samples in a dataset, making it easy to identify areas which are under-sampled.Anisotropic krigingCreates a grid that is enhanced in a preferred direction using the strike direction and a weighting factor. This allows you to incorporate the dominant geologic strike and define a preferential weighting in the strike direction, enhancing geological trends in your dataset.Multiple channel gridding improvementsNew multiple channel gridding options for displaying and managing grids. You can now specify a destination folder for all the grids you create and display the grids in a single map, in separate windows, or not at all.Automatic grid display optionsAdded a default option to allow all grids to be displayed automatically as shaded grids instead of plain colour grids, saving time for users who prefer to view grids using the shaded display mode.3D VisualizationImproved isosurface namingThe default name for an isosurface layer now includes both the source voxel name and the cut-off value. This more explicit naming convention is more intuitive and shows where the isosurface originated, providing clarity when multiple element isosurfaces are used in the same 3D view.Zoom to extents of visible groupsYou can now toggle the auto-zoom behaviour off or on, providing you with additional control over how and when the viewing extents change in 3D.Improved display of level plansAdded "Level Plan Grids from Voxels" to the 3D menu to make it easier to create level plan grids. New display options provide you with better control over how your grids are displayed.Improved 3D DXF exportUpdated the export of 3D DXF files to incorporate 3D Face objects as well as polyface mesh objects in our DXF exports. Other software packages (including ESRI ArcScene, GEMCOM, Datamine, Maxwell, Micromine) which only support the 3D Face objects are now able to import Geosoft created DXF files.Improved 3D PDF exportUpgraded our 3D PDF exports to take advantage of new compression methods. 3D PDF exports now create dramatically (up to 10 times!) smaller 3D PDF files which are easier to share.3D view orientation buttonsNew buttons in the 3D Viewer enable you to quickly change the viewing angle to a pre-defined view (North, South, East, West, Top and Bottom) or to a user-defined viewing angle, making it easier to view a 3D model from any angle.3D SnapshotsSnapshots of 3D views may now be created, saved and recalled, enabling you to easily store and retrieve specific viewpoints for your 3D models.Visual clipping of all groups in 3D viewYou can now use the 3D view clipping tools to clip all 3D object types, including: drillholes, symbols, grids and surfaces. You now have the ability to select and visually clip multiple 3D objects at one time. This saves time and provides more flexibility when displaying a few or all of the objects in a 3D view.New Voxel UtilitiesWindow a voxelWe have added a tool that enables you to window a voxel based on manually entered values (X,Y,Z) or a polygon file. Voxels can now be easily clipped to new spatial extents, property, or project boundaries.Re-project a voxelWe have added the ability to re-project a voxel to a new coordinate system. This provides flexibility for the use of voxels in different coordinate systems.Merge voxel modelsYou can now merge two overlapping voxels. The data in the overlapping volume is blended using a cosine roll-off function to create a smooth transition. Merging voxels simplifies the number of voxels you need to work with and converts them to a single coordinate system, point distribution, and colour table.Convert Thematic VoxelsA thematic voxel, such as a lithology voxel created from drillhole lithology data, cannow be converted to a numeric voxel, representing rock densities, electric conductivity or seismic velocity. The voxel conversion uses a lookup file to make the one-to-one conversion.Filter a voxelWe have added a 3x3x3 convolution filter capability that can be applied to a voxel in order to smooth a voxel, emphasize areas of rapid intensity changes, or delineate rock unit or contact boundaries. You can easily add additional custom filters.Voxel displaySimplified the workflow for displaying voxels. The default behaviour has changed so that newly created voxels are now displayed directly in the current 3D view. Improved Target Project voxel griddingExpanded the selection of data channels available for voxel gridding to include all tables in a drillhole project. This saves time and eliminates a step when creating 3D grids from a drillhole project.Voxel to grid conversionCreates a set of parallel grids from a voxel, along the X,Y or Z axis, and at the user specified increment. This capability complements the "Grid to Voxel" feature, providing you with the ability to easily convert between grids and voxels.Language and Help AccessibilityNew language interfaceRussian and simplified Chinese language versions of Oasis montaj 7.3 are available. All the interface and online help files have been translated for each language version.Improved Application Help∙Help topics are now organized around workflows associated with the specific Geosoft Data Processing Sequence steps (Prepare, Import, Edit, Process, etc.)and conveniently display topics by information type (Concept, Procedure, and Reference).∙The Help system launches as a browser window in the new and improved WebHelp format, featuring appealing formatting and visuals consistent withour Geosoft branding.∙Breadcrumbs added to the topic to assist in easy navigation and Help topics and specific search queries can now be tagged as Favourites.Updated help topics can now be sent as part of software resource updates, ensuringyou have the latest help content.ArcGIS 10 SupportSupport for ArcGIS 10 file formatsThis release leverages ArcEngine 10, enabling you to manage and share Esri ArcGIS10 file formats including: geodatabase, MXD, and LYR files.DrillholeAdditional subsurface profiles in sectionsIncreased the number of profiles that can be displayed in drillhole section maps. You can now plot up to eight subsurface geologic contacts as profiles on a section map.Improved drillhole label placementDrillhole collar labels are now supported in eight positions around the collar, providing more flexibility with the appearance of your map. Labels can be oriented horizontally on the map or perpendicular to the trace.New scaling options for downhole dataAdded a log scale option to drillhole data bar plots and profiles. Also added the ability to scale based on only the holes in a section, rather than all selected holes. Improves presentation of data values that are naturally log-distributed (such as geochemical data) and provides more flexibility in data scaling.Improved drillhole planning toolsNew interactive drillhole planning tool can be used to draw a proposed hole on a plan or section map, or to calculate the hole collar location based on target location.Drillhole trace coloursAdded an option to colour the drillhole traces based on text values such as drillhole status. This is helpful when you want to make proposed holes in a different colour from completed holes.Drillhole reportNew drillhole report creates an ASCII file summarizing all holes which correspond to a selected attribute such as drillhole status. This means you can create a report of all your planned holes, and include the total length of all holes in the report.GM-SYS ProfileGM-SYS Profile is an extension for Oasis montaj. Oasis montaj version 7.3 includes important advancements that improve access to data and information, and expand 3D subsurface visualisation and analysis capabilities. The 7.3 release also contains many new features and enhancements for the GM-SYS Profile and the other Oasis montaj extensions. The new capabilities for GM-SYS Profile are provided below. Full release notes and downloads.GM-SYS ProfileObservations and calculations at arbitrary (x,y) locationsWith this release we've added support for observations and calculations for points not located on the plane of the model (Y=0). The results are more accurate as the actual observation locations are used and the calculations are no longer approximations from the plane.Plot station locations in Plan ViewWe have improved the plan view to now display the actual location of calculation stations, relative to model boundaries. This is now necessary as the points are not required to be along the profile at Y=0.Support "dummy" observed dataSupport for "dummy" observed data is a new feature available in this release. This eliminates the need to generate “fake” observations in order to calculate a respons e at locations where no observations are available.Convert skewed models to equivalent geometry with stations off-sectionWe calculate a new model coordinate system that is orthogonal to model strike and adjust the apparent station locations to maintain their true positions. All models now have a "normal" coordinate system that maps 1:1 with any other coordinate system.Convert from MDI to SDI applicationTo improve usability, we now allow only one model per GM-SYS Profile instance,instead of multiple models. Opening a new model creates a new instance in a new window. This approach is more intuitive, simplifies cursor tracking between GM-SYS and Oasis montaj and is consistent with other Oasis montaj views: grid, map, and voxel.Obs/Calc stations decoupled from the modelWe have logically isolated the model description (geometry and properties) from the survey data (observations and field parameters). This will make it easier to support multiple surveys per model (e.g. regional magnetic survey and high-res survey locally).Tie background properties and Earth's field info to survey dataWe have improved the way data is organized by keeping the survey-specific information with the survey data. For instance, Earth’s field parameters are stored with the observed magnetic data. Reduction density is stored with the observed gravity data. This makes it easier to support multiple surveys per model and easily import new survey data.Call IGRFPT to calculate Earth's field infoWe've added the ability to calculate the Earth's Field parameters within the application, to give a more natural data experience.Steamline new model creationIn this release we've provided you with more control over the location and orientation of the model being built. Being able to create a model from available topographic and geographic information, instead of tying it to a survey location provides a more natural workflow.Import observed data from databaseTo address the challenge using intermediate text files for transferring data we have added the capability to import survey data directly from a database into a model.Import horizons from a databaseWe have added the ability to import horizon geometry from a database channel. This removes the need for intermediate text files for transfer of horizon data between Oasis montaj and GM-SYS.Support data imports from other coordinate systemsGM-SYS Profile can now import data from any coordinate system that Oasis montajsupports.Export resampled model horizons to XYZUsers can now export all of the “Named” horizons from a model to an XYZ file suitable for import into Oasis montaj. The result is a streamlined process for building GM-SYS 3D models from GM-SYS 2D profiles.Export selected Plan View extents as a polygonWith this release you can now export a polygon that defines an area of interest in a model, based on the Plan View extents. This is a useful tool for masking external data (e.g. wells or depth-to-basement picks) in Oasis montaj. It's a necessary step prior to importing external data directly from databases in an intuitive way.GM-SYS 3D ModellingGM-SYS 3D is an extension for Oasis montaj. Oasis montaj version 7.3 includes important advancements that improve access to data and information, and expand 3Dsubsurface visualisation and analysis capabilities. There are no new features in this release specifically for GM-SYS 3D. The 7.3 release contains new features and enhancements for the GM-SYS Profile and other Oasis montaj extensions. Full release notes and downloads.Release 7.3There are no new features in this release specifically for GM-SYS 3D. The 7.3 release contains new features and enhancements for GM-SYS Profile, MAGMAP and other Oasis montaj extensions. Full release notes and downloadsRelease 7.2 Enhancements for GM-SYS 3D ModellingDraped surface FFT gravity calculationsWe have removed the limitation that required upward-continuation of your data to a constant elevation. GM-SYS 3D will now calculate the gravity response of a model on a draped surface, typically topography. This new capability allows for a more accurate and detailed modelMenu changesTo improve your workflow the GM-SYS 3D menu has been reorganized into two separate menus. GM-SYS 3D: contains model creation and basic model manipulation including open/close/export functionality. GM-SYS 3D Tools: contains the editing, display, and calculation capabilities.Space-domain vertical prism calculation utilities (Gbox and MBox)This new utility allows you to perform forward calculations for simple vertical prisms. This in an implementation of Blakely's GBox (Gravity) and MBox (Magnetic) forward calculations for testing simple theoretical models.SEG-Y ReaderImproved XML ConfigurationSEG-Y Reader now saves the configuration data in Geosoft-standard XML Metadataformat allowing the SEG-Y Reader to automatically recognize the file format and load it. Making it faster and easier to work with SEG-Y files.Induced PolarisationQC channel separationWe have added a second Quality Control (QC) channel. The chargeability and resistivity now each have their own dedicated QC channels. This provides better quality control flexibility, as the chargeability and resistivity manifest noise at different segments of a cycle they require separate QC channels.Improved workflowIP surveys produce many fields, and as a result, when you import the survey data, numerous channels are created and displayed in the Geosoft database (GDB). Displaying all these channels can make the database window look overcrowded With this release We have added customisable channel display on import so you can display only the channels you are interested in.Zonge import updateWe now support the import of the IP_A VG channel for Zonge FLD data.Schlumberger format supportThe Schlumberger data format is now supported in the IP system.Update Variable a spacingWe have corrected a pseudosection positioning error for variable 'a' electrode spacing. Support for 3D IPNow support the import and quality control of 3D Induced Polarisation data. MAGMAP FilteringBandpass Tapered FiltersWe have added the Cosine and the Butterworth band pass filters. The tapered filters reduce the artefacts due to the discontinuity of the straight bandpass filter.Differential Reduction to the PoleAdded the Differential Reduction to the Pole filter. This is helpful for grids of regional scale, which span degrees of latitude and longitude.Notch FilterWe have added a Notch filter that rejects a specific wavenumber band typically usedto attenuate systematic noise that interferes with the geophysical signature of interest.Convert from Pole to any inc/decAdded the reverse of a Reduction to the Pole filter. Given magnetic data as it isrepresented at the magnetic pole, a magnetic grid can be translated to any givenInclination and Declination.DAPStreamlined Data ManagementDAP data management tasks have been significantly updated to streamline many of the tasks involved in verifying and publishing exploration datasets. Datasets are now verified immediately when uploaded, resulting in a very fast publishing experience. Other data administration tasks have been dramatically improved such as setting security permissions and copyright notices to datasets has been streamlined to be faster and easier.DAP administration web applicationThe DAP administrator application and user interface is now accessed via a browser based web portal. Administrators no longer need to install an application, login to the DAP Server, or have access to a computer with a high bandwidth connection. It is significantly easier for DAP administrators to manage multiple servers in differentregions.DAP Catalog SQL server DatabaseThe DAP catalog and metadata are now tightly integrated and managed together in a single SQL server database. This not only facilitates reporting on who accesses what datasets, it is also an important direction for future improvements.Managed Exploration Information RepositoryDAP datasets are stored in a Managed Exploration Information Repository, and dataset management is now accomplished via the web based DAP Administration Portal. The physical location of the exploration datasets are always synchronized with the DAP Catalog. This eliminates the need for the DAP data manager to directly access the data repository or use other tools such as Windows Explorer that can potentially cause the DAP Catalog and the datasets to become out of sync.Simplified ArchitectureWith this release we have simplified the setup and security of the DAP Server. The DAP data manager can now access all settings in one convenient and easy-to-uselocation.Data PackageWith this release we have added the ability for the DAP Data Manager to be able to filter, organize and create a zipped subset of data, including the organizational hierarchy as a file structure. This data can then be removed from the managed data repository and shared with partners or external organizations.Index MapDAP data managers can now create an Index Map shapefile containing bounding box outlines and structured metadata query fields for all or select datasets managed within the DAP server. This provides yet another view of the information managed within a DAP server.ReportsThe DAP data manager can now quickly and easily view and track the data that has been uploaded by dataset type and how users are using the managed datasets.Support for ESRI 10DAP data managers can now publish ArcGIS v10 Layer (.LYR) file and Map Services.Web-based Metadata EditorDAP data Managers can now edit metadata of a dataset in the Managed Exploration Data Repository via the DAP administration web application.Flexible Presentation HierarchyDAP data managers can now organize data using a defined "folder structure" or using metadata fields to create a folder-like hierarchy. The DAP data managers can easily update the presentation hierarchy without having to un-catalog and re-catalog datasets, or re-organize files on the DAP Server data repository, saving time and effort.Simplified Security ModelData access is controlled using a security model based on groups. The DAP data managers can create security groups based on Active Directory groups and users. In this way, Active Directory will be indirectly supported, and other security models can be added in the future。
用于地下勘探的软件-Geosoft

用于地下勘探的软件w w w.g e o s o f t.c o m导入数据并进行质量控制创建栅状图创建地表网格图和等值线图和 DEM 数据集成创建条带录井图地质体元三维图创建多个断面图Target 地球化学模块提供用于地表、地下地球化学数据处理的 QA/QC 工具、分析工具和高级成图技术。
易于使用的标准样本和副样本处理流程简化了质量控制过程。
由于使用了交互的统计直方图、散点图、概率图和三端元图来鉴别出露地层和分布范围,多元素地球化学分析变的更简单了。
这个扩展模块还包括 SEMPlot ,这是一种易于使用的工作流程,可以在金刚石矿勘探中进行指示矿物颗粒的地球化学分析。
使用 Target ,可以轻松把您所有的地表地下勘探数据进行集成和可视化。
一次性快速处理数千个钻孔的数据。
在数分钟之内创建或重新创建断面图。
生成具专业品质的地质图,并把地球物理信息、地球化学信息和地质信息全部集成在其中。
主要功能在条带录井图、断面图或三维图中显示您的数据生成断面图、平面图或等值面图Target 是一款为从基础钻探项目到开采钻探项目提供全面解决方案的基本勘探软件。
对于与多学科数据、地质数据、地球化学数据和地球物理数据打交道的地球勘探家们来说,Target™ 软件是最佳选择,它建立在 Geosoft ® Oasis montaj™ 软件平台基础之上,而后者是用于处理勘探地球科学数据的工业标准。
您可以用功能全面的 Geosoft 地球化学扩展模块来扩充您的 T arget 软件。
T arget 地球化学模块提供了一个全面的地球化学解决方案,包括从原始数据的导入、质量分析/质量控制 (QA/QC)、成图到高级统计分析功能。
“Geosoft 公司的 Target 软件提供了出色的可视化功能,可以浏览和展示我们作为地质学家所做的一切工作。
我们发现 Target 的条带录井图功能是一个非常有效的工具,可以在一个页面中为潜在投资者展示钻孔数据和透视的整体情况”。
基于Oasis Montaj 平台的航空物探数据处理软件系统
基于Oasis Montaj 平台的航空物探数据处理软件系统胥值礼;孟庆敏;李文杰;崔志强【摘要】在深入研究Oasis Montaj 平台特点的基础上,对已有的处理功能进行移植、优化,并开发了新的功能,集成为航空物探数据处理软件系统。
这里就系统的整体架构、主要功能及其实现方法进行了详细介绍。
通过大量的数据处理证明了该系统具有集成度高、实用性强、运行效率高、稳定性强、易操作、容错性强等诸多优势,能极大地提高数据处理的效率和质量。
%Based on the analysis on the characteristics of the Oasis Montaj platform in detail,it is transplanted and optimized some existing programs in Oasis Montaj platform.We developed some new programs,and integrated them with Oasis Montaj platform,and finally formed the aerogeophysical data processing software system.In this paper,we introduced the system framework,major functions and implement methods.The processing of a huge mass of data shows the system is practical,high-efficiency,stable,easy to operate,high-integration,strong fault tolerance,etc.and it can greatly improve the efficiency and quality of data processing.【期刊名称】《物探化探计算技术》【年(卷),期】2014(000)003【总页数】5页(P257-261)【关键词】航空物探;数据处理;软件系统;软件开发;Oasis Montaj 平台【作者】胥值礼;孟庆敏;李文杰;崔志强【作者单位】中国地质科学院地球物理地球化学勘查研究所,廊坊 065000;中国地质科学院地球物理地球化学勘查研究所,廊坊 065000;中国地质科学院地球物理地球化学勘查研究所,廊坊 065000;中国地质科学院地球物理地球化学勘查研究所,廊坊 065000【正文语种】中文【中图分类】TP3110 前言航空物探具有效率高、成本较低、适用于大面积快速勘查等优点,它可为矿产资源、油气资源、海洋地质、地下水资源、工程地质与环境,基础地质、军事与国防等方面提供大量信息。
Geosoft 地球软件 Gravity and Terrain Correction How-To

montaj Gravity and Terrain Correction How-To GuideSetting Up and Importing Gravity and Terrain DataThe Setting Up and Importing Gravity and Terrain Data How-To Guide will guide you through the options of setting theproject information and processing parameters,as well as importing data for a typical gravity survey.The procedures in this guide include:Set Project InformationImport Base Station DataSave Database ChangesImport Location DataImport Survey DataSet Processing Parameters(Optional)Geosoft provides sample data for you to use when working through these How-To Guides.These data files can be found in your"...\Geosoft\resourcefiles\data\gravity"folder.Set Project InformationWhen you begin a new gravity project,you may want to include information about the project with your data and maps.The Project Information dialog enables you to specify information such as:the company,project name,a project description, scientist name,project date,and any additional comments.This information is stored with the project and is used later for mapping.To Set Project Information1.On the Gravity menu,select Project Information.The Project information dialog appears.2.Type the project information in the parameter boxes provided.You can add additional comments to your project by clicking the Comments button.You will be asked toselect a default text editor,if you haven't done so already.3.Click OK when you are finished to save the Project information with your current project.Import DataOnce you have set your project information,you are ready to import your gravity data into a Geosoft database forprocessing.You will need to import three types of data,base station data,survey location data,and instrument survey readings.For the purposes of this guide,we will demonstrateimporting CG5data.Any data you want to import into the montaj Gravity and Terrain Correction system must first be formatted as aCSV file or an Oasis database file (*.gdb).Your base station data and survey location data should be imported as separate CSV files.Base Station DataBelow is the required format (channel header cells)for thebase station data.Be aware that if you import repeat elevations,only the first is usedduring drift corrections.Survey Location DataBelow is the required format (channel header cells)for the survey locationdata (survey stations).CG5Dump DataBelow is an example of the preferred format for CG5.The CG5CSV dump file has columns for GRAV,TIDE,and TERRAIN.The Gravity and Terrain Correction extension imports the "ALT"channel and reads it as “height”.Upon import you should correct the height channel for the true instrument height (base plate height plus a (normally)constant value for the sensor height above the base (0.089m)).The CG5import will make use of the GRAV and TIDE columns.The TIDE column is subtracted from the GRAV reading and imported as the “Reading”column.Alternatively select to import as ETC.The system does not use the TiltX,TiltY,S.D.,Dur,or Rej fields,as these fields are related to the acquisition quality of the data.However,the SD field is imported to the survey database for quality control purposes.The "Station"channel or the "Line"and "Station"channels of the gravity database are used to look-up location information from the location database.The location data will be placed in the appropriate columns of the gravity database.Import Base Station DataThe first set of data to import is the base station data.This involves two steps.First,you must create a new database or open an existing one.Then,import the data from a CSV fileinto the database.If you need to edit the CSV file before importing,select the 'Edit Base Station File'option on the 'Gravity|Basemontaj Gravity and Terrain Correction How-To Guidestations'menu.Your base station data should include the following columns:station number,gravity reading,longitude,latitude and elevation.To Import a Base Station File1.On the Gravity menu,select Base Stations and then select Open/Create Base Station Database.The Open/create a basestation database dialog appears.2.Specify a new Base station database name,or you can usethe default name,“Base_station.”To import data into an existing database,use the Browse button to locate the database file.3.Click OK.A dialog appears which asks you to confirm that you want to createa new database.4.To accept the database name,click the Yes button.TheLoad data?dialog appears.5.This dialog asks if you want to load(import)gravity data from a file or database into the newly created database.Click Yes.The Import/merge base station data dialog appears.montaj Gravity and Terrain Correction How-To Guide6.Browse to select the Base station database file you want to import the data into.7.From the Base station data source dropdown list,select Text data file orGeosoft database.In our example we are going to select,"Text data file"as our Base station data source.8.Click Next.For our example,the Load base station data from text datafile dialog appears. 9.Browse to select the Base file to load.10.Click OK.The data is imported into the database and displayedin a spreadsheet window.The base station gravity reading does not necessarily need to be a measured absolute gravity value,unlessthe intention is to tie the survey to other gravity network data.Import LocationsThe survey location data are used to establish the location of the survey on the earth.The system requires location information in both long/lat and XY coordinate systems for latitude corrections,merging,and mapping procedures.The latitude values are used for the latitude correction and the long/lat values are used for mapping and the XY coordinates are used for merging the gravity survey information.For this reason,the procedure for importing location data has two objectives.The first is to create a database and import a location data file.The second goal is to generate XY coordinates from long/lat coordinates(or long/lat from XY,depending on the original survey projection).To accomplish these objectives,the process requires three separate procedures.The first procedure is to create a database and import a locations data file.The second procedure is to define a starting projection for the database you created in step1.The final procedure is to define a destination projection.Together,steps2and3enable you to generate XY coordinates from long/lat data or long/lat coordinates from XY data.Import Location Data into DatabaseThe first step is to import location data(in*.CSV format)intoa Geosoft database file.To import location data,you will need the location coordinates in a CSV text file.You can create this file using a text editor or a spreadsheet program like Excel.montaj Gravity and Terrain Correction How-To GuideTo Import Location Data into a Database1.On the Gravity menu,select Locations and then select Open/Create Location Database .The Open/create a locationdatabase dialog appears.2.Specifythe Location database name.When creating a new location database,the new database will include "Station","Longitude","Latitude","X","Y"and "Elevation"channels.You will have the option to load existing location data from another database or a text file..3.Click OK .A dialog asks you to confirm that you want to create a newdatabase with this name.4.Click Yes to confirm.The Load data?dialog appears.This dialog asks if you want to load location data froma file or database.5.Click Yes to accept.The Import/mergelocation data dialog appears.montaj Gravity and Terrain Correction How-To Guide6.By default,your new location database name should be displayed,if not,use the Browse button to select theLocation database.7.From the Location data source dropdown list,you can select either,Text data fileorGeosoft database.In our example we are going to select,"Text data file"as our Location data source.8.Click Next.The Load location data from text datafile dialog appears.9.Browse to select the Location file to load.10.Click OK to import the data.The new database is displayed and includes the Station,Elevation,Longitude,Latitude,XandY channels.In our example the Long/Lat coordinate channels contain dummy values because the data are only projected asUTM coordinates.The next procedure(step2)will demonstrate how to create Long/Lat coordinates from XYprojected data.You can also create XY projected data from Long/Lat coordinate data.Define a Coordinate System for XY and Long Lat Location DataIn the previous step we imported the location data into a Geosoft database.The next step is to define the projection for the current X,Y database values and then to define the geographic(long/lat)projection.To Define a Coordinate System for X,Y and Long Lat Location Data1.On the Gravity menu,select Locations and then select X,Y-->Longitude,Latitude.The Convert map(X,Y)to(Longitude,Latitude)dialog appears.2.From the dropdown list,select the Conversion method as"Local coordinate system"or"Projected coordinatesystem".3.Click OK.The Enter existing coordinate channels dialog appears.montaj Gravity and Terrain Correction How-To Guideing the dropdown lists,select the Current channels.5.Then,use the Process dropdown list to select to process"All lines/groups"or"Selected lines/groups".6.Click Next.The Coordinate System dialog is displayed showing all the known projection informationfor the X,Y database. 7.In this dialog,you can specify the Coordinate system(ensure that the Projected(x,y)radio button is selected),aswell as the Projection method,the Datum,the Local datum transform,and the units ofmeasurementfor Length.For more information on the Coordinate System parameters,click the Help button on the Coordinate Systemdialog.8.Click OK.The Create new coordinate channels dialog appears.montaj Gravity and Terrain Correction How-To Guidemontaj Gravity and Terrain Correction How-To Guideing the dropdown lists,select the New X/Longitude channel and the Y/Latitude channel10.Click Next.The Coordinate System dialog is again displayed,showing all the known projection information for theradio button is selected).new coordinate channels for the Long/Lat coordinates(ensure that the Geographic(long,lat) Array11.Make any necessary changes and click OK.12.The latitude and longitude coordinates are calculated and displayed in the Locations database.Save Database ChangesAfter importing data into a database,it is always a good idea to save your changes to avoid having to import the data again if something goes wrong.To Save Database Changes1.On the Database menu,click Save Database Changes(or from the Standard Bar,select the Save DatabaseChanges icon().The Save Changes dialog is displayed.2.Click Yes tosave your changes.You can use the Database|Discard Database Changes menu option(or select the Discard Database Changes icon())to revert your database back to the last saved version.Import Gravity Survey Data FilesOnce you have your base station and location data imported into a database,you are ready to import your gravity survey files.The example procedure below will lead you through importing a gravity instrument dump file from aScintrex CG5gravimeter.If you want to download a CG3file directly from the instrument,select the Download CG3file option from the "Gravity|Import"menu.To Import a Survey File1.On the Gravity menu,select Import and then select Import Gravity Survey.The Import a gravity file into anew database dialog appears.ing the File type dropdown list,selectthe datafile type.In our example we selected the"Scintrex CG5dump"file type.3.Browse to select the Survey data file for import.montaj Gravity and Terrain Correction How-To Guide4.Click the OK button.The Import aCG3/CG5file dialog appears.5.Select Use CG3.CG5ETC from the dropdown list,to import and use the ETC data stored in the dump file as the tidecorrection value.Select Calculate to usethe Drift Correction method.For more information on the ETC data and the Drift Correction method,click the Help button on the Import aCG3/CG5file dialog.7.Click the OK button and theSurvey parameters dialog appears.The Survey parameters dialog includes information about the survey you just imported as well as global settings such as the base station and location databases.The project remembers all of the information in this dialog.If an import file is missing information,the project will use this stored information to fill in the default values.montaj Gravity and Terrain Correction How-To GuideYou can view the Global Project Parameters at any time by selecting the "Processing Parameters"option onthe Gravity menu.8.If your survey data were collected using an instrument that requires a Instrument scale factor for calibration,you can specify this information in the Instrument scale factor box .Note that,the default setting is to leave the box empty,which means that no scale factor is applied.9.If necessary,you can specify the time difference Hours to GMT (+in W)between the time recorded in the surveydatabase and GMT.This is a positive number in the Western Hemisphere. If this field is left blank,no correction is applied.10.The Latitude correction and Free-air correction text boxes enable you to select the gravity formula you want to use forthe latitude and free air corrections.Select a formula from the dropdown lists.11.Click OK .The survey information from the dump file is imported to your newsurvey database file.If your CG5survey file covers the same stations twice (and using the same base stations)but at different timeand days,you need to consider your drift corrections.After importing,you should split your survey database into two surveys to apply the drift correction,since thedrift calculation does not take into account different dates.The linear drift calculation for a base station on day 1may well be different to a linear drift calculated for day 2,and hence it is best practice to split the different survey days into separate survey databases for the drift correction.We do,however,apply Earth tide corrections based on time and date.Understand the Survey DatabaseNow that you have imported survey data into a database and displayed it in a spreadsheet window,you will notice that there are several channels other than your station,date,time,and reading channels.The "Station"channel or the "Line"and "Station"channels of the gravity database are used to look-up location information from the location database.The location data will be placed in the appropriate columns of the gravity database.Both station and line are used to assign the coordinates.You should compile a locations csv to import consisting of Station,Line,Long,Lat (+\-X,Y)The Type channel is only used for merging survey databases into a master database.Only type 1channels are included in the master database.You can exclude specific stations from being merged into the master database by changing their type to 0.Base stations are not imported into the master database.The Height channel is used as the instrument height correction,so it should represent the height above ground from which the measurement is taken.Geosoft imports the Alt channel (from CG5dump file)and reads it as “height”.Some users record base plate height and put this in the column.Upon import the user should correct the height channel for the true instrument height (base plate height plus a (normally)constant value for the sensor height above the base (i.e.0.089m for the CG5plate).If the user reports another unknown parameter into the Alt channel,be aware it willbe imported as “Height”.In consideration of the daily instrument drift,if your survey data was acquired over more than one day,it is best practice to split the different survey days into separate databases,to properly apply the instrument drift correction.Set Processing Parameters (Optional)The Global survey parameters dialog enables you to view and modify the parameters of your gravity project or of an individual gravity survey database.montaj Gravity and Terrain Correction How-To GuideTo Set the Processing Parameters:1.On the Gravity menu,select Processing Parameters .The Globalsurvey parametersdialog appears.If the current database is a "Single Survey Database"(data imported from a single gravity instrument dump file or from a single "day"survey file),you will be presented with the Survey Parameters dialog (seeprevious step),otherwise you will see the Global Survey Parameters dialog.The Survey Parameters dialog includes both survey specific parameters together with "Global"parameters that apply to the entire project.2.The following parameters can be viewed and/or modified on the Global survey parameters dialog;Base stationdatabase,Location database,Latitude correction (equation to use),Free-air correction,Earth density,Water density,Ice density and Survey type (Ground,Shipborne,or Airborne).3.These parameters are linked to the rest of the dialog boxes and will be filled in as you go through the process.Youcan use the Global survey parameters dialog to specify all your files and settings before you start processing.You can also use this dialog as a reference to check what your current settings are.This will save you typing them in later.This information is stored with the project.4.Click OK to save these parameters with the current project.How-To Guide Publication Date:11/06/2015Copyright 2015Geosoft Inc.All rights reserved.montaj Gravity and Terrain Correction How-To Guide。
Geosoft-Oasis montaj应用--How-To_Filter_A_Voxel

Oasis montaj How-To Guide 3D Voxel Utilities-Filter a VoxelThe software described in this manual is furnished under license and may only be used or copied in accordance with the terms of the license.Manual release date:April-17-12.Please send comments or questions to info@©2012Geosoft Inc.All rights reserved.Geosoft is a registered trademark and Oasis montaj is a registered trademark of Geosoft Inc.Other brand and product names mentioned herein are properties of their respective trademark owners.No part of this publication may be reproduced,stored in a retrieval system or transmitted,in any form,or by any means,electronic,mechanical,photocopying,reading,or otherwise,without prior consent from Geosoft Inc.The software described in this manual is furnished under license and may only be used or copied in accordance with the terms of the license.OM.h.2012.04Windows™,and Windows NT are either registered trademarks or trademarks of Microsoft Corporation.Geosoft IncorporatedQueen’s Quay Terminal207Queen’s Quay WestSuite810,PO Box131Toronto,OntarioM5J1A7CanadaTel:(416)369-0111Fax:(416)369-9599Website:E-mail:info@SupportFor obtaining technical support,email support@If you wish to speak to a technical support representative in your region,please visit the Geosoft Support page at:/about-geosoft/contact-us/world-offices for contact information.Spatial convolution filters can be applied to an existing voxel.Three3x3x3convolution filters are supplied.You can also save a custom filter in a file and apply it to a voxel.The supplied filters are:The Smoothing filter,useful for spatially smoothing3D measured or calculated data.The Laplace filter,useful for emphasizing areas of rapid intensity changes.The Total Gradient filter,useful for delineating rock unit/contact boundaries.To Smooth a Voxel1.From the3D menu,select Voxel Utilities|Filter a Voxel.The Filter a Voxel dialog opens.e the button next to the Input Voxel field to select the voxel to filter.3.Provide the name of the Output Voxel.If the selected file already exists,you will be prompted toeither enter a different name or overwrite the existing file.4.From the drop down list of filters,select the Smoothing filter.5.Enter the desired number of passes of the smoothing filter.The larger the number of passes,the smoother the outcome.6.Select Dummy for the handling of the edges of the voxel.7.Click OK and the filtered voxel willappear.How to Filter a VoxelTo Smooth a VoxelHow to Filter a VoxelTo Emphasize the Areas of Rapid ChangeIn each direction,the convolution operation requires3consecutive data points to apply the filter.The outcome of the operation will be located on the central point.Thus,the filtering of the edgepoints can be approached in2different ways:on output,the edge points are truncated because in at least one direction,they are missing avalid data point,the next point adjacent to each end point is first extrapolated using valid data,after which thefilter is applied,and the output voxel will be of the same size as the input voxel.A linearinterpolation is performed for the inside dummy points and the nearest valid point is assignedfor exterior extrapolation.The supplied Geosoft filters have the extension flt3d and are installed in the Geosoft\Oasismontaj\etc directory.The convolution filter coefficients are supplied in the increasing order of X,then Y,and finally Z.In analogy to the supplied filter format,you can create your own custom filter.This filter canreside in any directory,however if you intend to use it in other projects,we recommend to save itin the directory Geosoft\Oasis montaj\user\etc.To Emphasize the Areas of Rapid Change1.Follow steps1,2,3from the smooth a voxel procedure.2.From the drop down list of filters,select the Laplace filter.Although you can enter up to3passes of the Laplace filter-since this filter accentuatesthe local variations-it is recommended not to go above1pass unless you have acompelling reason to do so.3.Select Interpolate for the handling of the edges of the voxel.4.Click OK and the filtered voxel willappear.The visible edge effect of the Laplace Voxel is due to the fact that on the outside,the nearest neighbour value is assigned to extend thevoxel.If you find excessive noise in the Laplace voxel,you can apply a smoothing filter to the Laplace Voxel to smooth out the noise.To Apply a Gradient Filter1.Follow steps 1,2,3from the smooth a voxel procedure.2.From the drop down list of filters,select the Total Gradient filter.3.You will notice that only one pass of the Total Gradient convolution filter can be applied.4.Select Interpolate for the handling of the edges of thevoxel.How to Filter a VoxelTo Apply a Gradient FilterHow to Filter a VoxelTo Apply a Gradient Filter 5.Click OK and the filtered voxel will appear.。
Geosoft软件的开发与应用
目录绪论 (1)1 Geosoft简介 (3)1.1 正反演模拟 (4)1.2 网格化、滤波、基底深度模拟 (4)1.3 数据的可视化及解释 (5)1.4 数据的无缝整合 (6)2 Geosoft软件开发 (7)2.1 Geosoft的成图准备工作 (7)2.2 Geosoft的成图步骤 (8)3 Geosoft软件应用 (11)3.1 Geosoft软件成图过程 (11)3.2 Geosoft与WinGLink结果比较 (14)3.3 三维表面图 (17)结论 (19)致谢 (20)参考文献 (21)绪论Geosoft软件在世界范围内得到了各著名矿业公司、油气公司、勘探公司、咨询公司和政府部门的一致认可和长期使用,是非地震勘探领域(物探、化探、航测、钻探)数据处理和成图的权威软件。
国内一些著名勘探公司、油气公司、科研院所和政府地质部门也是Geosoft软件的长期用户,如中国地调局、国土资源部航测遥感中心(AGRS)(五套)、中国地质科学院矿产资源所 (CAGS)(两套)、大庆油田物探公司、东方地球物理公司物化探事业部、北京大学、必和必拓矿业集团中国分公司、力拓工业矿物勘探集团中国分公司等。
Geosoft软件主要包括Oasis montaj平台及有关模块。
Oasis montaj提供了一个完全的数据技术方案,包括数据存取、处理、解释、数据共享和做出决策。
Oasis montaj平台可以创建精密复杂的视图以指导地下勘探,创建包含复杂三维地球模型的专业品质的地质图。
其主要包括专业的成图技术;地下3D可视化,简化了对数据的浏览和分析过程;无缝链接;通过动态链接精确定位地图数据;领先的网格化功能;高性能的数据库。
《综合应用地质、地理、地球化学成像信息进行矿产资源勘探》[1]说明了Geosoft’s Oasis montaj在实现端对端的数据验证、处理、分析、综合及解释方面的应用情况。
Geosoft 软件还可以用内置的 ER Mapper 成像插件对图像进行综合分析。
Geosoft-Oasis montaj 中文操作手册
软件平台
北京迈勤能源技术服务有限公司
北京迈勤能源技术服务有限公司
Oasis montaj 软件taj 软件简介 ..................................................................................................... 1 Oasis montaj 软件模块简介 ............................................................................................. 2 Oasis Montaj Mapping and Processing(软件平台) ..................................................... 9 3.1 新建工程................................................................................................................... 9 3.2 中英文切换............................................................................................................. 11 3.3 新建数据库............................................................................................................. 12 3.3.1 直接加载 Database 文件 .......
Oasis_montaj_Seeker

Oasis montaj How-To GuideOasis montaj中的Geosoft Seeker工具Geosoft Seeker工具设计用于帮助您下载存储在包括Geosoft DAP服务器和WMS服务器在内的全球和企业空间服务器上的数据,以及通过Dapple搜索服务和Desktop Cataloger空间数据检索本地化发现的数据。
在搜索数据菜单中选择Seeker,打开Seeker并找到相关的勘探数据。
使用Seeker工具的步骤:1. 搜索 – 使用搜索工具定义您要搜索的空间和文本条件。
2. 结果 –以快速缩略视图的方式或在地理环境下使用预览图预览数据集并查看元数据。
3. 下载 – 将所选的数据集直接下载到工程中。
搜索数据Seeker让您能够以3个简单步骤查找、查看和下载数据集。
第一步是查询服务器列表,以确定匹配目标区域(AOI)的可用数据。
可用数据源包括DAP服务器、WMS服务器、Dapple搜索数据服务器和Desktop Cataloger索引的本地数据。
在打开Seeker时,初始搜索范围基于当前打开的图。
如果没有打开图,目标区域(AOI)就是整个世界。
要通过元数据缩窄结果,请单击高级搜素选项卡。
Oasis montaj How-To Guide搜索工具包括服务器列表、文本搜索、目标区域和高级搜索。
使用搜索工具1. 在搜索数据菜单上选择Seeker。
Seeker工具打开,系统显示搜索页面。
如果窗口中显示的目标区域和打开的图中不同,单击从当前图范围更新目标区域按钮()2. 收窄您的搜索。
有几种方法将搜索收窄到指定的区域或数据类型:在文本搜索文本框中指定关键词或短语,这样数据集只有与目标区域相交和/或包含与文本字串匹配的文本才会被显示。
可以键入多个词和使用通配符 (*)及逻辑算子(AND、OR和AND NOT)。
完成文本搜索框填写后,单击结果、放大镜()或简单按Enter键,转至结果页。
地震勘探软件

Gedco.Omni.3D.Design.V8.0三维地震勘测设计
砌体建筑物地震评估 Amquake v3.8 1CD
Vista v11.0 Win32-ISO 1DVD(地震数据处理)
32、GEO-office v1.31 1CD(地震反演)
33、CSI Perform-3D v4.04 地震抵抗设计的非线性软件
34、STERA 3D v3.3 1CD(三维钢筋混凝土结构的地震反应分析)
35、EZ-FRISK v7.37 Build 002 1CD(地震危险性分析)
36、LUSAS FEA v14.1-ISO 1CD(建筑、桥梁工程分析软件,包括振型、地震、动力、大变形、疲劳分析。
37、CSI Perform 3D v4.03 1CD(地震工程静力Pushover分析和非线性动力响应时程分析)
38、Hampson.Russell.CE v8.R4.4.x86-ISO 1CD(CFD软件,用于AVO技术岩性与流体分析检测、地震反演、油藏属性参数预测、测井)
48、GEDCO Vista Seismic Processing 8.00 地震数据处理
49、Gedco.Omni.3D.Design.V8.0三维地震勘测设计
50、Interpex IXSeg2Segy v3.28 (多信道地震数据读取工具)
51、Interpex IXRefrax v1.11 (地震波分析软件)
EMIT MAXWELL 瞬变电磁数据处理软件是由澳大利亚电磁成像技术公司的商业软件,运行于WINDOWS平台下,能对频率域;时间域及航空瞬变电磁勘测数据进行建模,正演,反演,及常规成图...
GEOSOFT Oasis montaj各模块详细介绍
Oasis montaj软件各模块详细介绍Geosoft公司北京办事处目录一、 montaj地球物理模块 (1)二、 montaj地球化学模块 (7)三、 montaj钻孔成图模块 (12)四、 montaj航测遥感数据质量控制模块 (16)五、 montaj地球物理水准校正模块 (19)六、 montaj UX(未爆炸物)检测模块 (23)七、 montaj MAGMAP滤波模块 (28)八、 montaj 栅格图缝合模块 (31)九、 montaj重力/磁法解释模块 (33)十、 montaj 激发极化模块 (38)十一、 montaj 256道放射性测量数据处理模块 (41)十二、 montaj重力和地形校正模块 (43)十三、 合作伙伴开发的montaj扩展模块 (46)Oasis montaj模块介绍一、montaj地球物理模块特点说明montaj地球物理扩展模块提供了一组滤波器和统计工具,可以处理海量地球物理数据。
空间一维滤波器能让野域滤波器(线性和非线性)进行数据处理。
一维FFT滤波器可以应用多种傅里叶域滤波器对一维(线性)位场数据和其它数据进行滤波处理。
应用多种地质统计工具可以进行概要分析和高级的统计分析,包括直方图、散点图和三角剖分图分析,还可以进行基于编码或图群分类的数据子集划分。
montaj地球物理模块应用于:数据平滑处理,在平滑处理过程中,使用带有非线性滤波功能或不带有非线性滤波功能的一维空间滤波器。
实现褶积滤波,包括差分滤波、Fraser滤波、拉普拉斯滤波、低通滤波、带通滤波、高通滤波以及用户自定义滤波。
使用一维快速傅里叶滤波器(FFT)增强波长较短的数据特征。
这些滤波方法包括区域滤波、向上/向下延拓以及垂直与水平导数计算。
通过对指定的延迟数移动开始的基准点,将延迟校准加到数据道中.将场源校正应用到数据中进行系统位移,系统位移量是测线行程方向的函数。
对磁测道进行磁场基站校正。
GeoWorks地质分析软件介绍

456-H1(导) 456-H1
rs/rt rs/rt
1 501
50
1316375.06
1350
1415400.02
1400
15154250
1450 1500
0 40
3 14
刘1-33
SP
46
67
GR
43
134
14.6
1850
1835.6
7787
48.1
79
80 4.5 7
1-16
VGR
2
249
VSP
9821595.060
7 7.8
8 2..77
950
9
975
9258339.510 0.8 10111.33.172113141511.16176.2181.22981.01.11.22.1132262223.47122.582.25614.6 85 9758681.0708086.7 27
1000
700 700
725 725
750 750
775
1 1.2
774.9 2 1.6 33
8004 4.5 5ຫໍສະໝຸດ 1.7799.9825
6 4.6
824.9
900
850
7 7.8
849.9 875
925
8 6.5 190 ..95 11 2.7
874.9 12 9.1
950
975
1000
1025
1400
1050 1075 1100 1125 1150 1175
本软件支持多外部配置包括主配置包括对井符号岩性符号解释符号等的配置数据导入配置包括对导入不同种不同标准数据库数据的配置数据导出配置包括对导出数据到不同种不同标准数据库的配置尖灭线配置包括对不同尖灭类型不同尖灭形状的配置分界线配置包括对不同分界线类型不同分界线形状的配置井位图配置包括对井符号断层等值线图框图例比例尺等的配置油藏剖面图配置包括对井柱层位曲线层面尖灭断层分界线图框图例比例尺等的配置栅状图配置包括对井柱层位曲线层面尖灭断层分界线图框图例比例尺等的配置和多井对比图配置包括对井柱层位曲线层面尖灭断层分界线图框图例比例尺等的配置
- 1、下载文档前请自行甄别文档内容的完整性,平台不提供额外的编辑、内容补充、找答案等附加服务。
- 2、"仅部分预览"的文档,不可在线预览部分如存在完整性等问题,可反馈申请退款(可完整预览的文档不适用该条件!)。
- 3、如文档侵犯您的权益,请联系客服反馈,我们会尽快为您处理(人工客服工作时间:9:00-18:30)。
·容易创建,输入和输出: 图像,数据库,网格和点数据剖面
·Project Explorer用于浏览和追踪任务项目,包括数据库,网格和图像
·扩展数据处理/计算能力
·扩展图像编辑工具,包括CAD工具将解释结果绘到图像中
·支持超过2000个投影/基准面
·支持绘制自动程序任务
·E(电子)许可管理选项,包括许可浏览,升级,存放及两台电脑间传输
■□■□■□■□■□■□■□■ 长 期 有 效 □■□■□■□■□■□■□■□
动态链接
Geosoft Oasis Montaj 7.51提供各种手段动态交换数据,评估结果,将数值插入到任务周期中.采用montaj软件,地球科学家可以交互式编辑图像,将图像进行动态链接,对追踪的图像进行处理,所有这些都在一个图像环境中完成.对Geosoft Oasis Montaj 7.51中多个图形,图像,剖面,数据进行动态链接,可以对视图中的共同特性及感兴趣的区域提供快速参考.
高性能的数据库
Geosoft Oasis Montaj 7.51的高性能数据库可以储存非常大的数据,进入数据库可以看到表格窗和完整剖面显示窗口.数据库可以在每一个项目周期的每一阶段中采集,保存,处理和分析大量数据,将其可视化,并与其它数据和信息整合在一起.
快速的数据处理
montaj的处理功能可以让用户对数据进行各种滤波和处理.它可以实时地对数据进行快速评估和实验.用户可以很容易地合并数据,并能打开多个剖面窗口进行比较.它可以处理许多数据点或处理单点数据. Geosoft的高级投影功能可以提供空中投影,并能处理超过2000个基准面和投影.
使用montaj,地球科学家可以在一个完整的环境下有效地输入,观看,处理和分享地球科学数据,对数据进行网格化和成像. Geosoft Oasis Montaj 7.51软件包包括丰富的内置数据输入,处理,可视化,成像及一体化.它代表了Geosoft完整的基本和高级的网格应用和成图功能.
一系列的montaj扩展功能可以对地球物理和地球化学数据进行处理,分析及质量控制,使Geosoft Oasis Montaj 7.51成为世界上功能最强大,最完善的地球科学成图和处理系统.
自由使用的Geosoft Oasis Montaj 7.51 Viewer软件提供各种网格格式转换,可与GIS和专业化的应用软件兼容,包括矿山正演和环境软件.
Geosoft Oasis Montaj 7.51也包括Geosoft DAP客户,使用户能直接从DAP服务器在局域网或互连网上搜索和检索地质科学数据集,图形和其它图形数据.
EOSAT MSS Landsat MSS, Landsat TM
■□■□■□■□■□■□■□■□■□■□■□■□■□■□■□■□■□■□
用诚信打造我们的服务,保证给您最好的质量和信誉!
联系QQ:1140988741 电话:18980583122
联系QQ:1140988741 电话:18980583122
请按Clrt+F查找,输入具体关键字查询(不要全部输入)
GEOSOFT二进制数据文件 Flat文档数据文件
块状二进制数据文件 ODBC数据文件
ASEG GDF文件 RMS数据文件
Picodas PDAS 数据文件 USGS 数据文件
Байду номын сангаас
Montaj软件的用途:
·航空,海洋和地面重力及磁力探测数据处理,分析及质量控制
·矿产勘探及评估
·油,气储量勘探
·未******(UXO)探测
·地下地质和水文地质特性
·环境特性
·考古调查
·海洋学
Geosoft Oasis Montaj 7.51软件的特点和优点:
产生专业化图像
Geosoft Oasis Montaj 7.51的丰富的绘图能力使用户能快速方便地创建多个不同类型的图像,包括网格图像,表面图像,柱状图和地下位置图像.软件提供动态地貌的全部特性,如梯度特性和扩展标记来对专业化质量解释结果进行控制.
三维视图
Geosoft Oasis Montaj 7.51软件提供各种三维视图选项.用户可以显示多个表面,每一个有自己的地貌和容积,每一个有在三维空间中有自己的朝向.
高级网格成图能力
Geosoft Oasis Montaj 7.51的网格算子能够快速,高效,最佳地处理大体积的地质科学数据.
软件的高级网格能力使用户能内插数据,并用以下网格程序产生网格:最小曲率,双向,趋势化,梯度,平滑和克里格法.各种网格处理工具和高级网格应用工具可以增强和操纵网格.
Geosoft Oasis Montaj 7.51
Geosoft Oasis Montaj 软件是功能强大的用于地球科学调查和勘探的成图及数据处理软件。Geosoft Oasis Montaj 7.51软件能够对大量的地球物理、地球化学和地质数据进行综合、处理、可视化和比较;它能够对数据进行快速分析,以帮助用户及时解决问题并做出决定。 通过Geosoft Oasis Montaj 7.51软件地球科学家可以在一个整合的环境下有效地输入、浏览、处理和共享地球科学数据,并对数据进行网格化和成图。Geosoft Oasis Montaj 7.51软件包包括丰富的内置数据输入、处理、可视化及一体化功能。
联系QQ:1140988741 电话:18980583122
联系QQ:1140988741 电话:18980583122
请按Clrt+F查找,输入具体关键字查询(不要全部输入)
■□■□■□■□■□■□■□■ 长 期 有 效 □■□■□■□■□■□■□■□
网格和图形格式
通用网格格式(GRD),包括:
Geosoft 网格文件 Surfer网格文件(GRD)
USGS(.ddf, .dem) DEM文件
Earth Resource Mapper(ERM) Grid exchange Format(GXF)
AMIRA 格式文件
处理后的数据输入格式,包括:
Mapinfo TAB文件 ArcView图形文件
Microstation DGN文件 Maxwell Plate文件
AutoCAD DXF(DXF) Geosoft plot(PLT)
·测线和组选择选项
·支持排列道
·数值压缩能力包括逻辑算符
·对显示网格和图像的GDB点数据进行交互式链接
图像特性
·符号和剖面绘图选项
·地貌
·数据显示支持空中重新投影
·用链接阴影光标显示多个图像
·对网格和矢量组进行个别透明化设置
·全部放大和展开功能
·全部编辑多面体,线,多面线和矩形
用户可以在地形表面或数字立面图模型(DEM)网格中褶陷彩色网格或图形文件.三维技术也可以使你显示任何GEOSOFT的图集,它可以包含地形表面网格中的许多图像,符号和解释特性.
与GIS和其它专业化应用软件分享数据
各种插件和数据转换选项可将montaj成图软件和GIS及专业化的正演软件联系起来.软件插件也可用于ER Mapper 和Mapinfo软件.
通用图像格式(IMG),包括:
BMP PCX
TIF TIFF
TGA IMG
JPG J2K JPEG 2000
WPG GIX
PCD PNG
·创建阴影地貌网格
·显示网格轮廓
·网格窗口
·标准网格统计工具
高级网格应用
·网格滤波
·网格峰值
·网格布尔算子显示重叠网格或显示重叠的网格部分
·网格算数函数
·网格体积
·网格屏蔽
■□■□■□■□■□■□■□■□■□■□■□■□■□■□■□■□■□■□
用诚信打造我们的服务,保证给您最好的质量和信誉!
·编辑/移除/添加矢量组
·多面体编辑条,屏除带和编辑带
·拖动圆/椭圆及N条边的多面体
·无限制地取消/重新进行图像编辑
众多网格算法
·最小曲率法(随机)
·线性法(双向)
·趋势化网格
·平滑(自然相邻,线性,最近邻边)
·梯度网格
·克里格法
网格处理及增强工具
·交互式阴影显示
·Project Explorer工具包括3D,编辑条和图像组编辑去除/恢复功能
·数据存取工具可看数据文件特性
·创建GX来支持用户的想法和工作流程
·短切除/热键
数据特性
·数据库--适宜处理非常大容量的数据
·剖面显示方便,数据处理能力强
·各种数据显示选项
·能进行线滚动
支持的数据格式
Geosoft Oasis Montaj 7.51提供无缝输入原始空间数据和处理后的格式(网格,图像和矢量图)
空间数据输入格式,包括:
ASCII数据文件,CSV 数据库表格文件(单个或所有表格)
EXCEL表格 GEOSOFT XYZ数据文件