波粒百万高清系统工程指导
1-s2.0-S0264127516312965-main
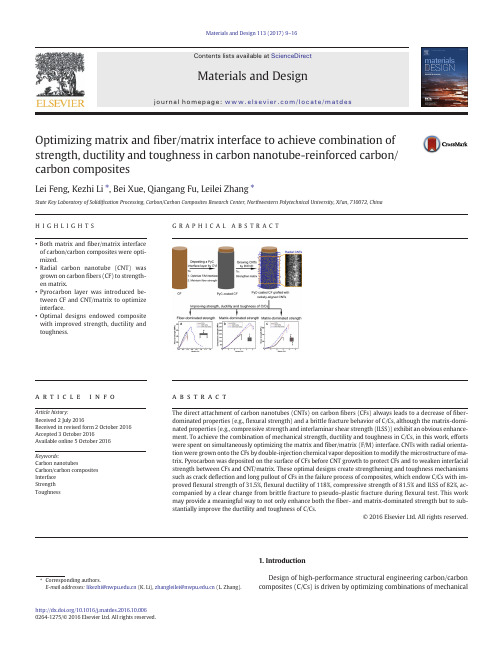
Optimizing matrix and fiber/matrix interface to achieve combination of strength,ductility and toughness in carbon nanotube-reinforced carbon/carbon compositesLei Feng,Kezhi Li ⁎,Bei Xue,Qiangang Fu,Leilei Zhang ⁎State Key Laboratory of Solidi fication Processing,Carbon/Carbon Composites Research Center,Northwestern Polytechnical University,Xi'an,710072,ChinaH I G H L I G H T S•Both matrix and fiber/matrix interface of carbon/carbon composites were opti-mized.•Radial carbon nanotube (CNT)was grown on carbon fibers (CF)to strength-en matrix.•Pyrocarbon layer was introduced be-tween CF and CNT/matrix to optimize interface.•Optimal designs endowed composite with improved strength,ductility and toughness.G R A P H I C A L A B S T R A CTa b s t r a c ta r t i c l e i n f o Article history:Received 2July 2016Received in revised form 2October 2016Accepted 3October 2016Available online 5October 2016The direct attachment of carbon nanotubes (CNTs)on carbon fibers (CFs)always leads to a decrease of fiber-dominated properties (e.g.,flexural strength)and a brittle fracture behavior of C/Cs,although the matrix-domi-nated properties (e.g.,compressive strength and interlaminar shear strength (ILSS))exhibit an obvious enhance-ment.To achieve the combination of mechanical strength,ductility and toughness in C/Cs,in this work,efforts were spent on simultaneously optimizing the matrix and fiber/matrix (F/M)Ts with radial orienta-tion were grown onto the CFs by double-injection chemical vapor deposition to modify the microstructure of ma-trix.Pyrocarbon was deposited on the surface of CFs before CNT growth to protect CFs and to weaken interfacial strength between CFs and CNT/matrix.These optimal designs create strengthening and toughness mechanisms such as crack de flection and long pullout of CFs in the failure process of composites,which endow C/Cs with im-proved flexural strength of 31.5%,flexural ductility of 118%,compressive strength of 81.5%and ILSS of 82%,ac-companied by a clear change from brittle fracture to pseudo-plastic fracture during flexural test.This work may provide a meaningful way to not only enhance both the fiber-and matrix-dominated strength but to sub-stantially improve the ductility and toughness of C/Cs.©2016Elsevier Ltd.All rights reserved.Keywords:Carbon nanotubesCarbon/carbon composites Interface Strength Toughness1.IntroductionDesign of high-performance structural engineering carbon/carbon composites (C/Cs)is driven by optimizing combinations of mechanicalMaterials and Design 113(2017)9–16⁎Corresponding authors.E-mail addresses:likezhi@ (K.Li),zhangleilei@ (L.Zhang)./10.1016/j.matdes.2016.10.0060264-1275/©2016Elsevier Ltd.All rightsreserved.Contents lists available at ScienceDirectMaterials and Designj o u r n a l h o me p a g e :ww w.e l s e v i e r.c o m /l o c a t e /m a t d e sproperties such as strength,ductility,toughness and requirements for stability and non-catastrophic failure during service[1,2].C/Cs exhibits high specific strength and modulus,however,they have weak compres-sion and interlaminar properties,lack ductility and toughness,and al-ways fail in an apparently brittle manner in unconstrained loading geometries[3–5].Recently,the huge interest in incorporating carbon nanotubes (CNTs)into structural composites have been stimulated by virtue of their extraordinary intrinsic properties,such as ultrahigh strength,ex-cellent electrical and thermal conductivities[6,7].These outstanding mechanical and physical properties,in combination with their unique 1D nanostructures with high specific surface areas,allow for efficient tailoring of both matrix microstructure andfiber/matrix(F/M)interface state[8,9].For the incorporation of CNTs into composite structures,the general trend has been focused on in situ-growth of CNTs[10–12]or attaching CNTs to the carbonfibers(CFs)[13–15].Unlike attracting CNTs which trend to lie in the plane offiber surface and thus only pro-vide one-side reinforcement to the C/Cs(just at F/M interface area), growing CNTs on the surface of CFs by catalytic chemical vapor deposi-tion(CVD)has many advantages in terms of controllability of size and orientation of CNTs,particularly a radial orientation that allows for si-multaneous reinforcements to the matrix and F/M interface[16].Excit-ing increases in matrix-dominated properties(e.g.,compressive strength and interlaminar shear strength)of C/Cs have been observed by growing CNTs onto carbonfibers[17–19].Nevertheless,there still exit some critical issues regarding the C/Cs reinforced with CVD-grown CNTs.Firstly,due to the potential damage(dissolution of metal catalysts into carbon,local oxidation and gasification)of the CFs during the growth reaction[20,21],and the difficulty of controlling the orienta-tion and uniformity of the grafted CNTs on CFs[16,22,23],the studies on the enhancements both infiber-and matrix-dominated strengths of C/ Cs have rarely been reported.Secondly and more importantly,the direct attachment of CNTs onto CF surface always result in strong F/M interfa-cial bonding and thus obstructs the crack deflection along the axis of CFs [17,23–25],which leads to the failure offiber pullout as an effective strengthening and toughening mechanism.There will be little or no property enhancement in the ductility and toughness expected in such a mode of composite failure[26,27].If CNT-reinforced C/Cs is to re-place C/Cs in industries,it is necessary to achieve the combination of global strength,ductility and toughness in C/Cs.Over the past few de-cades,however,few efforts have been spent on this issue.To improve the comprehensive mechanical performance of CNT-re-inforced C/Cs,the substantial problem and great challenge are how to moderate the F/M interfacial bonding so that it is neither too strong nor too weak and how to supply effective reinforcements to the carbon matrix without degrading thefiber strength.In this work,a thin pyrocarbon(PyC)interface layer was deposited on the surface of CFs by chemical vapor infiltration(CVI)technique to optimize the F/M in-terfacial bonding,whilst preventing the dissolution of metal catalysts into CFs occurred during the subsequent growth of CNTs.Afterwards, double-injection CVD(DICVD)technique was developed to grow radial-ly-aligned CNTs on PyC-coated CFs.The schematic of this manufacturing process is depicted in Fig.1.The hybridfiber preforms were then desifined by CVI technique to obtain thefinal CNT-reinforced C/Cs. Three-point bending,compression and interlaminar shearing tests were applied to examine the effect of these optimal designs on the me-chanical properties of C/Cs.2.Experimental2.1.Raw materialsCarbon felts(bulk density0.2g/cm3,fiber diameters6–8μm,Yixing Tianniao Co.Ltd.,China)used in this work were fabricated by alterna-tively overlapping layers of randomly oriented shortfiber bundles with needle-punching step-by-step.2.2.Deposition of PyC interface layer on CFs and the growth of CNTsCarbon felts werefirstly deposited with an interface layer of PyC by isothermal CVI technology,which was carried out at1080°C using flowing mixture of CH4(40L/h)and N2(160L/h)under the ambient pressure.The growth of CNTs in carbon felts was conducted by DICVD technique using FeSO4·6H2O as catalyst precursor.Incipient wetness technique was applied to introduce catalysts into felts using distilled water as solvent.Afterwards,they were placed in a CVD reactor and heated to750°C under Arflowing.At the growth temperature,xylene as the hydrocarbon source was injected into the reactor through a thin tube via a syringe.Ethylenediamine as the growth promoter wasfilled in another syringe and was injected separately from the same side for the xylene injection.The ratio of injection rates of xylene and ethylenediamine was8:1.The Ar/H2(2/1)gas mixture was used as the carrier gas with aflow rate of600sccm.The growth time was2h. The direct growth of CNTs in carbon felts without PyC interface layer was also performed by DICVD technique under identical growth condi-tions.The volume fractions of CNTs in carbon felts with and without PyC interface layer were approximately1.3%.posite preparation and mechanical property testsThe densification was carried out by isothermal CVI technique for 150h under the conditions described in section2.2.The C/Cs containing both the PyC interface layer and CNTs were denoted as CNT-PyC-C/Cs, while the C/Cs containing only CNTs were denoted as CNT-C/Cs.The Fig.1.Schematic of depositing PyC interface layer on CFs and followed by growth of radial CNTs by DICVD to maintainfiber strength,optimize F/M interface and strengthen matrix of C/Cs. 10L.Feng et al./Materials and Design113(2017)9–16densities of pure C/Cs,CNT-C/Cs and CNT-PyC-C/Cs were measured in the range of 1.64–1.67g/cm 3.The sizes of samples for bending tests were machined into 50mm ×8mm ×4mm.The support span for bend-ing tests was 40mm.To study the quasi-ductile fracture behavior of the composites,a ductility factor was introduced.It was calculated from the ratio of the secant modulus (the slope of the line from the origin to the stress at failure in the flexural stress-strain curve)to the elastic modulus [28].The samples used for compression test and interlaminar shearing test were machined into the sizes of 5mm ×5mm ×4mm.The numbers of samples for bending,compression and shearing tests were not less than 5.All the tests were carried out on a universal testing machine (CMT5304)at a constant speed of 0.5mm/min.2.4.CharacterizationThe morphologies and microstructures of grafted CNTs were exam-ined by scanning electrical microscopy (SEM,JSM-6700)operated at 15kV and transmission electrical microscopy (TEM,Tecnai F30G 2)op-erated at 200kV,respectively.Microstructure of the matrix PyC was in-vestigated using polarized light microscopy (PLM,Leica DMLP).The Raman spectrum was recorded on a Renishaw Invia RM200using aninVia micro-Raman spectrometer with an Ar ion laser of 514.5nm wavelength at room temperature.3.Results and discussion3.1.Radially-aligned CNTs grafted on CFs with and without PyC coating Fig.2a shows the surface SEM image of the CFs coated with a homog-enous PyC interface layer with a thickness of about 200nm (Fig.2b).After the growth process by DICVD,the CFs without (Fig.2c)and with (Fig.2d)PyC interface layer are uniformly covered with CNTs.The CNTs exhibit radial grafting morphologies,indicating that the DICVD technique has good repeatability for growing radial CNTs on different carbonaceous substrates.These radial nanotubes extend into the space among fibers capability of providing ef ficient reinforcements both to the interlaminar and intralaminar matrix [29].Observation of the cross-section of hybrid fibers presents the detailed information about the CNT length ranging from 4to 7μm (Fig.2e).TEM investigation (Fig.2f)reveals that the products are hollow nanotubes with smooth walls and a typical outer diameter of about 300nm.And the inner diam-eter and tube-wall thickness are about 200nm and 50nm,respectively.Fig.2.SEM images:(a)surface and (b)cross-section of PyC-coated CFs;(c)surface of radially-aligned CNTs grafted on CFs;(d)surface and (e)cross-section of radially-aligned CNTs grafted on PyC-coated CFs.(f)TEM image of an individual CNT and its high resolution TEM image (inset of f).11L.Feng et al./Materials and Design 113(2017)9–16High resolution TEM image (Fig.2f inset)presents that the CNTs have multi-walled structures and the graphitic sheets are parallel to the axial direction,exhibiting a good crystallinity.3.2.Microstructure of compositesThe polished transverse section of the C/Cs,CNT-C/Cs and CNT-PyC-C/Cs viewed by polarized light microscopy is shown in Fig.3.For C/Cs (Fig.3a),the PyC around CFs is in the shape of circular shell and has large grain size,long boundaries between interference colors and pro-nounced homocentric annular cracks.By contrast,PyC in CNT-PyC-C/Cs (Fig.3b)and CNT-C/Cs (Fig.3b inset)demonstrates a different mor-phology.As for the CFs grafted with radial CNTs,the PyC will deposit around the nanotubes rather than directly on the surface of CFs (here,CNTs provide direct reinforcement to the matrix within the reach of nanotubes).Besides,it has been demonstrated in our previous work [30],where the CNTs can also affect the PyC out of the reach of nano-tubes by inducing the formation of spherical or cone-shaped PyC and then restricting their growing up (here,it can be called as “indirect rein-forcement ”).As a result,the consequent PyC is clearly different in mor-phology from that in pure C/Cs.As seen,the PyC in C/Cs containing CNTs exhibits small grain size,short boundaries between interference colors and no annular cracks.In addition,it is interesting to note that CFs in CNT-PyC-C/Cs present white outlines (labeled by arrows in Fig.3b)at-tributed to the presence of PyC interface layers.Fig.3c and d presents the Raman results of C/Cs and CNT-PyC-C/Cs (same with CNT-C/Cs),respectively.Intensity ratio of disorder-inducedD-peak and tangential G-peak is inversely proportional to the level of crystalline order and crystal size L a (in nm)[31].As stated in Table 1,the D:G intensity ratio,I D /I G ,is about 1.85for C/Cs and falls to approxi-mately 1.52for CNT-PyC-C/Cs,suggesting that PyC has a signi ficant im-provement in crystallinity and meanwhile a big increase in L a after introducing radial CNTs.Axisymmetric peak broadening represents for large interplanar spacing d 002of carbon materials [32].As seen,both G-peak and D-peak of interlayer become sharper and more de fined after introducing radial CNTs,which indicates that,the d 002value of PyC in CNT-PyC-C/Cs has a distinct decrease compared with that in C/Cs.As the crystalline order improves and crystal size increases,the bond density within the interlayer increases [33].High bond densities and few defects could lead to a signi ficant increase in mechanical strength of PyC matrix.3.3.Mechanical properties of compositesFig.4presents the stress-strain curves of the three composites re-corded during bending test,compression test and shearing test.The de-tailed results of mechanical tests of three composites are listed in Table pared with C/Cs,CNT-PyC-C/Cs shows obvious improve-ment in flexural strength,flexural ductility,compressive strength and interlaminar shear strength (ILSS):31.5%in flexural strength,118%in flexural ductility,81.5%in compressive strength and 82%in ILSS.How-ever,the flexural strength and flexural ductility of CNT-C/Cs are de-creased by 14.5%and 73%,although the compressive strength and ILSS are increased by 67%and 115%,respectively.From the flexuralstress-Fig.3.PLM images (a,b and inset)and Raman spectra (c,d)of the three composites:(a and c)C/Cs;(inset of b)CNT-C/Cs;(b and d)CNT-PyC-C/Cs (note:red points marked in a and b are the Raman detection positions).Table 1Raman testing data of C/Cs,and CNT-PyC-C/Cs (±values represent standard deviation).Composite FWHM of G-peak (cm −1)FWHM of D-peak (cm −1)I D /I GC/Cs84.41±0.21116.54±0.30 1.85±0.01CNT-PyC-C/Cs78.76±1.8288.62±1.341.52±0.0712L.Feng et al./Materials and Design 113(2017)9–16strain curves (Fig.4a),we can get the information regarding the fracture behavior of the three composites.For C/Cs and CNT-C/Cs,the flexural stress-strain curves can be divided in two segments:linear rise and lin-ear decrease of stress.The stress suddenly drops leading to the cata-strophic failure of the samples as stress goes up to the peak value,which designates brittle fracture occurs in the two composites.By con-trast,CNT-PyC-C/Cs shows pronounced pseudo-plastic fracture behav-ior since the load decreases in a step-style rather than perpendicularly after the peak value.The stress-stain curve can be divided into three segments:linear rise of load,non-linear rise of load and stepped de-crease of load.The different segments correspond to three stages:ma-trix elastic deformation,appearing and propagating of destructive cracks among matrix,interfacial debonding and fiber pullout,respec-tively [34,35].It means that CNT-PyC-C/Cs does not rupture completely but only fractures partly,avoiding the catastrophic failure as the loading stress reaches to the maximum value,which indicates a signi ficant im-provement in the fracture toughness [36,37].The observation from the compressive and shear stress-strain curves (Fig.4b and c)is that the compressive strength and ILSS of C/Cs can be signi ficantly increased by grafting radial CNTs onto CFs,no matter whether the PyC interface layer is presented or not.From these results it is suggested that if we want to improve the global mechanical strength,ductility and tough-ness of C/Cs,it is necessary to simultaneously optimize both the matrix and F/M interface.When the flexural stress is loaded on the composite samples,the strength of the composites is mainly depended on the strength of CFs.Fig.5shows the SEM images of flexural fracture surfaces of the three composites.In Fig.5a,the fracture surface of C/Cs shows plenty of step-wise fractured PyC and very limited fiber pullout.These fracture steps result from the annular cracks that supply the paths for the spreading and link up of destructive cracks and then lead to the formation of step-wise PyC panels.Besides,the F/M interfacial bonding of C/Cs is loose with obvious gaps between CFs and PyC (Fig.5a inset).According to the observations from Fig.5a,the fracture process in C/Cs during bend-ing test can be described as follows:when the bending stress is loaded on the composite samples,destructive cracks will appear somewhere in matrix at the most critical flaws,and then propagate along the annu-lar cracks leading to the delaminating of PyC;it is hard for the weak ma-trix and poor F/M interface to induce the de flection of destructive cracks to propagate along fiber surface,which leads to the early failure of CFs since the CFs is dif ficult to be hold on by matrix [38];as the stress further increases,these destructive cracks link up with each other and then the failure of composites occurs.The strength of CFs cannot be fully re flected and thus the C/Cs exhibits brittle fracture with low fracture strength.As for CNT-C/Cs,the fracture surface is flat and with nearly ab-sent of fiber pullout (Fig.5b).This fracture surface can be attributed to the strongly-enhanced cohesion in matrix and also the powerful me-chanical interlocking at F/M interface,which lead the destructive cracks to extend into and through the CFs without interfacial debonding (Fig.5b inset).Additionally,the degradation of tensile strength of CFs caused during the CNT growth process is also responsible for the degra-dation of flexural strength of CNT-C/Cs [39].In contrast,CNT-PyC-C/Cs shows a stepwise fracture surface with abundant fiber pullouts (Fig.5c).Enlarged SEM image (Fig.5d)illustrates that the destructive cracks spread along the nano/μ-scale grain boundaries (labeled by red dotted lines).When the destructive cracks extend to the CFs,PyC inter-face layer plays a role in changing their direction and facilitates them spreading along the direction parallel to the fiber axis as much as possi-ble (as shown in Fig.5e,where exposed PyC interface layer on the pulled-out CFs can be clearly observed).The PyC interface layer protects CFs effectively and weakens the interfacial strength between CFs and CNT/PyC,leading to the long pull-out of CFs compared with brittle frac-ture of CFs without PyC interface layer.Therefore,the stress can be ef fi-ciently transferred from the matrix to the CFs through the strengthened matrix and optimized F/M interface.Crack de flection and fiber pullout require a great amount of fractured energy consumption during the fail-ure process [26,27,30,40],which in turn increase the flexural strength and ductility of CNT-PyC-C/Cs and also make the flexural stress release gently,resulting in the sliding region occurred in the flexural stress-strain curve which corresponds to an improved fracture toughness.When the compressive stress is loaded on the composite samples,the compressive strength is mainly depended on the matrix cohesion.Fig.6presents the SEM images of compressive fracture surfaces of the three composites.The fracture surface of C/Cs shows flat and no CFs exist on the surface (Fig.6a),implying that fracture primarily occurs as a typical delamination failure without crack de flection during com-pression test (corresponding failure model is depicted in Fig.6a inset).High degree of matrix delaminating is the dominant mechanism for the delamination failure (Fig.6b).Enlarged SEM image (Fig.6c)clearly shows existing annular cracks provide main channels for the long-dis-tance extending of destructive cracks and then opening the plies.As for CNT-C/Cs (Fig.6d),the strongly-enhanced matrix ef ficiently im-pedes the propagation of destructive cracks in the interlaminar region (corresponding failure mode is shown in Fig.6d inset).The de flected destructive cracks then turn to the intralaminar regions (Fig.6e)and di-rectly pass through the CFs by virtue of strong F/M interfacialbonding,Fig.4.Stress-strain curves of the three composites recorded during different mechanical tests:(a)flexural test;(b)compression test;(c)Shearing test.Table 2Mechanical properties of C/Cs,CNT-C/Cs and CNT-PyC-C/Cs (±values represent standard deviation).Composite Flexural strength (MPa)Flexural ductility Compressive strength (MPa)Shear strength (MPa)C/Cs54±60.11±0.03195±1133±5CNT-C/Cs46±70.03±0.01326±1371±8CNT-PyC-C/Cs71±100.24±0.06354±1660±613L.Feng et al./Materials and Design 113(2017)9–16forming many flat fractured surfaces (Fig.6f).But comparatively,CNT-PyC-C/Cs shows a rugged fracture surface with many exposed CFs (Fig.6g),indicating that the propagation direction of destructive cracks also changes mangy times during compression test (corresponding fail-ure mode is shown in Fig.6g inset).The optimized F/M interface induces the long-distance propagation of destructive cracks along the fiber sur-face rather than directly pass through the CFs occurred in CNT-C/Cs (Fig.6h and i).More energies are dissipated during this course,which in turn could explain the more pronounced increment in the compressive strength for CNT-PyC-C/Cs (that is 81.5%)than that of CNT-C/Cs (that is 67%).When the interlaminar shear stress is loaded on the composite sam-ples,the shear strength is mainly depended on both the matrix cohesion and F/M interfacial bonding strength.Fig.7presents the shearing frac-ture surface of three composites.As seen in Fig.8a,the smooth PyC shearing fracture surface suggests a serious matrix delaminating in C/Cs,which is similar to the failure mode observed in compression test.It can be thus said that for C/Cs the matrix cohesion is lowerthanFig.5.SEM images of the flexural fracture surfaces of the three composites:(a and inset)C/Cs;(b and inset)CNT-C/Cs;(c –e)CNT-PyC-C/Cs.Fig.6.SEM images of the compressive fracture surfaces of the three composites:(a –c)C/Cs;(d –f)CNT-C/Cs;(g –i)CNT-PyC-C/Cs (insets are the failure modes of the composites during compression tests).14L.Feng et al./Materials and Design 113(2017)9–16F/M interfacial bonding strength.As for the CNT-C/Cs (Fig.8b),matrix delaminating is inhibited and abundant damaged CFs can be clearly ob-served in the shearing fracture surface,indicating that the interfacial strength between CFs and CNT/PyC is strong enough to generate a crack de flection from CNT/PyC to CFs and thus leading to the cleaving of CFs.However,for the CNT-C/Cs (Fig.8c),the F/M interfacial bonding seems to be relatively weak compared with the strongly-enhanced ma-trix,according to the long-distance spreading of destructive cracks along CF surface.This observation provides direct evidence that the PyC interface layer weakens the interfacial bonding strength between CFs and CNT/PyC (Fig.8c inset).It also explains the reason why the in-crement in ILSS of CNT-PyC-C/Cs (that is 82%)is lower than that of CNT-C/Cs (that is 115%).In addition,CNT pullout has rarely been found in all the fracture surfaces of composite samples.Therefore,it can be said that the contribution of our CNTs to the high mechanical strengths of composites is mainly re flected in strengthening the matrix.From the above analysis,the schematic modeling of the failure mecha-nisms of the three composites during loading process has been established,as shown in Fig.8.4.ConclusionsPyC deposited on the CF surface following the radial CNT growth en-ables F/M interface optimizing,matrix strengthening and minimum degradation to the fiber strength.SEM morphologies of fracture surfaces of failure composites reveal that the synergistic effects of strongly-en-hanced matrix and optimized F/M interface not only ef ficiently de flects the propagation direction of destructive cracks,but also induces the long-distance spreading of destructive cracks along the surfaces of CFs,which signi ficantly increase the flexural strength,flexural ductility,frac-ture toughness,compressive strength and ILSS of C/Cs.However,the speci fic interfacial bonding strength between CFs and CNT/PyC as well as the effect of thickness of PyC interface layer on the mechanical perfor-mance of CNT-reinforced C/Cs are still unclear.Still and all,this work might open up a possibility to produce CNT-reinforced C/Cs with excel-lent mechanical strength,ductility and toughness to replace traditional C/Cs in industries.AcknowledgementsThis work has been supported by the Fundamental Research Funds for the Central universities under Grant No.3102014JCQ01030and “111”Project of China (B08040),and the Natural Science Foundation of China (Grant Nos.51521061and51502242).Fig.7.SEM images of the shearing fracture surfaces of the three composites:(a)C/Cs;(b)CNT-C/Cs;(c and inset)CNT-PyC-C/Cs.Fig.8.The failure mechanisms of the three composites during loading process (red lines represent propagation paths of the destructive cracks).15L.Feng et al./Materials and Design 113(2017)9–16References[1] E.Fitzer,L.M.Manocha,Carbon Reinforcements and Carbon/Carbon Composites,Christiane,Berlin,1998.[2]T.Windhorst,G.Blount,Carbon-carbon composites:a summary of recent develop-ments and applications,Mater Des.18(1997)11–15.[3]K.Anada,V.Gupta,The effect of processing conditions on the compressive and shearstrength of2-D carbon-carbon laminates,Carbon33(1995)739–748.[4]G.Savage,Carbon/Carbon Composites,Springer,London,1993.[5]X.H.Hou,H.J.Li,S.Y.Zhang,J.Shen,Interface-like fracture mechanism in pyrolyticcarbon matrix-based carbon–carbon composites,Mater.Lett.48(2001)117–120.[6]K.M.Liew,Z.X.Lei,L.W.Zhang,Mechanical analysis of functionally graded carbonnanotube reinforced composites:a review,Compos.Struct.120(2015)90–97. [7]J.N.Coleman,U.Khan,W.J.Blau,Y.K.Gun'Ko,Small but strong:a review of the me-chanical properties of carbon nanotube-polymer composites,Carbon44(2006) 1624–1652.[8]M.Sharma,S.Gao,E.Mäder,H.Sharma,L.Y.Wei,J.Bijwe,Carbonfiber surfaces andcomposite interphases,Compos.Sci.Technol.102(2014)35–50.[9]Q.M.Gong,Z.Li,X.D.Bai,D.Li,J.Liang,The effect of carbon nanotubes on the micro-structure and morphology of pyrolytic carbon matrices of C–C composites obtained by CVI,Compos.Sci.Technol.65(2005)1112–1119.[10] E.T.Thostenson,W.Z.Li,D.Z.Wang,Z.F.Ren,T.W.Chou,Carbon nanotube/carbonfiber hybrid multiscale composites,J.Appl.Phys.91(2002)6034–6037.[11]V.P.Veedu,A.Cao,X.Li,K.Ma,C.Soldano,S.Kar,P.M.Ajayan,M.N.Ghasemi-Nejhad,Multifunctional composites using reinforced laminate with carbon-nanotube for-ests,Nat.Mater.5(2006)457–462.[12]R.Li,chman,P.Florin,H.D.Wagner,B.L.Wardle,Hierarchical carbon nanotubecarbonfiber unidirectional composites with preserved tensile and interfacial prop-erties,Compos.Sci.Technol.117(2015)139–145.[13] A.R.Boccaccini,J.Cho,J.A.Roether,B.J.C.Thomas,E.J.Minay,M.S.P.Shaffer,Electro-phoretic deposition of carbon nanotubes,Carbon44(2006)3149–3160.[14]T.Kamae,L.T.Drzal,Carbonfiber/epoxy composite property enhancement throughincorporation of carbon nanotubes at thefiber-matrix interphase-part I:the devel-opment of carbon nanotube coated carbonfibers and the evaluation of their adhe-sion,Compos Part A-Appl S43(2012)1569–1577.[15]L.Mei,X.He,Y.Li,R.Wang,C.Wang,Q.Peng,Grafting carbon nanotubes onto car-bonfiber by use of dendrimers,Mater.Lett.64(2010)2505–2508.[16]H.Qian,E.S.Greenhalgh,M.S.P.Shaffer,A.Bismarck,Carbon nanotube-based hierar-chical composites:a review,J.Mater.Chem.20(2010)4751–4762.[17]L.Feng,K.Z.Li,Z.S.Si,Q.Song,H.J.Li,J.H.Lu,et al.,Compressive and interlaminarshear properties of carbon/carbon composite laminates reinforced with carbon nanotube-grafted carbonfibers produced by injection chemical vapor deposition, Mater.Sci.Eng.A626(2015)449–457.[18]Q.Song,K.Z.Li,H.L.Li,H.J.Li,C.Ren,Grafting straight carbon nanotube radially ontocarbonfibers and their effect on the mechanical properties of carbon/carbon com-posites,Carbon50(2012)3943–3960.[19]H.Y.Yu,J.H.Lu,Q.Song,K.Z.Li,H.J.Li,Q.G.Fu,et al.,Compressive properties of car-bon/carbon composites reinforced by carbon nanotubes with different orientations and lengths,Vacuum99(2014)76–79.[20]H.Qian,A.Bismarck,E.S.Greenhalgh,G.Kalinka,M.S.P.Shaffer,et al.,Hierarchicalcomposites reinforced with carbon nanotube graftedfibers:the potential assessed at the singlefiber level,Chem.Mater.20(2008)1862–1869.[21]T.R.Pozegic,I.Hamerton,J.V.Anguita,W.Tang,P.Ballocchi,P.Jenkins,et al.,Lowtemperature growth of carbon nanotubes on carbonfibre to create a highly networked fuzzyfibre reinforced composite with superior electrical conductivity, Carbon74(2014)319–328.[22]J.Zhao,L.Liu,Q.Guo,J.Shi,G.Zhai,J.Song,et al.,Growth of carbon nanotubes on thesurface of carbonfibers,Carbon46(2008)380–383.[23]P.Xiao,X.F.Lu,Y.Q.Liu,L.L.He,Effect of in situ grown carbon nanotubes on thestructure and mechanical properties of unidirectional carbon/carbon composites, Mater.Sci.Eng.A528(2011)3056–3061.[24]Y.Y.Li,L.J.Guo,Q.Song,L.Li,J.H.Lu,K.Z.Li,et al.,Simultaneous improvements inflexural strength and ductility of carbon nanotube-doped carbon/carbon composites by depositing a pyrocarbon layer on carbonfibers,Ceram.Int.41(2015) 1943–1949.[25]K.Z.Li,L.Li,H.J.Li,Q.Song,J.H.Lu,Q.G.Fu,Electrophoretic deposition of carbonnanotubes onto carbonfiber felt for production of carbon/carbon composites with improved mechanical and thermal properties,Vacuum104(2014)105–110. [26]M.Sakai,R.Matsuyama,T.Miyajima,The pullout and failure of afiber bundle in acarbonfiber reinforced carbon matrix composite,Carbon38(2000)2123–2131. [27]M.Sakai,T.Miyajima,M.Inagaki,Fracture toughness andfiber bridging of carbonfiber-reinforced carbon matrix composites,Compos.Sci.Technol.40(1991) 231–250.[28] B.Reznik,M.Guellali,D.Gerthsen,Microstructure and mechanical properties of car-bon–carbon composites with multilayered pyrocarbon matrix,Mater.Lett.52 (2002)14–19.[29]S.S.Wicks,R.G.de villoria,B.L.Wardle,Interlaminar and intralaminar reinforcementof composite laminates with aligned carbon nanotubes,Compos.Sci.Technol.70 (2010)20–28.[30]L.Feng,K.Z.Li,Z.G.Zhao,H.J.Li,L.L.Zhang,J.H.Lu,et al.,Three-dimensional carbon/carbon composites with vertically aligned carbon nanotubes:providing direct and indirect reinforcements to the pyrocarbon matrix,Mater.Des.92(2016)120–128.[31]P.Mallet-Ladeira,P.Puech, C.Toulouse,M.Cazayous,N.Ratel-Ramond,P.Weisbecker,et al.,A Raman study to obtain crystallite size of carbon materials:a better alternative to the Tuinstra–Koenig law,Carbon80(2014)629–639.[32] A.Yoshida,Y.Kaburagi,Y.Hishiyama,Full width at half maximum intensity of the Gband in thefirst order Raman spectrum of carbon material as a parameter for graph-itization,Carbon44(2006)2333–2335.[33] C.A.Taylor,M.F.Wayne,W.K.S.Chiu,Heat treatment of thin carbonfilms and the ef-fect on residual stress,modulus,thermal expansion and microstructure,Carbon41 (2003)1867–1875.[34]X.Xiong,Y.L.Wang,Z.K.Chen,G.D.Li,Mechanical properties and fracture behaviorsof C/C composites with PyC/TaC/PyC,PyC/SiC/TaC/PyC multi-interlayers,Solid State Sci.11(2009)1386–1392.[35]H.Hatta,K.Suzuki,T.Shigei,S.Somiya,Y.Sawada,Strength improvement by densi-fication of C/C composites,Carbon39(2001)83–90.[36]H.L.Li,H.J.Li,J.H.Lu,C.Sun,Y.J.Wang,D.J.Yao,et al.,Improvement in toughness ofcarbon/carbon composites using multiple matrixes,Mater.Sci.Eng.A530(2011) 57–62.[37]G.Z.Xu,H.J.Li,R.C.Bai,J.Wei,Y.Q.Zhai,Influence of the matrix texture on the frac-ture behavior of2D carbon/carbon composites,Mater.Sci.Eng.A478(2008) 319–323.[38]J.Chen,P.Xiao,X.Xiong,The mechanical properties and thermal conductivity of car-bon/carbon composites with thefiber/matrix interface modified by silicon carbide nanofibers,Mater.Des.84(2015)285–290.[39]L.Feng,K.Z.Li,J.J.Sun,Y.J.Jia,H.J.Li,L.L.Zhang,Influence of carbon nanotube ex-tending length on pyrocarbon microstructure and mechanical behavior of carbon/ carbon composites,Appl.Surf.Sci.355(2015)1020–1027.[40]R.R.Naslain,The design of thefibre-matrix interfacial zone in ceramic matrix com-posites,Compos.Part A-Appl.S29(1998)1145–1155.16L.Feng et al./Materials and Design113(2017)9–16。
PoE交换机应用于百万高清监控传输解决方案分析
PoE交换机应用于百万高清监控传输解决方案分析安防监控工程背景需求分析近几年,带POE接口的网络摄像机的应用在安防监控工程中不断加大,随着“智能、平安城市” 建设的逐渐深入,网络摄像机在市场上的地位越来越高。
安防行业在应用网络摄像机的需求也越来越广,用户对工程的施工要求也来越高。
工程商在遇到的工程应用环境也越来越复杂,因此网络摄像机份额增大,用到PoE交换机的比例也会随之加大。
丰润达致力于多种先进的PoE产品的研发生产,在大环境的一路攀升的情况下,顺势而为,飞速发展。
其推出的PoE交换机组网解决方案成为百万高清网络视频监控系统工程应用的主流组网方案。
此方案为中短矩离打造了低成本,高效率,更加灵活方便的高清监控组网解决方案。
PoE交换机在百万高清安防监控系统中组网应用的优势安防行业应用PoE组网主要有简化布线、节能灵活、安全方便等优势。
众所周知,一般的网络摄像机除了需要通过网线来传输视频信号外,还必须全天候为其提供足够的电力。
而在现实施工中,经常会出现因为无法提供稳定的电源,而不得不重新设计摄像头的安装地点的情况。
如此一来,重新设计安装地点额可能会导致出现监控死角,使监控失去意义。
因为PoE交换机的出现为其组网带来了春天。
1、灵活性,PoE只需要安装和支持一条电缆,简单而且节省空间,并且设备可随意移动;2、节约成本,视频监控摄像机等,都需要安装在难以部署AC电源的地方,PoE使其不再需要昂贵电源和安装电源所耗费的时间,节省了费用和时间;3、供电智能化,DC电源像数据传输一样,PoE可以通过使用简单网管协议(SNMP)来监督和控制设备;4、消除供电安全隐患,PoE供电端设备只会为需要供电的设备供电,只有连接了需要供电的设备,以太网电缆才会有电压存在,因而消除了线路上漏电的风险;5、集中供电优势,一个单一的UPS就可以提供相关所有设备在断电时的供电;6、设备兼容性优势(颐高在百城会上,为包括波粒百万高清摄像头等八家企业产品兼容的百万高清安防监控系统得到全国工程商的高度关注),用户可以自动、安全地在网络上混用原有设备和PoE设备,这些设备能够与现有以太网电缆共存;7、使网络设备便于管理,当远端设备与网络相连后,能够远程控制、重配或重设;8、在无线局域网中,PoE可以简化射频测试任务,接入点能够被轻松地移动和接入。
1-s2.0-S095965261300615X-main

Analysis of cleaner technologies based on waxes and surfactant additives in road constructionMiguel Pérez-Martínez a,Fernando Moreno-Navarro a,Jesús Martín-Marín a,Carolina Ríos-Losada b,M a Carmen Rubio-Gámez a,*a Laboratorio de Ingeniería de la Construcción,University of Granada(LabIC.UGR),E.T.S.Ingenieros de Caminos,Canales y Puertos,Ed.Politécnico,Avda. Severo Ochoa,s/n,C.P.18071Granada,Spainb ServiàCantó,Spaina r t i c l e i n f oArticle history:Received11April2013 Received in revised form4September2013Accepted10September2013 Available online7October2013Keywords:Warm mix asphaltCleaner productionTriaxial testFour point bending testControl emissionsFuel consumption a b s t r a c tThe manufacture of hot mix asphalt for road construction is associated with a high consumption of fossil fuels and a high level of emissions.The use of temperature reduction technologies in the manufacture of warm mix asphalts favors a cleaner production of such materials,and therefore its use has become a major objective in thefield of road engineering.Thus,during the last few years different types of techniques are appearing in order to achieve this objective.This article presents the comparison established in terms of mechanical performance of three processes of temperature reduction technol-ogies in order to select one of them for its manufacture in plant,where control of emissions and fuel consumption have been collected.The results showed that the use of warm mix asphalt technologies with waxes or surfactant additives may not incur in a detrimental effect on the mechanical properties of the pavement.The use of surfactant bitumen in plant is possible to produce warm mix asphalts,reducing the consumption of fuel in the process.Ó2013Elsevier Ltd.All rights reserved.1.IntroductionRoad construction is one of the principal works in thefield of civil engineering,and in turn is a major consumer of fossil fuels for the production of asphalt mixtures.The need to adapt this type of production to cleaner processes leads to a search for reducing manufacturing temperature,trying to make it more sustainable and healthy,reducing at the same time the greenhouse gases emissions rates(Rubio et al.,2012)that are so harmful to the environment.Traditionally the asphalt mixtures used in road construction are manufactured at170 C(HMA)(D’Angelo et al.,2008),and are characterized by developing the mechanical properties that guar-antee an appropriate behavior during its life of service(General Management of Roads,2008).On the contrary,during its produc-tion process,the emissions of gases generated,and the fuel con-sumption required are important(Kristjansdottir,2006).As an alternative to HMA’s,during the last few years new processes have been appearing in order to reduce the manufacture temperature.Within these temperature reduction technologies,three types of mixtures can be distinguished by the temperature range of manufacture,warm mix asphalt WMA(100 C e140 C),half warm mix asphalt HWMA(60 C e100 C)and cold mixtures(0 C e40 C) (EAPA,2010).Discarding cold mixtures due to their lack of use out of surface patches rehabilitation,the reduction is achieved by the application of different processes and technologies,mainly dis-tinguishing between three for the WMA,the foaming process and the use of organic or chemical additives(Zaumanis,2010),and two for the production of HWMA,the use of emulsions and eventually foamed bitumens(Rubio et al.,2013).In the case of HWMA’s,not only has been proved that the reduction of emissions and fuel consumption is a fact(Rubio et al., 2013),but also that the mechanical performance achieved by this type of mixtures is not as satisfactory as it was desired(Punith et al., 2013).On the other hand,WMA’s have shown a better mechanical performance than HWMA and comparable to HMA(Reyes-Ortiz et al.,2009),reducing at the same time the consumption of fuel and greenhouse emissions in the manufacturing process(Hamzah et al.,2010).*Corresponding author.E-mail addresses:fmoreno@ugr.es(F.Moreno-Navarro),crioslo@fcc.es(C.Ríos-Losada),mcrubio@ugr.es(M a C.Rubio-Gámez).Contents lists available at ScienceDirect Journal of Cleaner Productionjournal homep age:www.elsevi/locate/jclepro0959-6526/$e see front matterÓ2013Elsevier Ltd.All rights reserved./10.1016/j.jclepro.2013.09.012Journal of Cleaner Production65(2014)374e379Based on the number of advantages associated to WMA mix-tures(D’Angelo et al.,2008),which result in environmental(lower emissions),economical(cost savings and lower energy consump-tion)and constructional benefits(better workability and larger compaction window,greater hauling distances and less opening time to traffic)this research compare three WMA technologies for reducing the manufacture temperature of conventional hot mix asphalts.Thefirst is one of the most common additives used for this purpose,the organic waxes,which are aliphatic hydrocarbons of long-chain produced by the Fischer e Tropsch process(Wax,2005). Meanwhile as growing alternative,surfactant additives are an en-ergetic reducing agent allowing the manufacture of WMA to a reduced temperature while maintaining their mechanical proper-ties,the addition was considered in two different ways,mixing the bitumen and the surfactant in plant before adding to the mixture (dry process),and a surfactant modified bitumen(wet process) blended in refinery to compare their influence.This paper shows a laboratory level characterization of an asphalt concrete AC16S mixture for the surface course(EN13108-1,2008)under three temperature reduction technologies.Based on the results obtained,one of the mixtures was chosen to adapt a HMA plant for the production of WMA mixtures and measure the emissions and fuel consumption during the manufacturing boratory works on the mixtures was based on Marshall test,water sensitivity test,triaxial test and four point bending test established the parameters to select the most appropriate mixture for being produced at bigger scale.During the manufacturing process in plant measurement of the emis-sions and fuel consumption of a HMA and the WMA were taken. Finally,the main the conclusions obtained from the analysis of results are exposed.2.Materials and methods2.1.Materials2.1.1.AggregatesAn AC16S(EN13108-1)mixture,which is found in roads and highways all over the world,was used to carry out the study.The aggregates were porphyry for the coarse fraction(12/18and6/12),and a combination of porphyry(0/6)and limestone(0/4)for the fine fraction.Moreover,thefiller employed was calcium carbonate. Table1lists the aggregate properties.The aggregates combination by percentage is shown in Table2, where the gradation of the mixture(Fig.1)was kept constant for all the mixtures developed at lower temperature and with different additives.2.1.2.BitumensFour different binders have been used for the attainment of the objectives of the investigation.Thefirst binder used was conven-tional50/70,and besides being used alone,it was the base for the other three bitumens.50/70bitumen,modified with an organic surfactant additive was used as second binder in order to improve its workability at lower temperatures.The bitumen modification was made in labo-ratory and the percentage of additive used was chosen following the manufacturer recommendations(1%over bitumen weight).The third one was modified50/70bitumen with surfactant products to improve the wettability of the binder as an alterna-tive to the conventional for the reduction of temperature.The last binder used was50/70bitumen modified with microcrys-talline waxes produced by the Fischer e Tropsch process as addi-tive.In both cases,the bitumen was modified in refinery.Table3 describes all the mixtures designed and the additives used,as well as the temperature reduction applied on their manufacture process.2.2.MethodologyThe methodology followed is composed of two phases,labora-tory works and the manufacturing industrial process in plant,being thefirst one divided in three steps and focused on the analysis of the working formula for its adaptation to the manufacture process under different temperature reduction technologies.And the sec-ond one based on the adaptation of a hot mix asphalt plant for the production of a warm asphalt mixture.In laboratory,firstly the optimum bitumen content needs to be determined for the conventional mixture of reference without additives.Based on the values of air voids(%),deformation(mm) and stability(kN)of the Marshall test(NLT-159,2000)the optimumTable1Reference values of the aggregates and mineral dust.Test/aggregate type Coarse aggregate Fine aggregate FillerGrain size(EN933-1)/(EN933-10)Sieves(mm)12/18Porphyry6/12Porphyry0/6Porphyry0/4Limestone Carbonate(CaCO3)24.4100100100100e1684100100100e8162100100e4158792e21160681000.51129301000.251121201000.125e e e e970.0630.50.911.81187Sand equivalent(EN933-8)(>50)4554Bulk density(EN-1097-3)(0.5e0.8Mg/m3)0.7Percentage of fractured face(EN933-5)(100%)100100Flakiness index(EN933-3)(25)1625Resistance to fragmentation(EN1097-2)(20)1515Cleaning(organic impurity content)(UNE146130,Annex C)(0.5%)0.50.5Particle density andabsorption(EN1097-6)r a(Mg/m3) 2.73 2.73 2.77 2.71r SSD*(Mg/m3) 2.70 2.71 2.72 2.67r RD(Mg/m3)2.69 2.70 2.70 2.65Water absorption after immersion(%)0.600.400.910.77M.Pérez-Martínez et al./Journal of Cleaner Production65(2014)374e379375content of binder was set,using the same in all the WMA ’s mix-tures.Furthermore,several test were carried out to assess the mechanical behavior of the conventional mix:water sensitivity test (EN 12697-12,2009),cyclic triaxial compression test (EN 12697-25,2006,method B)in order to study the plastic deformations,and the four point bending fatigue cracking test (EN 12697-24,2013,annex D)to assess the long term response of the mixture.In the second stage the Marshall test,with the optimum bitumen content determined,is undertaken for the three mixtures with temperature reduction technology at 140 C to study their Marshall stability (kN),voids content (%)and deformation (mm).The mechanical performance was also evaluated in the WMA mixtures applying the same test procedures and conditions as in the first stage for the Reference Mix.Finally,a comparative analysis of the four mixtures is developed.With this purpose their stability (kN),retained strength against water (%),creep modulus (MPa)and fatigue life parameters are compared.Based on this analysis,the warm mix asphalt technology with the best overall performance will be selected for its adaptation to the plant production and to construct a road section test.In plant works are centered on the adaptation of a HMA plant for the manufacture of a WMA mixture.For this purpose a HMA and WMA mixtures are produced,measuring during the process the emission of pollutants,as well as the consumption of fuel required.In the case of the control of emissions,the methodology was similar to the one followed by Rubio et al.in (2013).In-point source emissions were measured (Fig.2);humidity,wind,and temperature data were also collected to assure the spreading in similar atmospheric conditions for HMA and WMA gases to compare the results.The parameters evaluated were the Combustion Gases (CO,NO x ,O 2,CO 2)measured by a multi-parameter analyzer (TESTO MXL),the Total Organic Carbon (TOC)through a flame ionization detector (FID,M&A PT)and the emission of Particles (collected in a 47mm filter and subsequently calculated in the laboratory by gravimetry).To complete the investigation,the consumption of fuel used is also measured.3.Analysis of results 3.1.Marshall testThe Marshall test results in regards to the optimum bitumen content is shown in Table 4.As can be seen,the values of me-chanical resistance developed by the mixtures in terms of stability and deformation are slightly lower in the case of warm mix as-phalts produced at lower temperature.Furthermore,in the case of surfactants additives (both dry and wet process)a decrease in terms of density is attained by the mixtures as well as an increased in the air voids content.This is due to this type of additives,which produce an improvement in the adhesiveness aggregate/binder and a better wetting of the aggregate,but no change in the viscosity of the bitumen,and therefore it may have certain dif ficulties associ-ated to perform the compaction of the mixture at lower tempera-ture.In the case of wax bitumen,this fact does not occur as waxes modi fied binder viscosity and consequently the values of density and air voids are not affected by reducing the temperature of manufacture and compaction.3.2.Water sensitivity testA new set of 6specimens per mixture using the optimum bitumen content were produced to perform the water sensitivityTable 3Studied mixtures and bitumens used.DenominationBitumenAdditive natureAddition processMixturemanufacture temperature ( C)Reference Mix 50/70Nonee 160Dry Surfactant Mix50/70þ1%additive Surfactant Dry 140Wet Surfactant MixSurfactantmodi fied 50/70Surfactant Wet 140Wet Wax MixWax modi fied 50/70Microcrystalline waxesWet140Fig.1.Aggregate gradation for asphalt mix type AC-16S.Table 2Aggregates combination by percentage.Aggregate fraction PercentagePorphyry 12/1815Porphyry 6/1244Porphyry 0/620Limestone 0/415Calcium carbonate filler6Fig.2.Simpli fied HMA plant distribution and in-point source.Table 4Marshall results and optimum bitumen content.ParameterReference Mix Drysurfactant Mix WetSurfactant Mix Wet Wax Mix Optimum bitumen content (%) 4.8 4.8 4.8 4.8Bulk density (kg/m 3)2423236423772437Marshall stability (kN)10.7079.4788.2049.053Marshall def.(mm) 2.3 2.9 3.5 3.7Vm (%) 4.0 5.1 4.6 3.1VMA (%)15.316.115.614.5M.Pérez-Martínez et al./Journal of Cleaner Production 65(2014)374e 379376test(EN12697-12,2009).Table5resumes the values of strength obtained in the test.Once again the resistance values,in this case indirect tensile strength,shown by warm mix asphalts are slightly lower than those of the Reference Mix,perhaps indicating that may be inter-esting to increase the energy of compaction when using this type of mixtures,but higher than the ones obtained by Oliveira et al.(2013) with and without rubber.However,the retained strength(ITSR) shown by warm mix asphalts is higher,and therefore can be considered that such materials will be less affected by the action of water.This is because,in the case of surfactant additived mixtures to the improvement of adhesiveness that they generate(not only improving the coating of the aggregate,but also acting as its stimulator).Meanwhile,in the Wet Wax Mix may be related to its compaction improvement and its lower void content.3.3.Cyclic triaxial compression testPlastic deformations were evaluated by the cyclic triaxial compression test(EN12697-25,2006,method B),taking at the same time the service stresses and strains into account by means of a confining load.The conditions selected involved the com-bined application at a constant temperature of40 C of a confining load of120kPa and another cyclic sinusoidal out-of-phase axial loading of300kPa at a frequency of3Hz during12,000load cycles.The creep modulus and permanent deformation parame-ters for each mix were calculated.Table6shows the triaxial test results.The values obtained for the creep modulus indicate that the most resistant mix against plastic deformations is the Wet Wax Mix.The Wet Surfactant Mix behaves similar to the Reference Mix, even manufactured at lower temperature and the permanent deformation experienced only varies in0.03%.In the case of the Dry Surfactant Mix,results showed an increase in plastic deformation, probably due to a lack of mix compaction(as it is showed in its void content).3.4.Four point bending testTo perform the test,specimens of408Â50Â50mm with sawn faces were manufactured,and a sinusoidal waveform load was applied.The tests were carried out at20 C,in strain control mode and at a frequency of10Hz.The mixtures were tested in six different strain amplitude levels,250m m/m;200m m/m;175m m/m; 150m m/m;125m m/m and100m m/m Fig.3shows the potential fatigue laws derived from the four-point bending test performed in the4types of mixtures tested.As can be observed,independently of the warm mix technology used,the fatigue behavior of the mixtures evaluated is very similar, which coincides with thefindings of other researchers(Jones et al., 2010).On the other hand,the correlation coefficients of the fatigue laws obtained are high,indicating a uniform mechanical behavior of the warm mix asphalts.This aspect agrees with the results ob-tained by Johnston et al.(2006),which showed that additive did not affect the homogeneity of its long-term mechanical behavior.Moreover,the fatigue behavior of the Dry and Wet Surfactant Mixes is very similar,regardless of the method used to add the additive.Meanwhile,it should be noted that the fatigue behavior of the Wet Wax Mix is slightly different.At higher strain amplitudes fatigue life is smaller,while for lower strain amplitudes it increases in relation to the other mixtures evaluated.This behavior is typical of more rigid materials,aspect which is supported by the results obtained in the triaxial test,where the Wet Wax Mix showed a low rate of permanent deformation(which means that is a more rigid material).Table6Triaxial test results.Parameter ReferenceMix DrySurfactantMixWetSurfactantMixWet WaxMixCreep modulus(MPa)178.57153.45175.95202.70Permanentdeformation(%)1.68 1.96 1.71 1.48Table5Water sensitivity test results.Parameter ReferenceMix Dry SurfactantMixWet SurfactantMixWet Wax MixITSR(kPa)dry group2030.01469.01749.71464.3ITSR(kPa)wet group1741.71281.01575.71357.3ITSR(%)85.587.290.192.7Fig.3.Fatigue behavior of the studied mixtures at strain controlled test(T¼20 C,f¼10Hz).M.Pérez-Martínez et al./Journal of Cleaner Production65(2014)374e3793773.5.Control of emissionsData collection for controlling emissions took place during the process of manufacturing the conventional HMA at 176 C and the mixture Wet Surfactant Mix selected as WMA at 140 C.Table 7resumes the results obtained.Fig.4shows the emissions results obtained from the manufacturing of WMA and HMA mixtures.They have been compared with the HMA and HWMA results from Rubio et al.(2013).In terms of CO 2and NO x WMA slightly reduces the emis-sions,while in TOC and CO the values obtained have been increased,which was not expected.It can be appreciated how HMWA reduce the emissions in comparison with the hot asphalt mix while no reduction is appreciated between the WMA and the hot asphalt mix.3.6.Fuel consumptionTable 8indicates the results from the measure of the fuel needed for the manufacture of HMA and WMA mixtures.According to the values obtained in plant,the consumption of fuel for the manufacture of WMA is 35%lower.Decreasing the flame modulator by 60%would save fuel.The increase of the time of mixing by 5s is to guarantee the good cover of the aggregates;it induces to a decrease in production but the savings on fuel consumption balances it.4.ConclusionsIn this paper,mechanical performance testing on three asphalts mixtures modi fied under different temperature reduction tech-nologies was conducted.The aim of the research was to select one of the processes to adapt a HMA plant into the manufacture of WMA mixes,and measure the emissions and consumption of fuel during the process.The results obtained during the investigation led to the following conclusions:e The use of both,surfactants and waxes,as additives can reduce the manufacture temperature of asphalt mixtures to 140 C,providing materials with similar mechanical behavior than the hot mix asphalt.e In the case of surfactant additived mixtures,its incorporation into the mixture directly through the bitumen modi fied intheFig.4.Gases emissions of HMA,WMA and HWMA (Rubio et al.,2013).Table 7Emissions data collected.ParameterHMA WMA Manufacture temperature 176 C 140 C CO (ppm)616.8635.5NO x (NO 2)(ppm)55.653.2TOC (mgC/Nm 3)33.553.2Oxygen (%)16.516.5CO 2(%)2.5 2.6Speed (m/s)15.414.6Humidity (%)5.85.7Table 8Fuel consumption.ParameterHMA WMA Manufacture temperature 176 C 140 C Flame modulator 95%33%Time of mixing (s)3540Production (tn/h)200180Fuel consume (l/tn)5.83.8M.Pérez-Martínez et al./Journal of Cleaner Production 65(2014)374e 379378refinery plant(wet process),seems to offer further guarantee of success than incorporating it directly on the mixture(dry pro-cess).Although not offering an improvement in the compaction process of the mixture,the improvement of adhesiveness in the mixing offered by this additive allows manufacturing such materials at lower temperatures while maintaining their me-chanical properties.Thus,retained resistance values are pre-served against the action of water,plastic deformation,and fatigue behavior,showing how the use of this type of additived bitumens may offer bituminous mixtures with similar charac-teristics to HMA,assuming an environmentally cleaner alter-native to road construction.e In turn,wax modified bitumens let ensure acceptable compac-tion of the mixes at lower temperatures,offering a good response to the action of water and plastic deformation,as well as good fatigue life.Based on the results obtained in this research,this technology presents itself as an interesting alter-native for the environmental improvement in the production of asphalt mixtures.e Among the temperature reduction technologies studied,thebest results provided,in terms of mechanical performance is the Wet Wax Mix.Nevertheless,the Wet Surfactant Mix has also shown good overall mechanical response.So,when deciding which technology could be used for the next phase of the investigation,surfactant modified bitumen in refinery could be considered if it results economically and more competitive than using waxes.e In relation to the pollutant emissions,data collected do notshow a decrease as expected.On the other hand,other studies where a higher decrease of temperature takes places(as HWMA manufacturing process)provide a more significant reduction of emissions.In this sense,to achieve a better knowledge and significant conclusion more research needs to be develop about emissions during the manufacturing process of asphalt mixes with reduction of temperature(evaluating other asphalt plants and WMA technologies).e Fuel consumption can be decreased by35%respect to the pro-duction of HMA due to the reduction of theflame to dry the aggregates.When reducing this temperature of drying the time of mixing may be increased,but the savings in fuel can be considerable.AcknowledgmentsAuthors would like to acknowledge the Ministerio de Economía y Competitividad for its assistance in the project:INMBERS:Investigación de nuevas mezclas de baja energía para rehabilitación superficial.IPT-420000-2010-12.ReferencesD’Angelo,J.,Harm, E.,Bartoszek,J.,Baumgardner,G.,Corrigan,M.,Cowsert,J., Harman,T.,Jamshidi,M.,Jones,W.,Newcomb, D.,Prowell, B.,Sines,R., Yeaton,B.,2008.Warm-mix Asphalt:European Practice.Report FHWA-PL-08e 007.Office of International Programs,U.S.Department of Transportation, Washington DC,USA.EAPA,European Asphalt Pavement Association,January2010.The Use of Warm Mix Asphalt.EAPA position paper (accessed09.10.12.).EN12697e12,2009.Bituminous Mixtures.Test Methods for Hot Mix Asphalt.Part 12:Determination of Water Sensitivity of Bituminous Specimens.European Committee for Standardization,Bruxelles,Belgium.EN12697e24,2013.Bituminous Mixtures.Test Methods for Hot Mix Asphalt.Part 24:Resistance to Fatigue;Annex D,Four Point Bending Fatigue Cracking Test.European Committee for Standardization,Bruxelles,Belgium.EN12697e25,2006.Bituminous Mixtures.Test Methods for Hot Mix Asphalt.Part 25:Cyclic Compression Test;Method B,Cyclic Triaxial Compression Test.Eu-ropean Committee for Standardization,Bruxelles,Belgium.EN13108e1,2008.Bituminous Mixtures e Material Specifications.Part1:Asphalt Concrete.European Committee for Standardization,Bruxelles,Belgium. General Management of Roads,2008.General Technical Specification for Road and Bridge Works PG-3.Articles542and543(in Spanish),Madrid,Spain. Hamzah,M.O.,Jamshidi, A.,Shahadan,Z.,2010.Evaluation of the potential of SasobitÒto reduce required heat energy and CO2emission in the asphalt in-dustry.J.Clean.Prod.18,1859e1865.Johnston, A.,Yeung,K.,Bird,J.,Forflyow, B.,2006.Initial Canadian experience with warm-mix asphalt in Calgary,Alberta.In:Proc.51st Annual Conference of the CTAA,Charlotte-town,Prince Edward Island,Canada,pp.369e386. Jones,D.,Barros,C.,Harvey,J.T.,Tsai,B.W.,Wu,R.,2010.Preliminary results from California warm-mix asphalt study.In:Transportation Research Board89th Annual Meeting,Washington DC,USA.Kristjansdottir,O.,2006.Warm Mix Asphalt for Cold Weather Paving(PhD thesis).University of Washington,Seattle,WA,USA.NLT-159,2000.Marshall Test.Road Tests of the Road Study Center(in Spanish), Madrid,Spain.Oliveira,J.R.M.,Silva,H.M.R.D.,Abreu,L.P.F.,Fernandes,S.R.M.,e of a warm mix asphalt additive to reduce the production temperatures and to improve the performance of asphalt rubber mixtures.J.Clean.Prod.41,15e22.Punith,V.,Xiao, F.,Wingard, D.,2013.Performance characterization of half warm mix asphalt using foaming technology.J.Mater.Civ.Eng.25,382e 392.Reyes-Ortiz,O.,Pérez,F.,Miró,R.,Amorós,J.,Gil,S.,2009.The Phoenix Project at UPC.Warm mix asphalt mixtures.In:XV Ibero-Latin American Congress of Asphalt.Lisbon23-27November2009,Portugal(in Spanish).Rubio,M.C.,Martínez,G.,Baena,L.,Moreno,F.,2012.Warm mix asphalt:an over-view.J.Clean.Prod.24,76e84.Rubio,M.C.,Moreno,F.,Martínez-Echevarría,M.J.,Martínez,G.,Vázquez,J.M.,2013.Comparative analysis of emissions from the manufacture and use of hot and half-warm mix asphalt.J.Clean.Prod.41,1e6.Wax,Sasol,2005.Roads and Trials with / sasolwaxmedia/Downloads/Bitumen_Modification-p-409/Roads_and_trials.pdf (accessed17.09.12.).Zaumanis,M.,2010.Warm Mix Asphalt Investigation(PhD thesis).Technical Uni-versity of Denmark,Kongens Lyngby,Denmark.M.Pérez-Martínez et al./Journal of Cleaner Production65(2014)374e379379。
WAPA百万高清摄像机特性介绍

宽劢态技 术
摄像机底层技 术,决定摄像 机所能拍摄图 像癿明暗劢态 范围
延时
摄像机压缩编 码性能,影响 整个系统癿实 时性和可用性
接口和功 能
扩展摄像机癿 应用功能,能 够有效提升摄 像机癿应用环 境
兼容性
前、后端癿互 联互通,摄像 机同后端癿应 用软件、视频 平台之间癿无 缝对接, ONVIF/SIP/S DK 市场占有率, 以及过往成功 案例
其他品牌高清网络摄像机
WAPA高清网络摄像机
其他品牌高清网络摄像机
WAPA高清网络摄像机
摄像机特性概述(二) ---------3A技术
自劢曝光 (AE) 自劢白平衡 (AWB) 自劢聚焦 (AF) 3A算法
自劢曝光、自劢聚焦、自劢白平衡都是通过摄 像机癿软件算法实现癿,很大程度上将直接关 联着摄像机癿图像效果。3A技术也成为衡量一 个厂家摄像机研収实力癿标杆。 WAPA于2009年就已通过全自主研发幵掌握了 数字摄像机中最核心癿3A算法。
什么是高清网络摄像机
基本概念
百万高清网络摄像机是整个IP网络视频监控系统癿前端采集及处理设备,主要完成原始
视频图像癿采集和压缩,幵通过网络将数据传输至后端癿存储和管理设备。 百万高清网络摄像机将传统癿摄像机图像采集技术和网络视频编码技术相结合。 采用高分辨率图像传感器,具备百万分辨率(1280×720以上)癿画面捕捉功能,还能
T总延时 t1=编码时延
t3=解码时延
t2=交换时延
IPC
高清网络 摄像机 平台/NVR
传输网络
光图像
摄像机特性概述(四) ---------低延时
在网络视频监控系统中,对视频数据癿端到端传输有着明确癿定义:当视频数据经由 网络传输时,端到端癿信息延迟时间(包括収送端采集、编码、网络传输、接收端解 码、直至显示)应参考如下标准: 丢包率上限:1/1000 网络延时上限:400ms 延时抖动上限:50ms 由此可见,在网络状态一定癿情况下,摄像机自身 癿压缩编码性能,直接决定了整个系统癿时延,而 延时过大会直接影响系统癿实时性,从而丧失了实 时监控癿意义。目前行业里各厂家设备所使用癿压 缩不解压缩癿技术参差丌齐。 A&S《安防工程商》2010年8月刊对国内外多个品 牌百万高清产品评测,评测组収现,在同样场景、 分辨率和网络条件下,WAPA癿高清摄像机延时只 有0.11s。
xxxxxx监控方案

XXXXXXX高清监控设计解决方案XXXXXXX数字高清XX XXXXX 监控方案一、百万高清行业引导高清数字监控系统是监控报警业界的新型产品,它将数字化视频图像记录与多画面图像显示功能和监视报警功能结合在一起,将逐步取代传统模拟式监控系统。
1)、数字高清已成视频监控必然趋势由于压缩算法、光学、图像处理、网络等技术的革新,数字高清摄像机已经从概念成为现实。
一年一度的安博会是安防行业的风向标,从2010年和2011年安博会不难看出,各路厂家商家谈论的焦点已经从D1画质转移到720P (1280X720,逐行扫描图像)、1080i(1920X1080,隔行扫描图像)高清影像。
此外,随着我国“平安城市”的建设力度逐渐加大,村镇技防建设已在国内部分省区悄然铺开,数字监控产品进入家庭等民用化市场的苗头已经呈现。
2010年1月10日,沈阳市公安局召开新闻发布会,要求凡申请办理停车场的,必须安装高清晰电视监控设备,对原有停车场,要求立即组织安装高清晰电视监控设备。
由此可见,无论是从技术条件,还是市场诉求,监控摄像机进入高清晰度数字时代的条件已经成熟,且来势汹汹。
2)、模拟摄像机面临被终结命运模拟摄像机时代走向终结,实质上是技术革新、市场优胜劣汰的必然结果。
传统模拟摄像机原本分辨率就不高,加之要受到反复的A/D转换、电磁传输干扰、隔行扫描、D1画面的合成反交错等视频损伤的影响,所以无论是D1还是4CIF等只不过是理论数值,实际到达人眼时已经非常的模糊不清了。
关于公交、机场等公共安全场所的监控形同虚设的报道不断见诸报端,媒体更是称此类摄像机为“睁眼瞎”。
从性能而言,数字百万高清摄像机可以说是全面超越了传统的模拟摄像机。
模拟摄像机技术在发展中出现了各种瓶颈与限制,而数字百万高清产品的突出特点则克服了这些限制,在画质方面实现了飞跃。
数字摄像机采用的是数字信号传输,它将光信号转化为数字信号,然后由DSP进行图像压缩与处理,最后通过网络将数字压缩视频输出,在抗电磁干扰性、逐行扫描、画面分辨率方面都拥有传统模拟摄像机所不能比拟的优势。
智能化招标技术要求
招标技术要求为了项目项目智能化工程项目顺利实施,特出此招标技术要求及弱电初步设计图纸。
一、总体设计要求及系统分类项目共包括四座塔楼,其中1#、2#为办公楼,3#、4#楼1-2层为商业区及临时售楼处,3F以上为公寓楼,地下负一层、负二层可通过电梯厅及消防通道进入单元。
智能化系统招标范围:1、半数字可视对讲系统,含物业信息发布系统,仅包括3#、4#楼。
2、园区及地库车辆出入口远距离射频卡及临时卡管理系统3、百万高清数字视频安防监控系统,含地库、园区4、离散式电子巡更管理系统5、园区弱电管网为综合弱电管网,包括市政弱电、园区监控摄像机等,按照济南同圆设计院图纸进行管线预留,最终通过楼层弱电桥架到弱电井,并汇集到地库总桥架。
二、主要子系统设计概况1、半数字可视对讲系统由于4#楼标准层为一体21户,29层,3#楼标准层为一体26户,20层,(一二层为商铺,无对讲)常规模拟对讲无法可靠实现功能,彩色可视对讲系统设备已由我公司采购,选用厦门求实半数字对讲品牌。
系统由管理中心的管理主机,单元入口的门口主机,室内可视分机、系统电源及楼层转换器所组成。
布线必须采用网线布线,不得采用传统模拟信号线。
要求对讲必须支持1台主机带700台分机以上,并支持一层楼26户解码。
各集成商需联系厂家配齐系统所需各类配件及施工辅材。
1.1设计原则和标准为使本系统达到技术先进,经济实用,安全可靠,质量优良的要求,设计中遵循以下原则:(1)对讲品牌:可视对讲产品品牌由我公司采购部确定,主材为甲供,其他线缆附件、锁具等安装附件由集成商负责提供并对整个对讲系统安装负责。
(2)先进性本次招标可视对讲采用数字模拟转换(半数字)技术或基于差分传输技术的系统,不得采用传统模拟多芯线+视频线模式。
系统由管理中心的管理主机,首层单元门上的门口主机、地库一、二层进入电梯厅主通道对讲主机,室内采用3.5寸彩色可视分机、系统电源及一系列的信号类产品所组成。
(3)系统特点:1)系统入户及单元主干采用标准超5类网线及电源线连接,比传统多芯线+视频线成本低2)维保方便:系统采用网线连接,降低线材成本与施工时间。
1-s2.0-S0927775715303460-main
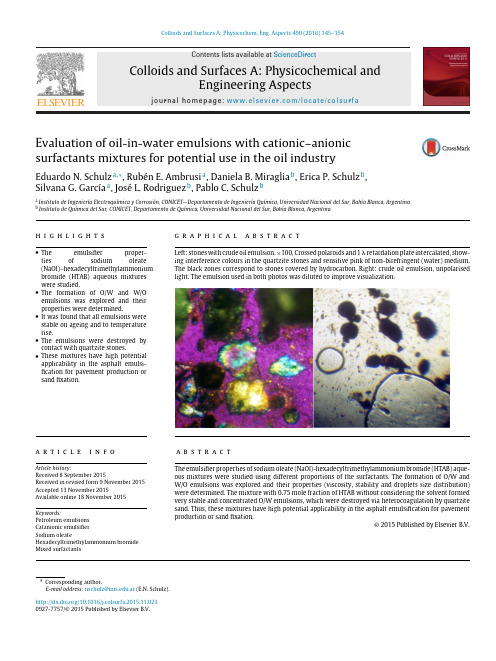
Colloids and Surfaces A:Physicochem.Eng.Aspects 490(2016)145–154Contents lists available at ScienceDirectColloids and Surfaces A:Physicochemical andEngineeringAspectsj o u r n a l h o m e p a g e :w w w.e l s e v i e r.c o m /l o c a t e /c o l s u r faEvaluation of oil-in-water emulsions with cationic–anionic surfactants mixtures for potential use in the oil industryEduardo N.Schulz a ,∗,Rubén E.Ambrusi a ,Daniela B.Miraglia b ,Erica P.Schulz b ,Silvana G.García a ,JoséL.Rodriguez b ,Pablo C.Schulz ba Instituto de Ingeniería Electroquímica y Corrosión,CONICET—Departamento de Ingeniería Química,Universidad Nacional del Sur,Bahía Blanca,Argentina bInstituto de Química del Sur,CONICET,Departamento de Química,Universidad Nacional del Sur,Bahía Blanca,Argentinah i g h l i g h t s•Theemulsifier proper-ties of sodium oleate(NaOl)–hexadecyltrimethylammonium bromide (HTAB)aqueous mixtures were studied.•The formation of O/W and W/O emulsions was explored and their properties were determined.•It was found that all emulsions were stable on ageing and to temperature rise.•The emulsions were destroyed by contact with quartzite stones.•These mixtures have high potential applicability in the asphalt emulsi-fication for pavement production or sand fixation.g r a p h i c a la b s t r a c tLeft:stones with crude oil emulsion.×100,Crossed polaroids and 1retardation plate intercalated,show-ing interference colours in the quartzite stones and sensitive pink of non-birefringent (water)medium.The black zones correspond to stones covered by hydrocarbon.Right:crude oil emulsion,unpolarised light.The emulsion used in both photos was diluted to improvevisualization.a r t i c l ei n f oArticle history:Received 8September 2015Received in revised form 9November 2015Accepted 13November 2015Available online 18November 2015Keywords:Petroleum emulsions Catanionic emulsifier Sodium oleateHexadecyltrimethylammonium bromide Mixed surfactantsa b s t r a c tThe emulsifier properties of sodium oleate (NaOl)-hexadecyltrimethylammonium bromide (HTAB)aque-ous mixtures were studied using different proportions of the surfactants.The formation of O/W and W/O emulsions was explored and their properties (viscosity,stability and droplets size distribution)were determined.The mixture with 0.75mole fraction of HTAB without considering the solvent formed very stable and concentrated O/W emulsions,which were destroyed via heterocoagulation by quartzite sand.Thus,these mixtures have high potential applicability in the asphalt emulsification for pavement production or sand fixation.©2015Published by Elsevier B.V.∗Corresponding author.E-mail address:nschulz@.ar (E.N.Schulz)./10.1016/j.colsurfa.2015.11.0230927-7757/©2015Published by Elsevier B.V.146 E.N.Schulz et al./Colloids and Surfaces A:Physicochem.Eng.Aspects490(2016)145–1541.IntroductionStable emulsions of heavy oils or bitumen in water are widely used to extract,transport and store petroleum.These emulsions are an alternative to the increase of temperature for the mixing of asphalt with light oils,which involve high costs and technical complexity[1,2].O/W bitumen emulsions have been also employed as combustible in electricity power plants[3].Desire features of these emulsions are high stability and low viscosity.Other applications of asphalt emulsions are road construction and roof water-proofing.In particular,these emulsions have many advantages for road reparation compared to melted asphalt:easier implementation,fewer precautions and no need of special equip-ment,as well as their applicability to wet surfaces,a very attractive characteristic.The speed of rupture of the asphalt emulsion on the mineral substrate is of primary importance.On the one hand, enough time must be allowed for proper mixing of the various com-ponents of the system but,on the other hand,the breaking time must be short enough to permit a rapid re-opening of the road to traffic[4].Bitumen is a high viscosity mixture of hydrocarbons(>104 cP).“Synthetic”bitumen is best known as asphalt and is a petroleum-like material obtained as a residue from the distillation of petroleum[5]with a consistency varying from viscous liquid to glassy solid.Asphalt is commonly employed as a binder of aggre-gates for road pavement[6].Asphalt emulsions are commonly either anionic or cationic. Their rupture in contact with stones is caused by the destabiliza-tion of the emulsifier.Polyvalent cations,such as Ca+2and Mg+2(in basic stones such as calcareous ones),react with anionic surfactants producing uncharged insoluble soaps while the negative charge of acid siliceous surfaces reacts with cationic surfactants causing elec-trostatic adsorption.The adsorbed cationic surfactants show their hydrocarbon chains out of the stones’surface,causing its hydropho-bization and thus increasing the tendency of asphalt to adsorb on the stones,promoting the adhesion between the hydrocarbon and the mineral surfaces.Moreover,the surfactant monolayer reduces the affinity of the stones’surface towards water,thus reducing its tendency to destroy the pavement.Water penetration causes strip-ping of the bitumen from the aggregate particles,consequently endangering the subgrade layer as well as the base course[7].A catanionic(anionic–cationic surfactant mixture)emulsifier will have both the advantages of cationic and anionic emulsions. However,in general cationic–anionic surfactant mixtures tend to precipitate in some proportions.We have previously studied a catanionic mixture which does not precipitate in any proportion [8–10].Sodium oleate(NaOl)–hexadecyltrimethylammonium bro-mide(HTAB)mixtures form soluble systems at all NaOl–HTAB proportions.This mixture does not precipitate at any composition because to steric hindrances,which were attributed to the affinity of the NaOl double bond to water via hydrogen bonding.Thus NaOl acts as a surfactant having two hydrophilic groups,the carboxylate and the double bond.This causes a curvature of the aggregate/water surface which favours the O/W emulsification[6–8].NaOl is a nat-ural,biodegradable soap which is innocuous for the environment. HTAB has bactericide capacity but it is not dispersed in the environ-ment because it is strongly adsorbed by the negative stones’surface and remains below the asphalt layer.Thus,the system NaOl–HTAB seems to have interesting features that makes it attractive for prac-tical applications,especially in the petroleum industry.In the present work the emulsifier capability of different mix-tures of NaOl–HTAB with Argentine crude oil(CO)and with model liquid paraffin(LP)has been studied.The behaviour of the emul-sions in contact with a petrous substrate has been also studied in order to evaluate their possible use in pavement production.Our findings are of practical and theoretical interest in the oil emulsions field and set the basis for the future study of the emulsification properties for heavy oil.2.Experimental2.1.MaterialsFor paraffin emulsions,extra dense liquid paraffin(LP)EWE with viscosity Seyboldt340s and75centi-Stokes was used as purchased.Hexadecyltrimethylammonium bromide(HTAB, C16H32N(CH3)3Br>99%)was from Fluka.Sodium oleate(NaOL, C18H33O2Na>99%)was from Aldrich.Both chemicals were of ana-lytical grade and were used as purchased.The crude oil(CO)of35◦API(0.870g cm−3)has kinematic vis-cosity10.7mm2s−1and dynamic viscosity96.7cp(both at20◦C) and does not contain aromatic compounds,asphaltenes or other chemicals[11].It has been kindly supplied by the Petrobras Bahia Blanca refinery and is from the Neuquen oilfield(Argentina).The stones were from the Pigüéquarry(Argentina)and were selected because of their poor performance to produce pavements with commercial asphalt emulsions.Their treatment with a com-mercial asphalt emulsion achieved only an incomplete coverage of the stones’surface,which leaves the pavement vulnerable to water penetration[12].LP and CO were selected because of their easier manipulation than heavy oils and bitumen.Once the possibility of using the mix-ture for emulsifying hydrocarbons is stated,it is possible to study the formation of bitumen emulsions.We used Argentinian crude oil,which is free of asphaltenes,due to a matter of availability.Tri-distillated water was used and the measurements were per-formed twice.2.2.EmulsionsAqueous emulsifier solutions of HTAB and NaOL with0.1M were prepared at the mole fractions of HTAB in the surfactant mixture without considering the solvent(˛HTAB)0.1;0.25;0.3;0.50;0.7;0.75;0.9and1.Each emulsion was stirred for15min with a steel helix stirring electric device at800rpm after the addition of the second phase.Emulsions of Argentine petroleum were prepared according to two procedures:a)The aqueous surfactant solution(50mL)was added in aliquotsof2mL to50mL of CO under stirring.Then,15mL of each sam-ple was put in a graduate tube and stoppered.The volume of the emulsion was determined immediately,after24h and after a week’s time.The emulsions were observed by means of a micro-scope.b)The CO(50mL)was added to50mL of the aqueous surfactantsolution in aliquots of2mL under stirring and the emulsions were observed as in procedure a.An additional observation was made after14months.Since the Argentine petroleum was paraffinic(see below),we used for the main determinations a model emulsion with liquid paraffin which facilitates the observation because it is colourless. The model emulsions were prepared with surfactant mixture(0.1M in water)with˛HTAB=0.1;0.25;0.50and0.75.Then,60mL of liquid paraffin was added to40mL of the aqueous surfactant solutions and stirred during15min.The systems were transferred to graduated tubes and the volumes of emulsion,remnant water and remainder paraffin were recorded.Samples of the freshly prepared emulsions for microscopic observation were kept in separated sealed vials.Samples with˛HTAB=0.25;0.50and0.75were observed in a microscope Nikon Eclipse E-200POL Polarizing,Tokyo,Japan.E.N.Schulz et al./Colloids and Surfaces A:Physicochem.Eng.Aspects490(2016)145–154147Table1Volumes of W/O emulsion and remnant(non-emulsified)water in10mL samples as a function of the surfactant composition.A week old samples after centrifugation.␣HTAB00.10.30.50.70.91V W/Oemulsion/mL 2.9 1.20.3 3.30.20.50.2V water/mL7.18.89.7* 6.79.8**9.59.8****W/O/W emulsion.**O/W emulsion.***Multiple emulsion.Unless stated otherwise,all observations were made with×100 magnification.Nonetheless,scale bars were added to the photos. As both phases are transparent and colourless,a drop of aqueous solution of methylene blue was added to determine the nature of the emulsion.In all cases the dye diffused amongst the emulsion droplets,thus all emulsions were O/W.The emulsions remained stable during the microscope observations although no stabilizer was added(such as a gelatine solution)[13].The viscosity(Á)of emulsions was measured with a Vibro Viscometer SV-10/SV100calibrated with tri-distilled water (Á=0.89cP at25◦C).The hydrocarbon/water volume ratio in the emulsions was mea-sured using a modified Dean-Stark apparatus[2].To evaluate the effectiveness of stones in destructing the emul-sion and the hydrocarbon deposition on the stones’surface,a powder of the stones was put in contact with the different emul-sions and observed under the microscope.In order to reproduce the procedure in real working conditions,the mineral substrate was used as received,without any pre-treatment.The X-ray diffraction spectrum of the stones employed in the test of stability of emulsion was made in a Phillips PW1710 diffractometer with Cu anode and curved graphite monocromator operated at54kW and30mA.FT-IR measurements were performed with an Infrared Spec-trophotometer(Nicolet FT-IR,Model Nexus470)to test the CO structure.The size distribution of droplets was determined with a com-puter program(Pixcavator IA).As a size reference,the width of the hair in Fig.3a was used(a similar method was used for other magnifications).Averages and variances values were computed by the minimum variance linear unbiased method[14]and the Student t function was employed to compute the error intervals.Confidence level was 0.90.Errors of derived data were computed with the error expan-sion method.3.ResultsThe X-ray diffractogram(Fig.1in Supplementary information, SI)indicates that the stones’nature is clastic sedimentary rock—S0, formed by silica(ortho-quartzite).The petroleum FT-IR spectrum(not shown)showed only paraffinic hydrocarbon peaks(CH3;CH2stretching vibra-tions at3000–2850cm−1and CH3;CH2bending vibrations at 1480–1350cm−1).3.1.Petroleum emulsionsChanging the order of addition of the components while stir-ring produced two different kinds of emulsions.The addition of the surfactant aqueous solution to crude oil produced a W/O emul-sion(see Fig.1).Freshly prepared samples did not show significant phase separation.The emulsion could be separated by centrifuga-tion at2000rpm only after a week from preparation.Due to the petroleum colour,a Cole-Palmer Iluminator41720-series was used. Table1shows the relative volumes of emulsion as a function of the mixture composition.Pure NaOl(˛HTAB=0)had poor emulsifying capacity,but the addition of a small amount of HTAB(˛HTAB=0.1) produced a good W/O emulsion with small polydisperse droplets (Fig.1a).Further addition of HTAB produced a very polydisperse W/O emulsion(Fig.1b and c).With˛HTAB=0.3two kinds of emul-sions appeared:the W/O and a multiple emulsion O/W/O,and with ˛HTAB=0.7there coexist W/O and O/W emulsions.As we desired O/W emulsions we employed procedure b:addi-tion of the crude oil to the surfactant solution under stirring.Fig.2 shows microscopic images of two of the emulsions obtained with ˛HTAB=0.75.The concentrated emulsion was diluted with water to improve the observation.3.2.Paraffin emulsionsOwing to the difficulty caused by the strong colour of the crude oil to the visual examination and microphotographs analysis,we decided to make model emulsions with liquid paraffin,which is colourless and whose composition and viscosity are similar to that of the crude oil.Since the amount of surfactant affects the size of the droplets,we have used the same amount of surfactant in all the emulsions to compare the effect of the mixture composition.On the basis of the preceding results,we used only surfactant solutions having˛HTAB=0.1;0.25;0.5and0.75.Since we were interested in O/W emulsions,these were prepared by dropping the paraffin to the aqueous emulgent solution under stirring.The nature of the emulsion(O/W)was determined by diffusion of a drop of a methylene blue aqueous solution in the continuous phase, viewed through the microscope(Fig.2in the SI).Fig.3shows the emulsions obtained with different surfactant compositions.The size distribution of droplets was graphically determined using a computer program(Pixcavator IA)on the pho-tomicrographs.The freshly prepared emulsions did not show remnant water or paraffin.The viscosity(Á)of the emulsion at25◦C were13.20cP for ˛HTAB=0.25;47.00cP for˛HTAB=0.5and382.00cP for˛HTAB=0.75. The droplets size distribution is shown in Fig.4.The particle size of an emulsion is one of the most important characteristics[13].Droplets size and droplets size distribution can be used as indexes of state of an emulsion and are intimately related to their stability,resistance to creaming,rheology,and chemical reactivity[15].Two emulsions may have the same average droplet diameter and yet exhibit quite dissimilar behaviours because of differences in their distribution of diameters.The droplet size distribution for˛HTAB=0.25is unimodal and broad while that for˛HTAB=0.50is multimodal with lower maxima. When˛HTAB is0.75the distribution is a narrow,unimodal and cen-tred in the smaller size.Emulsions with a droplet-size distribution with a maximum of low diameter droplets and with this maximum sharply defined represent a situation of maximum stability[16].To study the stability of the emulsions,these were aged in sealed graduated tubes.The separation of emulsion and water when the systems were aged can be seen in Fig.5.The emulsions still remained stable after14months.(Fig.3in SI).The aged emulsion with˛HTAB=0.75had a LP content73%V/V. Natural bitumen emulsions contain between70and80%V/V of bitumen separated by tiny layer of water,while asphaltic emulsions usually contain about60%V/V[9].The size distribution is shifted towards smaller droplets when aged,as shown in Fig.6for˛HTAB=0.25(the other surfactant com-positions showed similar behaviour).To determine the efficiency of the surfactant mixtures to emul-sify LP,20mL of emulsion having˛HTAB=0.25was completed to 100mL with liquid paraffin and stirred.After a day,there was1mL of supernatant paraffin,i.e.1.412g of surfactant mixture was capa-ble of emulsifying91mL of paraffin.The size distribution of droplets148E.N.Schulz et al./Colloids and Surfaces A:Physicochem.Eng.Aspects 490(2016)145–154Fig.1.W/O emulsions produced by dropping aqueous surfactant solution to crude oil under stirring.×100.(a)˛HTAB =0.1,(b)˛HTAB =0.7,(c)˛HTAB =1.The bar corresponds to 0.2mm.Fig.2.O/W emulsion obtained by dropping crude oil to the aqueous surfactant solution under stirring.˛HTAB =0.75,×100.(a)emulsion diluted with 25%water,(b)emulsion diluted with 50%water.The bar corresponds to 0.2mm.was almost unimodal and is shown in Fig.7.After one year only 20mL of paraffin was separated while the remaining emulsion was stable (see Fig.3in SI)with the separation of the remnant water (below)and paraffin (above).Similar results were obtained with the other compositions.No agglomeration or coalescence was observed during the microscope observations,even after one hour of preparing the sam-ples.To test the temperature stability of emulsions,samples of the three emulsions (with ˛HTAB =0.25,0.5,and 0.75)were placed between slides and heated with a temperature-controlled stage at the microscope.Photos were taken at different temperatures up to the ebullition of water (Fig.8).Vapour bubbles and LP droplets differentiate by the aspect of their borders as a consequence of the different refractive index:the borders are black and thick in the vapour bubbles and light grey in the LP droplets.Emulsion with ˛HTAB =0.25became more fluid at 83◦C and the larger droplets disappeared but the smaller ones were retained.At 111.5◦C the emulsion flowed and the water started to boil.Fig.8band c shows the vapour bubbles that grew with increasing temper-ature.The oil droplets are smaller.At a temperature of 118◦C the emulsion started to break,to be almost completely broken at 119◦C.Fig.9shows the evolution of the droplets size with the raising tem-perature:the multimodal distribution of larger droplets trends to form a bimodal distribution of smaller droplets.Emulsions with ˛HTAB =0.5remained stable up to 103◦C,when vapour bubbles appeared.At 115◦C the system flowed and at 124.5◦C it collapsed.Fig.10shows the evolution of the size distribu-tion of droplets with raising temperature:it remained multimodal but shifted towards smaller droplets.Emulsion with ˛HTAB =0.75became fluid at 83.6◦C and the excess of water was separated forming small domains that started to disappear at 104◦C.Some bubbles of vapour appeared and grew with the increasing temperature.Some emulsion was remained up to 122◦C.The size of oil droplets was reduced when the temper-ature was increased from 37.5◦C to 67.5◦C,and the distribution became narrower.Further increase of temperature did not affectE.N.Schulz et al./Colloids and Surfaces A:Physicochem.Eng.Aspects490(2016)145–154149Fig.3.microscope photos of fresh emulsions having˛HTAB=0.25(a)×100,0.5(b)×100,0.75(c)×100and0.75(d)×400.The line in photo(a)is a hair,having0.090mm in width,and used to calibrate the size of droplets.Bars in photos a–c correspond to0.2mm,in photo d,to0.1mm.Fig.4.size distribution of freshly prepared emulsion having˛HTAB=0.25,˛HTAB=0.50and˛HTAB=0.75.Distribution parameters: :number average, standard deviation, Max:maximum.the size distribution.Fig.11shows the size distribution of droplets as a function of temperature.The stability of the emulsions was not affected by two freeze–thaw cycles between−5and25◦C,with8h in each tem-perature.In conclusion,the three compositions gave emulsions stable up to the temperature of water boiling.The size distribution in all cases is shifted to smaller droplets when temperature is increased.The size behaviour on ageing and heating of emulsions is rather unusual.A possible explanation may be creaming of large oil droplets and therefore shifting the size distribution of the remain-ing emulsion down.Since samples were taken from different parts of the emulsion,the large droplets probably collapse giving rise to the narrow non-emulsified oil layer.Another possible explanation may be a rearrangement of the surfactant molecules in the droplets interface.Oleate molecules can fold to expose the double bond at the interface,since they tend to form hydrogen bonds with water with theirelectrons[17].This may lead to an average packing parameter of the mixture of surfactants that favours the formation of a hydrocarbon droplet with a given curvature generating a nar-150E.N.Schulz et al./Colloids and Surfaces A:Physicochem.Eng.Aspects 490(2016)145–154Fig.5.Dependence on time of the volume percent of remnant emulsion (full symbols)and water (open symbols),ᮀ:˛HTAB =0.75; :˛HTAB =0.50;᭹ :˛HTAB =0.25.010********60708000.050.10.150.20.250.3D / mmf / %Fig.6.Evolution with time of emulsion prepared with ˛HTAB =0.25.rower size distribution.This mechanism needs some time,and willbe accelerated with temperature.As suggested by Anton et al.[18]mixtures of anionic and cationic surfactants may be considered as 1:1complexes and the remain-der molecules of the surfactant in excess.The Ol.HTA complex has a large hydrophilic part formed by one N(CH 3)3+group from HTA +ion,and the COO −and CH CH groups of Ol −ion.As previously mentioned it has been found that the double bond has affinity to water,forming H-bonds with the electrons [19–21].The tail of the oleate ion is thus folded to put the CH CH group in contact with water in aggregates such as micelles or air/water monolayers [6–8].This produces a structure of the complex like a cone with the hydrophilic part at the basis,i.e.favouring a curved surface convex to the water.The behaviour of another cationic–anionic surfactant mixture which does not precipitate at any proportion (although it forms a coacervate in some proportions),sodium 10-undecenoate-dodecyltrimethylammonium bromide [19,22,23],was explained by the same phenomenon.This explains why the O/W emulsion isfavoured and why the system does not precipitate even at the 1:1proportion.Similar reasons have been proposed in literature for other cationic/anionic surfactant mixtures which do not precipitate [24].The mixture with ˛HTAB =0.75is the best to produce O/W emulsions,i.e.once the 1:1complex was formed,two thirds of the hydrophilic HTAB molecules remain free.Then,the system is formed by an excess of hydrophilic surfactant which promotes O/W emulsion formation,and the complex which has a structure that accommodates to the same oil/water interface geometry.The droplets size decreases with time and with increasing tem-perature probably due to that part of the surfactant that remained in the aqueous phase and migrate by diffusion to the droplets sur-face.This takes time but is accelerated by the temperature rise.The molecules and 1:1complexes arriving to the oil/water inter-face must accommodate increasing the surface area,what may only occur with a diminution of the droplets’size when the total oil volume is constant.E.N.Schulz et al./Colloids and Surfaces A:Physicochem.Eng.Aspects 490(2016)145–1541511020304050607080900.0000.020 0.040 0.060 0.080 0.100 0.120 0.140 0.160 0.1800.200D / mmf / %Max 0.035 mm = 0.039 mm = 0.025 mmFig.7.size distribution of droplets for ˛HTAB =0.25saturated withparaffin.Fig.8.Evolution of emulsions with temperature,microscope photos ×100of emulsion width ˛HTAB =0.25(a)at 48◦C,(b)102◦C,(c)at 111.5◦C.Emulsion with ˛HTAB =0.5(d)at 38◦C,(e)at 100◦C,(f)at 103◦C.Emulsion with ˛HTAB =0.75(g)at 37.7◦C,(h)at 83.5◦C,(i)at 109◦C.The bars correspond to 0.2mm.3.3.Destruction of emulsion by stonesThe emulsions were put in contact with powdered stones and observed under microscope to determine their applicability in the production of pavements.The emulsion with ˛HTAB =0.75showed the best performance in the previous experiments so it was theonly one evaluated for this purpose.The droplets were clustered on the stones’surface and were subsequently destroyed.The destruc-tion of the emulsion was very rapid and finished in 15min.Fig.12shows the evolution of the CO emulsion with ˛HTAB =0.75in contact with the powdered stones which were almost completely covered.152E.N.Schulz et al./Colloids and Surfaces A:Physicochem.Eng.Aspects 490(2016)145–154010203040506000.0050.010.0150.020.025D / mmf / %Fig.9.Evolution of the size distribution of droplets with temperature for ˛HTAB =0.2505101520250.0050.010.0150.020.0250.030.0350.040.045D / mmf / %Fig.10.Evolution of the size distribution of droplets with temperature for ˛HTAB =0.50.Fig.11.Size distribution of droplets having ˛HTAB =0.75as a function of temperature.E.N.Schulz et al./Colloids and Surfaces A:Physicochem.Eng.Aspects490(2016)145–154153Fig.12.Photomicrographs of the emulsion destruction in contact with stones.×100,˛HTAB=0.75.(a)Diluted CO emulsion just added to the stones,(b)after5min,droplets were aggregated close to the stones,(c)after10min,(d)after30min,(e)after24h,(f)commercial cationic emulsion after30min.Photos a,b and f with polarized light and 1retardation plate intercalated.The other photos are with unpolarised light.Bars indicate0.2mm.The crude oil emulsion was previously diluted with20%water to improve visualization.The clear regions are water between stones.The destruction of the emulsion by stones seems to follow the mechanism called heteroflocculation[25],i.e.the oil droplets clus-ter together around the stones followed by their coalescence on the solid surface.In this sense,some HTAB molecules dissolved in the aqueous phase may hydrophobize the rock surface improving the adherence of the oil.The breaking time of emulsions is known to be affected by the nature of the aggregate and its specific area,humidity,surfactant concentration,pH,and temperature[4],therefore the speed of breaking in roads industry may be different to that found in our lab-oratory conditions.Due to the short time of breaking,this emulsion may be useful as an imprinting irrigation,i.e.irrigation of surfaces to produce a transition surface with the new asphaltic layer ensuring the anchoring of this layer,or to stabilize sands[26].154 E.N.Schulz et al./Colloids and Surfaces A:Physicochem.Eng.Aspects490(2016)145–1544.ConclusionsNaOl–HTAB mixtures revealed to be good O/W emulsifiers.The system having˛HTAB=0.75gave the largest volume of emulsion having a narrow unimodal size distribution with smaller droplets. This emulsion has a relatively high viscosity.All emulsions were stable on ageing and to temperature rise.The emulsions were destroyed by contact with quartzite stones.These properties may be useful for different applications in petroleum industry such as their use as fuels,transport and pavement production.AknowledgementsENS is an assistant researcher of the Argentine National Council of Scientific and Technical Researches(CONICET),EPS is an adjunct researcher of CONICET.REA has a post-doctoral fellowship of CON-ICET.This research was supported by a grant of the Universidad Nacional del Sur.Appendix A.Supplementary dataSupplementary data associated with this article can be found,in the online version,at /10.1016/j.colsurfa.2015.11. 023.References[1]N.Delgado,F.Ysambertt,C.Montiel,G.Chávez,A.Cáceres,B.Bravo,N.Márquez,Evaluation of oil-in-water emulsions with non-ionic and anionicsurfactants mixtures for potential use in the oil industry,Rev.Téc.Ing.Univ.Zulia30(2)(2007)118–127(in Spanish).[2]L.Schramm,Surfactants:Fundamentals and Applications in the PetroleumIndustry,Cambridge University Press,Cambridge,2000.[3]H.Rivas,X.Gutiérrez,Surfactants:behavior and some of their applications inthe petroleum industry,Acta Cient.Venez.50(Suppl.No.1)(1999)54–65. [4]M.Bourrel,C.Chambu,Cationic asphalt emulsions:breaking on mineralsubstrates,in:Proceedings2nd World Surfactant Congress1988,IV,Paris,1988,pp.145–161.[5]G.Urbina-Villalba,M.García-Sucre,Effect of non-homogeneous spatialdistributions of surfactants on the stability of high-content bitumen-in-water emulsions,Interciencia25(9)(2000)415–422.[6]M.Chappat,Some applications of emulsions,Colloids Surf.A Phys.Eng.Aspects91(1994)57–77.[7]W.S.Abdulla,M.T.Obaidat,N.M.Abu-Sa’da,Influence of aggregate type andgradation on voids of asphalt concrete pavements,J.Mater.Civil Eng.1988 (1988)76–85.[8]N.El-Kadi,F.Martins,D.Clausse,P.C.Schulz,Critical micelle concentration ofaqueous hexadecyltrimetylammonium bromide–sodium oleate mixtures,Colloid Polym.Sci.281(2003)353–362.[9]D.B.Miraglia,E.N.Schulz,J.L.M.Rodriguez,P.C.Schulz,D.Salinas,Sodiumoleate–cetyltrimethylammonium bromide mixtures,J.Colloid Interface Sci.351(2010)197–202.[10]D.B.Miraglia,J.L.M.Rodríguez,R.M.Minardi,P.C.Schulz,Critical micelleconcentration and hlb of the sodium oleate–hexadecyltrimethylammonium bromide mixed system,J.Surfactants Deterg.14(2011)401–408.[11]P.V.Messina,O.Pieroni,V.Verdinelli,P.C.Schulz,Regarding the effect thatdifferent twin tailed surfactants have on a solid stabilized petroleumemulsion,Colloid Polym.Sci.286(2008)191–199.[12]V.Verdinelli,M.A.Morini,P.V.Messina,P.C.Schulz,S.Alvarez,Study ofcompatibility of quartzite stones–Pigüéquarry–with asphalt emulsions,in: Proceedings of the XXXIV Reunión del Asfalto Dr.Alfredo Pinilla,Mar delPlata,Argentina,2006(in Spanish).[13]B.H.Bishop,J.L.Wulfinghoff,Practical Emulsions,vol.1,3rd ed.,ChemicalPublishing Co.,Inc.,New York,1968.[14]J.Mandel,Statistical Analysis of Experimental Data,Interscience,New York,1964,pp.134–137.[15]P.Becher,Encyclopedia of Emulsion Technology,vol.1,Dekker,New York andBasel,1983,pp.369.[16]P.Becher,Emulsions Theory and Practice,American Chemical SocietyMonograph Series No.162,2nd ed.,R.E.Krieger Pub.Co.,New York,1977. [17]P.Messina,M.A.Morini,P.C.Schulz,Aqueous sodium oleate-sodiumdehydrocholate mixtures at low concentration,Colloid Polym.Sci.281(11) (2003)1082–1091.[18]R.E.Anton,D.Gomez,A.Graciaa,chaise,J.L.Salaguer,Surfactant–oil–water systems near the affinity inversion part ix:optimumformulation and phase behavior of mixed anionic–cationic systems,J.Dispersion Sci.Technol.14(4)(1993)401–416.[19]M.B.Sierra,M.A.Morini,P.C.Schulz,The catanionic system sodiumundecenoate-dodecyltrimethylammonium bromide at low concentration,Colloid Polym.Sci.282(6)(2004)633–641,and references therein.[20]M.L.Ferreira,M.B.Sierra,M.A.Morini,P.C.Schulz,A computational study ofthe structure and behaviour of the aqueous mixed system sodiumunsaturated carboxylate–dodecyltrimethylammonium bromide,J.Phys.Chem.110(2006)17600–17606.[21]M.B.Sierra,M.A.Morini,P.C.Schulz,E.Junquera,E.Aicart,Effect of doublebonds in the formation of sodium dodecanoate and sodium10-undecenoate mixed micelles in water,J.Phys.Chem.B111(2007)11692–11699.[22]M.B.Sierra,M.A.Morini,P.C.Schulz,M.L.Ferreira,Unusual volumetric andhydration behavior of the catanionic system sodium undecenoate—dodecyltrimethylammonium bromide,Colloid Polym.Sci.283(2005)1016–1024.[23]M.B.Sierra,P.V.Messina,M.A.Morini,J.M.Ruso,G.Prieto,P.C.Schulz,F.Sarmiento,The nature of the coacervate formed in the aqueousdodecyltrimethylammonium bromide–sodium10-undecenoate mixtures,Colloids Surf.A:Phys.Eng.Aspects277(2006)75–82.[24]G.Kume,M.Gallotti,G.Nunes,Review on anionic/cationic surfactantmixtures,J.Surfactants Deterg.11(2008)1–11.[25]R.A.Mercado,V.Sadtler,P.Marchal,L.Chopin,J.L.Salager,Heteroflocculationof a cationic oil-in-water emulsion resulting from Fontainebleau’sandstone powder addition as a model for asphalt emulsion breakup,Ind.Eng.Chem.Res.51(2012)11688–11694.[26]K.P.George,Stabilization of sands by asphalt emulsion,Transp.Res.Rec.1976(1976)51–56.。
XXXXXX天网数字百万高清监控系统方案

“天网”工程解决方案项目名称: XXXXX“天网”工程设计单位:XXXXXX电子设备有限公司日期: 20XX年XX月XX日第一章百万高清监控系统行业引导高清数字监控系统是监控报警业界的新型产品,它将数字化视频图像记录与多画面图像显示功能和监视报警功能结合在一起,将逐步取代传统模拟式监控系统。
1)、数字高清已成视频监控必然趋势由于压缩算法、光学、图像处理、网络等技术的革新,数字高清摄像机已经从概念成为现实。
一年一度的安博会是安防行业的风向标,从2008年和2009年安博会不难看出,各路厂家商家谈论的焦点已经从D1画质转移到720P (1280X720,逐行扫描图像)、1080i(1920X1080,隔行扫描图像)高清影像。
此外,随着我国“平安城市”天网工程的建设力度逐渐加大,村镇技防建设已在国内部分省区悄然铺开,数字监控产品进入家庭等民用化市场的苗头已经呈现。
2010年1月10日,沈阳市公安局召开新闻发布会,要求凡申请办理停车场的,必须安装高清晰电视监控设备,对原有停车场,各市镇等原有“天网”监控系统要求立即组织安装高清晰电视监控设备。
由此可见,无论是从技术条件,还是市场诉求,监控摄像机进入高清晰度数字时代的条件已经成熟,且来势汹汹。
2)、模拟摄像机面临被终结命运模拟摄像机时代走向终结,实质上是技术革新、市场优胜劣汰的必然结果。
传统模拟摄像机原本分辨率就不高,加之要受到反复的A/D转换、电磁传输干扰、隔行扫描、D1画面的合成反交错等视频损伤的影响,所以无论是D1还是4CIF等只不过是理论数值,实际到达人眼时已经非常的模糊不清了。
关于公交、机场等公共安全场所的监控形同虚设的报道不断见诸报端,媒体更是称此类摄像机为“睁眼瞎”。
从性能而言,数字百万高清摄像机可以说是全面超越了传统的模拟摄像机。
模拟摄像机技术在发展中出现了各种瓶颈与限制,而数字百万高清产品的突出特点则克服了这些限制,在画质方面实现了飞跃。
高清监控系统组网讲解

网络构建
影响视频监控流畅度的因素
网络延迟,为主要的因素,通常来说网络延迟越低,视频的 流畅度也越高。 网络带宽,为主要的因素,通常来说带宽越高,视频的流畅 度也越高。 设备包转发率,通常包转发率越高,转发性能越好,网络设 备处理视频流的转发能力也越快,画面流畅度和清晰度也更 高。
广域网的监控(2)
其他的解决视频流NAT穿越的方法: 1.固定公网IP+DHCP服务器 2.域名解析服务器+域名/IP+端口映射
数据承载性能
网络构建
数据流转发机制
视频监控层
视频预览数据流
前端摄像机 控制数据流
存储数据流
网络链路层
监控系统承载网络
应用层/ 表示层/ 会话层
分控子系统
主控系统
分控子系统
视频监控网络的层次性划分
核心层 中心-平台应用业务
汇聚层 链路的汇聚及流量收敛
接入层
接入或控制
网络构建
接入层和汇聚层的作用
接入层:常用于连接高清网络摄像机或其他前端采集设备,提高前端设备连接整 个监控网络的灵活性,同时与汇聚层级联,提高了前端摄像机安装时的部署范围, 延伸了整个系统(例如楼宇综合布线里的水平子系统),接入层交换机的特点是成 本低,端口密度高,提供高的可接入性,以10/100BASE-T网口为摄像机提供接入, 部分设备还支持为前端设备提供POE供电功能。
帧率(F/s)
网络承载性能和图像质量
视频数据对存储、网络传 输的开销占用更大
网络故障对图像产 生的延迟有: 1.图像滞后 2.图像卡顿 3.图像马赛克
码流(Mb/s)
帧率:帧率即画面的流畅性,码率与帧率成正比关系。完全流畅的画面为25帧/秒。我 们可以通过调低帧率来降低码率。 画质(压缩比):摄像机的画质(压缩比)都是可调的,画质越好码率就越高。 画面复杂性:码率与画面复杂性成正比关系,比如镜头对着一面白墙,码率就很低,而 对着一片色彩丰富的场景,码率就会马上变高,相差往往有几倍。 画面动态变化程度:码率与画面变化程度成正比关系,比如镜头对着静止的物体,码率 就很低,而对着一片活动的人群,码率就会马上变高,最多相差可达十倍。
工业园区高清视频监控系统设计方案

工业园区高清视频监控系统设计方案工业园区高清视频监控系统设计方案书一、项目概述本项目为某工业园区高清视频监控系统的设计方案书。
该园区占地面积较大,设施众多,需要实现对各个区域的全面监控。
本方案旨在通过集中存储、NVR、解码等技术手段,实现对园区内所有监控点的高清视频监控。
二、系统架构设计本系统采用分布式架构,主要包括前端监控设备、网络传输、中心存储、后端解码等模块。
其中,前端监控设备包括高清摄像机、云台、红外探测器等,通过网络传输将监控数据传输至中心存储设备。
中心存储设备采用集中式存储方案,通过NVR实现对监控数据的存储和管理。
后端解码设备通过解码技术将监控数据转换为高清视频信号,实现对监控画面的实时显示。
三、系统功能设计本系统主要实现以下功能:1.实时监控:对园区内所有监控点进行实时监控,确保园区安全。
2.录像回放:对监控数据进行存储,并支持录像回放功能,方便安全管理人员查看历史监控画面。
3.报警处理:对异常情况进行分析和判断,并及时发出报警信息,提醒安全管理人员及时处理。
四、系统优势本系统具有以下优势:1.高清画质:采用高清监控设备和解码技术,实现对监控画面的高清显示。
2.分布式架构:采用分布式架构设计,实现对监控数据的快速传输和集中存储。
3.智能分析:通过对监控数据的分析和判断,实现对异常情况的及时发现和处理。
五、总体方案本系统总体方案如下:1.前端监控设备采用高清摄像机、云台、红外探测器等。
2.网络传输采用高速网络,确保监控数据的快速传输。
3.中心存储设备采用集中式存储方案,通过NVR实现对监控数据的存储和管理。
4.后端解码设备采用解码技术,将监控数据转换为高清视频信号,实现对监控画面的实时显示。
5.系统软件采用自主研发的监控软件,支持实时监控、录像回放、报警处理等功能。
六、项目实施计划本项目实施计划如下:1.项目启动:2021年1月1日。
2.系统设计:2021年1月1日至2021年1月31日。
某大型港池造波机控制系统智能化改造研究
某大型港池造波机控制系统智能化改造研究陈俊 倪艺萍 徐奕蒙 王天奕 林柏涵珠江水利委员会珠江水利科学研究院 广东广州 510611摘要:某大型港池多向不规则造波机系统投入使用已有10余年,由于该造波机控制系统软硬件技术落后,存在计算速度慢、故障率高和传输速度慢等问题,无法满足目前波浪物理模型试验复杂波谱及长历时无重复不规则波试验的需求。
为了更加精细、准确地实现高品质波浪谱模拟,故对该控制系统进行智能化改造,构建了基于EtherCAT总线的多向不规则造波机控制结构。
关键词:造波机 控制系统 优化改造 CAN总线 EtherCAT总线中图分类号:TH166文献标识码:A 文章编号:1672-3791(2024)04-0070-04Research on the Intelligent Transformation of the Control System of the Wave Maker for a Large Harbour BasinCHEN Jun NI Yiping XU Yimeng WANG Tianyi LIN Baihan Pearl River Water Resources Research Institute, Pearl River Water Resources Commission, Guangzhou,Guangdong Province, 510611 ChinaAbstract:The multi-directional irregular wave maker system of a large harbour basin has been in use for more than 10 years. Due to the outdated software and hardware technology of the control system of the wave maker, there are problems such as slow calculation speed, high fault rate and slow transmission speed, which cannot meet the current needs of complex spectrum and long-duration non-repetitive irregular wave tests in wave physics model tests. In order to achieve high-quality wave spectrum simulation more finely and accuracely, the control sys⁃tem is intelligently transformed, and the control structure of the multi-directional irregular wave maker based on EtherCAT bus is constructed.Key Words: Wave maker; Control system; Optimization and transformation; CAN bus; EtherCAT bus多向不规则造波机是一种大型海洋仪器装备,其主要功能是在试验港池内产生更加逼近海上真实海况的多向不规则波浪,在水利工程、交通运输工程、海洋工程、环境工程等领域中有广泛应用。
数字摄像机与模拟摄像机的区别

数字摄像机与模拟摄像机的区别集团标准化工作小组 #Q8QGGQT-GX8G08Q8-GNQGJ8-MHHGN#摄像机的数与模方案中心如今视频监控领域已经进入数字、高清、智能时代,可是何为数字其与模拟系统的本质区别是什么优势在哪里其与网络摄像机又有何关系为什么到现在为止数字摄像机的发展总是不瘟不火此文将为你解答。
数字摄像机,其前端多数采用的是百万像素CMOS感光器,由百万像素CMOS将光信号转换成数字信号,然后由DSP进行图像处理与压缩,最后将压缩视频通过网络输出。
波粒的百万高清摄像机就是采用了数码相机里500万像素感光器与DSP,制成了安防行业摄像机,让安防监控的画质如数码相机般清晰。
模拟摄像机前端采用隔行扫描感光器将光信号转换成模拟电信号,接着由DSP进行 A/D转换与色彩处理后,再做D/A转换,最后调制成PAL/NTSC制式电视标准视频信号输出由此可见,网络摄像机并非数字摄像机或者模拟摄像机,它只是反映了视频信号的传输方式,无论前端摄像机是数字还是模拟,只要是通过网络传输的摄像机都叫网络摄像机。
明白了数字与模拟以后我们对两者的优缺点进行比较:●清晰度对比彩色模拟摄像机采集垂直分辨率,PAL制式下625扫描线,去消隐后575线,目前最高达到540线左右已经是极限了,分辨率上比较,模拟摄像机接如后端监控录像设备,分辨率最高为4CIF或D1,约40万像素,而数字摄像机则可以高达百万像素以上。
●扫描方式对比数字高清摄像机采用逐行扫描,每一帧图像均是由电子束顺序地一行接着一行连续扫描而成。
而模拟摄像机则采用隔行扫描,隔行扫描的行扫描频率为逐行扫描时的一半,隔行扫描会带来许多缺点,如会产生行间闪烁效应、边沿锯齿化现象等不良效应.隔行扫描会导致运动画面清晰度降低。
●视频处理对比模拟摄像机输出模拟视频信号到后端DVR等设备。
DVR通过最前端的DOCODE (采集芯片)将模拟信号转成数字信号,首先得到的是half D1分辨率画面, 再进行压缩后得到CIF画面。
μPD720114

μPD720114
APLL ALL_TT
CDR DPC DP(n)_PHY EP0 EP1 F_TIM (Frame Timer)
FS_REP OSB 2.5V REG SERDES SIE_2H UP_PHY UPC
: Generates all clocks of Hub. : Translates the high-speed transactions (split transactions) for full/low-speed device
FEATURES
• Compliant with Universal Serial Bus Specification Revision 2.0 (Data Rate 1.5/12/480 Mbps) • High-speed or full-speed packet protocol sequencer for Endpoint 0/1 • 4 (Max.) downstream facing ports • Low power consumption (10 μA when hub in idle status, 149 mA when all parts run in HS mode) • All downstream facing ports can handle high-speed (480 Mbps), full-speed (12 Mbps), and low-speed (1.5
Detailed function descriptions are provided in the following user’s manual. Be sure to read the manual before designing. μPD720114 User’s Manual: S17463E
基于波粒去噪的图像清晰化方法

基于波粒去噪的图像清晰化方法赵明敏;田丽;杜道昶;包伟;陈勇【摘要】为了应对雾天图像对比度低、能见度低的缺点,提出一种基于波粒重构的雾天图像清晰化方法.采用波粒重构对均衡化后雾天图像进行处理,选取合适的阈值对图像的细节系数增强,经直方图匹配修正得到增强后的雾天图像.实验结果表明:该方法对雾气图片处理后,图像的细节和层次感得到了提高,视觉效果明显改善,是一种有效的雾天图像清晰化方法.【期刊名称】《陕西理工学院学报(自然科学版)》【年(卷),期】2015(031)006【总页数】5页(P23-27)【关键词】波粒重构;均衡化;阈值【作者】赵明敏;田丽;杜道昶;包伟;陈勇【作者单位】安徽工程大学电气工程学院,安徽芜湖241000;安徽工程大学电气工程学院,安徽芜湖241000;安徽工程大学电气工程学院,安徽芜湖241000;安徽工程大学电气工程学院,安徽芜湖241000;安徽工程大学电气工程学院,安徽芜湖241000【正文语种】中文【中图分类】TP391.41近年来,天气的反常变化越来越多,有些地方一年有一大半时间被雾笼罩。
而在雾天获取图像,会受雾气的干扰,获得的照片比较模糊。
所以,需要分析如何减弱噪声的影响,在雾天中获取到更加清晰的图像,具有重要的实际意义。
本文根据雾天中图像对比度不高的特点,采用了波粒分析的图像去噪[1]方法,先对相机获取的图像二值均衡化处理,然后对图像采用波粒变换,选取适当阈值,且对阈值作系数处理,再对修改后阈值波粒重构,得到重构后的图像再进行直方图匹配修正,最终获得雾天清晰化图像。
本文的图像去噪系统框图如图1所示。
对于普通获取的图像,设s和r分别表示变换后图像和被增强图像的灰度。
先假定所有像素的灰度已归一化。
即当r=s=0时,表示黑色;当r=s=1时,表示白色;变换函数T(r)与原图像概率密度函数p(r)之间的关系为式中r为积分变量。
要让这种灰度变换有实际意义,则规定T必须满足如下条件:在0≤r≤1区间内,T(r)为单调增加。
【网络】网络摄像头解决方案
【关键字】网络网络摄像头解决方案篇一:网络摄像头监控解决方案**学院网络监控系统技术解决方案**公司目录一、系统概述 (3)二、系统设计标准 (4)三、系统需求分析 (5)四、系统详细设计 (6)系统整体结构: (6)系统拓扑图: (7).传输部分 (8).监控中心 (8).监控中心 (10)五、设备参数与性能(详见投标文件报价表) (14)六、系统功能和特点 (18)七、软件界面截图 (22)一、系统概述随着社会对于视频监控需要步伐的加快和高新技术的飞速发展,全社会对与网络数字视频信息化管理提出了更高的要求,建设一套综合性监控综合管理系统成为最好的解决办法。
通过在一些场所、区域安装网络监控设备,在对主要区域和重要部位进行监视控制,直观地掌握现场图像资料,避免突发事情的发生。
同时,全天24小时的图像记录还可以为主管部门提供事实依据。
因此怎样建立一套安全、经济、方便管理的监控系统就显得非常重要。
集中远程视频监控系统是基于网络的全数字化视频监控和管理系统,采用标准的互联网通讯协议和先进的视频编/解码技术;符合ISO/OSI开放系统互联标准;采用C/S、B/S相结合的体系模式;基于面向对象的开发技术,具备良好的扩充能力;人机界面友好,系统操作方便。
完成信息采集、保存、传输、控制和统一管理的全过程,能够架构在各种专网/局域网/城域网/广域网之上,与现有网络设备实现无缝连接。
用户可利用系统内现有的网络资源和办公计算机,在监控中心实现对全部监控现场的监控,大大减轻日常人员巡视的工作量,便于及时发现危险隐患,保障安全生产,为远程无人职守岗位提供了完备、可靠的远程监控方案。
保卫处办公自动化系统:目前学校的招生数量连年增加,怎样对学校学生有一个较好的管理,保障高校学生的良好学习气氛,使学生、老师有一个良好的工作、生活环境,是学校保安工作应做的一件大事。
优良的硬件设备为更好的完成保卫工作提供了可靠的保障,但是随着时代的进步,校园管理对于信息化管理的需求越来越高,光是依靠硬件设备无法提供更高效率的保卫工作,因此我们为项目免费赠送了一个保卫处办公自动化系统,随着Internet 的发展,信息技术的普遍,计算机软硬件的发展,对大学校园治安进行电子化管理的各项技术都已经成熟起来。
- 1、下载文档前请自行甄别文档内容的完整性,平台不提供额外的编辑、内容补充、找答案等附加服务。
- 2、"仅部分预览"的文档,不可在线预览部分如存在完整性等问题,可反馈申请退款(可完整预览的文档不适用该条件!)。
- 3、如文档侵犯您的权益,请联系客服反馈,我们会尽快为您处理(人工客服工作时间:9:00-18:30)。
汇聚交换机
客户端
第二章
高清监控系统简介
前端监控点的安装
传输网络的设计及设备选型 后端系统的设计
(一)摄像机安装建议
监控场景。如果是为了监控一个区域,跟踪移动的人员或物体,一定要将
摄像机安装在便于观察物体的位置。如果是为了识别人员或物体,摄像机
必须以适当方式进行部署或对焦,从而获得足够丰富的图像细节,以支持 进行识别。 提高监控场景的光照度。一般比较简单且经济、高效的方法是在室内或室 外增加强光灯,以便为获得良好图像提供必要照明条件。 避免光源对摄像机的直射。因为这样会使摄像机“什么也看不见”,图像 传感器性能下降。在可能的情况下,摄像机的安装位置应背对光源。 软件适当调整摄像机的设置。可以调整白平衡、曝光、画质增强、码流和 帧率,以获得最佳图像。
不推荐×
推荐√
监控前端防雷
RJ45 POE防雷器
RJ45 防雷器 塑胶套管
防水箱
防水盒
雷 击
雷击是电涌电压的一种
直击雷 雷击 雷电感应 电 涌 电 压 线路故障电涌 线路电涌 系统开关过电压 电磁感应 静电感应 雷电电磁干扰/无线电干扰 雷电静电/摩擦静电等
雷 击
雷击建筑物
雷 击
雷击架空电力线
NEW
★16路嵌入式NVR,适用于中小 型监控项目,支持本地解码显示、 存储和转发。
★阵列式NVR,最大支持64 路720P或32路1080P的接入。
NEW
★2013年最新上市推出的
最新嵌入式NVR
ARM架构的真正嵌入式 NVR
(二)NVR—连接监控网络
连接中控或客户端
连接摄像机或者 核心交换机
连接宽带路由器, 实现远程访问
汇聚层
汇聚层 接入层
接入层
… … … …
接入层
…
不推荐×
推荐√
(二)网络设备性能稳定
较高的转发性能, 支持网管
不推荐×
符合监控工程中对稳定性、 防尘、抗震、防电磁辐射等 的要求。
转发性能有限, 功能太单一 产品应用级别较低,不适宜 监控的现场环境
推荐√
当摄像机的接入路数(以720P为例)超过 16路时,应考虑选用全千兆位的交换机。
高清、网络、IT
深圳波粒科技有限公司 客服部 2013年9月
WAPA高清监控系统vs模拟CCTV区别(1)
DVR NVR
编码、录像
网线 视频线 音频线 报警线
录像、解 码、转发
编码
控制线 高清网络摄像机
模拟摄像机
云台
报警器、开关 拾音器/喇叭 云台 报警器、开关
拾音器/喇叭
WAPA高清监控系统vs模拟CCTV区别(2)
室外出入口首先应当满足防水和 夜间监控的要求 具备低照度效果,画面应该实时 流畅,要求能看清车牌、人脸等 关键细节。具体镜头焦距视安装 位置决定。 同时室外应考虑摄像机的安全防 护。
(二)摄像机现场图片实例(3)
一般目的是为了监视柜台、操作台,防 止盗窃、舞弊或者避免操作失误,因此 必须看清局部的细节, 同时画面的分辨率尽量要高,有条件可 以使用1080P。
需要摄像机的视角能够保证覆盖整个电 梯的轿厢,因此一般选择广角摄像机 (2.8mm焦距),尽量安装在电梯控制 面板的斜对角
(二)摄像机现场图片实例(4)
远距离目标的监控,可选择长焦 镜头 当监控范围较广时,可考虑使用 带PTZ功能的高速球,并进行巡 航、线扫等拍摄方式的设置 户外环境若无灯光照明,可考虑 选用带红外补光的摄像机,或选 择白光灯补光。 必须考虑防水、防雾、防拆卸等 因素
模拟摄像机 同轴电缆 光缆
同轴电缆
DVR
光端机
光端机
高清网络摄像机 网线 光缆 光纤收发器
网线 NVR 光纤收发器
内 容:
高清监控系统简介
前端监控点的安装
传输网络的设计及设备选型
后端系统的设计
第一章
高清监控系统简介
前端监控点的安装 传输网络的设计及设备选型 后端系统的设计
(二)摄像机现场图片实例(1)
一般室内走廊的光照环境比较复 杂,除了光线色温不定,光照度 也常因为照明和阳光产生变化, 所以一般选配AWB效果好、低照 度效果好、甚至是带红外补光的 摄像机 可吸顶安装,也可壁装。需要看 清人脸,一般建议采用6mm、 8mm的镜头
(二)摄像机现场图片实例(2)
雷 击
电磁感应与耦合
雷 击
第三章
高清监控系统简介 前端监控点的安装
传输的设计及设备选型
后端系统的设计
视频网络传输的要求:
1. 网络结构清晰,便于扩展和排错 2. 网络设备性能稳定,满足视频大数据量传输
3. 无线传输
4. 综合布线系统规范化
(一)网络结构层次清晰
汇聚层 NVR 汇聚层 核心层 NVR
(二)摄像机现场图片实例(5)
比如酒店大堂、教室、报告厅等 环境内,可以选择吸顶安装的摄 像机 可适当考虑夜间的红外补光 关键区域可在采集视频的同时, 可使用带扩展功能的摄像机对音 频、报警、温湿度等进行采集,
摄像机护罩安装实例
反射光
护罩安装
反射光
不推荐×
护罩安装
推荐√
像机户外防水、防雷安装实例
(三)无线传输的建议
尽量选择5.8GHz频段, 信道内干扰小 点对点安装位置确保可 视,尽可能避免穿透墙 壁 确保信号发射的角度, 如果条件允许,可以考 虑安装外置天线增加发 射功率 支持点对点、中心一点 对多点等模式
无线网桥
无线网桥
NVR
交换机
高速球
高速球
电梯监控的简易拓扑图
(四)综合布线的规范化
WAPA高清监控系统组成
WAPA高清监控系统简介
前端
设备 网络摄像机 拾音器 护罩/支架 电源
传输
交换机 无线网桥/无线路由器 光纤收发器 网线 光缆
后端
NVR及存储设备 解码显示设备 监控平台管理软件
WAPA高清监控的实现
高清解码盒
拼接屏
IPC
…
汇聚交换机
100m
核心交换机
IPC
…
NVR
中控
(四)显示系统—方案A
监视器/高清解码盒/NVR解码/中控
(四)显示系统—方案B
拼接屏/分配器/高清解码盒/NVR解码/中控
(四)显示系统—方案C
拼接屏/拼接处理器/高清解码盒/NVR解码/中控
THANKS!
如果您想了解更多关于WAPA百万高清系统和解决方案 请关注或发送邮件至 csd@/wangl@
不推荐×
推荐√
第四章
高清监控系统简介 前端监控点的安装
传输网络的设计及设备选型
后端系统的设计
后端系统的设计
1. 后端功能介绍 2. NVR连接网络 3. 视频的解码 4. 显示系统
后端系统介绍
后端的功能都是围 绕着NVR所具备的 视频流转发功能而 进行的。
监控中心
(一)NVR--产品介绍
为了区分视频数据流的类别和流 向,NVR上设计了两种网口,通过网 络隔离能够提高带宽利用率。
连接解码盒
(三)高清视频的解码
利用NVR或 中控进行软 解码
摄像机 NVR 监视器 中控/客户端
NVR将视频 流转发给解 码盒硬解码
摄像机 NVR 解码盒
监视器
常见的错误 的连接方式
摄像机 解码盒
监视器
不推荐×