Coherent X-ray Scattering from Manganite Charge and Orbital Domains
单晶XRD分析
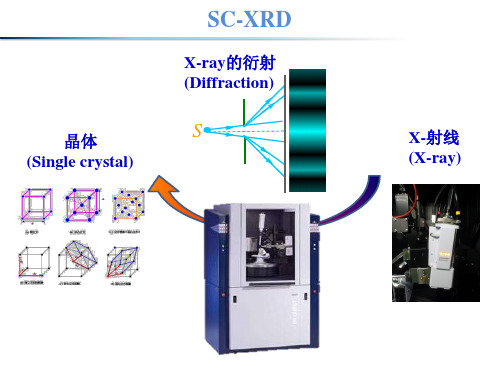
X-射线源
✓ Cu 光源的散射强度= 6-10 倍Mo光源 ✓ 所以 60秒Mo光源的数据收集 ≈ 10秒Cu光源数据收集 ✓ Cu光源对测试小或散射弱的晶体有很大的帮助
但是...
Cu光源的吸收效应 大于Mo光源
体样品。 ——请记住,常常小晶体的质量会更好。 ➢ 挑选面/角清晰的晶体;避免挑选有裂缝和表面有缺陷的晶体;从簇状或
薄片状晶体中分离出单颗晶体(小心处理以免损坏晶体)。 ➢ 将挑选好的晶体转移到合适的上样工具上—尽量少裹油、尽量减少样品转
移到衍射仪上的时间、尽量减少在转移过程中对晶体的损坏。 ➢ 对心—确认晶体处于低温气流中,并通过一幅衍射照片来快速评估晶体质
重金属 (Pt, Pb, Hg, Bi 等)将导致强的吸 收效应。所以,常 常使用Mo光源来测 试这类样品。
应用方向 无机晶体/有机金属配合物 大/超分子 绝对构型(有机晶体) 高压应用 小/衍射弱的晶体 蛋白质 电子密度 强吸收晶体 准晶 粉末
Mo Cu ✓
✓ ✓ ✓ ✓ ✓ ✓ ✓ ✓ ✓✓
晶体
测试分析
更多仪器和测试操作将在上机演示中讲解
个人观点供参考,欢迎讨论
HK L ; I
-1 2 4 ; 3678 -2 0 2 ; 2354 1 2 -4 ; 3496
X-rays
衍射
晶体大小<0.5 mm
数据处理与结构精修
已收到的衍射点: HK L ; I -1 2 4 ; 3678 -2 0 2 ; 2354 1 2 -4 ; 3496
结构解析 Cycle 2 : R1 = 11.28% Cycle 3 : R1 = 8.49% Cycle 4 : R1 = 7.21% Cycle 5 : R1 = 5.73% (final refined structure)
香兰素结晶过程的分析研究

学位论文作者签名: 签字日期: 年 月 日
导师签名: 签字日期:
年月日
摘要
香兰素是人工合成的第一种香精,是食品添加剂行业中必不可少的重要原料 之一,也被当作化学原料和医药中间体而广泛应用在化工、医药行业。工业生产 中通常采用结晶的方法提纯最终的产品。目前,国内香兰素的生产技术相比欧美 等西方发达国家仍相对落后,产品的质量也存在一定的差距,存在的主要问题包 括收率低、色泽差、纯度低、堆密度小、粒度分布不均匀、晶习不理想等。针对 上述国内香兰素生产过程中存在的问题,本文对香兰素的结晶过程进行了系统深 入的研究。
独创性声明
本人声明所呈交的学位论文是本人在导师指导下进行的研究工作和取得的 研究成果,除了文中特别加以标注和致谢之处外,论文中不包含其他人已经发表
或撰写过的研究成果,也不包含为获得 天津大学 或其他教育机构的学位或证
书而使用过的材料。与我一同工作的同志对本研究所做的任何贡献均已在论文中 作了明确的说明并表示了谢意。
Using the laser light scattering method, the supersolubility of vanillin in methanol-water system was measured at different temperatures, and the metastable zone in this solvent were drawn, and the influence of initial concentration, cooling rate as well as stirring rate on the metastable zone width were also discussed. Then, by determining the induction time of vanillin in methanol-water system, the surface
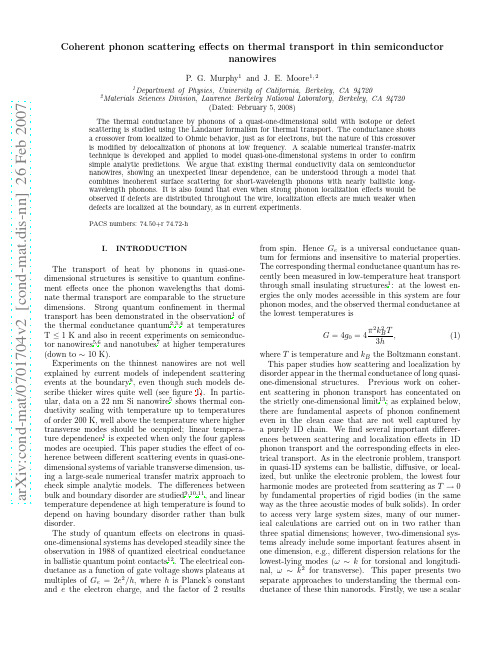
Coherent phonon scattering effects on thermal transport in thin semiconductor nanowires
I.
Iof heat by phonons in quasi-onedimensional structures is sensitive to quantum confinement effects once the phonon wavelengths that dominate thermal transport are comparable to the structure dimensions. Strong quantum confinement in thermal transport has been demonstrated in the observation1 of the thermal conductance quantum2,3,4 at temperatures T ≤ 1 K and also in recent experiments on semiconductor nanowires5,6 and nanotubes7 at higher temperatures (down to ∼ 10 K). Experiments on the thinnest nanowires are not well explained by current models of independent scattering events at the boundary8 , even though such models describe thicker wires quite well (see figure 1). In particular, data on a 22 nm Si nanowire5 shows thermal conductivity scaling with temperature up to temperatures of order 200 K, well above the temperature where higher transverse modes should be occupied; linear temperature dependence1 is expected when only the four gapless modes are occupied. This paper studies the effect of coherence between different scattering events in quasi-onedimensional systems of variable transverse dimension, using a large-scale numerical transfer matrix approach to check simple analytic models. The differences between bulk and boundary disorder are studied9,10,11 , and linear temperature dependence at high temperature is found to depend on having boundary disorder rather than bulk disorder. The study of quantum effects on electrons in quasione-dimensional systems has developed steadily since the observation in 1988 of quantized electrical conductance in ballistic quantum point contacts12 . The electrical conductance as a function of gate voltage shows plateaus at multiples of Ge = 2e2 /h, where h is Planck’s constant and e the electron charge, and the factor of 2 results
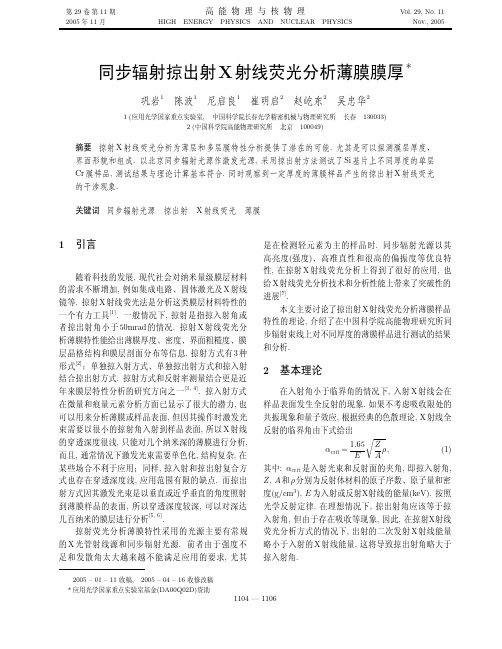
同步辐射掠出射X射线荧光分析薄膜膜厚
, X , X .
,
. 50mrad
X . . X 3 . ,
[2]
.
[3 , 4]
2
. , , , X , , , , ,
[5, 6]
, . , 1.65 E Z ρ, A , X . , , , , X , . , ,
X ,X
, , ,
αcrit = : αcrit
(1) , (keV). X X
1 (State Key Lab of Applied Optics, the Institute of Optics, Fine Mechanics and Physics, CAS, Changchun 130033, China) 2 (Institute of High Energy Physics, CAS, Beijing 100049, China)
Abstract The grazing exit X-ray fluorescence provides a possibility to analyze the characteristics of thin film and multilayer, especially the thickness, interface structure and composition. The Cr film samples with different thickness deposited on silicon (Si) bases are tested with grazing method using Beijing synchrotron radiation source (SR) as excitation light. The results agree with the theoretical prediction, and the interference of emitted X-ray has been observed. Key words synchrotron radiation source, glazing exit, X-ray fluorescence, thin film
X-ray 辐射X射线英文PPT
X - ray irradiation 射线的照射
Penetrating Action 穿透作用
Ionization Effect 电离作用
Biological response 生物反应
Application method Application examples 应 用 例
Measure 测量
Non-destructive Inspection 非破坏检查
・Concentration measurement 浓度计测 ・Density measurement 密度计测
・ X light perspective X光透视
・ CT detection CT检查
Diagnosis 诊断
・X - ray radiography X射线造影
Radiation
Ezreal & Allen
Vocabulary
X-ray:X射线 X-ray spectrum:射线谱 Coherent scattering:相干散射 Incoherent scattering:非相干散射 attenuation of X-ray: X射线的衰减 Absorb of X-ray: X射线的真吸收 Optic-electric effect:光电效应 fluorescent radiation:荧光辐射
h = Planck's constant = 1.38 10-16 erg sec
X-Ray Tubes
X-Ray Tubes
1-高压变压器;2-钨丝变压器; 3-X射线管;4-阳极; 5-阴极;6-电子;7-X射线
7 3
5
6
4 2
1
Application of X-ray
除三苯基氧膦
Keywords: Countercurrent chromatography Preparative chromatography Reverse phase liquid chromatography Triphenylphosphine oxide Impurity removal Mitsunobu reaction
There are a multitude of benefits to the use of HPCCC that make it a powerful chromatographic tool and the technique is increasingly being recognised as a solution with relevance and application to modern medicinal chemistry purifications [7]. The technique is orthogonal and complementary to other forms of chromatography such as HPLC, often providing straightforward resolution of otherwise difficult separations. The absence of a solid stationary phase generally provides a high tolerance of crude samples containing contaminants such as unspent reagents and heavy metal residues; this can often eliminate the need for sample workup and significantly reduce sample preparation time. An active stationary phase volume of 70–90% of the HPCCC column volume is typical and yields
乳胶免疫层析法定量检测猪尿液中的盐酸克伦特罗

乳胶免疫层析法定量检测猪尿液中的盐酸克伦特罗管 笛1,2,魏 颖1,2,王 旗1,2,李俊博1,2,武会娟1,2,*(1.北京市理化分析测试中心,北京 100089;2.北京市基因测序与功能分析工程技术研究中心,北京 100089)摘 要:目的:建立以彩色乳胶微球为标记物的免疫层析技术检测猪尿液中的盐酸克伦特罗(clenbuterol ,CLB )。
方法:彩色乳胶微球标记CLB 抗体并真空冷冻干燥,盐酸克伦特罗-牛血清白蛋白(CLB-bovine serum albumin ,CLB-BSA )人工抗原与羊抗鼠抗体分别喷到硝酸纤维素膜上作检测线和质控线,猪尿液样本与冻干微球混匀后,插入试纸条,通过读条仪进行测定。
结果:通过理化参数的优化,吐温-20为最优表面活性剂,选用300 nm 乳胶微球,层析时间为9 min 。
方法的检出限为0.013 ng /mL ,回收率范围在97.8%~106.0%之间,相对标准偏差不高于9.6%。
结论:本研究成功建立了一种灵敏、准确的检测猪尿液中CLB 的彩色乳胶免疫层析方法。
关键词:免疫层析试纸;彩色乳胶;盐酸克伦特罗;猪尿液;定量检测Development of Dyed Latex Bead-Based Immunochromatographic Assay for Quantitative Detection ofClenbuterol in Swine UrineGUAN Di 1,2, WEI Ying 1,2, WANG Qi 1,2, LI Junbo 1,2, WU Huijuan 1,2,*(1. Beijing Center for Physical and Chemical Analysis, Beijing 100089, China;2. Beijing Engineering Technique Research Center for Gene Sequencing & Function Analysis, Beijing100089, China)Abstract: Objective: Aiming at the development of an immunochromatographic method based on dyed latex beads for the detection of clenbuterol (CLB) in swine urine. Methods: Dyed latex beads were conjugated with anti-CLB antibody and vacuum freeze-dried. CLB-bovine serum albumin (CLB-BSA) conjugate and goat anti-mouse IgG antibodies were coated onto nitrocellulose membranes to establish test and control lines, respectively. The test was carried out by placing swine urine into the sample well and mixed with dyed latex beads. After incubation, the optical density was measured by a microplate reader. Results: After optimizing the physical and chemical parameters, the best surfacant was Tween-20, 300 nm dyed latex beads were chosen, and the incubation time was 9 minutes. The limit of detection (LOD) was 0.013 ng /mL. The recoveries from spiked swine urine varied from 97.8% to 106.0%, with relative standard deviation of less than 9.6%. Conclusion: A sensitive and accurate method for the detection of CLB was successfully developed in this paper.Key words: immunochromatographic strip; dyed latex beads; clenbuterol; swine urine; quantitative detection DOI:10.7506/spkx1002-6630-201712042中图分类号:TS207.3 文献标志码:A 文章编号:1002-6630(2017)12-0273-05引文格式:管笛, 魏颖, 王旗, 等. 乳胶免疫层析法定量检测猪尿液中的盐酸克伦特罗[J]. 食品科学, 2017, 38(12): 273-277. DOI:10.7506/spkx1002-6630-201712042. GUAN Di, WEI Ying, WANG Qi, et al. Development of dyed latex bead-based immunochromatographic assay for quantitative detection of clenbuterol in swine urine[J]. Food Science, 2017, 38(12): 273-277. (in Chinese with English abstract) DOI:10.7506/spkx1002-6630-201712042. 收稿日期:2016-07-22基金项目:北京市优秀人才项目(2014400685627G277);北京市科学技术研究院青年骨干计划项目(201415)作者简介:管笛(1983—),男,副研究员,博士,研究方向为分析化学。
表面增强拉曼散射活性基底
表面增强拉曼散射活性基底高书燕 张树霞 杨恕霞 张洪杰#(河南师范大学化学与环境科学学院,新乡 453007;#中国科学院长春应用化学研究所,长春 130022)摘 要 表面增强拉曼散射(SERS)是人们将激光拉曼光谱应用到表面科学研究中所发现的异常表面光学现象。
它可以将吸附在材料表面的分子的拉曼信号放大106到1014倍,这使其在探测器的应用和单分子检测方面有着巨大的发展潜力。
由于分子所吸附的基底表面形态是SERS效应能否发生和SERS信号强弱的重要影响因素,所以分子的承载基体是很关键的,因而SERS活性基底的研究一直是该领域的研究热点之一。
本文总结了形态各异的表面增强拉曼散射活性基底,分析了最新发展并对其未来作一展望。
关键词 表面增强拉曼散射 活性基底Surface2enhanced R aman Scattering Active SubstratesG ao Shuyan,Zhang Shuxia,Y ang Shuxia,Zhang H ongjie#(C ollege of Chemistry and Environmental Science,Henan N ormal University,X inxiang453007;#Changchun Institute of Applied Chemistry,Chinese Academy of Sciences,Changchun130022)Abstract Sur face2enhanced Raman scattering(SERS)is a special optical phenomenon originating from the application of laser Raman into sur face science.SERS can greatly magnify the Raman signals of the ads orbed m olecules106 to1014times,which makes SERS have potentials in detectors and single2m olecule analysis.Because the sur face m orphologies and structures of the substrates determines the generation and intensity of Raman signals,the substrates play a vital role in SERS and the research on the SERS active substrates remains a hot topic.In this paper,SERS active substrates are reviewed.In addition,the newly developments and futures of this area are ananlyzed and outlooked,respectively.K eyw ords Sur face2enhanced Raman scattering,Active substrate表面增强拉曼散射(Surface2enhanced Raman Scattering,SERS)主要是纳米尺度的粗糙表面或颗粒体系所具有的异常光学增强现象,它可以将吸附在材料表面的分子的拉曼信号放大约106倍,对于特殊的纳米量级粒子形态分布的基底表面,信号的增强甚至可以高达1014倍,因此在探测器的应用和单分子检测方面有着巨大的发展潜力。
织构系数a
Materials Science-Poland, Vol. 25, No. 3, 2007Determination of the thickness and opticalconstants of transparent indium-doped ZnOthin films by the envelope methodS.I LICAN*,M.C AGLAR,Y.C AGLARAnadolu University, Science Faculty, Department of Physics, 26470 Eskisehir, Turkey Transparent indium-doped ZnO thin films were deposited by the spray pyrolysis method onto glass substrates. The content of indium in the starting solution was 0.5 at. %. The crystallographic structure of the film was studied by X-ray diffraction (XRD). XRD measurement shows that the film is crystallized in the wurtzite phase and presents a preferential orientation along the c-axis. The texture coefficient (TC), grain size value and lattice constants have been calculated. The absorption coefficient and the thickness of the films were calculated from interference of transmittance spectra. Optical constants such as the refrac-tive index n and extinction coefficient k have been determined from transmittance spectrum in the ultra-violet–visible–near infrared (UV–VIS–NIR) regions using the envelope method. The thickness of the films strongly influences the optical constants.Key words: ZnO; spray pyrolysis; envelope method1. IntroductionRecently, transparent conducting oxides (TCOs) have been widely studied. Among TCOs, zinc oxide (ZnO) is one of the most promising materials for the fabri-cation of the next generation of optoelectronic devices in the UV region and optical or display devices. ZnO is a wide-bandgap A II B VI semiconductor with the bandgaps of about 3.3 eV. As a matter of fact, simultaneous occurrence of both high optical trans-mittance in the visible range, and low resistivity make ZnO an important material in the manufacture of heat mirrors used in gas stoves, conducting coatings in aircrafts glass avoiding surface icing, and as thin film electrodes in amorphous silicon solar cells. ZnO is a member of the hexagonal wurtzite class; it is a semiconducting, piezo-electric and optical waveguide material and has a variety of potential applications such as gas sensors [1], surface acoustic devices [2], transparent electrodes [3] and solar __________* Corresponding author, e-mail: silican@.trS. I LICAN et al.710cells [4, 5]. Some of these applications are based on the simultaneous occurrence of low resistivity and high transmittance in the visible spectrum, when ZnO is manufac-tured in the form of thin solid films.For many of these applications, it is very important to control the ZnO physical properties by doping. Usually, n-type doping is obtained by Al, Ga or In. On the other hand, p-type doping is not easily obtained. Various deposition techniques have been widely used to produce semiconductor thin films. However, seeking the most reliable and economic deposition technique is the main goal. The most intensively studied techniques include: RF magnetron sputtering [6], metal organic chemical vapour deposition [7], sol-gel method [8] and spray pyrolysis [9, 10]. They have been studied intensively in the last three decades due to their simplicity and economy. The chemical bath deposition, chemical spray pyrolysis and sol-gel techniques are well known methods of preparation of thin films. The spray pyrolysis is an excellent method for the deposition of thin films of metallic oxides, as is the case for the ZnO material. In this deposition technique, a starting solution, containing Zn and dopant precursors, is sprayed by means of a nozzle, assisted by a carrier gas, over a hot substrate. When the fine droplets arrive at the substrate, the solid compounds react to become a new chemical compound.The widely used envelope method has been developed for transmittance meas-urements to evaluate the refractive index, extinction coefficient, and absorption coeffi-cient. Optical characterization of thin films gives information about other physical properties, e.g. band gap energy and band structure, optically active defects etc., and therefore may be of permanent interest for several different applications. Considerable differences between optical constants of bulk material and thin films or those of films prepared under varying growth characteristics are often reported. Therefore determina-tion of optical constants for each individual film by a non-destructive method is highly recommended.Generally, the optical band gap (E g) and absorption coefficient α could be evalu-ated from transmittance or absorbance spectra. Swanepoel [11] has improved this method to determine more accurately the thickness (t), absorption coefficient (α), etc. There are several reports on this method [12–14]. In another conventional method, the reflectance (R) and transmittance (T) spectra are used to determine α. Since α is re-lated to the extinction coefficient k, which is defined as the imaginary part of the com-plex refractive index, where n is the real part of refractive index, an accurate determi-nation of n and k is possible. But this often becomes difficult due to the presence of multiple solutions. It is necessary to have a rough idea about the thickness t and refrac-tive index n to start with, and by a judicious adjustment of the magnitude of thickness it is possible to secure a continuous solution of n and k throughout the whole spectral range.There are a few papers on the determination of optical constants of the ZnO thin films by using the well-known envelope method [14–18], but there is no report on the indium-doped ZnO thin film. Therefore, in this paper, the optical constants of the in-Thickness and optical constants of transparent indium-doped ZnO thin films 711 dium-doped ZnO thin films which have different thicknesses have been studied for the first time.2. Experimental detailsIn-doped ZnO thin films of various thicknesses were deposited onto microscope glass (Objekttrager, 1×1 cm2) substrates using the spray pyrolysis method at 350 o C. The experimental set-up was described elsewhere [19]. An aqueous solution of 0.1 M Zn(CH3CO2)2 was used as a precursor, prepared from a mixture of methanol and water to a volume ratio of 3:1. The resulting solution was doped with indium by adding in-dium chloride (InCl3) with an In/Zn ratio equal to 0.5 at. % in the starting solution. The mixture was continuously agitated until total dissolution. A small amount of ace-tic acid was added to obtain total dissociation of the zinc acetate. Nitrogen was used as the carrier gas, at the pressure of 0.2 bar. The ultrasonic nozzle was 28 cm distant from the substrate during deposition, the solution flow rate was held constant at 4 ml·min–1. The substrate temperature was measured using an iron-constantan thermocouple.The structural properties were studied by X-ray diffraction measurements (Rigaku Rint 2200 Series X-Ray automatic diffractometer with CuKα radiation (λ=1.54059 Å)). The average dimensions of crystallites were determined by the Scherrer method from the broadening of the diffraction peaks taking into account the instrumental broadening.The optical measurements of the In-doped ZnO thin films were carried out at room temperature using Shimadzu UV-VIS-NIR 3150 spectrophotometer in the wave-length range from 190 to 3200 nm. Swanepoel’s envelope method was employed to evaluate the optical constants such as the refractive index n, extinction coefficient k, and absorption coefficient α from the transmittance spectra [11]. The thickness of the In-doped ZnO thin film was determined from the interference fringes of transmission data recorded over the visible range.3. Results and discussion3.1. Structural properties of the In-doped ZnO thin filmXRD spectrum of the In-doped ZnO thin film (t = 337 nm) is shown in Fig. 1. The peaks of the XRD pattern correspond to those of the theoretical ZnO patterns from the JCPDS data file [20], with a hexagonal wurtzite structure of the bulk and lattice con-stants: a = 3.24982 Å, c = 5.20661 Å. The analytical method [21] was used to calcu-late the lattice constants (a = 5.21580 Å, c = 3.26064 Å) for the film. The full width at half maximum (FWHM) of the (002) peak is 0.284°. Another major orientation pre-sent is (101), while other orientations like (102) and (100), are also seen with com-S. I LICAN et al.712paratively lower intensities. Therefore, the crystallites are highly oriented with their c -axes perpendicular to the plane of the substrate. 2θ and d values are given in Table 1.Fig. 1. XRD spectrum of the In-doped ZnO thin filmTable 1. The X-ray diffraction data results of the In-doped ZnO thin film(hkl ) 2θ[deg] d [Å] I /I 0 TC [%](100) 31.660 2.8238 11.5 6.58(002) 34.360 2.6079 100.0 57.21(101) 36.200 2.4794 48.3 27.63(102) 47.443 1.9148 15.0 8.58The grain size of the film from the XRD data was calculated using the Debye–Scherrer formula [21]:0.9cos D λβθ= (1) where D is the grain size of the crystallite, λ (1.54059 Å) is the wavelength of theX-rays used, β is the broadening of diffraction line measured at the half of its maxi-mum intensity in radians and θ is the angle of diffraction. The value found for thegrain size is 31 nm.The texture coefficient (TC ) represents the texture of a particular plane, whose de-viation from unity implies the preferred growth. Quantitative information concerningthe preferential crystallite orientation was obtained from another texture coefficientTC (hkl ) defined as [22]:Thickness and optical constants of transparent indium-doped ZnO thin films 713()()()()00()100%n I hkl I hkl TC hkl I hkl I hkl =×∑ (2)where I (hkl ) is the measured relative intensity of a plane (hkl ) and I 0(hkl ) is the stan-dard intensity of the plane (hkl ) taken from the JCPDS data. The value TC (hkl ) = 1represents films with randomly oriented crystallites, while higher values indicate theabundance of grains oriented in a given (hkl ) direction. The variation of TC for thepeaks of the wurzite lattice is presented in Table 1. It can be seen that the highest TCwas in the (002) plane for In-doped ZnO thin film.3.2. Determination of thicknesses of the In-doped ZnO thin filmsAn excellent surface quality and homogeneity of the film were confirmed from theappearance of interference fringes in the transmission spectra [23, 24] occurring whenthe film surface is reflecting without much scattering/absorption in the bulk of the film[24]. The optical constants were evaluated using the “envelope method” originallydeveloped by Manifacier et al. [25]. Generally, outside the region of fundamental ab-sorption (hv > E g ) or of the free-carrier absorption (for higher wavelengths), the dis-persion of n and k is not very large [25]. If we assume that the film is weakly absorb-ing and the substrate is completely transparent, then using this method the refractiveindex (n ), and extinction coefficient (k ) of the film on a transparent substrate can beevaluated from the transmission spectra.Fig. 2. Transmittance spectra of the In-doped ZnO thin filmsS. I LICAN et al.714Figure 2 shows transmittance curves for In-doped ZnO thin films at various thick-nesses. These films exhibited good transparency (between 91% and 93%) in the visi-ble and infrared region.The refraction indices n at various wavelengths were calculated using the enve-lope curve for T max (T M ) and T min (T m ) in the transmission spectra [11]. The expressionfor the refractive index is given by()1/21/222s n N N n ⎡⎤=+−⎢⎥⎣⎦ (3) where 2122M m s s M m T T n N n T T −+=+ (4) and n s is the refractive index of the substrate (n s =1.52 for glass).The extinction coefficient k can be calculated from the following formula [25]: 4πk d αλ= (5) ()()()()0.5max min 0.5max min 11T 1ln 11T s s T n n n t T n n n α⎛⎞−−+⎜⎟⎝⎠=−⎛⎞++−⎜⎟⎝⎠(6) where α is the absorption coefficient. λ1 and λ2 are the wavelengths at the two adja-cent maxima or minima. The optical constants such as refractive index n and extinc-tion coefficient k were determined from the transmittance spectrum by the envelopemethod as explained in the previous section. The variations of the refractive index nand extinction coefficient k with the wavelengths in the range 450–1800 nm are shownin Figs. 3a, b.The thickness of the film was calculated using the equation()1212212t n n λλλλ=− (7)where n 1 and n 2 are the refractive indices corresponding to the wavelengths λ1 and λ2,respectively [11]. The thicknesses of the films are given in Table 2.Thickness and optical constants of transparent indium-doped ZnO thin films 715Fig. 3. Plots of refractive index (a) and extinction coefficient (b)of the In-doped ZnO thin films as a function of wavelengthTable 2.The values of the band edge sharpness B sand optical band gap E g of the In-doped ZnO thin filmsThickness [nm] B s [m–2·eV–1] E g (eV)261 (4.57±0.04)×1013 3.29±0.01337 (6.18±0.04)×1013 3.30±0.01368 (4.78±0.04)×1013 3.30±0.01551 (7.29±0.04)×1013 3.30±0.01619 (6.84±0.04)×1013 3.30±0.013.3. The band gap energy of the In-doped ZnO thin filmsThe absorption coefficient α of the In-doped ZnO thin films was determined from absorbance measurements. Since the envelope method is not valid in the strong ab-S. I LICAN et al.716sorption region, the calculation of the absorption coefficient of the film in this region was performed using the following expression: () 2.303At αυ= (8)where A is the optical absorbance. The optical absorption edge was analyzed by the following equation [26],0.5()g h B h E αυυ=− (9) where B is a constant.Fig. 4. Variation of (αh ν)2 vs. h ν of the In-doped ZnO thin filmsFigure 4 shows the plot of (αh ν)2 vs. h ν for In-doped ZnO thin films. It has been observed that the plot of (αh ν)2 vs. h ν is linear over a wide range of photon energies indicating a direct type of transitions. The intercepts (extrapolations) of these plots (straight lines) on the energy axis reflect the energy band gaps. The band edge sharpness value (B s ) was derived from the slope of the plot of (αh ν)2 vs. h ν in the range of band-to-band absorption. The band edge sharpness B s and optical band gap E gThickness and optical constants of transparent indium-doped ZnO thin films 717 are given in Table 2. According to Table 2, a small difference occurred in the optical band gap.4. ConclusionsIn-doped ZnO thin films were deposited onto glass substrates by the spray pyroly-sis method at 350 o C substrate temperature. The crystal structure and orientation of the In-doped ZnO thin film (t = 337 nm) were investigated by the XRD pattern. The X-ray diffraction pattern of this film revealed its hexagonal wurtzite structure. The films exhibited high transparency (≥ 91%) in the visible and infrared region. Optical con-stants such as the refractive index n and extinction coefficient k were determined from the transmittance spectra in the UV–VIS–NIR regions using the envelope method. The thicknesses of the films t were calculated from interference of the transmittance spec-tra. Also, E g energy band gap values were calculated. The band gap of the films did not depend significantly on the film thickness. There was only a small change of the optical properties resulting from varying the film thickness.References[1] S UCHEA M.,C HRISTOULAKIS S.,M OSCHOVIS K.,K ATSARAKIS N.,K IRIAKIDIS G., Thin Solid Films,515 (2006), 551.[2] W ATER W.,C HU S.-Y.,J UANG Y.-D.,W U S.-J., Mater. Lett., 57 (2002), 998.[3] M ICHELOTTI F.,B ELARDINI A.,R OUSSEAU A.,R ATSIMIHETY A.,S CHOER G.,M UELLER J., J. Non-Cryst. Solids, 352 (2006), 2339.[4] H UPKES J.,R ECH B.,K LUTH O.,R EPMANN T.,Z WAYGARDT B.,M ULLER J.,D RESE R.,W UTTIG M.,Sol.Energ. Mat. Sol. Cells, 90 (2006), 3054.[5] J EONG W.J.,K IM S.K.,P ARK G.C., Thin Solid Films, 506-507 (2006), 180.[6] X INGWEN Z.,Y ONGQIANG L.,Y E L.,Y INGWEI L.,Y IBEN X., Vacuum, 81 (2006), 502.[7] Y E J.D.,G U S.L.,Z HU S.M.,L IU S.M.,Z HENG Y.D.,Z HANG R.,S HI Y.,Y U H.Q.,Y E Y.D., J. Cryst.Growth, 283 (2005), 279.[8] G HOSH R.,P AUL G.K.,B ASAK D., Mater. Res. Bull., 40 (2005), 1905.[9] A YOUCHI R.,L EINEN D.,M ARTIN F.,G ABAS M.,D ALCHIELE E.,R AMOS-B ARRADO J.R.,Thin SolidFilms, 426 (2003) 68.[10] M ARTINS R.,I GREJA R.,F ERREIRA I.,M ARQUES A.,P IMENTEL A.,G ONÇALVES A.,F ORTUNATO E.,Mat. Sci. Eng. B, 118 (2005), 135.[11] S WANEPOEL R., J. Phys. E: Sci. Instrum., 16 (1983), 1214.[12] H OU Y.-Q.,Z HUANG D.-M.,Z HANG G.,Z HAO M.,W U M.-S., Appl. Surf. Sci., 218 (2003), 97.[13] M ETIN H.,E SEN R., J. Cryst. Growth, 258 (2003) 141.[14] C AGLAR M.,C AGLAR Y.,I LICAN S., J. Optoelectron. Adv. Mater., 8 (2006), 1410.[15] S ENADIM E.,K AVAK H.,E SEN R., J. Phys. Condens. Mat., 18 (2006), 6391.[16] G UMUS C.,O ZKENDIR O.M.,K AVAK H.,U FUKTEPE Y., J. Optoelectron. Adv. Mater., 8 (2006), 299.[17] M ULLEROVA J.,M UDRON J., Acta Phys. Slovaca, 50 (2000), 477.[18] S ENADIM E.,E KER S.,K AVAK H.,E SEN R.,Solid State Commun., 139 (2006), 479.[19] C AGLAR Y.,I LICAN S.,C AGLAR M.,Y AKUPHANOGLU F., Spectrochim. Acta A, 67 (2007), 1113.[20] J oint Committee on Powder Diffraction Standards, Powder Diffraction File, card no: 36-1451.S. I LICAN et al.718[21] C ULLITY B.D.,S TOCK S.R., Elements of X-Ray Diffraction, 3nd Ed., Prentice Hall, New York, 2001.[22] B ARRET C.S.,M ASSALSKI T.B., Structure of Metals, Pergamon Press, Oxford, 1980.[23] B HIRA L.,E SSAIDI H.,B ELGACEM S.,C OUTURIER G.,S ALARDENNE J.,B ARREAUX N.,B ERNEDE J.C.,phys. status solidi (a), 181 (2000), 427.[24] G EORGE J.,J OSEPH K.S.,P RADEEP B.,P ALSON T.I., phys. status solidi (a), 106 (1988), 123.[25] M ANIFACIER J.C.,G ASIOT J.,F ILLARD J.P., J. Phys. E, 9 (1976), 1002.[26] M OTT N.F.,G URNEY R.W., Electronic Processes in Ionic Crystals, Oxford Univ. Press, London,1940.Received 4 October 2006Revised 6 April 2007。
《光纤通信课程设计》课件Class8-03

Experimental and theoretical study confirm:
The intensity noise in the transmitted light is phase noise of the laser source, converted by SBS
Only observe in backscattering in fiber (shift in forward scattering is zero)
A=11GHz; p=1.55m
Reduces signal strength by directing most portion of the transmitted light back toward the transmitter
Since the sound wave, too, is travelling, light is also subjected to a Doppler shift, so its frequency changes.
Brillouin Scattering
Phenomenon
The phonons present inside a solid move in thermal equilibrium with very small amplitudes creating fluctuations in the dielectric constant, which is viewed as a moving diffraction grating by an incident light wave. Therefore Brillouin scattering can be explained by the two concepts of Braggs reflection and Doppler shift:
X射线衍射和小角X射线散射

晶体的X射线衍射特征
[Crystal Structure Analysis, 3rd Edition, p. 48]
晶体结构及其晶胞类型
[Methods of Experimental Physics Volume 16: Polymers, Part B Crystal Structure and Morphology, p. 5]
X射线衍射需要在广角范围内测定,因此又 被称为广角X射线衍射(Wide-Angle X-ray Scattering, WAXS)。
小角X射线散射
如果被照射试样具有不同电子密度的非周 期性结构,则次生X射线不会发生干涉现象, 该现象被称为漫射X射线衍射(简称散射)。
X射线散射需要在小角度范围内测定,因此 又被称为小角X射线散射(Small-Angle Xray Scattering, SAXS)。
晶面指数与晶胞参数
[Fundamentals of Powder Diffraction and Structural Characterization of Materials, 2nd Edition, p. 9]
Bragg方程
设晶体的晶面距为 d,X射线以与晶面间交
角为 的方向照射,从晶面散射出来的X射
粉末衍射条纹摄制及处理
[Fundamentals of Powder Diffraction and Structural Characterization of Materials, 2nd Edition, p. 265]
粉末衍射平板图案摄制
[Fundamentals of Powder Diffraction and Structural Characterization of Materials, 2nd Edition, p. 153]
构建下转换荧光-适配体的免疫层析试纸条用于快速检测黄曲霉毒素B_(1)
构建下转换荧光-适配体的免疫层析试纸条用于快速检测黄曲霉毒素B1王邹璐琪1,李立煌1,李丹阳1,艾超超1,任磊1,*,孙本强2,*(1.厦门大学材料学院,福建厦门361005;2.厦门医学院附属口腔医院,福建厦门361005)摘 要:构建下转换荧光-适配体免疫层析试纸条用于食品中黄曲霉毒素B1(aflatoxin B1,AFB1)的快速高效检测。
体系中AFB1存在会减弱下转换荧光-适配体纳米颗粒层析至T线时与AFB1半抗原的结合能力,从而导致下转换荧光信号衰减,进而实现对AFB1的高效检测。
该方法在AFB1质量浓度1~40 ng/mL范围内与荧光信号呈良好的线性关系,线性相关系数为0.994,检测限为0.287 ng/mL。
该方法利用稀土掺杂荧光纳米颗粒的长寿命发光及近红外荧光特性,有效降低了生物背景荧光干扰并提高了检测体系的特异性。
该方法在AFB1的快速高灵敏检测中具有良好的应用前景。
关键词:稀土掺杂荧光纳米颗粒;荧光免疫层析;黄曲霉毒素B1;快速检测Construction of Down-conversion Fluorescence-Aptamer Immunochromatographic Strip for Rapid Detection of Aflatoxin B1 WANG Zouluqi1, LI Lihuang1, LI Danyang1, AI Chaochao1, REN Lei1,*, SUN Benqiang2,*(1. College of Materials, Xiamen University, Xiamen361005, China;2. Stomatological Hospital of Xiamen Medical College, Xiamen361005, China)Abstract: In this study, a down-conversion fluorescence-aptamer immunochromatographic strip was constructed for the rapid and efficient detection of aflatoxin B1 (AFB1) in foods. The presence of AFB1 in the system will weaken the binding ability of down-conversion-aptamer fluorescent nanoparticles to the hapten AFB1 when down-conversion-aptamer fluorescent nanoparticles reach the T-line, thus leading to the attenuation of down-conversion fluorescence signal and consequently highly efficient detection of AFB1. In the range of 1–40 ng/mL, the concentration of AFB1 had a good linear relationship with the fluorescence signal, showing a correlation coefficient of 0.994, and the detection limit for AFB1 was0.287 ng/mL. By taking advantage of the long-lived luminescence and the near infrared fluorescence characteristics of rareearth doped fluorescent nanoparticles, this method effectively reduced the interference of biological background fluorescence and improved the specificity of the detection system, making it a promising candidate for application in the rapid and sensitive detection of AFB1.Keywords: rare earth doped fluorescent nanoparticles; fluorescence immunochromatographic assay; aflatoxin B1; rapid detection DOI:10.7506/spkx1002-6630-20191030-337中图分类号:TS201.2 文献标志码:A 文章编号:1002-6630(2021)12-0295-07引文格式:王邹璐琪, 李立煌, 李丹阳, 等. 构建下转换荧光-适配体的免疫层析试纸条用于快速检测黄曲霉毒素B1[J]. 食品科学, 2021, 42(12): 295-301. DOI:10.7506/spkx1002-6630-20191030-337. WANG Zouluqi, LI Lihuang, LI Danyang, et al. Construction of down-conversion fluorescence-aptamer immunochromatographic strip for rapid detection of aflatoxin B1[J]. Food Science, 2021, 42(12): 295-301. (in Chinese with English abstract) DOI:10.7506/spkx1002-6630-20191030-337. 收稿日期:2019-10-30基金项目:福建省自然科学基金项目(2017Y0078);国家自然科学基金面上项目(31870994)第一作者简介:王邹璐琪(1996—)(ORCID: 0000-0002-7715-1267),女,硕士研究生,研究方向为生物医学材料。
激光烧蚀法合成一维纳米线

二、VLS生长
VLS生长纳米线(管)中存在着两个过程: 一是气态原子在气液界面不断解离溶入液态催化剂中; 二是过饱和溶质在液固界面以界面能最低的方式不断析出 该过程中气、液和固三相共存,故被称为VLS生长。
液相催化剂最小半 径为0.2μm数量级 (平衡热力学的限制) 激光烧蚀的作用可 使液相催化剂团簇 尺寸达到纳米级 激光烧蚀法与晶体生 长的VLS法相结合
(B)Image of an isolated Ge nanowire. The nanowire diameter is 5.0 ± 0.6 nm. Scale bar, 5 nm. (C)High-resolution TEM image of the Ge nanowire region indicated by the open black box in (B). A twin boundary oriented along the vertical direction is located at the center of this image; (111) lattice planes are visible to the left and right of the boundary. Scale bar, 1 nm. The Ge nanowires were produced by ablation (Spectra Physics GCR-16s, 532 nm, 10 Hz, 2-W average power) of a Ge0.9Fe0.1 target. The growth conditions were 820°C and 300torr Ar flowing at 50 SCCM.
演讲者:10122800 刘旭明
同步辐射X射线近边吸收谱法研究_二元金属重整催化剂中铂和铼的化学态

⑥本法不失为一简单 、快速 、灵敏的化 学态分析手段 。在有良好参比物时 ,可精确 测量多种元素的化学位移 。
表 2 7 个拐点对应能量值
次数
E/ eV
次数
E/ eV
1
10 535. 3
5
10 535. 6
2
10 535. 4
6
10 535. 8
3
10 535. 7
7
10 535. 5
4
10 535. 7
地矿部岩矿测试技术研究所 北京 100037
杨森年
肖延安 谢亚 巨 新 胡天斗
石化总公司石油化工研究院 北京 100083
中国科学院高能物理所 北京 100039
摘要 北京同步辐射装置 (BSRF) 提供同步辐射 ( SR) 可调单色光 ,用 X 射线近边吸收谱法测 得 Fe3 + ~Fe0 和 Ni3 + ~Ni0 的 Kα吸收边能量位移分别为 10 eV ; Pt ( Ⅳ) ~Pt0 的 L Ⅲ吸收边能量位 移为 2 eV ; Re ( Ⅳ) ~Re0 和 Re ( Ⅶ) ~Re0 的 L Ⅲ吸收边能量位移分别为 3 eV 和 4 eV ,其化学位移 测量的标准偏差为 ±0151 eV (2σ) 。
Handbook_of_X-Ray_Spectrometry_CH01

1X-ray PhysicsAndrzej A.MarkowiczVienna,AustriaI.INTRODUCTIONIn this introductory chapter,the basic concepts and processes of x-ray physics that relate to x-ray spectrometry are presented.Special emphasis is on the emission of the continuum and characteristic x-rays as well as on the interactions of photons with matter.In the latter,only major processes of the interactions are covered in detail,and the cross sections for different types of interactions and the fundamental parameters for other processes involved in the emission of the characteristic x-rays are given by the analytical expressions and=or in a tabulated form.Basic equations for the intensity of the characteristic x-rays for the different modes of x-ray spectrometry are also presented(without derivation). Detailed expressions relating the emitted intensity of the characteristic x-rays to the concentration of the element in the specimen are discussed in the subsequent chapters of this handbook dedicated to specific modes of x-ray spectrometry.II.HISTORYX-rays were discovered in1895by Wilhelm Conrad Ro ntgen at the University of Wu rzburg,Bavaria.He noticed that some crystals of barium platinocyanide,near a dis-charge tube completely enclosed in black paper,became luminescent when the discharge occurred.By examining the shadows cast by the rays.Ro ntgen traced the origin of the rays to the walls of the discharge tube.In1896,Campbell-Swinton introduced a definite target (platinum)for the cathode rays to hit;this target was called the anticathode.For his work x-rays,Ro ntgen received thefirst Nobel Prize in physics,in1901.It was thefirst of six to be awarded in thefield of x-rays by1927.The obvious similarities with light led to the crucial tests of established wave optics: polarization,diffraction,reflection,and refraction.With limited experimental facilities, Ro ntgen and his contemporaries couldfind no evidence of any of these;hence,the des-ignation‘‘x’’(unknown)of the rays,generated by the stoppage at anode targets of the cathode rays,identified by Thomson in1897as electrons.The nature of x-rays was the subject of much controversy.In1906,Barkla found evidence in scattering experiments that x-rays could be polarized and must therefore by waves,but W.H.Bragg’s studies of the produced ionization indicated that they werecorpuscular.The essential wave nature of x-rays was established in1912by Laue, Friedrich,and Knipping,who showed that x-rays could be diffracted by a crystal(copper sulfate pentahydrate)that acted as a three-dimensional diffraction grating.W.H.Bragg and W.L.Bragg(father and son)found the law for the selective reflection of x-rays.In 1908,Barkla and Sadler deduced,by scattering experiments,that x-rays contained com-ponents characteristic of the material of the target;they called these components K and L radiations.That these radiations had sharply defined wavelengths was shown by the diffraction experiments of W.H.Bragg in1913.These experiments demonstrated clearly the existence of a line spectrum superimposed upon a continuous(‘‘White’’)spectrum.In 1913,Moseley showed that the wavelengths of the lines were characteristic of the element of the which the target was made and,further,showed that they had the same sequence as the atomic numbers,thus enabling atomic numbers to be determined unambiguously for thefirst time.The characteristic K absorption wasfirst observed by de Broglie and in-terpreted by W.L.Bragg and Siegbahn.The effect on x-ray absorption spectra of the chemical state of the absorber was observed by Bergengren in1920.The influence of the chemical state of the emitter on x-ray emission spectra was observed by Lindh and Lundquist in1924.The theory of x-ray spectra was worked out by Sommerfeld and others.In1919,Stenstro m found the deviations from Bragg’s law and interpreted them as the effect of refraction.The anomalous dispersion of x-ray was discovered by Larsson in 1929,and the extendedfine structure of x-ray absorption spectra was qualitatively in-terpreted by Kronig in1932.Soon after thefirst primary spectra excited by electron beams in an x-ray tube were observed,it was found that secondaryfluorescent x-rays were excited in any material ir-radiated with beams of primary x-rays and that the spectra of thesefluorescent x-rays were identical in wavelengths and relative intensities with those excited when the specimen was bombarded with electrons.Beginning in1932,Hevesy,Coster,and others investigated in detail the possibilities offluorescent x-ray spectroscopy as a means of qualitative and quantitative elemental analysis.III.GENERAL FEATURESX-rays,or Ro ntgen rays,are electromagnetic radiations having wavelengths roughly within the range from0.005to10nm.At the short-wavelength end,they overlap with g-rays,and at the long-wavelength end,they approach ultraviolet radiation.The properties of x-rays,some of which are discussed in detail in this chapter,are summarized as follows:InvisiblePropagated in straight lines with a velocity of36108m=s,as is lightUnaffected by electrical and magneticfieldsDifferentially absorbed while passing through matter of varying composition, density,or thicknessReflected,diffracted,refracted,and polarizedCapable of ionizing gasesCapable of affecting electrical properties of liquids and solidsCapable of blackening a photographic plateAble to liberate photoelectrons and recoil electronsCapable of producing biological reactions(e.g.,to damage or kill living cells and to produce genetic mutations)Emitted in a continuous spectrum whose short-wavelength limit is determined onlyby the voltage on the tubeEmitted also with a line spectrum characteristic of the chemical elementsFound to have absorption spectra characteristic of the chemical elementsIV.EMISSION OF CONTINUOUS RADIA TIONContinuous x-rays are produced when electrons,or other high-energy charged particles,such as protons or a -particles,lose energy in passing through the Coulomb field of a nucleus.In this interaction,the radiant energy (photons)lost by the electron is called bremsstrahlung (from the German bremsen ,to brake,and Strahlung ,radiation;this term sometimes designates the interaction itself).The emission of continuous x-rays finds a simple explanation in terms of classic electromagnetic theory,because,according to this theory,the acceleration of charged particles should be accompanied by the emission of radiation.In the case of high-energy electrons striking a target,they must be rapidly decelerated as they penetrate the material of the target,and such a high negative accel-eration should produce a pulse of radiation.The continuous x-ray spectrum generated by electrons in an x-ray tube is char-acterized by a short-wavelength limit l min ,corresponding to the maximum energy of the exciting electrons:l min ¼hceV 0ð1Þwhere h is Planck’s constant,c is the velocity of light,e is the electron charge,and V 0is the potential difference applied to the tube.This relation of the short-wavelength limit to the applied potential is called the Duane–Hunt law.The probability of radiative energy loss (bremsstrahlung)is roughly proportional to q 2Z 2T =M 20,where q is the particle charge in units of the electron charge e ,Z is the atomic number of the target material,T is the particle kinetic energy,and M 0is the rest mass of the particle.Because protons and heavier particles have large masses compared to the electron mass,they radiate relatively little;for example,the intensity of continuous x-rays generated by protons is about four orders of magnitude lower than that generated by electrons.The ratio of energy lost by bremsstrahlung to that lost by ionization can be approximated bym 0M 0 2ZT 1600m 0c ð2Þwhere m 0the rest mass of the electron.A.Spectral DistributionThe continuous x-ray spectrum generated by electrons in an x-ray tube (thick target)is characterized by the following features:1.Short-wavelength limit,l min [Eq.(1)];below this wavelength,no radiation isobserved.2.Wavelength of maximum intensity l max ,approximately 1.5times l min ;however,the relationship between l max and l min depends to some extent on voltage,voltage waveform,and atomic number.3.Total intensity nearly proportional to the square of the voltage and the firstpower of the atomic number of the target material.The most complete empirical work on the overall shape of the energy distribution curve for a thick target has been of Kulenkampff(1922,1933),who found the following formula for the energy distribution;I ðv Þdv ¼i aZ v 0Àv ðÞþbZ 2ÂÃdvð3Þwhere I ðn Þd n is the intensity of the continuous x-rays within a frequency range ðn ;n þdv Þ;i is the electron current striking the target,Z is the atomic number of the target material,n 0is the cutofffrequency ð¼c =l min Þabove which the intensity is zero,and a and b are constants independent of atomic number,voltage,and cutoffwavelength.The second term in Eq.(3)is usually small compared to the first and is often neglected.The total integrated intensity at all frequencies isI ¼i ða 0ZV 20þb 0Z 2V 0Þð4Þin which a 0¼a ðe 2=h 2Þ=2and b 0¼b ðe =h Þ.An approximate value for b 0=a 0is 16.3V;thus,I ¼a 0iZV 0ðV 0þ16:3Z Þð5ÞThe efficiency Effof conversion of electric power input to x-rays of all frequencies is given byEff ¼I V 0i ¼a 0Z ðV 0þ16:3Z Þð6Þwhere V 0is in volts.Experiments give a 0¼ð1:2Æ0:1ÞÂ10À9(Condon,1958).The most complete and successful efforts to apply quantum theory to explain all features of the continuous x-ray spectrum are those of Kramers (1923)and Wentzel (1924).By using the correspondence principle,Kramers found the following formulas for the energy distribution of the continuous x-rays generated in a thin target:I ðv Þdv ¼16p 2AZ 2e53ffiffi3p m 0V 0c 3dv ;v <v 0I ðv Þdv ¼0;v >v 0ð7Þwhere A is the atomic mass of the target material.When the decrease in velocity of the electrons in a thick target was taken into account by applying the Thomson–Whiddington law (Dyson,1973),Kramers found,for a thick target,I ðv Þdv ¼8p e 2h 3ffiffiffi3p lm 0c 3Z ðv 0Àv Þdv ð8Þwhere l is approximately 6.The efficiency of production of the x-rays calculated via Kramers’law is given byEff ¼9:2Â10À10ZV 0ð9Þwhich is in qualitative agreement with the experiments of Kulenkampff(Stephenson,1957);for example,Eff ¼15Â10À10ZV 0ð10ÞIt is worth mentioning that the real continuous x-ray distribution is described only ap-proximately by Kramers’equation.This is related,inter alia ,to the fact that the derivation ignores the self-absorption of x-rays and electron backscattering effects.Wentzel (1924)used a different type of correspondence principle than Kramers,and he explained the spatial distribution asymmetry of the continuous x-rays from thin targets.An accurate description of continuous x-rays is crucial in all x-ray spectrometry (XRS).The spectral intensity distributions from x-ray tubes are of great importance for applying fundamental mathematical matrix correction procedures in quantitative x-ray fluorescence (XRF)analysis.A simple equation for the accurate description of the actual continuum distributions from x-ray tubes was proposed by Tertian and Broll (1984).It is based on a modified Kramers’law and a refined x-ray absorption correction.Also,a strong need to model the spectral Bremsstrahlung background exists in electron-probe x-ray microanalysis (EPXMA).First,fitting a function through the background portion,on which the characteristic x-rays are superimposed in an EPXMA spectrum,is not easy;several experimental fitting routines and mathematical approaches,such as the Simplex method,have been proposed in this context.Second,for bulk multielement specimens,the theoretical prediction of the continuum Bremsstrahlung is not trivial;indeed,it has been known for several years that the commonly used Kramers’formula with Z directly sub-stituted by the average "Z ¼P i W i Z i (W i and Z i are the weight fraction and atomic number of the i th element,respectively)can lead to significant errors.In this context,some im-provements are offered by several modified versions of Kramers’formula developed for a multielement bulk specimen (Statham,1976;Lifshin,1976;Sherry and Vander Sande,1977;Smith and Reed,1981).Also,a new expression for the continuous x-rays emitted by thick composite specimens was proposed (Markowicz and Van Grieken,1984;Markowicz et al.,1986);it was derived by introducing the compositional dependence of the continuum x-rays already in the elementary equations.The new expression has been combined with known equations for the self-absorption of x-rays (Ware and Reed,1973)and electron back-scattering (Statham,1979)to obtain an accurate description of the detected continuum radiation.A third problem is connected with the description of the x-ray continuum gen-erated by electrons in specimens of thickness smaller than the continuum x-ray generation range.This problem arises in the analysis of both thin films and particles by EPXMA.A theoretical model for the shape of the continuous x-rays generated in multielement specimens of finite thickness was developed (Markowicz et al.,1985);both composition and thickness dependence have been considered.Further refinements of the theoretical approach are hampered by the lack of knowledge concerning the shape of the electron interaction volume,the distribution of the electron within the interaction volume,and the anisotropy of continuous radiation for different x-ray energies and for different film thickness.B.Spatial Distribution and PolarizationThe spatial distribution of the continuous x-rays emitted by thin targets has been in-vestigated by Kulenkampff(1928).The author made an extensive survey of the intensity at angles between 22 and 150 to the electron beam in terms of dependence on wavelength and voltage.The target was a 0.6-m m-thick Al foil.Figure 1shows the continuous x-ray intensity observed at different angles for voltages of 37.8,31.0,24.0,and 16.4kV filtered by 10,8,4,and 1.33mm of Al,respectively (Stephenson,1957).Curve (a)is repeated as a dotted line near each of the other curves.The angle of the maximum intensity varied from50 for 37.8kV to 65 for 16.4kV.Figure 2illustrates the intensity of the continuous x-rays observed in the Al foil for different thicknesses as a function of the angle for a voltage of 30kV (Stephenson,1957).The theoretical curve is from the theory of Scherzer (1932).The continuous x-ray intensity drops to zero at 180 ,and although it is not zero at 0 as the theory of Scherzer predicts,it can be seen from Figure 2that for a thinner foil,a lower intensity at 0 is obtained.Summarizing,it appears that the intensity of the con-tinuous x-rays emitted by thin foils has a maximum at about 55 relative to the incident electron beam and becomes zero at 180 .The continuous radiation from thick targets is characterized by a much smaller anisotropy than that from thin targets.This is because in thick targets the electrons are rarely stopped in one collision and usually their directions have considerable variation.The use of electromagnetic theory predicts a maximum energy at right angles to the in-cident electron beam at low voltages,with the maximum moving slightly away from perpendicularity toward the direction of the elctron beam as the voltage is increased.In general,an increase in the anisotropy of the continuous x-rays from thick targets is ob-served at the short-wavelength limit and for low-Z targets (Dyson,1973).Figure1Intensity of continuous x-rays as a function of direction for different voltages.(Curve (a)is repeated as dotted line.)(From Stephenson,1957.)Continuous x-ray beams are partially polarized only from extremely thin targets;the angular region of polarization is sharply peaked about the photon emission angle y ¼m 0c 2=E 0,where E 0is the energy of the primary electron beam.Electron scattering in the target broadens the peak and shifts the maximum to larger angles.Polarization is defined by (Kenney,1966)P ðy ;E 0;E n Þ¼d s ?ðy ;E 0;E n ÞÀd s kðy ;E 0;E n Þd s ?ðy ;E 0;E n Þþd s kðy ;E 0;E n Þð11Þwhere an electron of energy E 0radiates a photon of energy E n at angle y ;d s ?ðy ;E 0;E n Þand d s kðy ;E 0;E n Þare the cross sections for generation of the continuous radiation with the electric vector perpendicular (?)and parallel (k )to the plane defined by the incident electron and the radiated photon,respectively.Polarization is difficult to observe,and only thin,low-yield radiators give evidence for this effect.When the electron is relativistic before and after the radiation,the electrical vector is most probably in the ?direction.Practical thick-target Bremsstrahlung shows no polarization effects whatever (Dyson,1973;Stephenson,1957;Kenney,1966).V.EMISSION OF CHARACTERISTIC X-RA YSThe production of characteristic x-rays involves transitions of the orbital electrons of atoms in the target material between allowed orbits,or energy states,associated with ionization of the inner atomic shells.When an electron is ejected from the K shell by electron bombardment or by the absorption of a photon,the atom becomes ionized and the ion is left in a high-energy state.The excess energy the ion has over the normal state of the atom is equal to the energy (the binding energy)required to remove the K electron to a state of rest outside the atom.If this electron vacancy is filled by an electron coming from an L level,the transition is accompanied by the emission of an x-ray line known as the K a line.This process leaves a vacancy in the L shell.On the other hand,if the atom contains sufficient electrons,the K shell vacancy might be filled by an electron coming from an M level that is accompanied by the emission of the K b line.The L or M state ions that remain may also give rise to emission if the electron vacancies are filled by electrons falling from furtherorbits.Figure 2Intensity of continuous x-rays as a function of direction for different thicknesses of the A1target together with theoretical prediction.(From Stephenson,1957.)A.Inner Atomic Shell IonizationAs already mentioned,the emission of characteristic x-ray is preceded by ionization of inner atomic shells,which can be accomplished either by charged particles(e.g.,electrons, protons,and a-particles)or by photons of sufficient energy.The cross section for ion-ization of an inner atomic shell of element i by electrons is given by(Bethe,1930;Green and Cosslett,1961;Wernisch,1985)Q i¼p e4n s b s ln UUEc;ið12Þwhere U¼E=E c;i is the overvoltage,defined as the ratio of the instantaneous energy of the electron at each point of the trajectory to that required to ionize an atom of element i,E c;i is the critical excitation energy,and n s and b s are constants for a particular shell: s¼K:n s¼2;b s¼0:35s¼L:n s¼8;b s¼0:25The cross section for ionization Q i is a strong function of the overvoltage,which shows a maximum at Uffi3–4(Heinrich,1981;Goldstein et al.,1981).The probability(or cross section)of ionization of an inner atomic shell by a charged particle is given by(Merzbacher and Lewis,1958)s s¼8p r2q2f sZ Z sð13Þwhere r0is the classic radius of the electron equal to2.818610À15m,q is the particle charge,Z is the atomic number of the target material,f s is a factor depending on the wave functions of the electrons for a particular shell,and Z s is a function of the energy of the incident particles.In the case of electromagnetic radiation(x or g),the ionization of an inner atomic shell is a result of the photoelectric effect.This effect involves the disappearance of a ra-diation photon and the photoelectric ejection of one electron from the absorbing atom, leaving the atom in an excited level.The kinetic energy of the ejected photoelectron is given by the difference between the photon energy h n and the atomic binding energy of the electron E c(critical excitation energy).Critical absorption wavelengths(Clark,1963)re-lated to the critical absorption energies(Burr,1974)via the equation l(nm)¼1.24=E(ke V) are presented in Appendix I.The wavelenghts of K,L,M,and N absorption edges can also be calculated by using simple empirical equations(Norrish and Tao,1993).For energies far from the absorption edge and in the nonrelativistic range,the cross section t K for the ejection of an electron from the K shell is given by(Heitler,1954)t K¼32ffiffiffi2p3p r20Z5ð137Þm0c2hv7=2ð14ÞEquation(14)is not fully adequate in the neighborhood of an absorption edge;in this case,Eq.(14)should be multiplied by a correction factor f(X)(Stobbe,1930):fðXÞ¼2p D hv1=2eÀ4X arccot X1ÀeÀ2p Xð15ÞwhereX¼DhvÀD1=2ð15aÞwithDffi12ðZÀ0:3Þ2m0c2ð137Þ2ð15bÞWhen the energy of the incident photon is of the order m0c2or greater,relativistic cross sections for the photoelectric effect must be used(Sauter,1931).B.Spectral Series in X-raysThe energy of an emission line can be calculated as the difference between two terms,each term corresponding to a definite state of the atom.If E1and E2are the term values re-presenting the energies of the corresponding levels,the frequency of an x-ray line is given by the relationv¼E1ÀE2hð16ÞUsing the common notations,one can represent the energies of the levels E by means of the atomic number and the quantum numbers n,l,s,and j(Sandstro m,1957):E Rh ¼ðZÀS n;lÞ2n2þa2ðZÀd n;l;jÞ2n31lþ12À34n!Àa2ðZÀd n;l;jÞ4n3jðjþ1ÞÀlðlþ1ÞÀsðsþ1Þ2lðlþ12Þðlþ1Þð17Þwhere S n;l and d n;l;j are screening constants that must be introduced to correct for the effect of the electrons on thefield in the atom,R is the universal Rydberg constant valid for all elements with Z>5or throughout nearly the whole x-ray region,and a is thefine-structure constant given bya¼2p e2hcð17aÞThe theory of x-ray spectra reveals the existence of a limited number of allowed transitions;the rest are‘‘forbidden.’’The most intense lines create the electric dipole ra-diation.The transitions are governed by the selection rules for the change of quantum numbers:D l¼Æ1;D j¼0orÆ1ð18ÞThe j transition0?0is forbidden.According to Dirac’s theory of radiation(Dirac,1947),transitions that are forbidden as dipole radiation can appear as multipole radiation(e.g.,as electric quadrupole and magnetic dipole transitions).The selection rules for the former areD l¼0orÆ2;D j¼0;Æ1;orÆ2ð19ÞThe j transitions0?0,12?12,and0$1are forbidden.The selection rules for magnetic dipole transitions areD l¼0;D j¼0orÆ1ð20ÞThe j transition0?0is forbidden.The commonly used terminology of energy levels and x-ray lines is shown in Figure3.A general expression relating the wavelength of an x-ray characteristic line with the atomic number of the corresponding element is given by Moseley’s law(Moseley,1914): 1¼kðZÀsÞ2ð21Þlwhere k is a constant for a particular spectral series and s is a screening constant for the repulsion correction due to other electrons in the atom.Moseley’s law plays an important role in the systematizing of x-ray spectra.Appendix II tabulates the energies and wave-lengths of the principal x-ray emission lines for the K,L,and M series with their ap-proximate relative intensities,which can be defined either by means of spectral line peak intensities or by area below their intensity distribution curve.In practice,the relativeFigure3Commonly used terminology of energy levels and x-ray lines.(From Sandstro m,1957.)intensities of spectral lines are not constant because they depend not only on the electron transition probability but also on the specimen composition.Considering the K series,the K a fraction of the total K spectrum is defined by the transition probability p K a,which is given by(Schreiber and Wims,1982)p K a¼IðK a1þK a2ÞIðK a1þK a2ÞþIðK b1þK b2Þð22ÞWernisch(1985)proposed a useful expression for the calculation of the transition prob-ability p K a for different elements:p K a;i¼1:052À4:39Â10À4Z2i;11Z i190:896À6:575Â10À4Z i;20Z i291:0366À6:82Â10À3Z iþ4:815Â10À5Z2i;30Z2i608<:ð23ÞFor the L level,split into three subshells,several electron transitions exist.The transition probability p L a,defined as the fraction of the transitions resulting in L a1and L a2radiation from the total of possible transitions into the L3subshell,can be calculated by the ex-pression(Wernisch,1985)p L a;i¼0:944;39Z i44À4:461Â10À1þ5:493Â10À2Z iÀ7:717Â10À4Z2iþ3:525Â10À6Z3i;45Z i828<:ð24ÞRadiative transition probabilities for various K and L x-ray lines(West,1982–83)are presented in detail in Appendix III.The experimental results,together with the estimated 95%confidence limits,for the relative intensity ratios for K and L x-ray lines for selected elements with atomic number from Z¼14to92have been reported by Stoev and Dlouhy (1994).The values are in a good agreement with other published experimental data.Because the electron vacancy created in an atom by charged particles or electro-magnetic radiation has a certain lifetime,the atomic levels E1and E2[Eq.(16)]and the characteristic x-ray lines are characterized by the so-called natural widths(Krause and Oliver,1979).The natural x-ray linewidths are the sums of the widths of the atomic levels involved in the transitions.Semiempirical values of the natural widths of K,L1,L2and L3 levels,K a1and K a2x-ray lines for the elements10Z110are presented in Appendix IV.Uncertainties in the level width values are from3%to10%for the K shell and from 8%to30%for the L subshell.Uncertainties in the natural x-ray linewidth values are from 3%to10%for K a1;2.In both cases,the largest uncertainties are for low-Z elements (Krause and Oliver,1979).C.X-ray SatellitesA large number of x-ray lines have been reported that do notfit into the normal energy-level diagram(Clark,1955;Kawai and Gohshi,1986).Most of the x-ray lines,called satellites or nondiagram lines,are very weak and are of rather little consequence in ana-lytical x-ray spectrometry.By analogy to the satellites in optical spectra,it was supposed that the origin of the nondiagram x-ray lines is double or manyfold ionization of an atom through electron impact.Following the ionization,a multiple electron transition results in emission of a single photon of energy higher than that of the characteristic x-rays.The majority of nondiagram lines originate from the dipole-allowed deexcitation of multiply。
X射线粉末衍射的新起点_Rietveld全谱拟合
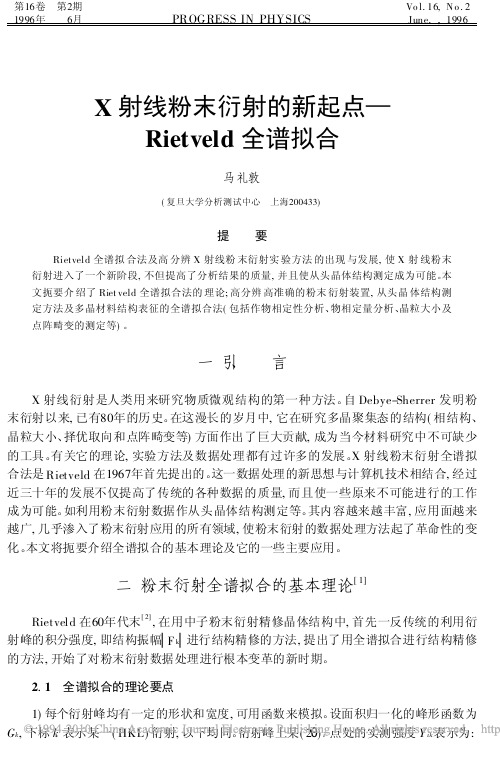
2期
马礼敦 : X 射线粉末衍射的新起点— Rietveld 全谱拟合 表 1 归一化峰形函数及 代表符号
253
G i, k = G i, k = G i, k =
2
ln( 2) H
k
exp
- 4ln( 2) ( 2 i- 2 k) 2 H k2
- 1
G aussia n( gF ) L o rentzian ( L F )
wwwc图谱左右移动量fom检定出的物相pd编号名称第一次检索原始谱111374120147方沸石019861921178018313820319合成方沸石016793921375钙十字沸石016671921180方沸石016002020759钠沸石第二次检索已减去方沸石4120147018751921178017353921375钙十字沸石016642020759钠沸石016383420542合成015993820322合成2r菱沸石第三次检索110273921375钙十字沸石019402020759钠沸石017293420542合成016832720605方石英016641921185钠沸石射线粉末衍射的新起点rietveld全谱拟合263物相定量分析在基本原理中已经提到混合物的粉末谱是各组成物相的粉末谱的权重叠加权重因子是与该相在混合物中的体积或重量分数有关的因而从拟合中找出各相的权重因子也称定标因子再按权重因子与重量分数的关系式即可得出其重量分数
2 H k = V t an k + W
( 14)
[ 5]
以后, 有人认为式 ( 12) 仅适用于高斯函数, 对洛仑兹函数可用另一种形式的峰宽函数 H kL = X t an + Y / co s
( 15)
254
X-ray tomography
In practice, the x-ray sources used for medical imaging do not produce monoenergetic photons. (Although by using the notion of beam hardening explained later, one could filter the x-ray beam to produce x-ray photons of almost the same energy. However, this would greatly reduce the number of photons available for the purpose of imaging, and the resulting degradation in the signal-tonoise ratio would be unacceptable for practically all purposes.) Fig. 4.3 shows an example of an experimentally measured x-ray tube spectrum taken from Epp and Weiss [Epp66] for an anode voltage of 105 kvp. When the energy in a beam of x-rays is not monoenergetic, (7) does not hold, and must be replaced by
Monochromatic X-Ray Projections
If all the photons possess the same energy, then physical considerations that we will not go into dictate that ΔN satisfy the following relationship [Ter67]:
利用X射线实验仪测量验证康普顿散射实验

测量康普顿散射前后的X射线波长
系统中不加吸收片的计数率 X射线出射缝加吸收片的计数 光电探测器处加吸收片的计数 关闭X射线时的背景计数率
R R1 R2 R0
波长
计数率
透射率
康普顿散射前后的X射线波长变化
T e
n
R1 R0 R2 R0 T1 , T2 R R0 R R0
利用X射线实验仪测量验 证康普顿散射实验
0519076 杨昱昊
实验原理
康普顿与康普顿效应
康普顿散射前后波长的变化
2h 2 2 2 1 sin 2c sin me c 2 2
材料对X射线吸收规律
X射线强度透过物质的衰减——Lambert定律
I I 0e
ud
ln ( R R0 ) / ( R2 R0 ) ln ( R R0 ) / ( R1 R0 )
1 n
1 n
验证康普顿位移公式
实验测量值和理论期望值基本符合 但仍有一定的相对偏差
小结
小结
利用材料对X射线吸收规律,通过X射线穿过 吸收片的透射率来确定波长,测量了康普顿散 射散射前后的波长变化,在一定误差范围内验 证了康普顿散射的波长位移
实验方法
确定透射率~波长关系中的待定常数
测量已知波长的X射线(钼靶的特征谱线) 穿过吸收片时的透射率 多组数据代入透射率~波长关系式中,反解 公式中的系数
n 2.91 29 9.88 10
-11 7.11 10 m T 6.2% -11 6.32 10 m T 13.9%
- 1、下载文档前请自行甄别文档内容的完整性,平台不提供额外的编辑、内容补充、找答案等附加服务。
- 2、"仅部分预览"的文档,不可在线预览部分如存在完整性等问题,可反馈申请退款(可完整预览的文档不适用该条件!)。
- 3、如文档侵犯您的权益,请联系客服反馈,我们会尽快为您处理(人工客服工作时间:9:00-18:30)。
a r X i v :c o n d -m a t /0206373v 1 [c o n d -m a t .s t r -e l ] 19 J u n 2002Coherent x-ray scattering from manganite charge and orbital domainsC.S.Nelson,1∗J.P.Hill,1Doon Gibbs,1F.Yakhou,2F.Livet,3Y.Tomioka,4T.Kimura,4and Y.Tokura 4,51Department of Physics,Brookhaven National Laboratory,Upton,NY 11973-50002European Synchrotron Radiation Facility,B.P.220-38043,Grenoble Cedex,France3LTPCM-ENSEEG-INPG,UMR-CNRS No.5614,B.P.75-38402,St.Martin d’H `e res Cedex,France4Correlated Electron Research Center (CERC),AIST,Tsukuba 305-0033,Japan 5Department of Applied Physics,University of Tokyo,Tokyo 113-8656,Japan(February 1,2008)We report coherent x-ray scattering studies of charge and orbital domains in manganite systems.The experiments were carried out on LaMnO 3and Pr 0.6Ca 0.4MnO 3,with the inci-dent photon energy tuned near the Mn K edge.At room temperature,the orbital speckle pattern of LaMnO 3was ob-served to be constant over a timescale of at least minutes,which is indicative of static orbital domains on this timescale.For Pr 0.6Ca 0.4MnO 3,both charge and orbital speckle pat-terns were observed.The observation of the latter rules out the presence of fast orbital fluctuations,while long time series data—on the order of several minutes—were suggestive of slow dynamic behavior.In contrast,the charge order speckle patterns were static.PACS number(s):75.30.Vn,78.70.Ck,42.30.MsCoherent x-ray scattering is a powerful tool for the study of domain structure in condensed matter systems because of its sensitivity to the exact spatial arrangement of the domains.That is,upon illumination by a coherent beam,a sample composed of a mosaic of domains intro-duces a set of different phases into the scattered beam.The interference of these phases,which are related to the positions of the individual domains,gives rise to a “speckle”pattern.In principle,this speckle pattern can be inverted in order to obtain a real-space image of the domains.Such a reconstruction is quite challenging,but has been accomplished in systems consisting of a small number of domains [1,2].Another promising use of coherent x-ray scattering is in the study of dynamics.If the spatial arrangement of the domains changes with time,the phases of the scat-tered beam will be affected and the speckle pattern will also change.Measurements of these changes can there-fore be used to study the dynamics of domain fluctua-tions.In the x-ray regime,such measurements have been used to study order-disorder transitions [3],the dynamics of colloids [4–6]and block copolymer micelles [7],liquid crystal fluctuations [8],alloy decomposition kinetics [9],and magnetic domain fluctuations [10].The characteristics of coherent x-ray scattering,as described above,are well-matched to an outstanding problem within the field of manganite physics—specifi-cally,the problem of the orbital domain state exhibited by many perovskite manganites of the general formula R 1−x M x MnO 3,where R and M are rare-earth and alka-line cations,respectively,at or near half-doping (i.e.,x ≈0.5).At low temperatures,this class of materials is be-lieved to order into a structure involving arrangements of the 3d spin and electronic charge,together with a well-defined 3d orbital occupation.In this so-called CE-type phase,which is shown in Figure 1,the ordering consists of ferromagnetic zigzags,coupled antiferromagnetically;a checkerboard charge arrangement of Mn 3+and Mn 4+ions,stacked in-phase along the c-axis;and orbital or-dering with a concomitant lattice distortion that dou-bles the size of the unit cell along one direction.While this complicated ordering was determined via neutron scattering measurements nearly 50years ago [11],a the-oretical grounding for the CE-type phase is still being developed [12–16].Interest in the CE-type phase has been rekindled in part because of its sensitivity to perturbations.For ex-ample in some materials exhibiting this phase,applica-tion of a magnetic field destroys the charge,orbital,and antiferromagnetic ordering and drives the material from an insulating into a ferromagnetic metallic state—the phenomenon known as colossal magnetoresistance [17].Recently,attention has focused on the domain states of the various kinds of order in the CE-type phase.One par-ticularly intriguing result of these studies is that the or-bital and Mn 3+magnetic sublattices have been observed to exhibit only short-range order—each forming a do-main state with a correlation length on the order of ∼100˚A .In contrast,the charge and magnetic order of the Mn 4+sublattice achieve long-range order [18–20].Rec-onciling these results,it has been shown [18,19]that or-bital domain walls will destroy the coherence of the mag-netic structure on the Mn 3+sites only,leaving the Mn 4+magnetic sublattice intact,if the checkerboard charge ar-rangement is also retained.Thus,the central question is what is the origin of these orbital domain walls,and more specifically,what determines the length scale of the or-bital domains?One possibility,first suggested by Millis [21],lies in the misfit strain that arises from the lattice distortion associated with orbital ordering and grows with the size of the domains.Recent calculations pertaining to the accommodation of such strain in another 3d transition metal system—the cuprates—result in a characteristic length scale of stripe domains on the order of a hun-dred lattice spacings [22],which is of the same order of magnitude as the orbital correlation length observed inthe CE-type phase of the perovskite manganites.Similar arguments have also been made by Khomskii and Kugel [23].A second possibility is that the orbital domain walls are pinned byfluctuations in the rare earth and alkaline cation distribution.Assuming that the cation distribu-tion is quenched,such a mechanism might be expected to lead to the formation of orbital domain walls at the same location upon thermal cycling.Another,related question concerns the time depen-dence of the orbital domains—i.e.,are they static or dynamic?The short-range order exhibited by the or-bital domain state is reminiscent of a glass-like phase. It is possible that the formation of this orbital domain state represents a freezing of the dynamics in a glass-like transition—perhaps near the charge and orbital or-der transition temperature.Indeed,such a transition has recently been observed in the dynamics of corre-lated polarons in the insulating phase of a bilayer man-ganite with a low temperature,ferromagnetic metal-lic state[24].Indirect support of such a picture in the present system follows from the observation of slow dynamics—on the timescale of a few seconds—near an electron beam-induced charge ordering transition in La0.225Pr0.4Ca0.375MnO3[25],while neutron scattering measurements of static short-range ordered magnetic cor-relations imply that the orbital domains are static on the timescale of picoseconds below the N´e el temperature[26]. However to date,there is very little direct information on the dynamics of orbital domains at larger timescale and higher temperatures.In order to address the questions posed above and thereby shed light on the intriguing orbital domain state exhibited by the CE-type phase of perovskite mangan-ites,we have carried out a coherent x-ray scattering study of a well-characterized single-crystal of Pr0.6Ca0.4MnO3 [19].We have observed coherent x-ray scattering from both charge and orbital domains.In addition,we have investigated the orbital domains of a single-crystal of LaMnO3.Both the orbital domains in LaMnO3and the charge domains in Pr0.6Ca0.4MnO3were observed to be static over a timescale of at least minutes.Studies of the orbital speckle pattern of the latter material—while ruling out relatively fast dynamics—were quantitatively inconclusive and will require additional experiments. The coherent x-ray scattering measurements were car-ried out on the ID20beamline at the European Syn-chrotron Radiation Facility(ESRF).This beamline is equipped with a Si(111)double-crystal monochromator, which was used to set the incident photon energy to6.55 keV.This energy was chosen to take advantage of the resonant enhancement in the scattering observed at the charge and orbital wavevectors upon tuning to the vicin-ity of the Mn K edge(see inset to Figure2)[27,28].The undulator source size of0.8×0.3mm2(H×V)FWHM re-sulted in transverse coherence lengths of∼10×30µm2 (H×V)at a distance of45m from the source.An isotropic coherent beam was selected using slits set to a gap of60×60µm2and a10µm diameter pinhole.The incident,longitudinal coherence length,which is deter-mined by the1.4×10−4resolution of the monochromator at the Mn K edge,was∼1µm.This value is greater than the maximum path length difference in the experiment—even at the largest scattering angle of∼30◦—due to the reduced absorption length at photon energies near the ab-sorption edge.The beam therefore satisfies the require-ments for observing coherent diffraction.The coherent beam intensity incident on the sample was1.4×109pho-tons/s.Initial measurements were conducted on a single-crystal of LaMnO3that was grown usingfloating zone techniques at CERC.This material exhibits C-type or-bital order below a temperature of∼800K[28].The sample was mounted in air in a horizontally-scattering diffractometer.A NaI scintillation detector with a2mm diameter active area was used for alignment purposes, and the speckle patterns were subsequently collected us-ing a CCD camera(with384×576,22×22µm2pixels), at a position1.8m from the sample.At the(010)orbital order peak,the scattering intensity was∼800counts/s using the scintillation detector.Examples of three-pixel-wide slices through two im-ages measured at the orbital order wavevector,and their residual,are displayed in the upper and lower parts of Figure2,respectively.In both slices,the contrast be-tween the peaks and valleys is dramatic.This contrast is not a result of limited statistics,but is indicative of the interference of coherent scattering from individual orbital domains.The widths of the peaks—or speckles—is also consistent with the10µm diameter of the pinhole placed in front of the sample.That is,the speckles produced by coherent x-ray scattering should be the size of the Fraun-hofer diffraction pattern of the coherent beam-defining optic.In our set-up,this corresponds to∼2pixels,as observed.Note that this is also the justification for bin-ning in the orthogonal direction.Most significantly,the two slices shown in Figure2 are nearly identical,as illustrated by the near-zero value of the residual.This result demonstrates that the in-terference pattern—and therefore the orbital domains in LaMnO3—are essentially static over a timescale of at least minutes.The data shown in Figure2also provide an estimate of the average size of the orbital domains.We note in passing that the resolution in this experiment, which is determined by the pixel size of the CCD and the sample-to-detector distance,is better than the previ-ous high-resolution x-ray scattering measurements con-ducted on this material that reported resolution-limited peaks[29].Here wefind the orbital domain size,which is inversely proportional to the reciprocal of the envelope width of the entire speckle pattern,to be4000–7000˚A. After the successful demonstration of static or-bital speckle scattering in LaMnO3,a single-crystal of Pr0.6Ca0.4MnO3,which exhibits CE-type charge and or-bital order below a temperature of∼240K,was investi-gated.The x=0.4doping was chosen because its orbital correlation length of320±10˚A is the longest observedin the CE-type phase of this system[19,30].As a result, the structure in the speckle patterns is minimized,since the number of speckles is proportional to the number of orbital domains illuminated by the incident beam.The sample was mounted in a4He cryostat and cooled to a temperature of150K.The NaI scintillation detector was again used to align the sample,and images were then col-lected with the CCD camera.Examples of images at the (02.50)orbital order and(030)charge order peaks are displayed in Figure3.The orbital order image is observed to be much larger than the charge order images as a re-sult of the shorter orbital correlation length.With regard to the charge order,we note the near indistinguishable appearance of the charge speckle patterns in(b)and(c). These two images were collected successively,each over a duration of100s,and their appearance indicates that the charge domains are static at this temperature,over a timescale of at least minutes.A series of speckle patterns were next collected in an attempt to study the temperature dependence of the charge and orbital domains.Speckle patterns were col-lected between the temperatures of150and230K,above which the scattering intensity from the orbital order was too weak to observe over reasonable collection times.Ex-amples of these temperature dependence measurements for the charge and orbital speckle patterns are displayed in Figure4(a,b)and(c,d),respectively,in each case at temperatures of150and200K.Focusingfirst on the charge order images in Figure 4(a,b),we note that the dramatic change in the structure of the slices between the two temperatures is due to the fact that the sample moves slightly in the beam as the temperature changes.As a result,different grains within the sample are illuminated,producing a different speckle pattern.However,at a single temperature,successive slices through the charge speckle patterns are found to be remarkably similar in appearance.The data shown for a temperature of150K(Figure4(a))are slices taken through the images displayed in Figure3(b)and3(c).As remarked earlier,the two images look very similar,and this is reflected in the close correspondence of the slices. Further,images collected within minutes of each other at a temperature of200K(Figure4(b))are also observed to be quite similiar.Taken together,these results are indicative of static charge domains in Pr0.6Ca0.4MnO3 over a timescale of at least minutes,in the temperature range of150–200K.Moving on to the orbital speckle scattering,which is displayed in Figure4(c,d),the results are less conclusive. This is due to the weaker orbital scattering intensity—compared to that of the charge order—and the shorter correlation length that results in an expanded image.To partially counteract these difficulties,longer collection times were utilized.Slices through successive images col-lected over750s at temperatures of150and200K are shown in Figure4(c)and4(d),respectively.At neither temperature is there a close correspondence between suc-cessive images,suggesting that the orbital domains may be dynamic.However,the presence offine structure in all four slices indicates that any dynamic behavior is rel-atively slow—on a timescale of several minutes.This follows from the fact that if the orbital domains had cor-relation times much shorter than minutes,then the struc-ture of a given slice would be washed out into a smooth distribution.Therefore in this temperature range,we can rule out the presence of orbitalfluctuations on the timescale of picoseconds,as inferred by Kajimoto et al.[26].In terms of the temperature dependence of any or-bital domain dynamics,though,quantitative results are difficult to obtain from the current data set due to a lack of statistical significance.In Pr0.6Ca0.4MnO3,we observe static charge domains over a timescale of at least minutes,while the speckle scattering from the orbital domains is suggestive of dy-namic behavior.This latter result leads us to speculate that the orbital domain state is,in fact,glass-like[30]. This is consistent with the lack of long-range order,and in addition,suggests a framework for investigations based on the wealth of experimental and theoretical work on other glass-like systems.An obvious analog to this hy-pothetical,orbital glass-like state in the CE-type phase is the class of materials known as spin glasses[31].In spin glasses,static structural disorder or magnetic frustration precludes the development of long-range magnetic order (though the typical correlation lengths are an order of magnitude smaller than those observed in the hypothet-ical,orbital glass-like phase).Instead,below a freezing temperature,the magnetic moments are oriented in ar-bitrary andfixed—over macroscopic timescales—direc-tions.Theoretical models of spin glasses require frustra-tion,in that no spin configuration simultaneously mini-mizes competing terms in the Hamiltonian.For the case of orbital order discussed here,such frustration could arise from competition between the cooperative Jahn-Teller distortion that constitutes the orbital ordering and fluctuations in the local Jahn-Teller distortion due to quenched disorder of the cation distribution.That is, thefluctuations could interact with the cooperative Jahn-Teller distortion and limit the correlation length of the orbital ordering.Using the analogy between the hypothetical orbital glass-like state in the CE-type phase and spin glasses, directions for future studies become clear.First,it must be determined whether or not the orbital domains exhibit a true glass transition between solid-like and liquid-like phases.Evidence of this could be obtained via further co-herent x-ray scattering studies.A particularly promising approach might be to tune the incident photon energy to the Mn L2and L3edges and use soft,coherent x-ray scattering where much larger resonant enhancements are expected[32]and significant coherentfluxes can be ob-tained(e.g.1012photons/s[33]).Using coherent x-ray scattering,the observation of a dynamic transition in the orbital speckle scattering at some freezing temperature would provide strong support for a glass-like picture.Fol-lowing this,relaxation times of the orbital domain stateshould be characterized.In spin glasses,the relaxation has a very broad spectrum ranging from macroscopic val-ues below the freezing temperature to tens of picoseconds at temperatures well above this transition.In the studies of the orbital domain state of the CE-type phase reported here,only possibly macroscopic timescales for relaxation have been observed.In the future,other routes for the characterization of relaxation times might include studies of properties that couple to the orbital order parameter—for example,by taking advantage of the connection be-tween the lattice distortion and orbital order.In conclusion,we have used coherent x-ray scat-tering to study orbital domains in LaMnO3and Pr0.6Ca0.4MnO3,and charge domains in the latter ma-terial.In LaMnO3,the orbital domains are static at room temperature over a timescale of at least minutes. In Pr0.6Ca0.4MnO3,the charge domains are static over the same macroscopic timescale,while the behavior of the orbital domains is suggestive of dynamic behavior on a relatively long timescale that may be consistent with the formation of a glass-like state.This suggestion of glass-like behavior is extremely intriguing and warrants future study.The work at Brookhaven was supported by the U.S. Department of Energy,Division of Materials Science, under Contract No.DE-AC02-98CH10886.We thank Carsten Detlefs for help during the measurements.Kortright,and E.E.Fullerton,Synch.Rad.News 14,11(2001).FIG.1.Schematic diagram of the CE-type structure,in the a −b plane.Closed circles represent Mn 4+ions,elongated figure-eights represent the occupied e g (3d z 2−r 2-type)orbital of Mn 3+ions,and +and −indicate the magneticordering.FIG.2.Linear slices through the (010)orbital peak in LaMnO 3(upper).The two slices were taken successively and are 3pixels wide in the perpendicular direction (the approxi-mate speckle size).Data were collected at room temperature,and for clarity,error bars are only displayed at every tenth pixel.The difference between the two slices is shown in the lower panel.Inset shows the energy dependence of the scat-tered intensity at the orbital orderwavevector.FIG.3.Images of orbital (a)and charge (b,c)order speckle scattering measured at a temperature of 150K.The image in (a)consists of 101frames,measured for 15s per frame;the images in (b)and (c)each consist of 101frames,measured for 1s per frame.Note that the two images in (b)and (c)were collected within minutes of each other.FIG.4.Linear slices through images of charge/orbital speckle scattering from Pr0.6Ca0.4MnO3,measured at150K (a/c)and200K(b/d).Slices are three pixels wide in the direction perpendicular to the scattering plane.For clarity, error bars are only displayed at every tenth pixel.。