硕士计量1-08-Functional Forms-2
最新伍德里奇计量经济学讲义2教学文案

Functional Form (continued)
First, use economic theory to guide you Think about the interpretation Does it make more sense for x to affect y in percentage (use logs) or absolute terms? Does it make more sense for the derivative of x1 to vary with x1 (quadratic) or with x2 (interactions) or to be fixed?
3
Functional Form (continued)
We already know how to test joint exclusion restrictions to see if higher order terms or interactions belong in the model It can be tedious to add and test extra terms, plus may find a square term matters when really using logs would be even better A test of functional form is Ramsey’s regression specification error test (RESET)
8
Proxy Variables (continued)
What do we need for for this solution to
give us consistent estimates of b1 and b2?
计量经济学概念题
Cp11.a:Stochastic error term: Stochastic error term is a term that is added to a regression equation to introduce all of the variation in Y that cannot be explained by the included Xs.B:Linear : An equation is linear if plotting the function in terms of X and Y generates a straight line,c: Slope coefficient(β)shows the response of Y to a one-unit increase in X.d:: a linear regression model which has more than one independent variables .e:. Expected value:the expression β0+β1x is called the deterministic component of the regression equation ,this deterministic component can also be thought of as the expected value of Y given X.f:Residual: the difference between the estimated value of the dependent variable and the actual value of the dependent variable is defined as the residualCP2P43:a: Ordinary Least Squares is a regression estimation technique that calculates theβs so as to minimize the sum of the squared residuals.b:multivariate regression coefficient indicates the change in the dependent variable associated with a one-unit increase in the independent variable in question.c: total sum of squares is the squared variations of Y around its mean as a measure of the amount of variation to be explained by the regression. The explained sum of squares is the amount if the squared deviation of Yi from its mean that is explained by the regression line. Residual sum of squares is the unexplained in an empirical sense by the estimated regression equation.d: coefficient of determination is the ratio of the explained sum of squares to the total sum of squares.e: degrees of freedom is the excess of the number of observations(N) over the number of coefficients(including the intercept estimated (K+1).f: R^2 is the coefficient of determination.Chapter 31.a. Review the literature and develop the theoretical model.Specify the model.Hypothesize the expected signs of coefficient.Collect data.Estimate and evaluate the equation.Document the results.b. Apply other researchers’ model to my data set.c. Any mistakes in the specification of a model.d. The excess of the number of observations over the number of coefficient s to be estimated.Chapter 41.a. The regression model is linear.The error term has a zero population mean.All explanatory variables are uncorrelated with the err termObservations of the err term are uncorrelated with each other.The error term has a constant varianceNo explanatory variable is a perfect linear function of any other explanatory variables.The error term is normally distributed.b. An error term satisfying Assumption through one to five.c. A normal distribution with a mean equal to zero and a variance equal to one.d. SE is the square root of the estimated variance of β s.e. An estimate β is an unbiased estimator if its sampling distribution has as its expected value the true value of β.f. Best Linear Unbiased Estimator.g. The probability distribution of these β values across different samples. Chapter 51.a. A statement of the values that the researcher does not expect.b. A statement of the values that the researcher expects.c. We reject a true null hypothesisd. Indicate the probability of observing an estimated t-value greater than the critical t-value if the null hypothesis were correct.e. In which the alternative hypothesis has values on both sides if null hypothesis.f. When testing a hypothesis, you have to calculate a sample statistic and compare it with a critical value selected in advance.g. A value that divides the acceptance region from the rejection region when testing a null hypothesis.h. It is a ratio of departure of an estimated parameter from its notional value and its standard error.i. A range which contains the true value of an item a specified percentage of the time.j. A p-value for a t-score is the probability of observing a t score that big or bigger if the null hypothesis were true.CHAPTER 61.a. The omitted variable is an important explanatory variable that has been left outof a regression equation.b. The irrelevant variable is the variable included in an equation that doesn’t belong there.c. The specification bias is the bias caused by leaving a variable out of an equation.d. sequential specification search 6.4.2e. The specification error results from choosing the incorrect independent variables, the incorrect functional form and the incorrect form of the stochastic error term.f. The four valid criteria are to help decide whether a given variable belongs in the equation:g. expected bias 6.1.3CP71.a. Elasticity of Y with respect to X, the percentage change in the dependent variable caused by a 1 percent increase in the independent variable, holding the other varia bles in the equation constant can be calculated.b. In a doublelog functional form, the natural log of Y is the dependent variables an d the natural log of X is the independent variable.c. The semiology functional form is a variant of double-log equation in which some but not all of the variables are expressed in terms of their natural logsd. Polynomial functional forms express Y as a function of independent variables, so me of which are raised to powers other than one.e. The inverse functional form expresses Y as a function of the reciprocal of one or more of the independent variables.f. A slope dummy is a dummy variable that is multiplied by an independent variabl e to allow the slope of the relationship between the dependent variable and the pa rticular independent variable to change, depending on whether or not a particular condition is met.g. The natural log of a number is its logarithm to the base of the mathematical cons tant e, where e is an irrational and transcendental number approximately equal to2.718.h. The omitted condition, forms the basis against which the included conditions are compared.i. An interaction term is an independent variable in a regression equation that is th e multiple of two or more other independent variables.j. A form that is linear in the variables should be used unless a specific hypothesis s uggestions otherwise.k. An equation is linear in the coefficients only if the coefficients appear in their si mplest form, they are not raised to any powers and not multiplied or divided by ot her coefficients, and do not themselves include some sort of function.。
硕士研究生入学考试初试科目设置一览表

▲414-植物生理学与生物化学或▲415-动物生理学与生物化学(150分)
水产养殖*
416-普通动物学与普通生态学(150分)
捕捞学*、渔业资源*
417-普通生态学与鱼类学(150分)
其它学科、专业
▲414-植物生理学与生物化学或▲415-动物生理学与生物化学或招生单位自命题科目(代码使用8××或9××,考试时间三小时以上六小时以下的科目代码使用5××)(150分)
2.招生单位自命题科目均可选用相应单元的统考试题。
3.括号内所注分值为该栏考试科目的满分值。
专业学位硕士研究生入学考试初试科目设置及试题选用一览表
序号
类别码
类别名称
第一单元科目
第二单元科目
第三单元科目
第四单元科目
1
0251
金融
▲101-思想政治理论(100分)
▲201-英语一或▲204-英语二或▲202-俄语或▲203-日语,统考外国语以外的其它语种,由单位自命题(科目代码使用240-289)(100分)
7
0352
社会工作
331-社会工作原理(150分)
437-社会工作实务(150分)
8
0353
警务
332-警务硕士专业基础(150分)
438-警务硕士专业综合(150分)
9
0451
教育
333-教育综合(150分)
招生单位自命题科目(代码使用8××或9××) (150分)
10
0553
新闻与传播
334-新闻与传播专业综合能力(150分)
440-新闻与传播专业基础(150分)
11
0554
硕士计量1-05-Functional Forms

Example: Housing Price
Suppose the relationship between the housing price y and pollution nox is log-log, and y and rooms is log-linear, we have: Log(price) = 0+1Log(nox)+ 2rooms+ In this case, for each percent change in pollution, ^ a 1 percent change in price As we have shown, each additional room causes ^ the price to increase by 100 2 percent
Example: Log Model
Let see an example of heteroskedastic variance in the salary vs. catalog purchase dataset using Eviews In other words, the variance of the error term increases with increase in x
Years
of work experience vs. salary
Байду номын сангаас
Holding other factors constant, each extra year of experience leads to the same among of increase in salary (% or $)?
中国计量大学2018年硕士研究生招生专业目录

③302数学二
④823工程光学
材料科学与工程学院
(47)
080500
材料科学与工程※
(全日制)
080501材料物理与化学
080502材料学
080503材料加工工程
①101思想政治理论
②201英语一
③302数学二
④809材料科学基础
9051
普通化学
085202
光学工程
(全日制\非全日制)
01计量与质量管理
02标准化工程
03品牌管理
①101思想政治理论
②201英语一
③303数学三
④811质量管理学
理学院
(22)
070104
应用数学
(全日制)
01智能计算及其应用
02优化与控制理论及应用
03微分方程与动力系统理论及其应用
04金融数学
①101思想政治理论
②201英语一
③713数学分析
④813高等代数
或803或821
9061安全工程专业综合
9062环境工程专业综合
或9011或9021或9032
085210
控制工程
(全日制)
01测量与控制技术及工程
02在线检测与计量校准
①101思想政治理论
②204英语二
③302数学二
④821自动控制原理2
或808或822
9011电子技术
或
9013机械制造技术基础
或9021
④817当代世界经济与政治
9201思想政治教育综合知识
说明:1、“※”表示按一级学科招生;2、同等学力加试科目取得复试资格时通知;3、招生计划含非全日制,具体以教育部下达为准。
北航【测试计量技术及仪器】-【学术硕士】培养方案
仪器科学与光电工程学院测试计量技术及仪器(080402)全日制学术硕士研究生培养方案一、适用学科仪器科学与技术(0804)测试计量技术及仪器(080402)二、培养目标培养我国社会主义建设事业需要的德、智、体全面发展的高层次专门人才:热爱祖国,拥护党的基本路线,遵纪守法,品行端正,并具有艰苦奋斗、为人民服务和为社会主义建设事业献身的精神。
本学科全日制学术硕士研究生具有信息的感知获取、数据处理、结果评估以及对相关要素进行控制的基础理论和专门知识,掌握相应的技能和方法,具有从事本学科领域科学研究工作或独立承担专门技术工作的能力,对本学科所从事的研究方向及其有关技术领域有深入的研究。
较熟练掌握一门外语。
三、培养方向测试计量技术及仪器(080402)测试计量技术及仪器学科属信息科学技术领域,研究信息感知获取、数据分析处理、结果验证评估以及对相关要素进行控制的理论与方法,是电子、光学、精密机械、计算机、信息与控制技术多学科互相渗透而形成的一门高新技术密集型综合学科。
主要探讨和研究测量理论和测量方法、各种类型测量仪器、测控系统的工作原理、设计方法和应用技术。
主要培养方向:1.自动测试与诊断2、过程参数测量与成像3. 先进传感技术与系统4、传感网络与信息融合网络化传感系统5. 计算机视觉及模式识别6、光电精密测试与系统7、动态计量与校准四、培养模式及学习年限本学科学术硕士研究生主要按二级学科培养,鼓励开展跨学科交叉培养、校企联合培养、本研统筹培养,实行导师或联合导师负责制,负责制订研究生个人培养计划、指导科学研究和学位论文。
硕士研究生实行学分制,学制为两年半至三年,一般在1年内完成课程学习,要求在申请硕士论文答辩前按培养方案获得知识结构中所规定的各部分学分及总学分。
若因客观原因不能按时完成学业者,可申请适当延长培养年限,延长时间不得超过一年。
五、知识和能力结构本学科硕士研究生培养方案的知识和能力结构由学位理论课程和综合实践能力两部分构成,如下表所示。
中国计量大学研究生招生专业目录

中国计量大学研究生招生专业目录
一、专业:
1、信息与计算科学:软件工程、计算机应用技术、网络工程、数据库技术、图形图像与多媒体处理、软件安全与系统加密、物联网应用技术。
2、测量技术与仪器:光学工程、机电一体化技术、模拟电子技术、数字电子技术。
3、精密仪器及自动化:自动控制原理、自动控制技术、工业机器人、智能控制与智能系统。
4、测量工程:工业测量、机械测量、测量设备装配,无损检测技术等。
5、质量科学与管理:质量管理、质量工程、质量系统、质量保证、质量保障技术等。
6、工程管理:工程管理、质量控制、项目管理、计划与预算管理等。
二、研究领域:
1、信息技术及其应用:大数据分析、网络技术、人工智能、物联网、机器视觉等。
2、测量技术及其应用:机电一体化装备、有线传感系统、无损检测系统、半导体测量装备、虚拟现实技术等。
3、质量管理及其应用:质量管理、质量文化建设、统计质量控制等。
4.标准及计量技术:标准研究,方法学研究,计量技术应用等。
Unit 1 The mass media 教学设计-高中英语牛津译林版(2020)选择性必修第二册
本单元的主题语境是“人与社会”,话题为“大众传媒”。
本单元的教学旨在引导学生正确认识并理解大众传媒的形式和内涵,以及它们对日常生活和社会发展的影响和作用,并帮助学生学会合理使用各种大众传媒工具。
本节课的两个语篇分别介绍了美国新闻工作者、出版家普利策的生平故事和普利策奖,共一课时。
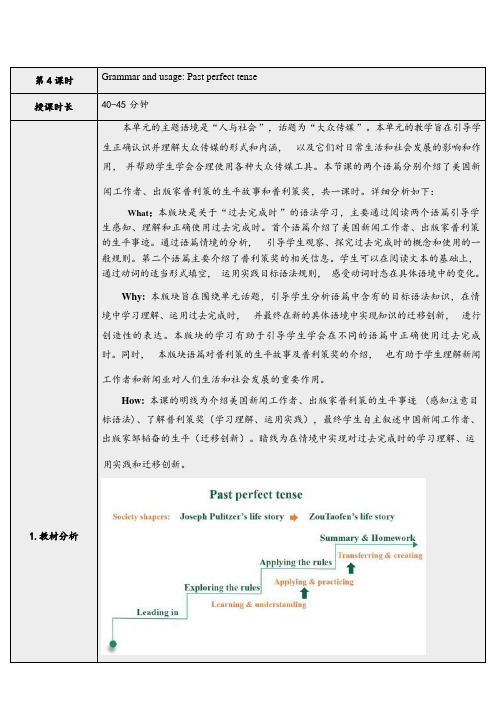
详细分析如下:What:本版块是关于“过去完成时”的语法学习,主要通过阅读两个语篇引导学生感知、理解和正确使用过去完成时。
首个语篇介绍了美国新闻工作者、出版家普利策的生平事迹。
通过语篇情境的分析,引导学生观察、探究过去完成时的概念和使用的一般规则。
第二个语篇主要介绍了普利策奖的相关信息。
学生可以在阅读文本的基础上,通过动词的适当形式填空,运用实践目标语法规则,感受动词时态在具体语境中的变化。
Why: 本版块旨在围绕单元话题,引导学生分析语篇中含有的目标语法知识,在情境中学习理解、运用过去完成时,并最终在新的具体语境中实现知识的迁移创新,进行创造性的表达。
本版块的学习有助于引导学生学会在不同的语篇中正确使用过去完成时。
同时,本版块语篇对普利策的生平故事及普利策奖的介绍,也有助于学生理解新闻工作者和新闻业对人们生活和社会发展的重要作用。
How: 本课的明线为介绍美国新闻工作者、出版家普利策的生平事迹(感知注意目标语法)、了解普利策奖(学习理解、运用实践),最终学生自主叙述中国新闻工作者、出版家邹韬奋的生平(迁移创新)。
暗线为在情境中实现对过去完成时的学习理解、运用实践和迁移创新。
6.教学流程图7.教学过程教学目标教学活动与步骤评价要点核心素养提升点设计意图激活学生已知,感知文本话题。
(学习理解:感知)Step 1 Lead-inT leads Ss to review what theyhave learnt about how to be agood journalist and then talkabout the following questions:·What famous prizes arethere in the world foroutstanding journalists?·What had Joseph Pulitzerdone that contributed tothe birth of the PulitzerPrizes?学生能够完成上节课的作业,并讨论新闻界的“诺贝尔奖”—普利策奖相关话题。
Functional-coefficient regression models for nonlinear time series
from with
the \curse of dimensionality".
Ui taking values in <k and Xi
tLaketinfgUvai;luXesi;inYi<g1ip=.?T1ypbiecajlolyintklyis
strictly small.
stationary Let E(Y12)
transpose of a matrix or vector. The idea to model time series in such a form is not new; see,
for example, Nicholls and Quinn (1982). In fact, many useful time series models may be viewed
This paper adapts the functional-coe cient modeling technique to analyze nonlinear time series
data. The approach allows appreciable exibility on the structure of tted model without su ering
Ui and Xi consist of some lagged values of Yi. The functional-coe cient regression model has the
form
m(u; x) = Xp aj(u) xj;
(1.2)j=1来自where aj( )'s are measurable functions from <k to <1 and x = (x1; : : :; xp)T with T denoting the
分子力场简介

永久偶极(i, j )间的作用Vdipl:
Vdipl i j / D rij3 (cosX 3cosai cosa j ) i j
分子力学
❖分子的力场形式-氢键
V(r) = A/r12 - C/r10
实例:YETI力场
VHB = (A/r12 - C/r10)cos2cos4
分子力学
❖力场的参数化-常力场:
根据量子力学的波恩-奥本海默近似,一个分 子的能量可以近似看作构成分子的各个原子 的空间坐标的函数,简单地讲就是分子的能 量随分子构型的变化而变化,而描述这种分 子能量和分子结构之间关系的就是分子力场 函数。
分子力学和分子力场
• 很多情况下,对大分子体系的处理可以完全避 免使用量子化学计算。分子力学模拟使用古典 力学模型(例如谐振子)描述化合物的能量。 分子力学模型的所有常数均通过实验数据或第 一原理计算结果得到。参数和函数的优化结果 称为分子力场。
键长及键角交叉项:
Vb/ = (1/2)kr(r-r0)(- 0)
分子力学
❖分子的力场形式-键能项:扭转能
分子内部基团绕化学键的旋转会改变分子的构象, 同时也改变了分子的能量状态。用二面角(i)来 描述这种运动形式,采用Fourier级数形式表示为:
V
bonds
Vn
2
(1cos(n
))2
分子力学
分子力学
❖力场的参数化
➢ 各类键长、键角的“本征值”一般取自晶体学、电子衍射 或其他的谱学数据,键伸缩和角变力常数主要由振动光谱 数据确定,扭转力常数经常要从分子内旋转位垒来推算。
➢ 对于不同的力场不仅力场参数不同,函数形式也可能不同。 因此,在将一个力场中的参数应用于另一个力场时应十分 小心。
Chapter 7 Specification Choosing A Functional Form
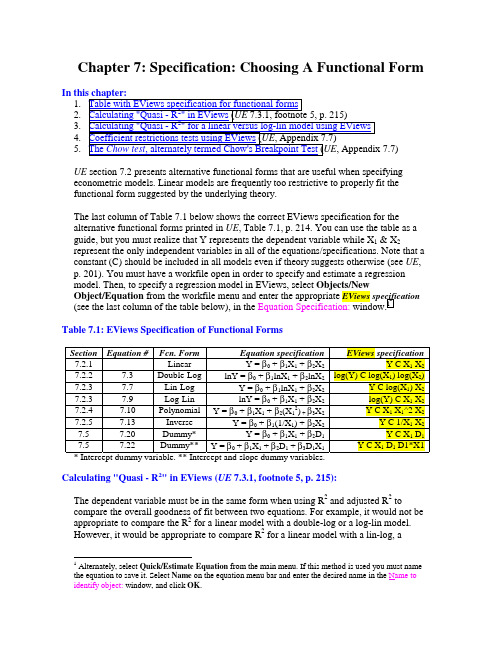
Chapter 7: Specification: Choosing A Functional Form1.2.3.4.5.UE section 7.2 presents alternative functional forms that are useful when specifying econometric models. Linear models are frequently too restrictive to properly fit thefunctional form suggested by the underlying theory.The last column of Table 7.1 below shows the correct EViews specification for thealternative functional forms printed in UE, Table 7.1, p. 214. You can use the table as a guide, but you must realize that Y represents the dependent variable while X1 & X2represent the only independent variables in all of the equations/specifications. Note that a constant (C) should be included in all models even if theory suggests otherwise (see UE, p. 201). You must have a workfile open in order to specify and estimate a regression model. Then, to specify a regression model in EViews, select Objects/NewObject/Equation from the workfile menu and enter the appropriate EViews specification (see the last column of the table below), in the Equation Specification: window.1Table 7.1: EViews Specification of Functional FormsSection Equation # Fcn. Form Equation specification EViews specification7.2.1 ---- Linear Y = β0 + β1X1 + β2X2Y C X1 X27.2.2 7.3 Double-Log lnY = β0 + β1lnX1 + β2lnX2log(Y) C log(X1) log(X2)7.2.3 7.7 Lin-Log Y = β0 + β1lnX1 + β2X2Y C log(X1) X27.2.3 7.9 Log-Lin lnY = β0 + β1X1 + β2X2log(Y) C X1 X27.2.4 7.10 PolynomialY = β0 + β1X1 + β2(X12) + β3X2Y C X1 X1^2 X27.2.5 7.13 Inverse Y = β0 + β1(1/X1) + β2X2Y C 1/X1 X27.5 7.20 Dummy* Y = β0 + β1X1 + β2D1Y C X1 D17.5 7.22 Dummy**Y = β0 + β1X1 + β2D1 + β3D1X1Y C X1 D1 D1*X1 * Intercept dummy variable. ** Intercept and slope dummy variables.Calculating "Quasi - R2" in EViews (UE 7.3.1, footnote 5, p. 215):The dependent variable must be in the same form when using R2 and adjusted R2 to compare the overall goodness of fit between two equations. For example, it would not be appropriate to compare the R2 for a linear model with a double-log or a log-lin model.However, it would be appropriate to compare R2 for a linear model with a lin-log, a1 Alternately, select Quick/Estimate Equation from the main menu. If this method is used you must namethe equation to save it. Select Name on the equation menu bar and enter the desired name in the Name to identify object: window, and click OK.polynomial, or an inverse functional form model. Likewise, it would be appropriate to compare R2 for double-log and log-lin functional form models. In order to demonstrate the process, the car acceleration data introduced in UE, Exercise 16, p. 234, will be used to demonstrate the process of calculating the quasi-R2. The steps below show how tocompare the goodness of fit for models using S (the number of seconds it takes a car to accelerate from 0 to 60 miles per hour) as the dependent variable versus using the natural log of S as the dependent variable. In both models, the independent variables are thesame as the original model printed at the top of UE, p. 236.Calculating "Quasi - R2" for a linear versus a log-lin model using EViews:Step 1. Open the EViews workfile named Cars7.wk1.Step 2. Select Objects/New Object/Equation on the workfile menu bar, enter S C T E P H in the Equation Specification: window, and click OK.Step 3. Select Name on the equation menu bar, write linear in the Name to identify object: window, and click OK. Minimize the equation object named linear.Step 4. Select Objects/New Object/Equation on the workfile menu bar, enter log(S) C T E PH in the Equation Specification: window (i.e., the log-lin functional form), and clickOK.Step 5. Select Name on the equation menu bar, write loglin in the Name to identify object: window, and click OK.Step 6. Select Forecast on the equation menu bar, select S in the Forecast of:2 window, enter SF in the Forecast name: window, uncheck the two boxes in the Output: window (the only objective here is to create a forecast series, not a forecast evaluation), and click OK.A new series named SF appears in the workfile window.Steps 7, 8 & 9 calculate the quasi-R2 for this regression (UE 7.3.1, footnote 5, p. 215). Step 7. Minimize the equation window, select Genr on the workfile menu bar, type numerator=(S-SF)^2 in the Enter equation: window, and click OK (this step generates the un-summed variable in the numerator of the quasi-R2 equation).Step 8. Select Genr on the workfile menu bar, type denominator=(S-@mean(S))^2 in the Enter equation: window, and click OK (this step generates the un-summed variable in the denominator of the quasi-R2 equation).Step 9. To calculate the quasi-R2, type the following equation in the command window and press Enter: scalar quasir2=1-(@sum(numerator)/@sum(denominator)). A new variable named quasir2 will appear in the workfile window. Double click on it and the value for the quasi-R2 will be displayed in the lower left of the screen (0.783958974). The quasi-R2 calculated in Step 9 (i.e., 0.78) is in-between the R2 from the linear model estimated in Step 2 (i.e., 0.71) and the R2 from the log-lin model estimated in Step 5 (i.e., 0.81).2 The Forecast procedure in EViews gives you the option of forecasting the transformed dependentvariable (i.e., LOG(S) in this case) or the original variable (i.e., S in this case). Select S, since thecomputation of quasi-R2 requires converting of LOG(S) to S by taking the anti-log of the dependentvariable (this can also be done by using the EViews command @exp(LOG(S)).Coefficient restrictions tests using EViews (UE, Appendix 7.7):The F-test can be used to test a wide range of hypothesis concerning regressioncoefficients. For example, suppose that the claim was made that when a car has a manual transmission it increases its acceleration speed (i.e., decreases the number of seconds it takes to accelerate from 0 to 60 miles per hour) just as much as adding 100 horsepower to the car. Translating this into the language of UE, Equation 7.28, p. 235, this means that the absolute value of the coefficient on T i is 100 times larger than the absolute value of the coefficient on H i. Just looking at the size of the estimated coefficients, it appears that you can easily reject the hypothesis because the absolute value of the coefficient on T i is only about 41.5 times larger than the absolute value of the coefficient on H i (divide the coefficient on T i by the coefficient on H i). However, these coefficients are just estimates.Follow these steps to carry out an F-test for the null hypothesis that the absolute value of the coefficient on T i is 100 times larger than the absolute value of the coefficient on H i. : Step 1. Open the EViews workfile named Cars7.wk1.Step 2. Select Objects/New Object/Equation on the workfile menu bar, enter S C T E P H in the Equation Specification: window, and click OK.Step 3. Select Name on the equation menu bar, write EQ01 in the Name to identify object: window, and click OK.Step 4. Select View/Coefficients Tests/Wald-Coefficient Restrictions … on the equation menu bar, enter -C(2)=-100*C(5) in the Coefficients separated by commas: window, and click OK to reveal the following output:3Wald Test:Equation: EQ01Null Hypothesis: -C(2)=-100*C(5)Probability 0.124472F-statistic 2.485049Probability 0.114933Chi-square 2.485049The null hypothesis is -C(2)=-100*C(5), since variable T is the second coefficient and variable H is the fifth coefficient in the EViews Estimation Output from Step 2. The F-statistic compares the residual sum of squares computed with and without the restrictions imposed. If the restrictions are valid, there should be little difference in the two residual sum-of-squares and the F-value should be small. Based on the Wald Test: results table, the null hypothesis cannot be rejected at the 5% level of significance. The calculated F-statistic of 2.49 is less than the critical F-value of 4.14. The critical F-value can be found in UE, Table B-2, p. 609 for 1 degree of freedom in the numerator and 33 (interpolate between the 30 and 40) degrees of freedom in the denominator or EViews can calculate3 The coefficients should be referred to as C(1), C(2), and so on (do not use series names). Multiplecoefficient restrictions must be separated by commas and the restrictions should be expressed as equations involving estimated coefficients and constants. The coefficients should be referred to as C(1), C(2), and so on (do not use series names).its value.4 The reported probability is the marginal significance level of the F-test. Itsupports this result in that rejecting the null hypothesis would be wrong less than 12.44% of the time.The Chi-square statistic is equal to the F-statistic times the number of restrictions under test. In this example, there is only one restriction and so the two test statistics areidentical with the p-values of both statistics indicating that we cannot reject the nullhypothesis, that the absolute value of the coefficient on T i is 100 times larger than theabsolute value of the coefficient on H i, at the 10% significance level. The 10%significance critical value for the χ2 test can be found in UE, Table B-8, p. 619 to be 2.71.The Chow test, alternately termed Chow's Breakpoint Test (UE, Appendix 7.7): Chow's Breakpoint Test divides the data into two sub-samples.5 It then estimates thesame equation for each sub-sample separately, to see whether there are significantdifferences in the estimated equations. A significant difference indicates a structuralchange in the relationship.Follow these steps to apply the Chow breakpoint test, as described in UE, pp. 241-242, to determine whether there was a structural change in the demand for chicken in 1976:Step 1. Open the EViews workfile named Chick6.wf1.Step 2. Select Objects/New Object/Equation on the workfile menu bar, enter Y C PC PB YD in the Equation Specification: window, and click OK.Step 3. Select Name on the equation menu bar, write EQ01 in the Name to identify object: window, and click OK.Step 4. Select View/Stability Tests/Chow Breakpoint Test… on the equation menu bar, enter 1976 in the Enter one date (observation) for the Forecast Test or one or more dates for the Breakpoint Test: window, and click OK to reveal the following output:Chow Breakpoint Test: 1976F-statistic 4.542962 Probability 0.004498Log likelihood ratio 17.98027 Probability 0.001245EViews reports two test statistics for the Chow breakpoint test. The F-statistic is based on the comparison of the restricted and unrestricted sum of squared residuals. EViewscalculates the F-statistic using the formula printed in UE, Equation 7.36, p. 242. In this4 To have EViews calculate the 5% critical F-value for this problem, type the following equation in thecommand window =@qfdist(0.95,1,eq01.@regobs-eq01.@ncoefs), press Enter and view the followingvalue on the status bar in the lower left of the screen . For the 10% critical F-value type =@qfdist(0.90,1,eq01.@regobs-eq01.@ncoefs) in the command window, and press Enter and view the following value on the status bar in the lower left of the screen .5 One major drawback of the breakpoint test is that each sub-sample requires at least as many observationsas the number of estimated parameters. This may be a problem if, for example, you want to test forstructural change between wartime and peacetime where there are only a few observations in the wartime sample.case, the calculated F-statistic of 4.54 exceeds the critical F-value of 2.63 for the 5% level of significance so the null hypothesis of no structural change can be rejected. The critical F-value can be found in UE, Table B-2, p. 609 for 4 degrees of freedom in the numerator and 36 (interpolate between the 30 and 40) degrees of freedom in the denominator or EViews can calculate its value.6 The reported probability is the marginal significance level of the F-test. It supports this result in that rejecting the null hypothesis would be wrong less than 0.4498% of the time.The log likelihood ratio statistic is based on the comparison of the restricted and unrestricted maximum of the log likelihood function. The LR test statistic has an asymptotic χ2 distribution with degrees of freedom equal to (m-1)*(k+1) under the null hypothesis of no structural change, where m is the number of sub-samples and k is the number of independent variables in the model (i.e., m = 2 in this case because one breakpoint is selected and k = 3). The calculated value for LR test statistic of 17.98 exceeds of 9.49 for the 5% level of significance and 13.28 for the 1% level of significance so the null hypothesis of no structural change can be rejected.7 The reported probability is the marginal significance level of the χ2 test. It supports this result in that rejecting the null hypothesis would be wrong less than 0.1245% of the time.6 To have EViews calculate the 5% critical F-value for this problem, type the following equation in the command window =@qfdist(0.95,eq01.@ncoef,eq01.@regobs-2*eq01.@ncoef), press Enter and view the following value on the status bar in the lower left of the screen .7The critical value for the χ2 test can be found in UE, Table B-8, p. 619.。
硕士英语综合教程21-参考答案打印版

硕士英语综合教程1 (参考答案)Unit 4 Artificial IntelligenceText A The Future of Artificial Intelligence→III. Keys to the Exercises2. V ocabularya. Fill in the blanks with the correct form of the words or phrases you have learned in the text.(1) attest(2) disoriented(3) elusive(4) negate(5) progeny(6) outstrip(7) versatile(8) meld(9) contingency(10) mainstayb. Choose the word or phrase that is closest in meaning to the underlined one.(1) A(2) D(3) B(4) A(5) D(6) C(7) D(8) D(9) B(10) B4. Translationa. Chinese to English1) Translate the following sentences into English.(1) It often happens, however, that thinking lags behind reality; this is because man’s cognition is limited by numerous social conditions.(2) Something big was in the offing, so big that the workers at the Simonson plant had been virtually placed under arrest to prevent any information from leaking out.(3) Only by understanding the nature of thinking mode, can man bring forth new ideas in philosophy, and the crux of philosophical innovation li es in the change of man’s thinking mode. (4) From then on, he struggled in his attempts to overcome his humble origins and insinuate himself into upper class society.(5) It’s a far cry from the days when I was just a clerk in a supermarket and nobody paid me any attention.(6) The invention of microprocessors set the stage for the arrival of the microcomputer, or personal computer—an affordable machine for the masses.(7) So there’s no such thing as an enemy in absolute terms. The enemies we fight are only in relative terms, constantly changing with the times.(8) Taiwan , viewed from the historical facts and the international law, is beyond dispute one part of Chinese sacred territory and it is an inviolable mission of the entire Chinese people to reunify the motherland.Unit 6 Urban LifeText A How the City Hurts Your Brain, and What You Can Do about It →III. Key to the Exercises2. V ocabularya. Fill in the blanks with the correct form of the words or phrases you have learned in the text. (1) overlooking(2) migrations(3) thoroughfare(4) layout(5) hectic (6) wellspring(7) corollary(8) undil uted(9) myriad(10) vibrantb. Choose the word or phrase that is closest in meaning to the underlined one. (1) B(2) B(3) A(4) D(5) C(6) D(7) A(8) A(9) B(10) D4. Translationa. Chinese to English1) Translate the following sentences into English.(1) There are a lot more wonderful and exciting things waiting for you in New Beijing, a dynamic modern metropolis with 3,000 years of cultural and historical treasures woven into the urban prosp erity.(2) He is such an enthusiastic football fan that he tends to hold forth on his favorite team whenever it is mentioned.(3) The educational system has to be able to outfit the young generation with necessary knowledge , attitudes and values that would ensure they are in time for the new age in which there might be n o jobs but only opportunities.(4) The anxious mother searched high and low for her missing son, only to find him sleeping sound in the mess of toys in his own bedroom.(5) In order to find better detection and treatment, the hospital will actively cooperate with a local research institute to look for genetic markers that correlate with this chronic disease.(6) The accounting system of an enterprise consists of the methods, procedures, and devices used by an economic entity to keep track of its financial activities and to summarize these activities.(7) When she graduated from college, Cindy decided to go back to work in the orphanage where s he had been brought up, because her heart was overstuffed with gratitude and warmth for those wh o had generously helped her in her growth and she wanted to be like them also to give help to the kids who had lost their parents.(8) NASA planned to splurge on the feasibility of the project of sending astronauts to Mars and ha ving them settle down on it.Unit 7 Mass MediaText A A TV Critic in the Post TV World→III. Key to the Exercises2. V ocabularya. Fill in the blanks with the correct form of the words or phrases you have learned in the text.(1) piracy(2) budget(3) whir(4) animation(5) stationary(6) tactile(7) faucet(8) lush(9) rummage(10) premiereb. Choose the word or phrase that is closest in meaning to the underlined one.(1) B(2) D(3) A(4) C(5) B(6) A(7) A(8) D(9) C(10) B4. Translationa. Chinese to English1) Translate the following sentences into English.(1) Now people in Tibet are highly conscious of the importance of protecting wild animals, andthe once rampant hunting of Tibetan antelopes has been brought under control.(2) The journalist had been traveling a lot lately—to Iceland to interview the famous actress there; to Hollywood for the Oscars—but he was stingy with details.(3) We should adhere to the policy of expanding domestic demand, continue to implement the proactive fiscal policy and prudent monetary policy, and ensure a double pull effect on economic growth from both consumption demand and investment demand.(4) The employees of the Human Resource Department have to sift through very carefully the application forms that just came in this morning to separate the wheat from the chaff.(5) Making its debut in 1994, Friends and its cast of easy going single people caught on with viewers looking for an escape from the fast paced 1990s.(6) On the new Pocket PCs, the interface looks more like Palm’s, complete with larger icons and fewer pull down menus.(7) Over the next five years, he continued to evolve his own unique musical style—a style that would become the template for a whole new musical genre.(8) What I love most is to arrive in a place I have never been before and immerse myself in a new culture and environment—to experience first hand what I thought I knew, but which turns out to be much more interesting and surprising once you are there.Unit 9 Car CultureText A Cars—Paradise Found and Paradise Lost →2. V ocabularya. Fill in the blanks with the correct form of the words or phrases you have learned in the text. (1) perpetuate(2) posed(3) Skepticism(4) stereotypical(5) unflinching(6) Infatuation(7) breadwinner(8) cliché(9) degradation(10) avantgardeb. Choose the word or phrase that is closest in meaning to the underlined one. (1) B(2) A(3) A(4) D(5) D(6) D(7) B(8) A(9)B(10)D1) Translate the following sentences into English.(1) After thirty years’ experience of reform and openingup, Chinese people have come to realize th at new economy and globalization have become an unavoidable fact and an irreversible trend. (2) This hearttoheart talk between the two countries helped to eliminate their deepseated misunder standing, and appropriately solve their trade disputes, thus creating a winwin situation.(3) There was such an outcry when the Government put forward its proposals that it was forced to bow before the storm and withdraw them.(4) These documents reflect the central authorities? deep understanding of the important position a nd ro1e of the population issue and their firm determination to take comprehensive measures to ad dress the population problem.(5) To better prepare the soil for planting wheat, the farmers had their field churned up by tractors.(6) Many large companies outsource their Web sites to hosting companies because those compani es offer management services, taking care of security, updating software and providing sitemonitor ing services.(7) To obtain lasting peace, it is imperative to abandon the cold war mentality, cultivate a new con cept of security and seek a new way to safeguard peace.(8) He had one quite reasonable offer for his used car, but turned it down. Then he could find no ta ker at all. He learned with a vengeance that a bird in the hand is worth two in the bush. 2) Translat e the following paragraph into English.。
《计量经济学》第二章知识

第二章 数学基础 (Mathematics)第一节 矩阵(Matrix)及其二次型(Quadratic Forms)第二节 分布函数(Distribution Function),数学期望(Expectation)及方差(Variance) 第三节 数理统计(Mathematical Statistics ) 第一节 矩阵及其二次型(Matrix and its Quadratic Forms)2.1 矩阵的基本概念与运算 一个m ×n 矩阵可表示为:v a a a a a aa a a a A mn m m n n ij ⎥⎥⎥⎥⎦⎤⎢⎢⎢⎢⎣⎡== 212222111211][矩阵的加法较为简单,若C=A +B ,c ij =a ij +b ij但矩阵的乘法的定义比较特殊,若A 是一个m ×n 1的矩阵,B 是一个n 1×n 的矩阵,则C =AB 是一个m ×n 的矩阵,而且∑==nk kj ikij b ac 1,一般来讲,AB ≠BA ,但如下运算是成立的:● 结合律(Associative Law ) (AB )C =A (BC ) ● 分配律(Distributive Law ) A (B +C )=AB +AC 问题:(A+B)2=A 2+2AB+B 2是否成立?向量(Vector )是一个有序的数组,既可以按行,也可以按列排列。
行向量(row ve ctor)是只有一行的向量,列向量(column vector)只有一列的向量。
如果α是一个标量,则αA =[αa ij ]。
矩阵A 的转置矩阵(transpose matrix)记为A ',是通过把A 的行向量变成相应的列向量而得到。
显然(A ')′=A ,而且(A +B )′=A '+B ',● 乘积的转置(Transpose of a production ) A B AB ''=')(,A B C ABC '''=')(。
Unit-2-Principles-ofCorrespondence

4 the unusually high capacity of specialists ( doctors, theologians, philosophers, scientists ,etc)
In such a translation one is concerned with the dynamic relationship, that the relationship between receptor and message should be substantially the same as that which existed between the original receptors and the message.
The nature of the message
Messages differ primarily in the degree to which content or form is the dominant consideration.Of course, the content of a message can never be completely abstracted from the form, and form is nothing apart from content; but in some messages the content is of primary consideration, and in others the form must be given a higher priority.
英汉词典

接合座 自适应总线-digital data highway to which(almost) any number of inputs 地址-electronic code identifying each part of computer memory,each address bit or information unit being routed to different address adhesion 粘接 adhesive tape 粘胶带 adjacent to 邻近的 可调水平安定面-horizontal stabilizer of an airplane which may be adjustable stabilizer adjusted in flight to trim the airplane for hands-off mode in flight admittance 导纳-in AC circui,reciprocal of impedance advance drawing 图纸先行更改通知 change notice(ADCN) advanced 先进的-new sophisticated and typifying latest technology advanced switch 步进电门 adverse effect 不利影响;严重后果 advisory circular(AC) 咨询通报 advisory Message 咨询信息 aerodynamic 空气动力的 aerodynamic smoother 空气动力平滑胶 aeroelastic torsion 气动弹性扭曲 aeronautical 航空的 aerosol 烟雾,浮质-colloid of finely divided solid or liquid disperesed in aft looking forward 从后向前看 afterbody drag 后体阻力 afterburner 加力燃烧室 尾喷管喷火-sometimes called torching,a condition resulting from afterfiring unburrnt fuel being ignited in the exhaust nozzle age-hardening 时效,硬化 ageing=aging 时效处理 aging 老龄的 agent 试剂 aileron 付翼 aileron authority 付翼效能 付翼传动力限制器-electro-mechanical device for limiting the control aileron force limiter wheel movement by the autopilot during autopilot operation aileron programmer 付翼程序器-convert central lateral control actuator motion to control air bleed valve 放气活门 减速板;阻力板-a plate or series of plates that may be projected into air brake airport's slipstream to provide turbulence and drag to slow the air carrier 航空营运者-any company which provides commercial air transportation air conditioning 空调 空气循环机;涡轮冷却器-a compressor & turbine on a common shaft for air cycle machine cooling air in an air conditioning system 大气数据计算机-one which produces air data air data computer information(altitude,airspeed ect) based on pressure and temperature 中断飞行-a change from original flight plan due to a known or air interruption suspected malfunction&/ defect during flight air lock 气锁,气塞-a trapped pocket of air that blocks the flow of fluid 空气封严件;气密封圈;气封严-usually thin rotating or staionary rims air seal designed to act as air DAMS to reduce airflow leakage air ground 起落架位置传感器;空地传感器-an electrical device operated by the sensor landing gear for transmitting airport position for systems operation air tapping 抽气管座 空中返航-return of airplane to airplane of origin as a result of air turnback malfunction or suspected defect of any item on airplane airborne 空中飞行的;机载的
考试科目代码表

考试科目代码表政治理论101哲学711高分子化学808“电动力学”和“信号与系统”830单独考试政治理论111心理学712岩石学809自动控制原理831基础英语713细胞生物学810结构力学832英语一201艺术原理与基础理论(一)714材料力学811水力学833俄语202艺术原理与基础理论(二)715机械原理812工程热力学(二)834日语203数学分析716汽车理论813测绘科学基础835英语二204单独考试数学717生产计划与控制814物理化学836单独考试英语240有机化学(一)718过程装备设计基础815生物化学(一)837二外德语241地球科学基础719造型设计基础816工程地质学838二外法语242生物化学(二)720普通物理817交通工程学839二外日语243设计基础理论(一)721误差理论与数据处理818环境科学概论840二外俄语244设计基础理论(二)722传感器819有机化学(二)841设计基础理论(三)723光电检测技术820运筹与管理842数学一301材料科学基础821企业管理学843数学二302计算机学科专业基础综合408金属学原理822数学三303自然辩证法原理801材料成形基本原理823艺术设计与创作表现(一)501经济学原理802工程热力学(一)824艺术设计与创作表现(二)502教育学专业基础综合311科学社会主义803真空工程技术825设计与表现(一)503设计学概论333思想政治教育原理及方法论804电路826设计与表现(二)504建筑学基础342英语专业综合考试(一)805数字逻辑电路827设计与表现(三)505管理类联考综合能力399英语专业综合考试(二)806“信号与系统”和“数字信号处理”828高等代数807半导体物理及器件物理829第一部分 学术型硕士研究生招生部分学科专业代码名称研 究 方 向招生计划指导教师姓名及职称考 试 科 目参 考 书 目01.生态哲学理论与方法02. 科技进步与社会发展010108科学技术哲学03.高新技术产业及其政策25黄志斌 刘志峰 万伦来王 硕 吴椒军 张建设吴丽兵 任雪萍教授王章豹 朱湖根(兼)研究员周 彬 朱 浩 茆诗珍副教授董 军讲师(博士)1.政治理论2.英语一、日语或俄语3.哲学4.自然辩证法原理《自然辩证法概论新编》,黄志斌主编,安徽大学出版社,2007年版;《辩证唯物主义和历史唯物主义》,李秀林等编,中国人民大学出版社,2004年版。
计量经济学精要5

37
例如,描述税收与税率关系的拉弗曲线: 抛物线: s = a + b r + c r2
其中,s:税收;
r:税率c<0
设X1 = r,X2 = r2, 则原方程变换为 s = a + b X1 + c X2 c<2Xi+ui 无截距模型与一般的模型不同在于:
3
一、双对数模型Double log model
——度量弹性
考虑博彩支出的例子:
Yi AX
B2 i
Y:博彩支出;X:个人可支配收入(PDI) 上式可转化为: lnYi=lnA+B2lnXi 模型特点:关于变量非线性
这样的模型称为双对数( double - log )模型 (因为两个变量都以对数形式出现)或对数-线性 ( log - linear )模型(因为以对数形式出现的变 量之间是线性的)。
Y AL K e
B1 B2
u
反应了产出与劳动力和资本投入之间的关系函
数。 劳动投入弹性+资本投入弹性=规模报酬参数
规模报酬递增 规模报酬递减 规模报酬不变
12
13
14
15
16
四、半对数模型(semilog model)
(一) 对数-线性模型(log-lin)——测量增长 率
42
Figure 5-11 Summary of functional forms.
43
线性模型的弹性系数随着不同点而变化,而双
对数模型任何一点的弹性系数都是相同的。
10
三、多元对数线性回归模型
lnYi=B1+B2lnX2i+B3lnX3i+ui 其中,B2,B3又称为偏弹性系数,它们度量 了在其他变量保持不变 条件下,应变量对 某一解释变量的偏弹性。
- 1、下载文档前请自行甄别文档内容的完整性,平台不提供额外的编辑、内容补充、找答案等附加服务。
- 2、"仅部分预览"的文档,不可在线预览部分如存在完整性等问题,可反馈申请退款(可完整预览的文档不适用该条件!)。
- 3、如文档侵犯您的权益,请联系客服反馈,我们会尽快为您处理(人工客服工作时间:9:00-18:30)。
Adding More Regressors to Reduce the Error Variance
ˆ Given Var j
SST j 1 R
ˆ2
2 j
What is the effect of adding more variables ^ to our model on the Var(j)? It will reduce the error variance, because ˆ ˆ 2 ui2 / n k 1 SSR / n k 1 ^ And from it, it might reduce Var(j) if the added x’s are not correlated with xj
Which one is a better model? Can we use R2 to chose between the two? 2 R can be used to determine which is a better model
Choice of Models
Based on adjusted R2, the polynomial rather then the log model is a better model
Selection of Regressors (cont.)
On the other hand, if our purpose is to see the effect of lot size, number of rooms on the housing price, including the assessed value makes no sense, for it takes away the impact of lot size and number of rooms on the housing price Lets compare the two models in Eviews
2 R
Adjusted R2
Adding more variable to a model will not reduce R2 To compare two different models with different set of regressors (independent variables), the R2 adjusted by degree of R 2 gives us a better freedom denoted as means to compare the two It penalize a model with more regressors
5000
10000
15000
Sales 20000 25000
30000
35000
40000
45000
RDIntens
8 6 4 2 0 0 2 4 Log(Sales) 6 8 10
Selection of Regressors
What should we include or exclude in our model depends on what the purpose of our study is For example, in the housing price model, if our purpose is to see if the assessed value of the house for tax purpose is rational, i.e. the assessed value reflect the market value of the house, then showing the inclusion of other factors made no difference completes the test
Standard Errors of the Intervals
First, suppose that we want an estimate of
The Mean Interval is a prediction based on the variability of the coefficient estimates only The Prediction Interval is a prediction taken also account of the variability of the error term Standard errors of the two are different
Two Types of Confidence Interval Predictions
There are two types of Confidence Interval predictions
Mean
Interval (an interval about the mean) Prediction Interval (an interval about a particular value)
R-squared 0.061329 Adjusted R-squared 0.03004
Mean dependent var 3.265625 S.D. dependent var 1.874079
Lets see why from the following graphs
10 9 8 7 6 5 4 3 2 1 0 0
Example: Choosing Between Two Models
See if we can use RDCHEM dataset to choose between:
rdintens= 0+1log(sales)+u rdintens= 0+1sales+2sales2+ u vs.
计量经济学(研究生)
Class 9 Functional Forms II
More on interaction terms Polynomial (Quadratic) Adjusted R2 Prediction Intervals
Adjusted Model
SSR / (n k 1) R 1 or TSS / (n 1)
2
1 (1 R 2 )(n 1) / (n k 1)
Example: Comparing Different Functional Forms with Adjusted R2
When choosing between two functional forms, for example:
Confidence Interval Predictions of Ŷ
Confidence Interval Predictions of Ŷ
Sometime we are interested in more than just the expected value of Y: ˆ ˆ ˆ ˆ ˆ E(Y ) Y 0 1 X1 2 X 2 ... k X k We might want to know with probability (1-) that an interval around E(Y) contains the true value of the dependent variable Just like we can compute confidence interval estimate of the coefficients, we can also compute confidence interval estimate of the predicted dependent value
If our purpose is to see the effect of lot size, rooms, and house size on the housing price, should we have included the asses value in the model, even if adding it will increase the Adjusted R-squre to .77?
y = 0+1log(x)+u y = 0+1x+ 2x2 +u vs.
Neither is F –test nor is t –test will help us much in choosing between two non-nested models Adjusted R2 comes to the rescue
Dependent Variable: Log(PRICE) No, that will have defeated our purpose. Method: Least Squares The assessed value has taken all these Sample: 1 88 factors into account, so we will not be able to gage the effects separately. Included observations: 88 Variable Coefficient Std. Error t-Statistic Prob. C -1.297041 0.651284 -1.991514 0.0497 Log(SQRFT) 0.700232 0.092865 7.540304 0.0000 BDRMS 0.036958 0.027531 1.342411 0.1831 Log(LOTSIZE) 0.167967 0.038281 4.387717 0.0000 R-squared 0.642965 Mean dependent var 5.633180 Adjusted R-squared 0.630214 S.D. dependent var 0.303573 S.E. of regression 0.184603 Akaike info criterion -0.496833 Sum squared resid 2.862563 Schwarz criterion -0.384227 Log likelihood 25.86066 F-statistic 50.42372 Durbin-Watson stat 2.088996 Prob(F-statistic) 0.000000