可汗学院数学题目-32Center,spread,andshapeofdistributions
可汗学院新SAT语法真题下载

可汗学院新SAT语法真题下载到目前为止,新版SAT可汗学院官方不断放出更多真题,已经放出了68篇阅读,且之前已经和大家分享过可汗学院新SAT阅读真题,想要下载的同学,请点击:新SAT阅读真题下载(共68篇,且已全)目前可汗学院一共放出41篇新SAT数学真题!想要下载的同学,请点击:新SAT数学真题下载(共41篇)分享了可汗学院的数学和阅读真题后,还有我们的可汗学院SAT语法真题。
截止到6月前,可汗学院一共放出了48套新SAT语法真题,想要吗下载请点击:新SAT语法真题下载(共48篇)(网址:)可汗学院新SAT语法真题(部分)Questions 1-5 are based on the following passage. 1Searching for GuinevereStories of kings and queens have captivated readers for centuries, and arguably, the tales of King Arthur and Guinevere are among the most enchanting. Arthur ruled the kingdom of Camelot, and Guinevere was his queen. But were they real people or fictional characters The debate has continued for centuries. Though many scholars have found evidence that the legendary Arthur was, at the very least, based on a real person who lived in Britain roughly between 450 and (1) 500 CE. They continue to search for the historical identity of Guinevere. Guinevere first appeared as King Arthur’s queen in one of the most widelystudied works of Arthurian literature, (2)The History of the Kings of Britain. This book was written by Geoffrey of Monmouth around 1135 CE. Geoffrey’s historical treatment of the legend is often(3)sited as evidence that the queen of Camelot existed, as the book chronicles the lives of a number of historical rulers.*God help those who help themselves. We help those who trust us. Contact Wechat:satxbs123, help is waiting.1A) NO CHANGEB) 500 CE. ContinuingC) 500 CE, continuingD) 500 CE, they continue2Which choice most effectively combines the sentences at the underlined portionA) The History of the Kings of Britain, and this bookB) The History of the Kings of Britain, whichC) a book called The History of the Kings of Britain,as thisD) a book called The History of the Kings of Britain,and this3A) NO CHANGEB) insightedC) citedD) incitedGuinevere is identified by Geoffrey as a noblewoman of Roman descent who met King Arthur in the court of Duke Cador of Cornwall, where she lived as a ward. (4)In Malory’s portrayal, Guinevere had no real power as a monarch but served as a kind of spiritual leader, providing guidance and moral support to the knights in their roles as defenders of the kingdom. Le Morte d’Arthur was also one of the first works to reference Guinevere’s romance with the knight, Sir many Arth urian scholars know, the distinction between history and literature was blurred in the Middle Ages. Consequently, the true identity of Guinevere may never be known with certainty. Yet regardless of whether Guinevere was real or fictional, her story (5) had endured centuries—and through each retelling, she continues to live on in the imaginations of people around the world.4At this point, the author wants to add a sentence which effectively sets up the portrayal of Guinevere discussed in the rest of the paragraph. Which choice best accomplishes this goalA) Three centuries later, however, Thomas Malory painted a very different portrait of Guinevere in Le Morte d’Arthur.B) Sir Thomas Malory was an English knight and Member of Parliament who also wrote extensively about the history of the British monarchy.C) Many historians believe that the portrayal of Arthur and Guinevere in Sir Thomas Malory’s Le Morte d’Arthur was actually a political commentary on the War of the Roses (1455-1487CE).D) In Le Morte d’Art hur, Sir Thomas Malory describes an idyllic England under King Arthur and Guinevere, which eventually collapses into chaos and political unrest. E. I would be guessing.5A) NO CHANGEB) was enduringC) would have enduredD) has enduredQuestions 1-5 are based on the following passage. 1Cometary Missions: Trajectory for SuccessScientists have been launching cometary missions since 1978. The first one, a joint mission by the European Space Agency, and the National Aeronautics and Space Administration (NAS A), was a “flyby” in which the spacecraft collected data while passing around Comet Giacobini-Zinner. (1)However, the landing of the Rosetta space probe on comet 67P/Churyumov-Gerasemenko in 2014 was different: it marked the first time that a probe landed on a( 2 )comet and giving scientists an unprecedented opportunity to study the surface of a comet. In order to continue this valuable research, additional missions are needed; thus, it is critical that more funding be allocated for this 2014 Rosetta mission provided a rare opportunity for scientists to test a number of hypotheses regarding the composition of (3) comets; the distribution of organic compounds in our solar system and the origins of life on Earth. Unlike other cometary missions, the Rosetta spacecraft contained a probe, Philae, that was able to land on the surface of a comet. *Rack your brain and you don't know Wechat: satxbs123, she can help you!1At this point, the writer wants to add accurate information from the graph. Which choice best accomplishes this goalA) From 1978 to 2014, the number of successful missions increased from 28 percent to 72 percent.B) Before 2014, the majority of attempted cometary missions were considered unsuccessful.C) Between then and 2014, 72 percent of the cometary missions were successful.D) Of the missions attempted since then, 44 percent have been successful.2A) NO CHANGEB) comet, but it gaveC) comet, yet givesD) comet, giving3A) NO CHANGEB) comets, the distribution of organic compounds in our solar system,C) comets, the distribution of organic compounds in our solar system;D) comets; the distribution of organic compounds in our solar system,。
可汗学院数学题目-18Polynomialfactorsandgraphs

Polynomial factors and graphs1.P(x) =2x3−18xGiven the polynomial function P defined above, what are its zeros?A. {−9,−6,2,3}B. {−9,0,2}C. {−3,3}D. {−3,0,3}Correct Answer: D Difficult Level: 22. Which of the following functions could represent the graph BELOW in the xy-plane, where y=P(x)?A. P(x) =x2+6x+8B. P(x) =x3+6x2+8xC. P(x) =x2−6x+8D. P(x) =x3−6x2+8xCorrect Answer: B Difficult Level: 23. A polynomial has zeros at−9,2, and0. Which of the following could be the polynomial?A. x2−7x−18B.x3+7x2−18xC.x3+7x2−18xD.x3+6x2−25x+18Correct Answer: B Difficult Level: 24. (x−7) (x+5) (2x−3)Given the polynomial above, what are its zeros?A.{-7, 5, -3}B. {7, - 5, 3}C. {-7, 5, -3}2D. {7, -5, 3}2Correct Answer: D Difficult Level: 25. 2(x+55) (x−17)Given the polynomial above, what are its zeros?A. x=−55and x=17B. x=−55, x=−2, and x=17C. x=−17and x=55D. x=−17,x=2, and x=55Correct Answer: A Difficult Level: 26. G (z) = (z−1)5−(z−1)4 The polynomial function G is defined above. What is the product of the zeros of G? Fill in the blank:Correct Answer: 2 Difficult Level: 27. The polynomial function P has zeros at3and6. Which of the following could be the definition of P?A. P(x)=x2+9x+18B. P(x)=x2−9x+18C. P(x)=x2+3x+6D. P(x)=x2+6x+3Correct Answer: B Difficult Level: 28. Which of the following equations could represent the graph below in the xy-plane?I. y=(x−3)(x+3)II. y=(x−4)2III. y=(x+2)(x+7)A. ⅠonlyB. ⅡonlyC. I and ⅢonlyD. I,Ⅱand ⅢCorrect Answer: A Difficult Level: 29. h (t)=(t−8)1(t−4)2(t−2)3(t−1)4The polynomial function h is defined above. How many distinct zeros does h have? Correct Answer: 4 Difficult Level: 210.x3 +25x2+50x−1000The polynomial above has(x−5)and (x+10)as factors. What is the remaining factor?A. (x+2)B.(x-2)C. (x+2)D. (x-20)Correct Answer: C Difficult Level: 211.x3+7x2−36The polynomial above has zeros at −6 and 2. If the remaining zero is z, then what is the value of −z?Correct Answer: 3 Difficult Level: 312. The function p is a polynomial of t such that (t−10), (22−t),(t+10), and (20+t)are all factors of p(t). Which of the following could be the graph of y=p(t)in the ty-plane?A. B.C. D.Correct Answer: A Difficult Level: 313. Which of the following graphs appears to represent a polynomial function with a double zero?A. B.C. D.Correct Answer: D Difficult Level: 314.g(x)=x4−4x3+6x2−4x+1The function g is defined above. Given that all zeros of g are integers between−1 and 1inclusive, how many distinct zeros does g have?Correct Answer: 1 Difficult Level: 315.x2−ax+24If one of the zeros of the polynomial above is 8, what is the other zero?Correct Answer: 3 Difficult Level: 316. For a function g, the graph of y=g(x)y=g(x)is shown BELOW. When g(x)is divided by(x+10), the remainder is−20. Which of the following is closest to the remainder when g(x)is divided by(x−10)?A. -28B. -2C. 2D. 28Correct Answer: C Difficult Level: 317. The polynomial function f is defined as f(c)=(c−k)(c2−4c+4) where k is a constant. The value 2 is a zero of f. What is the remainder of f(c) when divided by (c−2)?Correct Answer: 0 Difficult Level: 318. Which of the following graphs in the xy-plane have−3and5as all of their distinct zeros for −6≤x≤6?I. II.III.A. I onlyB. I and II onlyC. II and III onlyD. I. II and III.Correct Answer: B Difficult Level: 319. Given some rational constant a, which polynomial equation could represent the graph BELOW in the xy-plane?A.y=a(x+1)2(x−5)B.y=a(x+1) (x−5)C.y=a(x+1) (2x+1)(x−5)D.y=a(x−1) (x+5)2Correct Answer: B Difficult Level: 320. The equation s=(t+3)2(t+2)(t+1)(t)(t−1) is graphed on the st-plane. What is the product of the t-intercepts of the graph?Correct Answer: 0 Difficult Level: 321. q(v)=(v−8)(v−5)(v−4)(v+5)(v+10)The function q is defined above. If the sum of the zeros of q is s, what is the value of s?Correct Answer: 2 Difficult Level: 322. (x−√3)2(x−√7)Given the polynomial above, what are its zeros?A.x=−√3and x=−√7B. x=√3and x=√7C.x=3and x=√7D.x=−3and x=−√7Correct Answer: B Difficult Level: 323. The graph of the polynomial equation y=α(t) is shown BELOW. Which of the following must be true?** leading coefficient is positive.** sum of the distinct t intercepts is negative.** constant coefficient is positive.** product of the distinct t intercepts is negative.Correct Answer: D Difficult Level: 324. The graph shown at left could represent which of the following equations?A. h=−(b−10)(b−20)(b+20)B. h=(b−10)(b−20)(b+20)C. h=−(b+10)(b−20)(b+20)D. h=(b+10)(b−20)(b+20)Correct Answer: A Difficult Level: 325.x3+7x2−36The polynomial above has zeros at −6 and 2. If the remaining zero is z, then what is the value of−z?Correct Answer: 3 Difficult Level: 326. The polynomial function f is defined as f(m)=(m3−m2−17m−15)(m+1). Whenf(m) is divided by (m+1), what is the remainder?Correct Answer: 0 Difficult Level: 427.p(n)=(n3−12n2+47n−60)(n−4)q(n)=(n+13)(n−4)The functions p and q are defined above. One of the functions has a zero at n=5. What is (p+q)(5)?Correct Answer: 18 Difficult Level: 428. Which of the following could be the equation corresponding to the graph BELOW?A.s=a⋅a⋅a⋅aB.s=(a−1)(a−1)C.s=a⋅a⋅a⋅a⋅aD.s=(a−1)(a−1)(a−1)Correct Answer: C Difficult Level: 429.p=(w−30)(w2+178w+7921)Given that −89 is a double zero of the polynomial equation above, which of the following could be the graph of the equation in the pw-plane?A. B.C. D.Correct Answer: D Difficult Level: 430.ℓ(x)=x4+36x2−10,000The polynomial function ℓ is defined above. What is the remainder of ℓ(x) when divided by (x+10)?Correct Answer: 3600 Difficult Level: 431.g (w)=(w+13)3(w+19)2The polynomial function g is defined above. When g (w) is divided by (w+16), the remainder is r. What is the value of ∣r∣?Correct Answer: 243 Difficult Level: 432. A function p p is defined as p(x) = (x−a)(x−15)(x−20)+15 where a is a constant. Given that p (7)=15, what is the value of a?Correct Answer: 7 Difficult Level: 433. A function w is a defined as w(x)=ax2+bx+c where a, b, and c are constants.If a=3 and w(3)=w(15)=0, then what is the absolute value of b?Correct Answer: 54 Difficult Level: 434. A function s is defined as s(x)=(x−4)(x−5)2. A function h is defined ash(x)=(x−a)s(x). For some constant a, (x−a)3 is a factor of h. What is s(a)?Correct Answer: 0 Difficult Level: 435.12x2+ax+2, what is the other zero?If one of the zeros of the above polynomial is 23Correct Answer: 1Difficult Level: 44** any polynomial function h, the polynomial function g is defined to be g(w)=(w−25 )(w−1)h(w). If h has zeros at 1 and 3 only, what is the sum of the distinct zeros of g?Correct Answer: 36 Difficult Level: 437. The polynomial function f f is defined as f(x)=(x−c1)(x−c2)(x−c3)⋯(x−cn)for some positive integer n. Each of the values c1,c2,c3,,,cn is a real number. The graph of y=f(x)is shown BELOW. Which of the following could be the value of n?A. 0B. 1C. 2D. 3Correct Answer: D Difficult Level: 438. The polynomial function f is defined as f(m)=(m3−m2−17m−15)(m+1). When f(m) is divided by (m+1), what is the remainder?Correct Answer: 0 Difficult Level: 4。
美国“高考”SAT考试的数学题
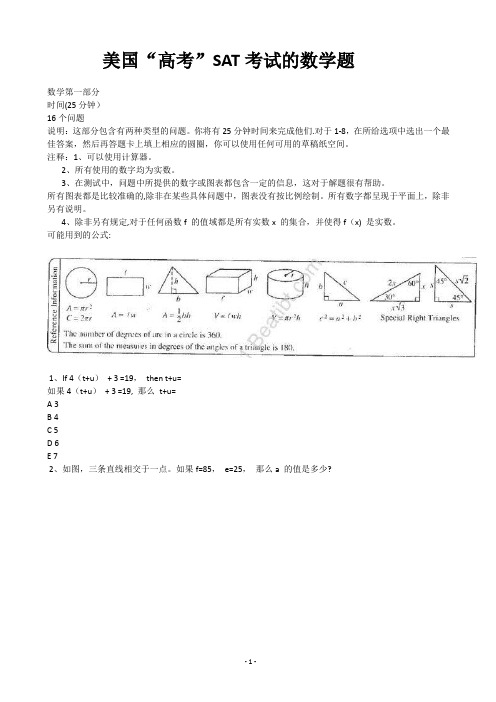
美国“高考”SAT考试的数学题数学第一部分时间(25分钟)16个问题说明:这部分包含有两种类型的问题。
你将有25分钟时间来完成他们.对于1-8,在所给选项中选出一个最佳答案,然后再答题卡上填上相应的圆圈,你可以使用任何可用的草稿纸空间。
注释:1、可以使用计算器。
2、所有使用的数字均为实数。
3、在测试中,问题中所提供的数字或图表都包含一定的信息,这对于解题很有帮助。
所有图表都是比较准确的,除非在某些具体问题中,图表没有按比例绘制。
所有数字都呈现于平面上,除非另有说明。
4、除非另有规定,对于任何函数f 的值域都是所有实数x 的集合,并使得f(x) 是实数。
可能用到的公式:1、If 4(t+u)+ 3 =19,then t+u=如果4(t+u)+ 3 =19, 那么t+u=A 3B 4C 5D 6E 72、如图,三条直线相交于一点。
如果f=85,e=25,那么a 的值是多少?A 60B 65C 70D 75E 853、如果玛丽开车行驶n 英里用了t 小时,那么下列哪个可以表示她行驶的平均速度,英里/小时?A n/tB t/nC 1/ntD ntE n²t4、如果a 是一个奇数,b 是一个偶数,那么选项中哪一个是奇数?A 3bB a+3C 2(a+b)D a+2bE 2a+b5、在平面坐标内,F(—2,1),G(1,4),H(4,1)在以P为圆心的圆上,那么点P的坐标是什么?A(0,0)B(1,1)C(1,2)D(1,—2)E(2.5,2.5)6、如图,如果-3≤x≤6,那么x 有几个值,使得f(x)=2?A 零B 一个C 两个D 三个E 三个以上7、如果t 和t+2 的算术平均值是x, t 和t-2的算术平均值是y,那么x 和y 的算术平均值是多少?A 1B 1/2C tD t+1/2E 2t8、对于任何数x 和y,假设x△y=x²+xy+y²,那么(3△1)△1等于多少?A 5B 13C 27D 170E 1839、摩根的植物在一年之内从42厘米长到57厘米。
新SAT语法试卷解析 可汗学院最新试题详解

可汗学院新放出来的几套题难度比较偏低,适合基础阶段练习使用。
大家千万记得,切忌考前用难度系数偏低的题当成模考题,以免影响整体做题的速度。
The Two Faces of Tlatilco这篇考古学文章在讲关于Tlatilco culture中一些发现。
重点研究的是下面这个不知道是什么的大概N多个眼睛鼻子嘴的面具。
然而这些都不重要,毕竟是语法题。
我们只需要知道本篇文章argue的是关于这个东东的象征意义就可以了。
Q1:标点符号题,难度系数:低。
考查主从句之间的连接。
比较容易错的点是正确选项中将关系代词当成插入语使用,容易引起学生的误解。
Q2:句子结构题,难度系数:低。
正确选项是唯一句子结构完整的选项。
Q3:句间逻辑关系,难度系数:低。
上一句讲述关于mythologies的两面性,下一句解释这个名词本身就是有两个意思。
Q4 :过渡,难度系数:低。
用于衔接上下文。
Q5:标点符号,难度系数:低。
本题考查标点符号中unnecessary punctuation,主语和动词之间不加标点符号。
Q6 : 过渡句,难度系数:中。
本题考查上下文之间的transition,但是需要阅读的信息偏多,并且需要做到承上启下,容易有遗漏信息或者是句子的中心偏移的情况存在,容易影响做题速度。
Q7:effective language use,难度系数:低。
选择不包含重复信息的简洁有效选项即可。
Q8:时态,难度系数:中。
不少同学在这道题中都容易选出B的错误选项。
本题中出现了it’s possible that..明确表推测,用may have been.判断准确的主语,depictions,答案选择动词复数形式。
Q10:人称&用语正式性,难度系数:中排除错误的人称,根据正式性进行判断。
Q11:conclusion总结性信息概括结果,选择添加。
Comedy in Contrast:The Style of Flannery O’Connor这篇文章是关于Flannery O’Connor的小说风格。
代数拓扑学习题(英文)
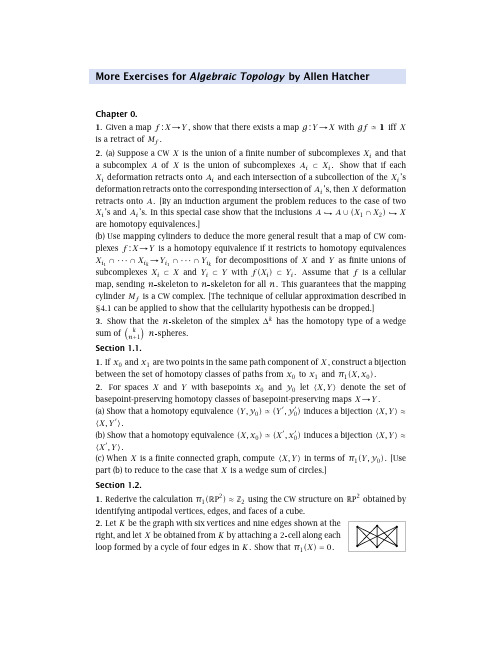
2. (a) Suppose a CW X is the union of a finite number of subcomplexes Xi and that a subcomplex A of X is the union of subcomplexes Ai ⊂ Xi . Show that if each Xi deformation retracts onto Ai and each intersection of a subcollection of the Xi ’s deformation retracts onto the corresponding intersection of Ai ’s, then X deformation retracts onto A . [By an induction argument the problem reduces to the case of two
plexes f : X→Y is a homotopy equivalence if it restricts to homotopy equivalences → Xi1 ∩ ··· ∩ Xik Yi1 ∩ ··· ∩ Yik for decompositions of X and Y as finite unions of
Section 1.2. 1. Rederive the calculation π1(RP2) ≈ Z2 using the CW structure on RP2 obtained by identifying antipodal vertices, edges, and faces of a cube. 2. Let K be the graph with six vertices and nine edges shown at the right, and let X be obtained from K by attaching a 2 cell along each loop formed by a cycle of four edges in K . Show that π1(X) = 0 .
可汗学院数学题目-31Datainferences

Data inferences1.A random sample of 35 four-door passenger vehicles had a mean gas mileage, in miles per gallon (mpg), of 25.9 mpg. The estimate had a margin of error of 2.6 mpg at a 98% confidence level. Of the following, which is most plausible value for the true mean of the mileage of four-door passenger vehicles in general?A.24 mpgB.29 mpgC.32 mpgD.35 mpgCorrect answer: A Difficulty level: 22.Based on random samples of river heights, oceanographers estimate that 4,800 cubic kilometers (km3) of freshwater is discharged into the Arctic Ocean annually. The estimate has a margin of error of 240km3at the 90%confidence level. Which of the following is the most reasonable claim about the volume of freshwater discharged annually into the Arctic Ocean?A.It is between 4,800 and 5,040 km3.B.It is between 4,560 and 5,040 km3.C.It is between 240 and 4800 km3.D.It is between 240 and 4320 km3.Correct answer: B Difficulty level: 23.A survey of 9,000 randomly selected dentists practicing in the United States (US) found that 3,600 of them used text messaging to remind clients of upcoming appointments. If there were 147,000 practicing dentists in the US, approximately how many of them used text messaging for that purpose?A.12,600 dentistsB.58,800 dentistsC.159,600 dentistsD.367,500 dentistsCorrect answer: B Difficulty level: 24.A random sample of international flights in 2013 showed that 79% of the flights arrived within 15 minutes of their scheduled arrival time, and this estimate had a margin of error of 3% at a 95% confidence level. Which of the following conclusions is best?A.Exactly 79% arrived within 15 minutes of their scheduled times.B.Exactly 76% arrived within 15 minutes of their scheduled times.C.Between 76% and 82% arrived within 15 minutes of their scheduled times.D.Between 92% and 98% arrived within 15 minutes of their scheduled times.Correct answer: C Difficulty level: 25.In a poll of 1,578 randomly selected American adults, 44.8% of the respondents said that airlines should allow in-flight calls on airplanes. The results had a margin of error of 2.5%at a 90% confidence level. Which of the following is most likely to be equal to the percentage of all American adults who would say that airlines should allow in-flight calls?A.40%B.43%C.48%D.90%Correct answer: B Difficulty level: 26.In a study of 40randomly selected captive Octopus vulgaris, researchers found that the octopi could learn to integrate visual and tactile information to find food after a mean of 119 trials. The estimate had a margin of error of 18 trials at a 95% confidence level. Which of the following is the most reasonable conclusion about the number of trials it would take all captive Octopus vulgaris in general to learn to find the food?A.The evidence suggests that half of them would require 119 or fewer trials.B.The evidence suggests that the mean number of trials would be 119 trials.C.The evidence suggests that the mean number of trials would be between 119 and 137 trials.D.The evidence suggests that the mean number of trials would be between 101 and 137 trials. Correct answer: D Difficulty level: 37.Researchers measured the heart rates of several randomly selected astronauts exercising on stationary bicycles during long-term space missions. The researchers found the mean heart rate of the astronauts was 155 beats per minute with a margin of error of 12 beats per minute at a 90% confidence level. Which of the following is the most plausible value for the mean heart rate of all astronauts exercising on stationary bicycles during long-term space missions?A. 130 beats per minuteB. 140 beats per minuteC. 160 beats per minuteD. 175 beats per minuteCorrect answer: C Difficulty level: 38.In a poll of 14,697 randomly selected adults in the United States, those polled spent an average of $95 per day in November of last year, as compared with $91 per day in November two years ago. The estimates had a margin of error of $4 at the 95% confidence level. Which of the following is a reasonable claim to make based on this sample?A. All adults in the United States spent between $91 and $99 daily last November.B. 95% of adults in the United States spent between $91 and $99 daily last November.C. It is plausible that average daily spending of adults in the United States remained the same inNovember of last year as it was in November two years ago.D. Between 91% and 99% of adults in the United States spent $4 more daily last November thanin November two years ago.Correct answer: C Difficulty level: 39.In a particular county, a sample of the population showed that 84% of the households lived in the same residence as they had the previous year. The estimate had a margin of error of 1.5% at the 90% confidence level. If the county has 50,000 households, which of the following best estimates the number of households that lived in the same residence as they had the previous year, at the 90% confidence level?A. 34,500 to 49,500 residentsB. 37,500 to 50,000 residentsC. 41,250 to 42,750 householdsD. 44,250 to 45,750 householdsCorrect answer: C Difficulty level: 310.Prior to the 2014 elections, 1,000 randomly selected Louisiana voters were surveyed about what single issue would most likely influence their vote. Of those surveyed, 560voters answered that the state of the economy would most influence their vote. Based on this information, which statement about all voters in Louisiana is most appropriate?A.Exactly 56% of all Louisiana voters thought the state of the economy would most influencetheir voting.B.Approximately 56%of all Louisiana voters thought the state of the economy would mostinfluence their voting.C.Exactly 56% of Louisiana voters would vote for the candidate with the best plan to improvethe economy.D.Approximately 56% of Louisiana voters would vote for the candidate with the best plan toimprove the economy.Correct answer: B Difficulty level: 311.A **pany sells bottles of water. A random sample of 50 water bottles found that the bottles contained, on average, 0.96 liters of water, and the estimate had a margin of error of 0.08 liters at the 95% confidence level. Which of the following is a reasonable claim to make based on this sample?A.**pany always fills its water bottles with less than 1 liter of water.B.**pany usually fills its water bottles with between 0.96 liters and 1.04 liters of water.C.**pany always fills its water bottles with between 0.88 liters and 1.04 liters of water.It is plausible that, on average, **pany fills its water bottles with 1 or more liters of water.Correct answer: D Difficulty level: 412.An archaeologist uses an accelerator mass spectrometer to find the age of a buried branch. At the 68% confidence level, the spectrometer estimates that the branch was 10,000 years old with a margin of error of 200 years. Which of the following could the spectrometer estimate as the age of the branch at the 95% confidence level?A.9,500 years old, with a margin of error of 500 yearsB.10,000 years old, with a margin of error of 400 yearsC.9,500 years old, with a margin of error of 50 yearsD.10,000 years old, with a margin of error of 40 yearsCorrect answer: B Difficulty level: 413.A random sample of500residents of a town included 173residents who primarily spoke a language other than English at home, with a margin of error of 25 residents and a confidence level of 98%. If the town has 25,000 residents, how many residents primarily speak a language other than English at home, with the 98% confidence level?A.7,400 to 9,900 residentsB.8,625 to 8,675 residentsC.24,475 to 24,525 residentsD.23,250 to 25,750 residentsCorrect answer: A Difficulty level: 414.In the National Health and Nutrition Examination Survey, 80.5% of the participants had healthy levels of high-density lipoprotein (HDL) cholesterol, the estimate has a margin of error of 1.5% at a confidence level of 95%. The participants were a random sample of United States (US) residents. If the US population at the time of the study was 316 million people, what is the estimate at a 95% confidence level of the number of people in the US who had healthy levels of HDL cholesterol?A.237 million to 246 million peopleB.245million to 264 million peopleC.250 million to 259 million peopleD.254 million to 300 million peopleCorrect answer: C Difficulty level: 415.A university had 150 students registered for an introductory sociology class. The students were randomly assigned to either a section taught with case studies or with lectures. Both sections took the same final exam. Both margins of error are at a 90% confidence level. Which of the following conclusions is the most reasonable regarding the sociology class?A.The university should only offer the lecture teaching method, because students in that sectionhad a higher final exam average.B.The university should not offer either teaching method, case studies or lectures, becauseneither section achieved the target 90% average.C.The university should only offer the lecture teaching method, because the final exam averageplus the margin of error achieved the target 90%.D.The university does not have strong evidence to indicate which teaching method is moreeffective.Correct answer: D Difficulty level: 4。
高二英语几何图形单选题40题

高二英语几何图形单选题40题1.A basketball is a kind of sphere. What's the shape of a basketball?A.circleB.sphereC.squareD.triangle答案:B。
A 选项“circle”是圆形,指平面图形;B 选项“sphere”是球体,符合篮球的形状;C 选项“square”是正方形;D 选项“triangle”是三角形。
本题考查几何图形的英语表达及区分平面图形和立体图形。
2.The rim of a bicycle wheel is close to what shape?A.circleB.ovalC.rectangleD.pentagon答案:A。
自行车轮的边缘接近圆形。
B 选项“oval”是椭圆;C 选项“rectangle”是长方形;D 选项“pentagon”是五边形。
本题考查对圆形的认识及相关词汇。
3.A coin is in the shape of a(n) _____.A.circleB.sphereC.cubeD.cylinder答案:A。
硬币是圆形的。
B 选项“sphere”是球体;C 选项“cube”是立方体;D 选项“cylinder”是圆柱体。
本题考查常见圆形物体及相关词汇。
4.The shape of a clock face is usually a _____.A.squareB.circleC.triangleD.rectangle答案:B。
钟面通常是圆形的。
A 选项“square”是正方形;C 选项“triangle”是三角形;D 选项“rectangle”是长方形。
本题考查对生活中圆形物体的认识。
5.A pizza is usually in the shape of a _____.A.circleB.ovalC.rectangleD.trapezoid答案:A。
高二英语数学文化赏析练习题40题含答案解析

高二英语数学文化赏析练习题40题含答案解析1.The famous mathematician Archimedes is known for his contributions to which field?A.Mathematics onlyB.Physics onlyC.Both mathematics and physicsD.Chemistry答案解析:C。
Archimedes is famous for his contributions to both mathematics and physics. Option A is incorrect because he is also known for his work in physics. Option B is incorrect because he is also known for his work in mathematics. Option D is incorrect because he is not known for his contributions to chemistry.2.Which mathematician is known as the father of geometry?A.PythagorasB.EuclidC.PlatoD.Aristotle答案解析:B。
Euclid is known as the father of geometry. Option A is incorrect because Pythagoras is known for the Pythagorean theorem. Option C is incorrect because Plato is a philosopher. Option D is incorrect because Aristotle is a philosopher.3.Leonardo Fibonacci is famous for introducing which sequence?A.Arithmetic sequenceB.Geometric sequenceC.Fibonacci sequenceD.Harmonic sequence答案解析:C。
高二英语几何图形单选题40题

高二英语几何图形单选题40题1.A circle has a diameter of 10 cm. What is its radius?A.5 cmB.10 cmC.15 cmD.20 cm答案:A。
本题考查圆的半径和直径的关系。
半径是直径的一半,已知直径是10 厘米,那么半径就是5 厘米。
选项B 是直径的长度,选项C 和D 与题目所给信息不符。
2.The circumference of a circle is 31.4 cm. What is its diameter?A.5 cmB.10 cmC.15 cmD.20 cm答案:B。
本题考查圆的周长和直径的关系。
圆的周长公式是C=πd(C 是周长,d 是直径),已知周长是31.4 厘米,π取3.14,那么直径d=C÷π=31.4÷3.14=10 厘米。
选项A、C、D 计算结果与题目不符。
3.A circular pizza has a radius of 8 inches. What is the area of the pizza?A.64π square inchesB.16π square inchesC.32π square inchesD.48π square inches答案:A。
本题考查圆的面积公式。
圆的面积公式是S=πr²((S 是面积,r 是半径),半径是8 英寸,那么面积就是π×8²=64π 平方英寸。
选项B、C、D 计算结果错误。
4.The distance around a circular park is 100 meters. What is the radius of the park?A.10 metersB.15 metersC.20 metersD.25 meters答案:C。
本题考查圆的周长公式的应用。
圆的周长公式是C=2πr (C 是周长,r 是半径),已知周长是100 米,π取3.14,那么半径r=C÷2÷π=100÷2÷3.14≈15.92,最接近20 米。
高二数学立体几何英语阅读理解20题

高二数学立体几何英语阅读理解20题1<背景文章>A cube is a three-dimensional figure with six equal square faces. It has many interesting properties. The length of each edge of a cube is denoted by 'a'.The surface area of a cube is given by the formula 6a². This means that if the length of an edge is known, we can easily calculate the total surface area covered by the six square faces. For example, if a cube has an edge length of 5 centimeters, then its surface area would be 6 times 5 squared, which is 6 times 25, equal to 150 square centimeters.The volume of a cube is calculated using the formula a³. So, for the same cube with an edge length of 5 centimeters, the volume would be 5 cubed, which is 125 cubic centimeters.Cubes can be found in many real-life applications. For instance, dice are perfect cubes. Also, some storage boxes are in the shape of cubes, which helps in optimizing space. Architects and designers often use cubes in their designs to create unique structures.1. The formula for the surface area of a cube is ____.A. 4a²B. 5a²C. 6a²D. 7a²答案:C。
人教B版高中数学必修第二册课后习题 第五章 5.3.3 古典概型

5.3.3 古典概型课后训练巩固提升1.四条线段的长度分别是1,3,5,7,从这四条线段中任取三条,则所取出的三条线段能构成一个三角形的概率为( )A.14B.13C.12D.25,每条被取出的可能性均相等,所以该问题属于古典概型.又样本空间Ω={(1,3,5),(1,3,7),(1,5,7),(3,5,7)},共含4个样本点,而能构成三角形的样本点只有(3,5,7)1个,所以所取出的三条线段能构成一个三角形的概率是14.2.在5张卡片上分别写上数字1,2,3,4,5,然后将它们混合后,再任意排成一行,则得到的五位数能被2或5整除的概率是( )A.0.2B.0.4C.0.6D.0.85整除关键看其个位数字,而由1,2,3,4,5组成的五位数中,1,2,3,4,5出现在个位是等可能的.所以个位数字的样本空间Ω={1,2,3,4,5},“能被2或5整除”这一事件中含有样本点2,4,5,所求概率为35=0.6.故选C.3.从1,2,3,4中任取2个不同的数,则取出的2个数之差的绝对值为2的概率是( )A.12B.13C.14D.161,2,3,4中任取2个不同的数的样本空间Ω={(1,2),(1,3),(1,4),(2,3),(2,4),(3,4)},满足取出的2个数之差的绝对值为2的有(1,3),(2,4),故所求概率是26=13.4.在第1,3,4,5,8路公共汽车都要停靠的一个站(假定这个站只能停靠一辆汽车),有一名乘客等候第4路或第8路汽车.假定当时各路汽车首先到站的可能性相等,则首先到站正好是这名乘客所需乘的汽车的概率等于( )A.12B.23C.35D.25,在该问题中,样本空间中共含5个样本点,“首先到站正好是这名乘客所需乘的汽车”这一事件包含2个样本点,故所求概率为25.5.从集合{a,b,c,d,e}的所有子集中任取一个,这个集合恰好是集合{a,b,c}的子集的概率是( )A.1B.12C.14D.18{a,b,c,d,e}的所有子集有25=32个,集合{a,b,c}的所有子集有23=8个,故所求概率为832=14.6.(多选题)下列随机试验的数学模型不属于古典概型的是( )A.在一定的条件下,种一粒种子,它可能发芽,也可能不发芽B.在平面直角坐标系内,从横坐标和纵坐标都为整数的所有点中任取一个点C.某射手射击一次,可能命中0环、1环、2环……10环D.四名同学用抽签的方法选一人去参加一个座谈会中事件不具有等可能性,B中试验结果是无限个.7.掷一个均匀的骰子,骰子落地时朝上的面的点数是3的倍数的概率是.6种,其中是3的倍数的结果有2种,故所求概率为26=13.8.从1,2,3,4,5,6这六个数中,一次任取两个数,两个数都是偶数的概率是,一个奇数一个偶数的概率为.Ω={(1,2),(1,3),(1,4),(1,5),(1,6),(2,3),(2,4),(2,5),(2,6),(3,4) ,(3,5),(3,6),(4,5),(4,6),(5,6)},共含15个样本点,其中两个数都是偶数的样本点有(2,4),(2,6),(4,6),共3个,故两个数都是偶数的概率P1=315=15.两个数一奇一偶的样本点有(1,2),(1,4),(1,6),(2,3),(2,5),(3,4),(3,6),(4,5),(5,6),共9个,故所取两数为一个奇数一个偶数的概率P2=915=35.359.4张相同的卡片上分别写有数字1,2,3,4,从这4张卡片中随机抽取2张,则取出的2张卡片上的数字之和为奇数的概率为.,样本空间Ω={(1,2),(1,3),(1,4),(2,3),(2,4),(3,4)},记“取出的2张卡片上的数字之和为奇数”为事件A,则A={(1,2),(1,4),(2,3),(3,4)},故P(A)=46=23.10.依据闯关游戏规则,请你探究图中闯关游戏的奥秘:要求每次同时按下左边和右边各1个按钮(按钮分别标记为左1,左2,右1,右2),其中按下某些按钮可以使灯泡点亮.若点亮灯泡,则闯关成功;否则,闯关失败.(1)用列表的方法表示所有可能的按按钮方式;(2)若只有2个1号按钮同时按下才能点亮灯泡,试求闯关成功的概率.所有可能的按按钮方式列表如下:(2)若只有2个1号按钮同时按下才能点亮灯泡,则所求概率P(闯关成功)=1.411.某商场举行购物抽奖促销活动,规定每位顾客从装有编号为0,1,2,3四个相同小球的抽奖箱中,每次取出一个小球,记下编号后放回,连续取两次.若取出的两个小球编号相加之和等于6,则中一等奖;若等于5,则中二等奖;若等于4或3,则中三等奖.(1)求中三等奖的概率;(2)求中奖的概率.A,“中奖”为事件B,从四个小球中有放回地取两个,有(0,0),(0,1),(0,2),(0,3),(1,0),(1,1),(1,2),(1,3),(2,0),(2,1),(2, 2),(2,3),(3,0),(3,1),(3,2),(3,3),共16种不同的结果.(1)取出的两个小球编号相加之和等于4或3的取法有(0,3),(1,2),(1,3),(2,1),(2,2),(3,0),(3,1),共7种结果,则中三等奖.的概率为P(A)=716(2)由(1)知两个小球编号相加之和等于3或4的取法有7种;两个小球编号相加之和等于5的取法有2种:(2,3),(3,2);两个小球编号相加之和等于6的取法有1种:(3,3).故中奖的概率为P(B)=7+2+116=58.12.(1)从含有两件正品a,b和一件次品c的3件产品中每次任取一件,取出后不放回,连续取两次,求取出的两件产品中恰有一件次品的概率; (2)将(1)中条件“取出后不放回”改为“每次取出后放回”,其余条件不变,再求取出的两件产品中恰有一件次品的概率.样本空间Ω={(a,b),(a,c),(b,c),(b,a),(c,a),(c,b)},其中(a,b)中的a表示第一次取出的产品,b表示第二次取出的产品,Ω中有6个样本点,它们的出现都是等可能的,事件A=“取出的两件产品中,恰好有一件次品”包含4个样本点,则P(A)=46=23.(2)有放回地连续取两件,样本空间Ω={(a,a),(a,b),(a,c),(b,a),(b,b),(b,c),(c,a),(c,b),(c,c)}中共9个样本点,事件B=“恰有一件次品”包含4个样本点,则P(B)=49.1.欲寄出两封信,现有两个邮箱供选择,则两封信都投到同一个邮箱的概率是( )A.12B.14C.34D.381,2,两个邮箱为甲、乙,则寄出两封信,有两个邮箱供选择,有以下几种结果:1放在甲中,而2放在乙中;2放在甲中,而1放在乙中;1,2均放在甲中;1,2均放在乙中.由上可知,两封信都投到同一个邮箱的结果数为2.所以,两封信都投到同一个邮箱的概率为12.2.从所有3位正整数中任取一个数,则此数以2为底的对数也是正整数的概率为( )A.1225B.1300C.1450D.以上全不对900个,若以2为底的对数也是正整数(设为n),则100≤2n≤999,解得n=7,8,9,共3个,故所求概率P=3900=1300.3.有一对年轻夫妇给他们12个月大的婴儿拼排3块分别写有“20”“23”和“中国”的字块.如果婴儿能够排成“2023 中国”或者“中国20 23”,那么他们就给婴儿奖励.假设婴儿能将字块挨着正排,则这个婴儿能得到奖励的概率是( )A.12B.13C.14D.16块字块的排法为“2023 中国”,“20中国23”,“23 20 中国”,“23中国20”,“中国20 23”,“中国23 20”,共6种,婴儿能得到奖励的情况有2种,故所求概率P=26=13.4.(多选题)将一个各个面上涂有颜色的正方体锯成27个同样大小的小正方体,从这些小正方体中任取1个.下列结论正确的是( )A.恰有一面涂有颜色的概率为29B.恰有两面涂有颜色的概率为49C.恰有三面涂有颜色的概率为827D.各面都未涂色的概率为12727个小正方体,有0个面、1个面、2个面、3个面涂有颜色的正方体分别有1个、6个、12个、8个,故它们的概率分别为127,627,1227,827,即127,29,49,827.5.若以连续掷两次均匀的骰子分别得到的点数的坐标满足的坐标满足y=2((x,y)满足x2+y2≤16的有(1,1),(1,2),(1,3),(2,1),(2,2),(2,3),(3,1),(3,2),共8种情况,所以点M的坐标满足(x,y)满足y=2的坐标满足y=2x的概率P2=236=118.1186.某中学调查了某班全部45名同学参加书法社团和演讲社团的情况,数据(单位:人)如下表:(1)从该班随机选1名同学,求该同学至少参加上述一个社团的概率;(2)在既参加书法社团又参加演讲社团的8名同学中,有5名男同学分别记为A1,A2,A3,A4,A5,3名女同学分别记为B1,B2,B3.现从这5名男同学和3名女同学中各随机选1人,求A1被选中且B1未被选中的概率.由调查数据可知,既未参加书法社团又未参加演讲社团的有30人,故至少参加上述一个社团的共有45-30=15(人),所以从该班随机选1名同学,该同学至少参加上述一个社团的概率为P1=1545=13.(2)从这5名男同学和3名女同学中各随机选1人,样本空间Ω={(A1,B1),(A1,B2),(A1,B3),(A2,B1),(A2,B2),(A2,B3),(A3,B1),(A3,B2),(A3,B3),(A4,B1),(A4,B2),(A4,B3),(A5,B1),(A5,B2),(A5,B3)},共15个样本点.根据题意,这些样本点的出现是等可能的.事件“A1被选中且B1未被选中”所包含的样本点有(A1,B2),(A1,B3),共2个.因此A1被选中且B1未被选中的概率为P2=215.7.某产品的三个质量指标分别为x,y,z,用综合指标S=x+y+z评价该产品的等级.若S≤4,则该产品为一等品.现从一批该产品中,随机抽取10件产品作为样本,其质量指标列表如下:(1)利用上表提供的样本数据估计该批产品的一等品率; (2)在该样本的一等品中,随机抽取2件产品. ①用产品编号列出所有可能的结果;②设事件B 为“在取出的2件产品中,每件产品的综合指标S 都等于4”,求事件B 发生的概率.计算10件产品的综合指标S,如下表:其中“S≤4”的有A 1,A 2,A 4,A 5,A 7,A 9,共6件,故该样本的一等品率为610=0.6,从而可估计该批产品的一等品率为0.6.(2)①在该样本的一等品中,随机抽取2件产品的所有可能结果为(A1,A2),(A1,A4),(A1,A5),(A1,A7),(A1,A9),(A2,A4),(A2,A5),(A2,A7),(A2,A9), (A4,A5),(A4,A7),(A4,A9),(A5,A7),(A5,A9),(A7,A9),共15种.②在该样本的一等品中,综合指标S等于4的产品编号分别为A1,A2,A5,A7,则事件B发生的所有可能结果为(A1,A2),(A1,A5),(A1,A7),(A2,A5),(A2,A7),(A5,A7),共6种.所以P(B)=615=25.。
(易错题)高中数学必修二第一章《立体几何初步》测试题(含答案解析)(5)

一、选择题1.设1l 、2l 、3l 是三条不同的直线,α、β、γ是三个不同的平面,则下列命题是真命题的是( )A .若1//l α,2//l α,则12l l //B .若1l α⊥,2l α⊥,则12l l ⊥C .若12//l l ,1l α⊂,2l β⊂,3l αβ⋂=,则13//l lD .若αβ⊥,1l αγ=,2l βγ⋂=,则12l l //2.某几何体的三视图(单位:cm )如图所示,则该几何体的体积(单位:3cm )为( )A .43B .2C .4D .6 3.已知点A ,B ,C 在半径为5的球面上,且214AB AC ==,7BC =,P 为球面上的动点,则三棱锥P ABC -体积的最大值为( )A 567B 527C 497D 147 4.一个几何体的三视图如图所示,则该几何体的外接球的表面积是( )A .2πB .3πC .4πD .16π 5.已知E ,F 是四面体的棱AB ,CD 的中点,过EF 的平面与棱AD ,BC 分别相交于G ,H ,则( )A .GH 平分EF ,BH AG HC GD =B .EF 平分GH ,BH GD HC AG = C .EF 平分GH ,BH AG HC GD = D .GH 平分EF ,BH GD HC AG= 6.如图,在正方体1111ABCD A B C D -中,点F 是线段1BC 上的动点,则下列说法错误的是( )A .无论点F 在上1BC 怎么移动,都有11A FB D ⊥B .当点F 移动至1BC 中点时,才有1A F 与1BD 相交于一点,记为点E ,且12A E EF = C .当点F 移动至1BC 中点时,直线1A F 与平面1BDC 所成角最大且为60°D .无论点F 在1BC 上怎么移动,异面直线1A F 与CD 所成角都不可能是30°7.正三棱柱111ABC A B C -各棱长均为1,M 为1CC 的中点,则点1B 到面1A BM 的距离为( )A 2B .22C .12D 38.在四棱锥P -ABCD 中,//AD BC ,2AD BC =,E 为PD 中点,平面ABE 交PC 于F ,则PF FC =( ) A .1 B .32 C .2 D .39.某三棱锥的三视图如图所示,已知网格纸上小正方形的边长为1,则该三棱锥的体积为( )A .43B .83C .3D .4 10.平行六面体1111ABCD A B C D -的六个面都是菱形,那么点1A 在面11AB D 上的射影一定是11AB D 的________心,点1A 在面1BC D 上的射影一定是1BC D 的________心( )A .外心、重心B .内心、垂心C .外心、垂心D .内心、重心 11.我国古代数学名著《九章算术》中“开立圆术”曰:置积尺数,以十六乘之,九而一,所得开立方除之,即立圆径意思是:球的体积V 乘16,除以9,再开立方,即为球的直径d ,由此我们可以推测当时球的表面积S 计算公式为( )A .2278S d =B .2272S d =C .292S d =D .21114S d = 12.如图,长、宽、高分别为2、1、1的长方体木块上有一只小虫从顶点A 出发沿着长方体的外表面爬到顶点B ,则它爬行的最短路程是( )A .10B .5C .22D .3二、填空题13.如图,平面四边形ABCD 中,1AB AD ==,2,3,BD CD BD CD ==⊥将其沿对角线BD 折成四面体A BCD '-,使平面A BD '⊥平面BCD ,则四面体A BCD '-的外接球的球心到平面ACD '的距离等于__________.14.如图,正二十面体是由20个等边三角形组成的正多面体,共有12个顶点,30条棱,20个面,是五个柏拉图多面体之一.如果把sin36按35计算,则棱长为6的正二十面体的外接球半径等于___________.15.如图,在三棱锥P ABC -中,PA ⊥平面ABC ,AB BC ⊥,2PA AB ==,22AC =,M 是BC 的中点,则过点M 的平面截三棱锥P ABC -的外接球所得截面的面积最小值为___16.已知棱长为4的正方体ABCD -A 1B 1C 1D 1中,点M 是棱AD 的中点,点N 是棱AA 1的中点,P 是侧面四边形ADD 1A 1内一动点(含边界),若C 1P ∥平面CMN ,则线段C 1P 长度的取值范围是________.17.表面积为16π的球与一个正三棱柱各个面都相切,则这个正三棱柱的体积为___________.18.如图,在长方体1111ABCDA B C D ﹣中,O 是11B D 的中点,P 是线段AC 上一点,且直线1PA 交平面11AB D 于点M .给出下列结论:①A ,M ,O 三点共线;②A ,M ,O ,1A 不共面;③A ,M ,C ,O 共面;④B ,1B ,O ,M 共面.其中正确结论的序号为______.19.已知四面体P ﹣ABC 的外接球的球心O 在AB 上,且PO ⊥平面ABC ,2AC 3=,若四面体P ﹣ABC 的体积为32,则该球的体积为_____. 20.在三棱锥P ABC -中,PA ⊥平面ABC ,60BAC ∠=︒,23AB AC ==,2PA =,则三棱锥P ABC -外接球的半径为____________.三、解答题21.如图所示,四棱锥P ABCD -的底面ABCD 是平行四边形,90DBA ∠=︒,2BA BD ==,10,,PA PD E F ==分别是棱,AD PC 的中点.(1)证明://EF 平面PAB ;(2)若二面角P AD B --为60︒,求点B 到平面PAD 的距离.22.如图,在四棱锥P ABCD -中,PAB △是等边三角形,CB ⊥平面,//PAB AD BC 且22PB BC AD F ===,为PC 中点.(1)求证://DF 平面PAB ;(2)求直线AB 与平面PDC 所成角的正弦值.23.如图,正四棱锥P ABCD -中,底面ABCD 的边长为4,4PD =,E 为PA 的中点.(1)求证://PC 平面EBD .(2)求三棱锥E ABD -的体积.24.如图,在四棱锥P ABCD -中,底面ABCD 是边长为1的正方形,PA ⊥底面ABCD ,PA AB =,点M 是棱PD 的中点.(1)求证://PB 平面ACM ;(2)求三棱锥P ACM -的体积.25.如图,四棱锥P ABCD -中,2PC PD DC AD ===,底面ABCD 为矩形,平面PCD ⊥平面ABCD ,O 、E 分别是棱CD 、PA 的中点.(1)求证://OE 平面PBC ;(2)求二面角P AB C 的大小.26.如图,四棱锥E ABCD -中,底面ABCD 是边长为2的正方形,平面AEB ⊥平面ABCD ,4EBA π∠=,2EB =,F 为CE 上的点,BF CE ⊥.(1)求证:BF ⊥平面ACE ;(2)求点D 到平面ACE 的距离.【参考答案】***试卷处理标记,请不要删除一、选择题1.C解析:C【分析】利用已知条件判断1l 与2l 的位置关系,可判断AD 选项的正误;利用线面垂直的性质定理可判断B 选项的正误;利用线面平行的性质定理可判断C 选项的正误.【详解】对于A 选项,若1//l α,2//l α,则1l 与2l 平行、相交或异面,A 选项错误;对于B 选项,若1l α⊥,2l α⊥,由线面垂直的性质定理可得12//l l ,B 选项错误; 对于C 选项,12//l l ,1l α⊂,2l β⊂,α、β不重合,则1l β⊄,1//l β∴, 1l α⊂,3l αβ⋂=,13//l l ∴,C 选项正确;对于D 选项,若αβ⊥,1l αγ=,2l βγ⋂=,则1l 与2l 相交或平行,D 选项错误.故选:C.【点睛】方法点睛:对于空间线面位置关系的组合判断题,解决的方法是“推理论证加反例推断”,即正确的结论需要根据空间线面位置关系的相关定理进行证明,错误的结论需要通过举出反例说明其错误,在解题中可以以常见的空间几何体(如正方体、正四面体等)为模型进行推理或者反驳. 2.B解析:B【分析】根据三视图判断出几何体的结构,利用椎体体积公式计算出该几何体的体积.【详解】根据三视图可知,该几何体为如图所示四棱锥,该棱锥满足底面是直角梯形,且侧棱ED ⊥平面ABCD , 所以其体积为11(12)22232V =⨯⨯+⨯⨯=, 故选:B.【点睛】方法点睛:该题考查的是有关根据几何体三视图求几何体体积的问题,解题方法如下: (1)首先根据题中所给的几何体的三视图还原几何体;(2)结合三视图,分析几何体的结构特征,利用体积公式求得结果. 3.A解析:A【分析】求出球心到平面ABC 的距离,由这个距离加上球半径得P 到平面ABC 距离的最大值,再由体积公式可得P ABC -体积的最大值.【详解】如图,M 是ABC 的外心,O 是球心,OM ⊥平面ABC ,当P 是MO 的延长线与球面交点时,P 到平面ABC 距离最大, 由214AB AC ==,7BC =,得72cos 214ACB ∠==,则14sin 4ACB ∠=, 21428sin 144AB AM CB ===∠,4AM =, 2222543OM OA AM =-=-=,358PM =+=, 又1114sin 2142777224ABC S AC BC ACB =⋅⋅∠=⨯=△ 所以最大的1567783P ABC V -=⨯=故选:A .【点睛】本题考查求三棱锥的体积,解题关键是确定三棱锥体积最大时P 点在球面上的位置,根据球的性质易得结论.当底面ABC 固定,M 是ABC 外心,当PM ⊥平面ABC ,且球心O 在线段PM 上时,P 到平面ABC 距离最大.4.C解析:C【分析】由三视图还原出原几何体,确定其结构,再求出外接球的半径得球的表面积.【详解】由三视图,知原几何体是一个四棱锥P ABCD -,如图,底面ABCD 是边长为1的正方形,PB ⊥底面ABCD ,由PB ⊥底面ABCD ,AD ⊂面ABCD ,得PB AD ⊥,又AD AB ⊥,AB PB B ⋂=,,AB PB ⊂平面PAB ,所以AD ⊥平面PAB ,而PA ⊂平面PAB ,所以AD PA ⊥,同理DC PC ⊥,同样由PB ⊥底面ABCD 得PB BD ⊥,所以PD 中点O 到四棱锥各顶点距离相等,即为其外接球球心,PD 为球直径, 222222PD PB BD PA AD AB =+=++=,∴外接球半径为12AD r ==, 表面积为2414S ππ=⨯=.故选:C .【点睛】关键点点睛:本题考查由三视图还原几何体,考查棱锥的外接球表面积.解题关键是确定外接球的球心.棱锥的外接球球心在过各面外心(外接圆圆心)且与该面垂直的直线上. 5.C解析:C【分析】举特例舍去不正确选项,可得正确答案.【详解】过EF 的平面为平面ABF 时,G 在A 点, H 在B 点, 所以0BH AG HC GD ==,EF 平分GH , 即BH AG HC GD=,所以舍去ABD ,选C 故选:C6.C解析:C【分析】A.通过证明线面垂直,证得线线垂直;B.利用相似三角形,求1A E EF的值;C.首先构造直线1A F 与平面1BDC 所成角,再通过数形结合分析最大角,以及最大角的余弦值,判选项;D.将异面直线所成角转化为相交直线所成角,求解判断.【详解】A.AC BD ⊥,1AC BB ⊥,AC ∴⊥平面1BB D ,1AC B D ∴⊥,11//AC AC ,111B D AC ∴⊥,同理11B D BC ⊥,1111A C BC C ,1B D ∴⊥平面11A BC ,1A F ⊂平面11A BC ,11B D A F ∴⊥,故A 正确;B.连结1A D ,1B C 交1BC 于点F ,11//A B DC ,且11A B DC =,∴四边形11A DCB 是平行四边形,所以11//A D B C ,∴11A DE FB E ,得1112A E A D EF B F==,故B 正确;C.1A O ⊥平面1BDC ,1111A B AC A D ==,∴点O1BDC 是等边三角形的中心,11A BC 是等边三角形,111A BC BDC ≅ 当点F 是1BC 的中点时,11A F BC ⊥,此时1A F 是点1A 和1BC 上的点连线的最短距离,设直线1A F 与平面1BDC 所成角为θ,此时11sin A O A F θ=最大,所以此时θ最大,所以111cos 32OF A F θ==<,最大角大于60,故C 不正确;D.11//A B CD ,CD ∴与1A F 所成的角,转化为11B A F ∠的大小,11B A F ∠的最小角是11B A 与平面11A BC 所成的角,即11B A F ∠,此时1111123tan 2FB B A F A B ∠==>,所以11B A F ∠的最小角大于30,故D 正确.故选:C【点睛】关键点点睛:本题考查利用几何的综合应用,包含线线,线面角,垂直关系,首先会作图,关键选项是C 和D ,C 选项的关键是1A O ⊥平面1BDC ,点O 1BDC 是等边三角形的中心,D 选项的关键是知道先与平面中线所成角中,其中线面角是其中的最小角. 7.B解析:B【分析】连接11A N B A B =,根据已知条件先证明11B A A B ⊥、1⊥MN AB ,再通过线面垂直的判定定理证明1AB ⊥平面1A BM ,由此确定出1B N 的长度即为点1B 到面1A BM 的距离,最后完成求解.【详解】连接1B A 交1A B 于N ,连接11,,,,MB MN MB MA MA ,如图所示:因为11A ABB 为正方形,所以11B A A B ⊥, 又因为2211111514MB MC C B =+=+=221514MA MC CA =+=+= 所以1MB MA =且N 为1AB 中点,则MN 为等腰三角形1AMB 的中垂线,∴1⊥MN AB 且1MN A B N =,∴1AB ⊥平面1A BM ,∴1B N 就是点1B 到截面1A BM 的距离, 又因为1111211222B N AB ==+=,所以点1B 到截面1A BM 的距离为22, 故选:B.【点睛】方法点睛:求解平面外一点A 到平面α的距离的方法:(1)几何方法:通过线面垂直的证明,找到A 在平面α内的投影点A ',则AA '即为A 到平面α的距离;(2)向量方法:①建立合适空间直角坐标系,在平面α内取一点B ;②求解出AB 和平面α的法向量n ;③根据AB nd n ⋅=即可求解出点A 到平面α的距离.8.C解析:C【分析】首先通过延长直线,DC AB ,交于点G ,平面BAE 变为GAE ,连结PG ,EG 交于点F ,再根据三角形中线的性质,求PF FC的值. 【详解】 延长,DC AB ,交于点G ,连结PG ,EG 交PC 于点F ,//AD BC ,且2AD BC =,可得点,B C 分别是,AG DG 的中点, 又点E 是PD 的中点,PC ∴和GE 是△PGD 的中线,∴点F 是重心,得2PF FC=故选:C【点睛】关键点点睛:本题的关键是找到PC 与平面BAE 的交点,即将平面BAE 转化为平面GAE 是关键.9.A解析:A【分析】首先由三视图还原几何体,然后由几何体的空间结构特征求解三棱锥的体积即可.【详解】由三视图可知,在棱长为2的正方体中,其对应的几何体为棱锥P ABC -,该棱锥的体积:11142223323V Sh ⎛⎫==⨯⨯⨯⨯= ⎪⎝⎭.【点睛】方法点睛:(1)求解以三视图为载体的空间几何体的体积的关键是由三视图确定直观图的形状以及直观图中线面的位置关系和数量关系,利用相应体积公式求解;(2)若所给几何体的体积不能直接利用公式得出,则常用等积法、分割法、补形法等方法进行求解. 10.C解析:C【分析】将三棱锥111A AB D -、三棱锥11A BC D -分离出来单独分析,根据线段长度以及线线关系证明1A 的射影点分别是11AB D 和1BC D 的哪一种心.【详解】三棱锥111A AB D -如下图所示:记1A 在面11AB D 上的射影点为O ,连接11,,AO B O D O ,因为11111AA A D A B ==,又1A O ⊥平面11AB D , 所以2222221111111111,,AA AO AO A D AO OD A B AO OB =+=+=+, 所以11AO OB OD ==,所以O 为11AB D 的外心;三棱锥11A BC D -如下图所示:记1A 在面1BC D 上的射影点为1O ,连接1111,,BO C O DO ,因为11//BC AD ,且四边形11ADD A 是菱形,所以11AD A D ⊥,所以11BC A D ⊥, 又因为11A O ⊥平面1BC D ,所以1111111,AO BC AO A D A ⊥=,所以1BC ⊥平面11AO D ,又因为1DO ⊂平面11AO D ,所以11DO BC ⊥,同理可知:1111,BO DC C O DB ⊥⊥,所以1O 为1BC D 的垂心,【点睛】关键点点睛:解答本题的关键是通过1A 的射影点去证明线段长度的关系、线段位置的关系,借助线面垂直的定义和判定定理去分析解答问题.11.A解析:A【分析】 根据已知条件结合球的体积公式3432d π⎛⎫ ⎪⎝⎭求解出π的值,然后根据球的表面积公式242d π⎛⎫ ⎪⎝⎭求解出S 的表示,即可得到结果. 【详解】d =,所以33941632d d V π⎛⎫== ⎪⎝⎭,所以278π=, 所以2222727442848d d S d π⎛⎫==⨯⨯= ⎪⎝⎭, 故选:A.【点睛】关键点点睛:解答本题的关键是根据球的体积公式得到π的表示,再将π带入到球的表面积公式即可完成求解. 12.C解析:C【分析】小虫有两种爬法,一种是从点A 沿着侧面ACGF 和上底面BHFG 爬行,另一种是从点A 沿着侧面ACGF 和侧面BDCG 爬行,将两种情况下的两个面延展为一个面,计算出平面图形的对角线长,比较大小后可得结果.【详解】由于长方体ACDE FGBH -的长、宽、高分别为2、1、1,则小虫从点A 沿着侧面AEHF 和上底面FHBG 爬行,以及小虫从点A 沿着侧面ACGF 和侧面BDCG 爬行,这两条线路的最短路程相等.①若小虫从点A 沿着侧面ACGF 和上底面BHFG 爬行,将侧面ACGF 和上底面BHFG 延展为一个平面,如下图所示:则2AC BC ==,最短路程为2222AB AC BC =+=; ②若小虫从点A 沿着侧面ACGF 和侧面BDCG 爬行,将面ACGF 和侧面BDCG 延展为一个平面,如下图所示:则3AD AC CD =+=,1BD =,最短路程为2210AB AD BD =+.因为2210<,因此,小虫爬行的最短路程为22故选:C.【点睛】方法点睛:(1)计算多面体或旋转体的表面上折线段的最值问题时,一般采用转化的方法进行,即将侧面展开化为平面图形,即“化折为直”或“化曲为直”来解决,要熟练掌握多面体与旋转体的侧面展开图的形状;(2)对于几何体内部折线段长的最值,可采用转化法,转化为两点间的距离,结合勾股定理求解.二、填空题13.【分析】取的中点为可证明为四面体外接球的球心利用等体积可得答案【详解】取的中点为连接因为平面平面平面平面平面故平面因为平面故因为故故又故平面因为平面故而为的中点故又所以故为四面体外接球的球心设球心到 解析:12【分析】取BC 的中点为M ,可证明M 为四面体A BCD '-外接球的球心,利用等体积可得答案.【详解】取BC 的中点为M ,连接,A M DM ',因为平面A BD '⊥平面BCD ,BD CD ⊥,平面A BD '平面BCD BD =, CD ⊂平面BCD ,故CD ⊥平面A BD ',因为BA '⊂平面A BD ',故CD BA '⊥,因为1A B A D ''==,2BD =222BD A B A D ''=+,故''⊥BA A D ,又A D DC D '⋂=,故'⊥BA 平面ACD ',因为A C '⊂平面ACD ',故A D A C ''⊥,而M 为BC 的中点,故MA MB MC '==,又BD DC ⊥,所以MD MB =,故M 为四面体A BCD '-外接球的球心.设球心M 到平面ACD '的距离为h ,因为2B A CD M A CD V V ''--=,所以11233A CD A CD SA B S h '''=⨯,即12h =. 故答案为:12. 【点睛】 本题考查四面体的外接球,此类问题一般是先确定球心的位置,再把球的半径放置在可解的平面图形中处理,如果球心的位置不易确定,则可以通过补体的方法来处理. 14.【分析】由已知得出正二十面体的外接球即为上方正五棱锥的外接球设正五边形的外接圆半径为由平面几何知识可求得外接球的半径【详解】由图正二十面体的外接球即为上方正五棱锥的外接球设其半径为正五边形的外接圆半 1811 【分析】由已知得出正二十面体的外接球即为上方正五棱锥的外接球,设正五边形的外接圆半径为r ,由平面几何知识可求得外接球的半径.【详解】 由图,正二十面体的外接球即为上方正五棱锥的外接球,设其半径为R ,正五边形的外接圆半径为r ,则33sin 365r ==,得=5r ,所以正五棱362511-=,所以()222511R R =+-,解得181111R =. 故答案为:1811. 【点睛】 关键点点睛:本题考查几何体的外接球的问题,关键在于确定外接球的球心和半径. 15.【分析】将三棱锥补成长方体计算出三棱锥的外接球半径计算出球心到过点的截面的距离的最大值可求得截面圆半径的最小值利用圆的面积可求得结果【详解】平面将三棱锥补成长方体则三棱锥的外接球直径为所以设球心为点 解析:π【分析】将三棱锥P ABC -补成长方体ABCD PEFN -,计算出三棱锥P ABC -的外接球半径R ,计算出球心到过点M 的截面的距离d 的最大值,可求得截面圆半径的最小值,利用圆的面积可求得结果.【详解】PA ⊥平面ABC ,AB BC ⊥,将三棱锥P ABC -补成长方体ABCD PEFN -,则三棱锥P ABC -的外接球直径为22222223R PC PA AB AD PA AC ==++=+=,所以,3R =设球心为点O ,则O 为PC 的中点,连接OM , O 、M 分别为PC 、BC 的中点,则//OM PB ,且2211222OM PB PA AB ==+= 设过点M 的平面为α,设球心O 到平面α的距离为d . ①当OM α⊥时,2d OM ==②当OM 不与平面α垂直时,2d OM <=.综上,2d OM ≤.设过点M 的平面截三棱锥P ABC -的外接球所得截面圆的半径为r ,则221r R d =-≥,因此,所求截面圆的面积的最小值为2r ππ=.故答案为:π.【点睛】方法点睛:求空间多面体的外接球半径的常用方法:①补形法:侧面为直角三角形,或正四面体,或对棱二面角均相等的模型,可以还原到正方体或长方体中去求解;②利用球的性质:几何体中在不同面均对直角的棱必然是球大圆直径,也即球的直径; ③定义法:到各个顶点距离均相等的点为外接球的球心,借助有特殊性底面的外接圆圆心,找其垂线,则球心一定在垂线上,再根据带其他顶点距离也是半径,列关系求解即可. 16.【分析】分别取棱的中点连接易证平面平面由题意知点必在线段上由此可判断在或处时最长位于线段中点处时最短通过解直角三角形即可求得【详解】如下图所示连分别为所在棱的中点则又平面平面平面四边形为平行四边形又 解析:[32,25]【分析】分别取棱1BB 、11B C 的中点M 、N ,连接MN ,易证平面1//A MN 平面AEF ,由题意知点P 必在线段MN 上,由此可判断P 在M 或N 处时1A P 最长,位于线段MN 中点处时最短,通过解直角三角形即可求得.【详解】如下图所示,连MN ,EF ,1A D ,EMM ,N ,E ,F 分别为所在棱的中点,则1//MN A D ,1//EF A D ,//EF MN ∴,又MN ⊂平面1C EF ,EF ⊂平面1C EF ,//MN ∴平面1C EF .11//,C C EM C C EM =,∴四边形1C CME 为平行四边形,1//C E CM ,又CM ⊄平面1C EF ,1C E ⊂平面1C EF ,//CM ∴平面1C EF ,又NM CM M =,∴平面//NMC 平面1C EF . P 是侧面四边形ADD 1A 1内一动点,且C 1P ∥平面CMN ,∴点P 必在线段EF 上.在Rt △11C D E 中,1C E ===同理,在Rt △11C D F 中,可得1C F =, ∴△1C EF 为等腰三角形.当点P 为EF 中点O 时,1C P EF ⊥,此时1C P 最短;点P 位于,E F 处时,1C P 最长.1C O C ===11C E C F ==∴线段1C P 长度的取值范围是.故答案为:【点睛】本题考查点、线、面间的距离问题,考查学生的运算能力及推理转化能力,属中档题,解决本题的关键是通过构造平行平面寻找P 点位置.17.【分析】求出正三棱柱的高底面三角形的边长和高即可求出正三棱柱的体积【详解】设球的半径为r 由得则球的半径为2正三棱柱的高为正三棱柱底面正三角形的内切圆的半径是2所以正三角形的边长是高是6正三棱柱的体积解析:【分析】求出正三棱柱的高、底面三角形的边长和高,即可求出正三棱柱的体积.【详解】设球的半径为r ,由2416r π=π,得2r ,则球的半径为2,正三棱柱的高为24r =,正三棱柱底面正三角形的内切圆的半径是2,所以正三角形的边长是6,正三棱柱的体积为1642⨯⨯=故答案为:【点睛】本题考查正三棱柱的内切球、正三棱柱的体积,考查空间想象能力与计算能力. 18.①③【分析】由公理1判断①正确;由公理2判断②错误③正确用反证法可得④错误【详解】∵连接∵是的中点∴平面与平面有公共点与则平面平面对于①平面则平面又平面则即三点共线故①正确;对于②在平面内由①知∴平解析:①③【分析】由公理1判断①正确;由公理2判断②错误③正确,用反证法可得④错误.【详解】∵连接11A C ,∵O 是11B D 的中点,∴11O A C ∈.平面11AB D 与平面11AAC C 有公共点A 与O ,则平面11AAC C 平面11AB D AO =.对于①,1M PA ∈,1PA ⊂平面11AAC C ,则M ∈平面11AAC C ,又M ∈平面11AB D ,则M AO ∈,即A ,M ,O 三点共线,故①正确;对于②,A ,O ,1A 在平面11AAC C 内,由①知M AO ∈,∴O ∈平面11AAC C , 即A ,M ,O ,1A 共面,故②错误;对于③,A ,O ,C 在平面11AAC C 内,由①知M AO ∈,∴O ∈平面11AA C CA , 则A ,M ,C ,O 共面11AAC C ,故③正确;对于④,连接BD ,则B ,1B ,O 都在平面11BB D D 上,若M ∈平面11BB D D ,则直线OM ⊂平面11BB D D ,∴A ∈面11BB D D ,显然A ∉面11BB D D 的,故④错误.∴正确命题的序号是①③.故答案为:①③.【点睛】本题考查命题的真假判断与应用,考查空间中的直线与平面、平面与平面的位置关系,考查空间想象能力与思维能力,是中档题.19.【分析】根据四面体是球的内接四面体结合位置关系可得棱锥的形状以及棱长之间的关系利用体积公式即可代值计算【详解】设该球的半径为R 则AB =2R2ACAB2R ∴ACR 由于AB 是球的直径所以△ABC 在大圆所 解析:3π【分析】根据四面体是球的内接四面体,结合位置关系,可得棱锥的形状,以及棱长之间的关系,利用体积公式即可代值计算.【详解】设该球的半径为R ,则AB =2R ,2AC ==2R ,∴AC =,由于AB 是球的直径,所以△ABC 在大圆所在平面内且有AC ⊥BC ,在Rt △ABC 中,由勾股定理,得:BC 2=AB 2﹣AC 2=R 2,所以R t △ABC 面积S 12=⨯BC ×AC =2, 又PO ⊥平面ABC ,且PO =R ,四面体P ﹣ABC 的体积为32, ∴V P ﹣ABC 13=⨯R R 232=3=9,R 3=所以:球的体积V 43=⨯πR 343=⨯=.故答案为:.【点睛】本题考查三棱锥外接球体积的计算,属基础题;本题的重点是要根据球心的位置去推导四面体的几何形态,从而解决问题.20.【分析】先在等边三角形中求出外接圆半径从而可求该三棱锥的外接球的半径【详解】详解:因为所以为等边三角形所以等边外接圆的半径为如图三棱锥外接球球心为半径为设球心到平面的距离为外接圆圆心为连接则平面取中【分析】先在等边三角形ABC中求出BC =,外接圆半径2r,从而可求该三棱锥的外接球的半径.【详解】详解:因为060AB AC BAC ==∠=,所以ABC 为等边三角形,所以BC =ABC 外接圆的半径为23r ,如图,三棱锥P ABC -外接球球心为O ,半径为R ,设球心O 到平面ABC 的距离为d ,ABC 外接圆圆心为'O ,连接,','AO AO OO ,则'OO ⊥平面ABC ,取PA 中点,D OP OA =,所以OD PA ⊥,又PA ⊥平面ABC ,所以//PA OO ',则四边形'ADOO 是矩形,所以在PDO △和'OAO △中,由勾股定理可得()222222222R d R d ⎧=+⎪⎨=+-⎪⎩,解得:1,d R ==.故答案为:5.【点睛】本题主要考查了三棱锥外接球的表面积,其中根据几何体的结构特征和球的性质,求得三棱锥的外接球的半径是解答的关键,着重考查了空间想象能力,以及推理与运算能力.三、解答题21.(1)证明见解析;(26 【分析】(1)取PB 中点M ,连接,MF AM ,证出四边形AMFE 为平行四边形,利用线面平行的判定定理即可证明.(2)连接,PE BE ,可得PEB ∠为二面角P AD B --的平面角,求出22PE =,再利用余弦定理可得PB ,再利用面面垂直的判定定理证明平面PBE ⊥平面PDA ,点B 作BO PE ⊥交PE 于点O ,在PEB △中即可求解.【详解】解:(1)证明:取PB 中点M ,连接,MF AM ,由F 为PC 中点,则//MF BC 且12MF BC =. 由已知有//,BC AD BC AD =,又由于E 为AD 中点,从而//,MF AE MF AE =,故四边形AMFE 为平行四边形,所以//EF AM .又AM ⊂平面PAB ,而EF ⊂/平面PAB ,则//EF 平面PAB .(2)证明:连接,PE BE .由,PA PD BA BD ==,而E 为AD 中点,所以,PE AD BE AD ⊥⊥,所以PEB ∠为二面角P AD B --的平面角,60PEB ∴∠=︒. 又2,90,22BA BD DBA AD ==∠=︒∴=. ∴在PAD △中,由10,22PA PD AD ===,可解得22PE =.在Rt ABD △中,由22,AD E =为AD 的中点,可得122BE AD ==. ∴在PEB △中,2222cos PB PE EB PE EB PEB =+-⋅∠,2182222262PB ∴=+-⨯⨯⨯=, 2226,,PB PB EB PE PB EB ∴=∴+=∴⊥.又,,,PE AD BE AD PE BE E AD ⊥⊥⋂=∴⊥平面PBE ,AD ⊂平面PAD ,∴平面PBE ⊥平面PDA .过点B 作BO PE ⊥交PE 于点,O OB ∴⊥平面PDA .∴在PEB △中,OB PE PB EB ⋅=⋅,从而626222PB EB OB PE ⋅⨯===. ∴点B 到平面PAD 的距离为62.【点睛】关键点点睛:本题考查了面面垂直的判定定理,求点到面的距离,解题的关键是求出6PB =,证出平面PBE ⊥平面PDA ,作出点到面的距离,考查了计算能力.22.(1)证明见解析;(2)24 【分析】(1)取PB 边的中点E ,即可证明四边形AEFD 为平行四边形,再根据线面平行的判定定理即可证明;(2)取BC 边的中点G ,由//DG AB ,即可得到直线AB 与平面PDC 所成角即为DG 与平面PDC 所成角,再由等体积法求得22G PCD d -=,即可求得直线AB 与平面PDC 所成角的正弦值.【详解】解:(1)如图所示:取PB 边的中点E ,连,AE FE ,则三角形中位线可知://EF BC 且12EF BC =, 由题可知://AD BC 且12AD BC =, //AD EF ∴且AD EF =,即四边形AEFD 为平行四边形,//DF AE ∴又DF ⊄平面,PAB AE ⊂平面PAB ,故//DF 平面PAB ;(2)取BC 边的中点G ,则//DG AB ,且2DG AB ==,直线AB 与平面PDC 所成角即为DG 与平面PDC 所成角,又1CDG S =,且易得DC PD =,所以11223622CDP S PC DF =⋅=⨯=由等体积法,1113633P CDG G PCD G PCD V V d ---==⨯=,得22G PCD d -=, DG ∴与平面PDC 所成角的正弦值为2222= 故直线AB 与平面PDC 所成角的正弦值为24. 【点睛】关键点点睛:本题解题的关键是利用等体积法求出G 点到平面PCD 的距离.23.(1)证明见解析;(2)82. 【分析】 (1)连接AC 交BD 于点O ,连接EO ,利用三角形中位线定理可得//EO PC ,再由线面平行的判定定理可得结论;(2)先证明PO ⊥面ABCD ,由E 是PA 的中点,可得E 到面ABCD 的距离12PO =,再利用棱锥的体积公式可得答案.【详解】(1)连接AC 交BD 于点O ,连接EO .四边形ABCD 为正方形,所以O 为AC 中点,又E 为PA 中点, //EO PC ∴,又EO ⊂面EBD ,PC ⊄面EBD ,//PC ∴面EBD .(2)正四棱锥P ABCD -中,PA PC =,O 是AC 的中点PO AC ∴⊥,PD PB =,O 是BD 的中点PO BD ∴⊥,又AC 与BD 在平面ABCD 内相交,所以PO ⊥面ABCDE 是PA 的中点,E ∴到面ABCD 的距离12PO =, 221822,2ABD S AB AD PO PD DO ∆=⋅⋅==-= 18232E ABD ABD PO V S -∆=⋅⋅= 【点睛】方法点睛:证明线面平行的常用方法:①利用线面平行的判定定理,使用这个定理的关键是设法在平面内找到一条与已知直线平行的直线,可利用几何体的特征,合理利用中位线定理、线面平行的性质或者构造平行四边形、寻找比例式证明两直线平行.②利用面面平行的性质,即两平面平行,在其中一平面内的直线平行于另一平面.24.(1)证明见解析;(2)23. 【分析】 (1)连接BD 交AC 于点O ,由中位线定理得//OM PB ,从而得证线面平行; (2)由M 是PD 中点,得12M ACD P ACD V V --=,求出三棱锥P ACD -的体积后可得. 【详解】(1)如图,连接BD 交AC 于点O ,连接OM ,则O 是BD 中点,又M 是PD 中点, ∴//OM PB ,又PB ⊄平面ACM ,OM ⊂平面ACM ,所以//PB 平面ACM ;(2)由已知12222ACD S =⨯⨯=,11422333P ACD ACD V S PA -=⋅=⨯⨯=△, 又M 是PD 中点,所以1223M ACD P ACD V V --==, 所以23P ACM P ACD M ACD V V V ---=-=.【点睛】思路点睛:本题考查证明线面平行,求三棱锥的体积.求三棱锥的体积除掌握体积公式外,还需要注意割补法,不易求体积的三棱锥(或一个不规则的几何体)的体积可通过几个规则的几何体(柱、锥、台等)的体积加减求得.三棱锥的体积还可通过转化顶点,转移底面利用等体积法转化为求其他三棱锥的体积,从而得出结论.25.(1)证明见解析;(2)3π. 【分析】(1)取PB 中点F ,连接,EF FC ,证明EFCO 是平行四边形,得线线平行后可证得线面平行;(2)取AB 中点G ,连接,,OG PG OP ,可证PGO ∠(或其补角)是二面角PAB C 的平面角.然后在PGO △中求解.【详解】(1)取PB 中点F ,连接,EF FC ,。
可汗学院数学题目-41Complexnumbers[1]
![可汗学院数学题目-41Complexnumbers[1]](https://img.taocdn.com/s3/m/4dab8c7f5901020207409cc3.png)
Complex numbers1.(−8+4i)(1−i)Which of the following is equivalent to **plex number shown above?Note: i=√−1A.−12+4iB.−12+12iC.−4+12iD.−4+4iCorrect answer: C Difficulty level: 22.(4+i)2Which of the following is equivalent to **plex number shown above?Note: i=√−1A.15+8iB.15−8iC.17+8iD.17−8iCorrect answer: A Difficulty level: 23.(8−2i)(4−2i)Which of the following is equivalent to **plex number shown above?Note: i=√−1A.28−24iB.28+8iC.36−24iD.36+8iCorrect answer: A Difficulty level: 24.(5+i)(7−3i)Which of the following is equivalent to **plex number shown above?Note: i=√−1A.32+8iB.32−8iC.38+8iD.38−8iCorrect answer: D Difficulty level: 25.i4+4i2+4Which of the following is equivalent to **plex number shown above?Note: i=√−1A.1B.−1C.i+4D.i−4Correct answer: A Difficulty level: 26.(−3−i)(4−2i)Which of the following is equivalent to **plex number shown above?Note: i=√−1A.−14−2iB.−14+2iC.−10−2iD.−10+2iCorrect answer: B Difficulty level: 27.(6+2i)2Which of the following is equivalent to **plex number shown above?Note: i=√−1A.40+4i2B.40+24iC.32+24iD.32+4i2Correct answer: C Difficulty level: 28.(1+i)(1−i)Which of the following is equivalent to **plex number shown above?Note: i=√−1A.2-2iB.2iC.0D.2Correct answer: D Difficulty level: 29.i(7−3i)Which of the following is equivalent to **plex number shown above?Note: i=√−1A.4iB.10iC.7i−3D.7i+3Correct answer: D Difficulty level: 210.i2−16i+4Which of the following is equivalent to **plex number shown above?Note: i=√−1A.i−4B.i+4C.−i−4D.−i+4Correct answer: A Difficulty level: 211.(3+i)(2−4i)Which of the following is equivalent to **plex number shown above?Note: i=√−1A.2−10iB.2−14iC.10−10iD.10−14iCorrect answer: C Difficulty level: 212.i101Which of the following is equivalent to **plex number shown above?Note: i=√−1A.1B.−1C.iD.−iCorrect answer: C Difficulty level: 213.(5−i)2Which of the following is equivalent to **plex number shown above?Note: i=√−1A.24−10iB.24+10iC.26−10iD.26+10iCorrect answer: A Difficulty level: 214.−8(7i−3i2)Which of the following is equivalent to **plex number shown above?Note: i=√−1A.−80iB.−56i−24C.−56+24iD.−32iCorrect answer: B Difficulty level: 315.32+iWhich of the following is equivalent to **plex number shown above?Note: i=√−1A.2−iB.2+iC.6+3i5D.6+3i5Correct answer: D Difficulty level: 316.(3−i)3Which of the following is equivalent to **plex number shown above?Note: i=√−1A.8−26iB.18−26iC.27−26iD.30−26iCorrect answer: B Difficulty level: 317.(5−7i+i2)+(8i3+12)**plex expression above is equivalent to the expression a+bi for the integer constants a and b.What is the value of a?Note: i=√−1A.16B.17C.18D.19Correct answer: A Difficulty level: 318.(−3+2i)(1−i3)Which of the following is equivalent to **plex number shown above?Note: i=√−1A.−5−iB.−5+5iC.−1−iD.−1+5iCorrect answer: A Difficulty level: 319.i11+i13Which of the following is equivalent to **plex number shown above?Note: i=√−1A.−2iB.2iC.0D.2Correct answer: C Difficulty level: 320.51+3iWhich of the following is equivalent to **plex number shown above?Note: i=√−1A.1+3i2B.1−3i2C.−5(1+3i)8D.−5(1−3i)8Correct answer: B Difficulty level: 321.(10−8i3)−(6+i)Which of the following is equivalent to **plex number shown above?Note: i=√−1A.4−7iB.4+7iC.4+9iD.4−9iCorrect answer: B Difficulty level: 322.11−iWhich of the following is equivalent to **plex number shown above?Note: i=√−1A.2−2iB.2+2iC.1−i2D.1+i2Correct answer: D Difficulty level: 323.21−iWhich of the following is equivalent to **plex number shown above?Note: i=√−1A.1−iB.1+iC.2−iD.2+iCorrect answer: B Difficulty level: 324.8ix=−5What is the value of x in the equation above?Note:i=√−1A.−8i5B.8i5C.−5i8D.5i8Correct answer: D Difficulty level: 325.(2−3i)3Which of the following is equivalent to **plex number shown above?Note: i=√−1A.−46−9iB.−26−9iC.26−9iD.46−9iCorrect answer: A Difficulty level: 326.(12+i)(8−6i)Which of the following is equivalent to **plex number shown above?Note: i=√−1A.−2+5iB.2+2iC.10+5iD.14+2iCorrect answer: C Difficulty level: 327.11−6i −11+6iWhich of the following is equivalent to **plex number shown above? Note: i=√−1A.1237iB.−1237iC.1237D.−1237Correct answer: A Difficulty level: 328.(23+12i)(12−13i)**plex expression above is equivalent to the expression a+bi for the rational constants a and b. What is the value of b?Note: i=√−1A.b=16B.b=−16C.b=496D. b=529Correct answer: D Difficulty level: 329.P(x)=2x2+3x−17If x=8−2i, what is the value of the polynomial P above?Note:i=√−1A.15−2iB.23−6iC.127−70iD.135−62iCorrect answer: C Difficulty level: 330.(6+i2)(2−2i)Which of the following is equivalent to **plex number shown above?Note: i=√−1A.6−8iB.8−8iC.10−8iD.12−8iCorrect answer: B Difficulty level: 331.3i +2i2Which of the following is equivalent to **plex number shown above?Note: i=√−1A.3i+2B.3i−2C.−3i+2D.−3i−2Correct answer: D Difficulty level: 332.21+iWhich of the following is equivalent to **plex number shown above?Note: i=√−1A.−1+iB.−1−iC.1+iD.1−iCorrect answer: D Difficulty level: 433.3i10+i11Which of the following is equivalent to **plex number shown above?Note: i=√−1A.3+iB.−3+iC.3−iD.−3−iCorrect answer: D Difficulty level: 434.P(n)=n2−5n−7What is the value of P(−3i)?Note:i=√−1A.−4+15iB.−7+12iC.−7+24iD.−16+15iCorrect answer: D Difficulty level: 435.√3t2+5t+√27=0Which of the following is a solution to the equation above?Note:i=√−1A.t=−4√11i6B.t=−3√33i6C.t=−5+√11i6D.t=−5√3+√33i6Correct answer: D Difficulty level: 436.29=3(x+7)2+41Which of the following is a solution to the equation above?Note:i=√−1A.x=−7+2iB.x=−42−12iC.x=−76+√4436iD.x=−7−√1233iCorrect answer: A Difficulty level: 437.(8−2i)2(8+2i)Which of the following is equivalent to **plex number shown above?Note: i=√−1A.60B.68C.480−120iD.544−136iCorrect answer: D Difficulty level: 438.√54i41√27i101Which of the following is equivalent to **plex number shown above?Note: i=√−1A.−√2iB.−√2C.√2D.√2iCorrect answer: C Difficulty level: 439.22−i −22+iWhich of the following is equivalent to **plex number shown above? Note: i=√−1A.4i5B.−4i5C.2i3D.−2i3Correct answer: A Difficulty level: 440.1+2i1−2i ÷1−2i1+2iWhich of the following is equivalent to **plex number shown above? Note: i=√−1A.1B.−1C.−725+2425iD.−725−2425iCorrect answer: D Difficulty level: 441.i3+i2Which of the following is equivalent to **plex number shown above?Note: i=√−1A.−1B.−2C.−1+iD.−1−iCorrect answer: D Difficulty level: 442.m2+6m+10=0Which of the following are solutions to the equation above?I. -3+iII. -3-iIII. 3+iNote:i=√−1A.I onlyB.I and II onlyC.I and III onlyD.I, II, and IIICorrect answer: B Difficulty level: 443.704i1776Which of the following is equivalent to **plex number shown above?Note: i=√−1A.704B.−704C.704iD.−704iCorrect answer: A Difficulty level: 444.12+5i −4+3i3−iWhich of the following is equivalent to **plex number shown above?Note: i=√−1A.10+26i(2+5i)(3−i)B.10−26i(2+5i)(3−i)C.10+27i(2+5i)(3−i)D.10−27i(2+5i)(3−i)Correct answer: D Difficulty level: 445.5+7i6−3iWhich of the following is equivalent to **plex number shown above?Note: i=√−1A.9+57i45B.9+57i3C.51+57i45D.51+57i3Correct answer: A Difficulty level: 446.9+7i184−i**plex expression above is equivalent to the expression a+bi for the rational constants a and b.What is the value of b?Note: i=√−1A.b=215B.b=217C.b=−1D.b=−7Correct answer: B Difficulty level: 447.5−i+(11−i)z=40+18iWhat is the value of z in the equation above?Note:i=√−1A.z=−19+24iB.z=24+20iC.z=3+2iD.z=3.2+145iCorrect answer: C Difficulty level: 448.2i+4ℎ−14=2iℎWhat is the value of h in the equation above?Note:i=√−1A.ℎ=3+iB.ℎ=72C.ℎ=7−iD.ℎ=83Correct answer: A Difficulty level: 4。
“可汗学院”逻辑问题带答案

“可汗学院”(Khan Academy)提出的考验智商的谜题。
你可能没听说过“可汗学院”,但“可汗学院”的谜题被苹果采用一定是有其道理的。
可汗学院由孟加拉裔美国人萨尔曼•可汗(Salman Kahan)创立,是一家由谷歌和比尔&梅琳达•盖茨基金会背后支持的教育性非营利组织,主旨在于利用网络影片进行免费授课,目前已经有关于数学、历史、金融、物理、化学、生物、天文学等科目的内容。
幸运的是,这些问题虽然刁钻,但却都有唯一的答案,所以你只要有备而来,还是可以应对自如的,下面是8个苹果面试过程中求职者可能遇到的问题,以及已经被各路聪明的求职者破解的答案。
问题一:“你面前有两扇门,其中一扇门内藏着宝藏,但如果你不小心闯入另一扇门,只能痛苦地慢慢死掉……”这一听就是那种经典的最令人头痛的一类问题,但其实与其他问题相比,这只是个热身。
在这两扇门后面,有两个人,这两个人都知道哪扇门后有宝藏,哪扇门擅闯者死,而这两个人呢,一个人只说真话,一个人只说假话。
谁说真话谁说假话那就要看你有没有智慧自己找出来了,游戏规则是,你只能问这两个人每人一个问题。
那么,你问什么问题问哪个人根据他们的回答,你又该怎么做求职者的最佳答案:1、随便问其中一个人:“如果我问另一个人,他会跟我说哪扇门后是宝藏如果你问的恰好是讲真话的那个人,那他指给你的答案就是那扇通向死亡的门,因为他会诚实地告诉你那个说谎的人会怎么说。
如果你问的是那个只说谎话的,你得到的也是错误的答案,因为另一个人是讲真话的,说谎话的人会告诉你与讲真话的人相反的答案。
所以你只要随便问一个人上述问题,然后选择与他们说的相反的门就行了。
问题二:“你前面站了5个人,他们中间只有一个人讲真话……”这个问题比上个问题难就难在,你只知道他们五个中有一个只讲真话,但其余四个,他们有时候讲真话,有时候讲假话,只有一点可以确定,这四个人将真话和假话有个规律:如果这次讲了真话,下次就会讲假话,如果这次讲假话,下次就讲真话。
2021-2022年高二数学下学期第二次月考试题承智班

2021-2022年高二数学下学期第二次月考试题承智班一、单选题1.已知直线与椭圆交于、两点,与圆交于、两点.若存在,使得,则椭圆的离心率的取值范围是A. B. C. D.2.定义在上的函数满足(其中为的导函数),若,则下列各式成立的是()A. B. C. D.3.设实数,若对任意的,不等式恒成立,则的最大值是()A. B. C. D.4.已知抛物线()与双曲线(,)有相同的焦点,点是两条曲线的一个交点,且轴,则该双曲线经过一、三象限的渐近线的倾斜角所在的区间是()A. B. C. D.5.我国南北朝时间著名数学家祖暅提出了祖暅原理:“幂势既同,则积不容异”.意思是:夹在两平行平面间的两个几何体,被平行于这两个平行平面的任何平面所载,若截得的两个截面面积总相等,则这两个几何体的体积相等.为计算球的体积,构造一个底面半径和高都与球半径相等的圆柱,然后再圆柱内挖去一个以圆柱下底面圆心为顶点,圆柱上底面为底面的圆锥,运用祖暅原理可证明此几何体与半球体积相等(任何一个平面所载的两个截面面积都相等).将椭圆绕轴旋转一周后得一橄榄状的几何体,类比上述方法,运用祖暅原理可求得其体积等于()A. B. C. D.6.已知抛物线,过点的直线与抛物线交于,两点,交轴于点,若,,则实数的取值是()A. B. C. D. 与有关7.若函数有两个极值点,则实数的取值范围是()A. B. C. D.8.在三棱锥中,是边长为2的等边三角形,,,则三棱锥的外接球的表面积为()A. B. C. D.9.己知函数,关于的方程恰好有三个不同的实数解,则的取值范围为()A. B. C. D.10.若函数在区间有一个极大值和一个极小值,则实数的取值范围是()A. B. C. D.11.如图,在中,、分别是、的中点,若(,),且点落在四边形内(含边界),则的取值范围是()A. B. C. D.12.已知,分别是双曲线:(,)的左、右焦点,若上存在一点使得,则的离心率的取值范围是()A. B. C. D.二、填空题13.若直线是曲线的切线,也是曲线的切线,则_____.14.已知是双曲线(,)的右焦点,是双曲线上位于第一象限内的一点,,直线的方程为,则双曲线的离心率为__________.15.已知数列的前项和为,,若数列是公差为2的等差数列,则数列的通项公式为__________.16.已知等比数列的首项是1,公比为3,等差数列的首项是,公差为1,把中的各项按如下规则依次插入到的每相邻两项之间,构成新数列:,,,,,,,,,,…,即在和两项之间依次插入中个项,则__________.(用数字作答)三、解答题17.已知函数.(1)若,求函数的极值点;(2)若,函数有两个极值点,,且,求证: .18.已知抛物线,且,,三点中恰有两点在抛物线上,另一点是抛物线的焦点.(1)求证:、、三点共线;(2)若直线过抛物线的焦点且与抛物线交于、两点,点到轴的距离为,点到轴的距离为,求的最小值.19.已知函数,曲线在点处的切线方程为.(1)求,的值;(2)证明:.CDDDC BBABA11.C12.C13.或14.15.16.17.(1)见解析;(2)见解析(1)的定义域为,,①若,则,所以当时,,所以在上单调递增,所以无极值点.②若,则,由得,.当的值变化时,,的值的变化情况如下:+ 0 - 0 +极大值极小值所以有极大值点,极小值点(2)由(1)及条件可知,且,,即,,所以 ,记,,因为当时,,所以在上单调递减,因为,所以,即.18.(1)见解析;(2)8.(1)由条件,可知,在抛物线上,是抛物线的焦点.所以解得所以,,,所以,,所以,所以、、三点共线.(2)由条件可知,可设,代入,得,,解得.设,,则,所以,当且仅当,即或时,19.(1)(2)见解析(1)解:由已知得,因为,所以.(2)证明:由(1)知,所以.设,,要证,即要证在恒成立.因为,所以在上为增函数,在上为减函数,所以.①又,所以在上为减函数,在上为增函数,所以.②由于不等式①,②不能同时取等号,故,所以,成立. 32251 7DFB 緻36101 8D05 贅|28595 6FB3 澳 | 33422 828E 芎28679 7007 瀇40204 9D0C 鴌"32698 7FBA 羺);p。
专题211平面-试题君之K三关高一数学人教版(必修2)含答案.doc

第二章点、直线、平面之间的位置2.1空间点、直线、平面之间的位置关系2.1.1平面整知识一、平面1.平面的概念生活中的一些物体通常呈平面形,课桌面、黑板面、海面都给我们以平面的形象.几何里所说的“平面〃(plane)就是从这样的一些物体中抽象出来的.但是,几何里的平血是的,一个平面可以将空间分成_______________ 部分.2.平面的画法在立体几何中,我们通常用__________ 來表示平面.(1)当平面水平放置时,如图(1),平行四边形的锐角通常画成_____________ 目.横边长等于其邻边长的___________ 倍;当平面竖直放置时,如图(2),平行四边形的一组对边通常画成铅垂线.(2)如果一个平面被另一个平面遮挡住,为了增强它的立体感,我们常把被遮挡部分用虚线画出來,也可以不画.如图(2)表示平面0在平面Q的上面,图(2)表示平面Q在平面0的前面.(1) (2)3.平面的表示为了表示平面,我们常把希腊字母6,卩等写在代表平面的平行四边形的一个角上,如平面8平面6;也可以用代表平面的平行四边形的四个顶点表示,还可以用代表平面的平行四边形的_____________ 的大写英文字母表示.如图中的平面可以表示为:平面Q、平面ABCD、平面AC或平面BD.4.点、直线、平面之间位置关系的符号表示点、直线、平面的位置关系通常借助__________________ 中的符号语言来表示,_______ 为元素,直线、平面都是点构成的____________ .集合中很多符号的规定都源于将图形视为点集.点与直线(平面)之间的位置关系用符号"纟〃表示,直线与平面之间的位置关系用符号〃U〃,“0〃表示等.点、直线、平面之间位置关系的符号表示如下:点P在直线a上,记作P ______________ a;点Q不在直线。
上,记作Q/ a;点力在平面a内,记作AWa;点3不在平面a内,记作B ____________ a;直线a在平面a内,记作a ____________ a;直线/不在平面a内,记作/Qa;直线a与b相交于点记作a(^b=Ai平面a, 6相交于直线/,记作an6=/.二、平面的基本性质1.三个公理(1)___________________ 公理1:如果一条直线上的在一个平面内,那么这条直线在此平面内.符号表示:/, BW I,且AE «, BHug如图所示:作用:①判断直线是否在平面内,点是否在平而内;②用直线检验平而.(2)公理2:过 ________________ 的三点,有且只有一个平面.符号表示:力,B, C 三点不共线=>有且只有一个平面匕,使Ae a, Be. a, CG a.如图所示:作用:①确定一个平面;②判断两个平面重合;③证明点、线共面.(3)公理3:如果两个不重合的平面有 ________ 公共点,那么它们有且只有一条过该点的 ___________ .符号表示:Pea,且且PWI.如图所示:作用:①判断两个平面相交;②证明点共线;③证明线共点.越"产龜・°。
2024-2025学年高二上学期期中模拟考试数学试题(空间向量与立体几何 直线与圆 圆锥曲线)含解析

2024-2025学年高二数学上学期期中模拟卷(考试时间:120分钟试卷满分:150分)注意事项:1.答卷前,考生务必将自己的姓名、准考证号等填写在答题卡和试卷指定位置上。
2.回答选择题时,选出每小题答案后,用铅笔把答题卡上对应题目的答案标号涂黑。
如需改动,用橡皮擦干净后,再选涂其他答案标号。
回答非选择题时,将答案写在答题卡上。
写在本试卷上无效。
3.考试结束后,将本试卷和答题卡一并交回。
4.测试范围:人教A 版2019选择性必修第一册全册(空间向量与立体几何+直线与圆+圆锥曲线)。
5.难度系数:0.60。
第一部分(选择题共58分)一、选择题:本题共8小题,每小题5分,共40分.在每小题给出的四个选项中,只有一项是符合题目要求的.1310y --=的倾斜角为()A .30oB .135C .60oD .150【答案】A【解析】因为该直线的斜率为3,所以它的倾斜角为30o .故选A.2.在四面体OABC 中,OA a = ,OB b = ,OC c = ,G 为ABC V 的重心,P 在OG 上,且12OP PG = ,则AP =()A .211999a b c-++ B .811999a b c--C .811999a b c-++D .211999a b c--【答案】C【解析】延长BG 交AC 于点D ,则点D 为AC 的中点,因为12OP PG = ,所以13OP OG =,所以()1133AP OP OA OG OA OB BG OA =-=-=+- ,所以()1121233339AP OB BD OA OB OD OB OA =+⨯-=+-- ,所以()121118992999AP OB OA OC OA OB OC OA =+⨯+-=+- ,因为OA a = ,OB b =,OC c = ,所以811999AP a b c =-++ ,故选C.3.“3m =-”是“直线()1:1210l m x y +++=与直线2:310l x my ++=平行”的()A .充要条件B .必要不充分条件C .充分不必要条件D .既不充分也不必要条件【答案】A【解析】当3m =-时,直线11:02l x y --=与21:03l x y -+=平行;当直线()1:1210l m x y +++=与直线2:310l x my ++=平行时,有()1230m m +-⨯=且1210m ⨯-⋅≠,解得3m =-,故“3m =-”是“直线()1:1210l m x y +++=与直线2:310l x my ++=平行”的充要条件.故选A.4.直线:10l x y -+=与圆22:230C x y x +--=交于,A B 两点,则AOB V 的面积为()A 3B .2C .22D .32【答案】B【解析】如图,由圆22:230C x y x +--=配方得,22(1)4x y -+=,知圆心为(1,0)C ,半径为2,过点(1,0)C 作CD AB ⊥于D ,由(1,0)C 到直线:10l x y -+=的距离为2||22CD =,则22||2||22(2)22AB AD ==-=,故AOB V 的面积为11||||222222AB CD ⋅=⨯=.故选B.5.双曲线()2222:10,0x y C a b a b-=>>的一条渐近线为3y x =,则C 的离心率为()A 2B 3C .2D .4【答案】C【解析】由双曲线方程易知C 的渐近线为b y x a =±,所以b a2e ==.故选C.6.已知椭圆E :22221(0)x y a b a b+=>>的右焦点为()3,0F ,过点F 的直线交椭圆E 于,A B 两点,若AB 的中点坐标为(1,1)-,则椭圆E 的方程为()A .221189x y +=B .2212718x y +=C .2213627x y +=D .2214536x y +=【答案】A【解析】不妨设1,1,2,2,所以22112222222211x y a b x y a b ⎧+=⎪⎪⎨⎪+=⎪⎩,两式相减可得2222122122220x x y y a a b b -+-=,整理可得()()2121221212b x x y y x x a y y +-=--+,根据题意可知直线AB 的斜率为()011312--=-,由AB 的中点坐标为(1,1)-可得12122,2x x y y +=+=-;因此()()222121222212122122b x x y y b b x x a y y a a +-=-=-==-+-,可得222a b =,又焦点为()3,0F 可得2229a b c -==,解得229,18b a ==;所以椭圆E 的方程为221189x y +=.故选A.7.已知直线1:50l ax y -+=与直线2:40()l x ay a a +-+=∈R 的交点为P ,则点P 到直线:3l y x =-距离的取值范围是()A.B.C.D.【答案】D【解析】直线1l ,2l 分别过定点(0,5)A ,(4,1)B -,且互相垂直,所以点P 的轨迹是以AB 为直径的圆(不含点()0,1),这个圆的圆心坐标为()2,3-,半径为圆心到直线l距离为d =圆上的点到直线l 距离最大值为(0,1),因此取值范围是.故选D.8.已知抛物线2:2(0)C y px p =>的焦点为F ,点,,(2,2)M N A 在抛物线C 上,0AM AN k k +=,其中1AM k >,则|sin sin |FMN FNM ∠-∠的最大值为()ABCD 【答案】B【解析】点(2,2)A 在抛物线C 上,把点(2,2)A 代入2:2(0)C y px p =>中得2222p =⋅,则1p =,所以抛物线为2:2C y x =,直线()():221AM y k x k -=->,与抛物线方程联立可得,2244ky y k -+-0=,则442M k y k -⋅=,则22M ky k-=,0AM AN k k +=,则AN k k =-,所以用k -替换可得22N k y k+=-,则2222M N M NMN N M M Ny y y y k y y x x --===--212M N y y =-+,则()222122,k k M k k ⎛⎫-- ⎪ ⎪⎝⎭,故()222122,k k N k k ⎛⎫++ ⎪- ⎪⎝⎭,直线22:k MN y k --=()222112k x k ⎡⎤---⎢⎥⎢⎥⎣⎦,即21112y x k =-+-,则点F 到直线MN的距离21)d k ==>,()()222221218M N k k x x kkk -+--=-=,()()()2222224412121M N k k k x x k k k--+=⋅=,()()222222212144M N k k k x x k k k -+++=+,而1111sin sin 1122M N FMN FNM dd FM FN x x ∠-∠=-=-=++()2342321125241624M N M N M N x x k d k k x x x x -=-++++44554k k kkk --=⎝⎭,令45=-t k k,因为1k >,所以451t k k =->,故211sin sin 16168t FMN FNM t t t ∠-∠⋅⋅⋅++当且仅当()161)t t t=>,即4t =时等号成立,故选:B .二、选择题:本题共3小题,每小题6分,共18分.在每小题给出的选项中,有多项符合题目要求.全部选对的得6分,部分选对的得部分分,有选错的得0分.9.如图,在长方体1111ABCD A B C D -中,12,1AB AD AA ===,点M 为线段11B D 上动点(包括端点),则下列结论正确的是()A .当点M 为11B D 中点时,1C M ⊥平面11BBD DB .当点M 为11B D 中点时,直线DM 与直线BC 所角的余弦值为23C .当点M 在线段11BD 上运动时,三棱锥1C BDM -的体积是定值D .点M 到直线1BC 距离的最小值为63【答案】ACD【解析】在长方体1111ABCD A B C D -中,以点D 为原点建立如图所示的空间直角坐标系,则111(0,0,0),(2,2,0),(0,2,0),(0,2,1),(0,0,1),(2,2,1)D B C C D B ,设(,,1),02M t t t ≤≤,对于A ,1t =,(1,1,1)M ,1(1,1,0)MC =- ,1(0,0,1),(2,2,0)DD DB ==,1110,0MC DD MC DB ⋅=⋅=,即111,MC DD MC DB ⊥⊥,而11,,DD DB D DD DB =⊂ 平面11BB D D ,因此1C M ⊥平面11BB D D ,A 正确;对于B ,(1,1,1),(2,0,0)DM BC ==-,1cos ,3||||DM BC MC BC DM BC ⋅〈〉===,B 错误;对于C ,由选项A 知,点1C 到平面11BB D DBDM的面积112BD DD ⋅=因此三棱锥1C BDM -的体积23是定值,C 正确;对于D ,11(2,0,1),(,2,0)BC C M t t =-=-,则点M 到直线1BC的距离d ==53t =时取等号,D 正确.故选ACD10.在平面直角坐标系xOy 中,已知圆221:(1)2C x y -+=的动弦AB,圆2228C :(x a )(y -+=,则下列选项正确的是()A .当圆1C 和圆2C 存在公共点时,则实数a 的取值范围为[3,5]-B .1ABC 的面积最大值为1C .若原点O 始终在动弦AB 上,则OA OB ⋅不是定值D .若动点P 满足四边形OAPB 为矩形,则点P的轨迹长度为【答案】ABD【解析】对于A ,圆221:(1)2C x y -+=的圆心为1,02228C :(x a )(y -+=的圆心为(a,半径为1C 和圆2C存在公共点时,12C C ≤≤2(1)a ≤-≤35a -≤≤,所以实数a 的取值范围为[3,5]-,正确;对于B ,1ABC 的面积为1111sin sin 12ABC S AC B AC B =∠=∠≤ ,当1π2AC B ∠=时,1ABC 的面积有最大值为1,正确;对于C ,当弦AB 垂直x 轴时,()()0,1,0,1A B -,所以()0111OA OB ⋅=+⨯-=-,当弦AB 不垂直x 轴时,设弦AB 所在直线为y kx =,与圆221:(1)2C x y -+=联立得,()221210k x x +--=,设1122()A x y B x y ,,(,),则12211x x k -=+,()()2221212121212211111OA OB x x y y x x k x x k x x k k -⋅=+=+=+=+⨯=-+ ,综上1OA OB ⋅=- ,恒为定值,错误;对于D ,设0,0,OP 中点00,22x y ⎛⎫ ⎪⎝⎭,该点也是AB 中点,且AB OP =,又AB =,所以()220013x y -+=,所以点P 的轨迹为以1,0,正确.故选ABD.11.如图,曲线C 是一条“双纽线”,其C 上的点满足:到点()12,0F -与到点()22,0F 的距离之积为4,则下列结论正确的是()A .点()D 在曲线C 上B .点(),1(0)M x x >在C 上,则1MF =C .点Q 在椭圆22162x y+=上,若12F Q F Q ⊥,则Q C∈D .过2F 作x 轴的垂线交C 于,A B 两点,则2AB <【答案】ACD【解析】对选项A ,因为()()12224DF DF =+=,由定义知D C ∈,故A 正确;对选项B ,点(),1(0)M x x >在C 上,则124MF MF ==,化简得42690x x -+=,所以x =,1MF =B 错误;对选项C ,椭圆22162x y +=上的焦点坐标恰好为()12,0F -与()22,0F ,则12FQ F Q +=12F Q F Q ⊥,所以221216F Q F Q +=,故()()22212121242F Q F Q F Q F Q F Q F Q +-+⋅==,所以Q C ∈,C 正确;对选项D ,设()2,A y ,则2AB y =,因为A C ∈,则14AF y=,又22116AF y =+,所以221616y y=+,化简得4216160y y +-=,故28y =,所以2190y -=<,故y <1,所以2AB <,故D 正确,故选ACD.第二部分(非选择题共92分)三、填空题:本题共3小题,每小题5分,共15分.12.如图,在正三棱柱111ABC A B C -中,1AB =,12AA =,D 为1B B 的中点,则异面直线1A B 与1C D 所成角的余弦值为.【答案】4【解析】以A 为坐标原点,在平面ABC 内作垂直于AC 的直线Ax 为x 轴,AC 为y 轴,1AA 为z 轴,建立空间直角坐标系A xyz -,如图所示:则()10,0,2A,1,02B ⎫⎪⎪⎝⎭,()10,1,2C,1,12D ⎫⎪⎪⎝⎭,所以11,22A B ⎫=-⎪⎪⎝⎭,11,12C D ⎫=--⎪⎪⎝⎭,所以11111152cos ,4A B C D A B C D A B C D⋅<==>,则直线1A B 与1C D 所成角的余弦值为104,故答案为:10413.已知圆C :()()22114x y ++-=,若直线5y kx =+上总存在点P ,使得过点P 的圆C 的两条切线夹角为60o ,则实数k 的取值范围是【答案】0k ≥或815k ≤-.【解析】圆()()22:114C x y ++-=,则圆心为()1,1C -,半径2r =,设两切点为,A B ,则PA PB =,因为60APB ∠=o ,在Rt PAC △中1302APC APB ∠=∠=o ,2AC r ==,所以||4PC =,因此只要直线l 上存在点P ,使得4PC =即可满足题意.圆心(1,1)C -,所以圆心到直线的距离4d =≤,解得0k ≥或815k ≤-.故答案为:0k ≥或815k ≤-.14.已知O 为坐标原点,双曲线2222:1(0,0)x y C a b a b-=>>的左、右焦点分别为12,F F ,点M 在以2F 为圆心、2OF 为半径的圆上,且直线1MF 与圆2F 相切,若直线1MF 与C 的一条渐近线交于点N ,且1F M MN =,则C 的离心率为.【答案】2【解析】不妨设点M 在第一象限,连接2F M ,则212,F M NF F M c ⊥=,故1F M ==,1230MF F ∠=o,设()00,N x y ,因为1F M MN =,所以M 为1NF 的中点,112NF F M ==,故0y =.0sin30,cos302x c c ==⋅-= ,将()2N c 代入b y x a =中,故b a2c e a ===.故答案为:2.四、解答题:本题共5小题,共77分.解答应写出文字说明、证明过程或演算步骤.15.(13分)已知(3,1),(1,2),A B ACB -∠的平分线所在的直线的方程为1y x =+.(1)求AB 的中垂线方程;(2)求AC 的直线方程.【解析】(1)AB 的中点坐标为31123,1,222-+⎛⎫⎛⎫= ⎪ ⎪⎝⎭⎝⎭,又211134ABk -==---,-----------------------------2分故AB 的中垂线斜率为4,---------------------------------------------------------------------------------------------4分故AB 的中垂线方程为()3412y x -=-,即8250x y --=;----------------------------------------------------6分(2)由对称性可知,()1,2B -关于1y x =+的对称点(),D s t 在直线AC 上,故21121122t s t s -⎧=-⎪⎪+⎨+-⎪=+⎪⎩,-----9分解得10s t =⎧⎨=⎩,故()1,0D ,-----------------------------------------------------------------------------------------------11分故直线AC 的方程为130113y x --=--,即210x y --=.---------------------------------------------------------13分16.(15分)已知圆C 的方程为:()()22314x y -++=.(1)若直线:0l x y a -+=与圆C 相交于A 、B 两点,且22AB =,求实数a 的值;(2)过点()1,2M 作圆C 的切线,求切线方程.【解析】(1)圆C 的方程为:22(3)(1)4x y -++=,则圆C 的圆心为(3,1)-,半径为2,--------------2分直线:0l x y a -+=与圆C 相交于A 、B两点,且||AB =----------4分解得2a =-或6-;--------------------------------------------------------------------------------------------------------6分(2)当切线的斜率不存在时,直线1x =,与圆C 相切,-------------------------------------------------------8分切线的斜率存在时,可设切线为2(1)y k x -=-,即20kx y k --+=,---------------------------------------9分2,解得512k =-,---------------------------------------------------------13分故切线方程为512290x y +-=,综上所述,切线方程为1x =或512290x y +-=.-------------------------15分17.(15分)如图,在圆锥PO 中,AC 为圆锥底面的直径,B 为底面圆周上一点,点D 在线段BC 上,26AC AB ==,2CD DB =.(1)证明:AD ⊥平面BOP ;(2)若圆锥PO 的侧面积为18π,求二面角O BP A --的余弦值.【解析】(1)PO ⊥ 平面,ABC BA BC ⊥,故以B 为坐标原点,BA 为x 轴正方向,BC 为y 轴正方向,与OP同向的方向为z 轴正方向建立空间直角坐标系.设OP x =,故()()0,0,0,3,0,0B A,()33,,,22O P x D ⎛⎫⎛⎫ ⎪ ⎪ ⎪ ⎪⎝⎭⎝⎭,-----------------------------------------------------------2分()AD =-,33,,0,,,2222BO BP x ⎛⎫⎛⎫== ⎪ ⎪ ⎪ ⎪⎝⎭⎝⎭.33333330,302222AD BO AD BP ⋅=-⨯⨯=⋅=-⨯⨯= .-------------------------------5分故,AD BO AD BP ⊥⊥,,,BP BO B BP BO ⋂=⊂ 平面BOP ,AD ∴⊥平面BOP .---------7分(2) 圆锥PO 的侧面积3π18π,6S PA PA =⨯=∴=,OP x ∴===由(1)可知,()AD =-为平面BOP 的法向量,---------------------------------------------------------8分设平面ABP 的法向量为(),,m a b c =,而()3,0,0BA =,3,22BP ⎛⎫= ⎪ ⎪⎝⎭,故303022m BA a m BP a b ⎧⋅==⎪⎨⋅=++=⎪⎩,令1c =-得()0,2,1m =- ,-----------------------------------------------12分则5cos<,5m AD m AD m AD-⨯+⨯-⋅====⋅>,所以二面角O BP A --分18.(17分)已知双曲线C 和椭圆2214x y +=有公共焦点,且离心率e =.(1)求双曲线C 的方程;(2)过点()2,1P 作两条相互垂直的直线,PM PN 分别交双曲线C 于不同于点P 的M N 、两点,求点P 到直线MN 距离的最大值.【解析】(1)因为椭圆2214x y +=的焦点在x 轴上,所以双曲线C的c ==,又因为c e a ==,所以1a b =,所以双曲线C 的方程为2212x y -=.---------------------------------------5分(2)当直线MN 的斜率不存在时,设()()000,0M x y y >,则()00,N x y -,()()00002,1,2,1PM x y PN x y =--=---,依题意()()00002,12,10PM PN x y x y ⋅=--⋅---= ,()()2200210x y ---=,即22000450x x y --+=,由2200022004512x x y x y ⎧--+=⎪⎨-=⎪⎩解得006x y =⎧⎪⎨=⎪⎩0021x y =⎧⎨=⎩(舍去),所以((,6,M N ,此时P 到直线MN 的距离为624-=.------------------------------------------------------------------------------8分当直线MN 的斜率存在时,设()()1122,,,M x y N x y ,设直线MN 的方程为y kx m =+.由2212y kx m x y =+⎧⎪⎨-=⎪⎩消去y 并化简得:()222214220k x kmx m -+++=,()()22222222Δ164212216880,210k m k m k m m k =--+=-++>-+>①,2121222422,2121km m x x x x k k -++==--,------------------------------------------------------------------------------10分依题意()()11222,12,10PM PN x y x y ⋅=----=,所以()()()()()()()()1212121222112211x x y y x x kx m kx m --+--=--++-+-()()()2212121225k x x km k x x m m =++--++-+()()22222224122502121m km k km k m m k k +-=+⋅+--⋅+-+=--,整理得22812230m km k m +++-=,即()()21630m k m k +-++=,由于P ∉直线MN ,12k m ≠+,所以630,63m k m k ++==--,函数()2226321343610y k k k k =---+=-+的开口向上,判别式为()2364341012961360640--⨯⨯=-=-<,故①成立.所以直线MN 的方程为63y kx k =--,即630kx y k ---=,------------------------------------------------------------------------------13分所以P 到MN的距离d ==22221221411d k k k k k ++⎛⎫==+ ⎪++⎝⎭,当0k ≤时,22111k k +≤+;当0k >时222111211k k k k +=+≤+=++,当且仅当1,1k k k ==时等号成立.所以22,44d d d ⎛⎫≤≤≤ ⎪⎝⎭综上所述,点P 到直线MN的距离的最大值为分19.(17分)已知F 为椭圆C :()222210+=>>x y a b a b的左焦点,椭圆C过点(P ,且直线PF的斜率为.(1)求椭圆C 的方程;(2)若点()11,M x y ,()22,N x y 在椭圆C 上,且90MFN ∠=︒,过M ,N 分别作椭圆C 的切线1l ,2l ,1l 与2l相交于点Q.(i)求点Q的轨迹方程;(ii)求PQF△周长的最小值.【解析】(1)由题意得,直线PF的方程为()224y x=-,即20x-+=,当0y=时,2x=-,故2c=,由224214a a+=-解得28a=或22a=(舍去),椭圆C的方程22184x y+=.------------------------------------------------------------------------------3分(2)(i)设直线MN:x my t=+,()00,Q x y,1,1,2,2,与C联立()22222228028x my tm y mty tx y=+⎧⇒+++-=⎨+=⎩,所以12222mty ym+=-+,212282ty ym-=+,------------------------------------------------------------------------------5分由90MFN∠=︒可得()()()()()()22121212122201220x x y y m y y m t y y t+++=⇔++++++=()()()()()222221822220m t m t t t m⇔+--++++=;化简可得223840t t m+-=①--------------------7分设1l的方程为()11y y k x x-=-,即()11y kx y kx=+-,与C联立()()()()2222211111128124280x yk x k y kx x y kxy kx y kx⎧+=⎪⇒++-+--=⎨=+-⎪⎩,令()()()22221111Δ1681240k y kx k y kx⎡⎤=--+--=⎣⎦,结合221128x y+=,解得112xky=-,所以切线方程为()11112xy x x yy=--+,即直线1l方程为:11184x x y y+=,k不存在时也满足此直线方程,同理可得2l方程为:22184x x y y +=,由Q 在直线1l ,2l 上,则10102020184184x x y y x x y y ⎧+=⎪⎪⎨⎪+=⎪⎩,即1,1,2,2在直线00184x x y y +=上,所以直线MN 方程为:00184x x y y +=,即00028y x y x x =-+②,由①②可得()20043y x =+,00x =时也满足此方程,所以Q 的轨迹方程为()243y x =+.-------------------------------------------------------------14分(ii )由(i )可知Q 在以()2,0F -为焦点,以4x =-为准线的抛物线上,过,P Q 分别向直线4x =-作垂线,垂足分别为P ',Q ',由抛物线定义可得:6PQ PF QF PQ QQ PF PP PF ++=+++='≥+'当且仅当P ,Q ,Q '共线时取等,所以PQF△周长的最小值为6+分。
吉林省通化市(新版)2024高考数学统编版真题(评估卷)完整试卷

吉林省通化市(新版)2024高考数学统编版真题(评估卷)完整试卷一、单选题:本题共8小题,每小题5分,共40分 (共8题)第(1)题已知函数,,对任意,,总有成立,则正整数m的最大值为()A.4B.3C.2D.1第(2)题给出下列四个命题,其中正确命题为()A.“,”的否定是“,”B.“”是“”的必要不充分条件C.,,使得D.“”是“”的充分不必要条件第(3)题已知实数a,b,c,d满足,,,则()A.B.C.D.第(4)题两个平面与相交但不垂直,直线在平面内,则在平面内()A.一定存在直线与平行,也一定存在直线与垂直;B.一定存在直线与平行,不一定存在直线与垂直;C.不一定存在直线与平行,一定存在直线与垂直;D.不一定存在直线与平行,也不一定存在直线与垂直第(5)题已知向量,满足,,则()A.B.29C.D.13第(6)题已知不等式组表示的平面区域为D,若直线经过区域D,则实数k的最小值为()A.B.C.1D.2第(7)题函数的定义域为,导函数为,若对任意,成立,则称为“导减函数”.下列函数中,是“导减函数”的为()A.B.C.D.第(8)题在《最强大脑》的节目中,作为脑力角逐的考题,阿基米德多面体成为了难倒一众天才的“元凶”,因此“一夜爆红”.“阿基米德多面体”也称半正多面体,是由边数不全相同的正多边形围成的多面体,它体现了数学的对称美.例如足球一般是有12个正五边形和20个正六边形构成的阿基米德多面体.如图是以一正方体的各条棱的中点为顶点的多面体,这是一个有八个面为正三角形,六个面为正方形的“阿基米德多面体”,若该多面体的棱长为1,则经过该多面体的各个顶点的球的表面积为()A.B.C.D.二、多选题:本题共3小题,每小题6分,共18分 (共3题)第(1)题已知函数,若关于的方程有5个不同的实根,则实数可能的取值有()A.B.C.D.第(2)题在正三棱锥中,,则下列结论正确的是()A.异面直线与所成角为B.直线与平面所成角的正弦值为C.二面角的余弦值为D.三棱锥外接球的表面积为第(3)题如图所示的几何体,已知其每个面均为正三角形,则()A.B.C.面面D.、、两两垂直三、填空题:本题共3小题,每小题5分,共15分 (共3题)第(1)题设a>0,b>0,若关于x的方程恰有三个不同的实数解x 1,x2,x3,且x1<x2<x3=b,则a+b的值为______.第(2)题函数取最大值时的值为___________.第(3)题等比数列是递减数列,前n项的积为,若,则________.四、解答题:本题共5小题,每小题15分,最后一题17分,共77分 (共5题)第(1)题在中,分别是角的对边,且,(1)求的值;(2)若,求的面积.第(2)题如图,在四棱锥中,平面平面,,,E为中点,点在上,且.(1)求证:平面;(2)求二面角的余弦值;第(3)题如图,在四棱锥中,平面ABP,平面ABP,,,,平面与平面的交线为.(1)证明:;(2)若为上一点,求直线与平面所成角的正弦值的最大值.第(4)题摩天轮是一种大型转轮状的机械建筑设施,游客坐在摩天轮的座舱里慢慢的往上转,可以从高处俯瞰四周的景色(如图1).某摩天轮的最高点距离地面的高度为90米,最低点距离地面10米,摩天轮上均匀设置了36个座舱(如图2).开启后摩天轮按逆时针方向匀速转动,游客在座舱离地面最近时的位置进入座舱,摩天轮转完一周后在相同的位置离开座舱.摩天轮转一周需要30分钟,当游客甲坐上摩天轮的座舱开始计时.(1)经过t分钟后游客甲距离地面的高度为H米,已知H关于t的函数关系式满足(其中,),求摩天轮转动一周的解析式;(2)游客甲坐上摩天轮后多长时间,首次距离地面的高度恰好为30米?第(5)题已知直线与椭圆相交于A、B两个不同的点,记与轴的交点为C.(1)若,且,求实数的值;(2)若,求面积的最大值,及此时椭圆的方程.。
广东省阳江市2024高三冲刺(高考数学)统编版模拟(巩固卷)完整试卷

广东省阳江市2024高三冲刺(高考数学)统编版模拟(巩固卷)完整试卷一、单选题:本题共8小题,每小题5分,共40分 (共8题)第(1)题已知函数,则( )A .B .3C .D .第(2)题分形几何学是一门以不规则几何形态为研究对象的几何学,它研究的几何对象具有自相似的层次结构,适当的放大或缩小几何尺寸,整个结构不变,具有很多美妙的性质.其中科赫(Koch )曲线是几何中最简单的分形.科赫曲线的产生方式如下:如图,将一条线段三等分后,以中间一段为边作正三角形并去掉原线段生成1级科赫曲线“”,将1级科赫曲线上每一线段重复上述步骤得到2级科赫曲线,同理可得3级科赫曲线,……在分形几何中,若一个图形由个与它的上一级图形相似,且相似比为的部分组成,则称为该图形分形维数.那么科赫曲线的分形维数是( )A .B .C .1D .第(3)题已知椭圆的左、右焦点分别为,,下顶点为,直线交于另一点,的内切圆与相切于点.若,则的离心率为( )A.B .C .D .第(4)题下图为2020年~2023年某国星级酒店数量、营业收入及餐饮收入比重,根据该图,下列结论错误的是( )A .2020年~2023年某国星级酒店数量逐年减少B .2020年~2023年某国星级酒店营业收入最高不超过2000亿元C .2020年~2023年某国星级酒店餐饮收入比重最高的是2021年D .2020年~2023年某国星级酒店餐饮收入比重的极差是1.54%第(5)题已知是定义在R 上的奇函数,的图象关于对称,,则( )A .B .0C .1D .2第(6)题大年初一,爷爷、奶奶、爸爸、妈妈、读高中的姐姐以及刚满周岁的小弟弟一家六口外出游玩,到某处景点时站成一排拍照,小弟弟由其中任意一人抱着,则不同的站法共有( )A .120种B .480种C .600种D .720种第(7)题已知函数,若存在,使得成立,则实数的取值范围是( )A .B .C .D .第(8)题小华忘记了手机开机密码的前三位,只记得第一位和第二位取自0,1,2,3(可以相同) ,第三位是A ,B ,C 中的一个字母,则小华输入一次密码就能够成功解锁的概率为()A.B.C.D.二、多选题:本题共3小题,每小题6分,共18分 (共3题)第(1)题已知函数的初相为,则下列结论正确的是()A .的图象关于直线对称B.函数的一个单调递减区间为C.若把函数的图象向右平移个单位长度得到函数的图象,则为偶函数D .若函数在区间上的值域为第(2)题已知曲线是顶点分别为的双曲线,点(异于)在上,则()A.B.的焦点为C.的渐近线可能互相垂直D.当时,直线的斜率之积为1第(3)题已知函数的最小值为2,则()A.B.C.D.三、填空题:本题共3小题,每小题5分,共15分 (共3题)第(1)题已知抛物线的焦点为,点在上,的中点坐标为,则的方程为______.第(2)题若集合,,则________.第(3)题将参数方程(q为参数)化为普通方程,所得方程是_____;四、解答题:本题共5小题,每小题15分,最后一题17分,共77分 (共5题)第(1)题已知函数(1)设函数,求函数的单调区间;(2)设函数,若函数有两个不同的零点,求实数的取值范围.第(2)题已知函数的图象在处的切线经过点.(1)求的值及函数的单调区间;(2)设,若关于的不等式在区间上恒成立,求正实数的取值范围.第(3)题在中,角所对的边分别为,.(1)求角的值;(2)若,边上的中点为,求的长度.第(4)题如图,在四棱锥中,底面为矩形,平面,点是的中点.(1)证明:;(2)设的中点为,点在棱上(异于点,,且,求直线与平面所成角的正弦值.第(5)题已知函数,.(1)当时,求函数的单调递增区间;(2)若,关于x的方程有三个不等的实根,求a的取值范围.。
- 1、下载文档前请自行甄别文档内容的完整性,平台不提供额外的编辑、内容补充、找答案等附加服务。
- 2、"仅部分预览"的文档,不可在线预览部分如存在完整性等问题,可反馈申请退款(可完整预览的文档不适用该条件!)。
- 3、如文档侵犯您的权益,请联系客服反馈,我们会尽快为您处理(人工客服工作时间:9:00-18:30)。
Center, spread, and shape of distributions1.The number of telephone lines in each country in Central America and the Carribean is shown above in a dot plot. The number of telephone lines in each country has been rounded to the nearest 250 thousand. According to the dot plot, what is the median number of telephone lines (in thousands)?Correct answer: 0 Difficulty level: 2 2.In the dot plot above, the length of the coastline of each country in South America is shown inthousands of kilometers (1000-km), rounded to the nearest thousand kilometers. According to the dot plot, what is the mean length of coastline, in thousands of kilometers?Correct answer: 2 Difficulty level: 23.During a five-day period, Marta served a different number of customers at her flower shop each day. The mean number of daily customers served during this period was 17.In the following month, during the same five-day period, she served 16 customers for four of the days, but on the fifth day, she served 25 customers. What is the difference between the means of the number of customers she served during the two five-day periods?A.**B.**C.**The two means are equal.Correct answer: A Difficulty level: 24.The table above shows the annual average per pupil educational expenditures in the United States from 2008 through 2012. What is the range of the per pupil expenditures?Correct answer: 641 Difficulty level: 25.The box plot above summarizes the resting heart rates, in beats per minute, of the members at a gym. What is the range of resting heart rates?A.16 beats per minuteB.31 beats per minuteC.62 beats per minuteD.70 beats per minuteCorrect answer: C Difficulty level: 26.The box-and-whisker plot above shows the average outdoor temperature of a North American Cityat noon, in degrees Fahrenheit, for each month of the year. What is the range of the temperatures?A.17B.27C.61D.111Correct answer: C Difficulty level: 27.A census was taken in 11 African countries. For each country, the amount of the population that had access to water from the water supply industry **puted and recorded to the nearest 5 percent. This amount was expressed as a percentage of the total population and plotted above. According to the dot plot, what is the range of these percentages?Percentage of population supplied by water supply industryCorrect answer: 70 Difficulty level: 28.The number of employees in each industry in Seattle was recorded and rounded to the nearest 10 thousand. The results are displayed in the dot plot above. According to the dot plot, what is the median number of employees, in thousands?Correct answer: 20 Difficulty level: 29.Data was taken on carpooling in Tallahassee, Florida. For each person's **mute, the number of people in the car was recorded. The results are summarized in the bar graph at left. What is the median number of people in the car?Correct answer: 1 Difficulty level: 2 10.Daily rainfall in centimeters was recorded over a 41-year period in Turramurra. For each year, the day with the most rain in centimeters was plotted above according to its amount of rainfall to the nearest 2 centimeters. According to the dot plot, what is the maximum amount of rainfall that was ever recorded in a single day in Turramurra, in centimeters?Correct answer: 38 Difficulty level: 2 11.The annual natural gas production of the Middle Eastern countries is recorded in the dot plot above. Each value is rounded to the nearest 10 billion cubic meters. According to the dotplot,what is the median annual natural gas production, in billions of cubic meters?Correct answer: 10 Difficulty level: 212.A linguistics library contains several archives of language samples. The table above gives the number of distinct languages referenced in each archive. What is the range of numbers of distinct languages referenced?Correct answer: 255 Difficulty level: 213.On a message board, participants listed words whose letters are all in alphabetical order, such as "almost." The table at left lists the number of words they listed with each letter count. What was the median letter count of the words they listed?Correct answer: 5 Difficulty level: 214.A police officer recorded the travel speeds, in miles per hour, of traffic on a major arterial road. The histogram to the left shows the number of vehicles driving at each speed. Which statement **pares the mean and the median of the data?A.There is no mean value for this data.B.The mean is greater than the median.C.The median is greater than the mean.D.The mean and median are approximately equal.Correct answer: D Difficulty level: 315.In San Jose, the amount of time it took each person to get to work was recorded and rounded up to the nearest 5 minutes. The data collected for men and women are shown in the bar graph to the left. According to the bar graph, which of the **parisons is true?A.The mean travel time for men is greater than the mean travel time for women.B.The mean travel time for women is greater than the mean travel time for men.C.The median travel time for men is greater than the median travel time for women.D.The median travel time for women is greater than the median travel time for men.Correct answer: A Difficulty level: 316.The table at left partially reports the numbers of civil aircraft produced in the United States during the course of 5 months. If there was a mean of 325 civil aircraft produced during that time, how many were produced in month B?Correct answer: 299 Difficulty level: 317.Adult workers in Los Angeles Country were surveyed to see how many vehicles were available in their household. Data was taken separately for males and females in order to compare them.According to the bar graph to the left, which of the following is true?A.The median number of vehicles available to females is greater than the median number ofvehicles available to males.B.The median number of vehicles available to males is greater than the median number ofvehicles available to females.C.The median number of vehicles available to females is equal to the median number ofvehicles available to males.D.There is not enough information to compare the median number of vehicles available tofemales and males.Correct answer: C Difficulty level: 318.For each of the largest 21 **panies in Europe, the average delay of flights was calculated and shown in the dot plot above. If we remove the two airlines with the highest flight delays from the dot plot, which of the following will result?A.The mean will decrease only.B.The mean and range will decrease only.C.The mean and median will decrease only.D.The mean, median, and range will decrease.Correct answer: B Difficulty level: 319.A class tested their reaction times to catch a falling object. The dot plot above gives their results, to the nearest tenth of a second. Which statement **pares the median and the mean for this data?A.The mean is greater than the median.B.The median is greater than the mean.C.The mean and the median are about the same.D.There is not enough information to determine the meanCorrect answer: A Difficulty level: 320.The cost of each house in New Mexico is summarized in the histogram to the left. Houses that are worth more than 1 million dollars are not shown due to space limitations. Above 1 million dollars, the number of houses continues to decrease steadily as the cost increases. What is the range of house costs?A.0B.150 thousandC.1,000 thousandD.There is not enough information to determine the range.Correct answer: D Difficulty level: 321.The age distributions of males and females in Chicago is shown in the bar graph at left. People aged 19 or younger are called "children," people aged 20 to 59 are called "adults," and people aged 60 or older are called "seniors." According to the data shown, which of the following is true?A.The percentage of male children is less than the percentage of female children, but thepercentage of male adults is greater than the percentage of female adults.B.The percentage of male children is greater than the percentage of female children, and thepercentage of male adults is greater than the percentage of female adults.C.The percentage of male children is less than the percentage of female children, but there is notenough information to compare the percentage of male adults to the percentage of female adults.D.The percentage of male children is greater than the percentage of female children, but there isnot enough information to compare the percentage of male adults to the percentage of female adults.Correct answer: B Difficulty level: 322.Students at schools in different states calculated the volume of snow that it took to fill one cup of water after the snow had melted. Their results, in cups, were:3.7, 3.0, 3.9, 2.5, 2.5, 2.2To the nearest tenth of a cup, how much greater was the mean than the median of their calculations?Correct answer: 15⁄ Difficulty level: 323. The table at left partially summarizes the percent of residents in different counties whoparticipate in performing arts at least once a month. The percentages have a range of 12.9%. What could be the percentage of county G residents who participate in performing arts at least once a month?Correct answer: 225⁄ or 885⁄ Difficulty level: 3 24.In a large city, each home was surveyed to see how many rooms it had. The bar graph at left shows the results. If a **pany in the city were to build 22,000 4-room homes, the median number of rooms would decrease by1. Due to a shortage of supplies, the **pany decides to build 22,000 3-room homes instead. These are the only homes being built, so the data is not affected by anything else. By how much will the median number of rooms decrease?Correct answer: 1 Difficulty level: 3 25.Elena mailed 6 packages, with the following shipping charges. $6.15, $4.78. $5.61, $4.41, $4.21, $6.54If she mails a 7th package for $5.61, how will that affect the median shipping charge?A. The median will remain the same.B. The median will increase by $0.05.C. The median will increase by $0.41.D. The median will increase by $0.60.Correct answer: CDifficulty level: 3 26.Both dot plots to the left show the years on which various New Zealand wineries were founded. The first dot plot rounds these values to the nearest 10 years and the second dot plot rounds these values to the nearest 20 years. If we calculate the mean, median, and range based on each of the dot plots and not from the original data used to generate them, which of them will differ from the first dot plot to the second?A.None will differ.B.Mean onlyC.Mean and median onlyD.Mean, median, and rangeCorrect answer: C Difficulty level: 327.For each of the 15 countries in the Middle East, the percentage of the labor force in agriculture was recorded to the nearest 5 percent. This data is shown in the dot plot above. Based on the shape of the data, which of the following **pares the mean and the median?A.The mean is less than the median.B.The mean is greater than the median.C.The mean is equal to the median.D.There is not enough information to compare the mean and the median.Correct answer: B Difficulty level: 3The editors of a newspaper want a proportional number of articles about fine and performing arts to those in the 20 best-selling US newspapers. They calculate that they need 24 such articles per month in their own paper. The dot plot above shows the number of fine and performing arts articles in their paper each month. How many fine and performing arts articles does the newspaper need in the 12th month in order to have a mean of 24 such articles per month?A.22 articlesB.24 articlesC.25 articlesD.29 articlesCorrect answer: D Difficulty level: 329.The box-and-whisker plots at left show data on the heights, in meters, of all waves measured at an ocean beach on two separate days. What is the difference of the median wave height from day 1 and the median wave height from day 2, in meters?Correct answer: 0.4 Difficulty level: 3In New Mexico, the number of bedrooms in each house is recorded and shown in the bar graph to the left. The rightmost **bines all houses with at least 5 bedrooms in it. According to the bar graph, what can we say about the mean number of bedrooms in New Mexico houses?A.The mean is less than 3.B.The mean is greater than 3.C.The mean is equal to 3.D.There is not enough information to compare the mean to 3.Correct answer: D Difficulty level: 331.In San Jose, the time that people left home in the morning was recorded and is shown in the bar graph to the left to the nearest 30 minutes. Times before 5:30 a.m. or after 9:00 a.m. were not included in the data. According to the data shown, which of the **parisons between the male and female population is correct?A.The range of time leaving home for females is greater than the range of time leaving home formales.B.The range of time leaving home for males is greater than the range of time leaving home forfemales.C.The mean time leaving home for females is greater than the mean time leaving home formales.D.The mean time leaving home for males is greater than the mean time leaving home forfemales.Correct answer: C Difficulty level: 332.The students in Juan's math class have the exact same mean height as the students in Juan's English class. However, while the standard deviation of the student heights in his math class is 3.2 inches, the standard deviation of the student heights in his English class is 6.1 inches. Which of the following statements must be true?A.The mean height of the students in Juan's English class is 2.9 inches greater than the meanheight of the students in Juan's math class.B.The median height of the students in Juan's English class is 2.9 inches greater than the medianheight of the students in Juan's math class.C.The heights of the students in Juan's math class are more variable than the heights of thestudents in Juan's English class.D.The heights of the students in Juan's math class are less variable than the heights of thestudents in Juan's English class.Correct answer: D Difficulty level: 333.An environmental biologist recorded the numbers of snail eggs in the first clutch (group) laid at different temperatures, as shown in the histograms to the left. At 22C, the snails laid a mean of 49 eggs. At 25C, they laid a mean of 31 eggs. Which statement **pares the standard deviations of the numbers of eggs?A.Both sets vary too much to have a valid standard deviation.B.The standard deviation is greater when the first clutch is at 22C.C.The standard deviation is greater when the first clutch is at 25C.D.The standard deviations at both temperatures are about the same.Correct answer: B Difficulty level: 334.The number of structures built in each decade in Denver County is shown in the histogram to the left. Data for years before 1940 or after 2009 was not collected. Which of the following statements about the shape of the number of structures built is true?A.It is bell-shaped because most structures were built in the 1950-1959 decade.B.It is bell-shaped because most structures were built in the 1970-1979 decade.C.There is little variance in the shape.D.There is a lot of variance in the shape.Correct answer: D Difficulty level: 335.The box plot above depicts the numbers of law degrees (JD or LL.B), in thousands, conferred each year in the United States over a span of 49 years. No two years had duplicate numbers of degrees conferred. If the next year, there were 46 thousand degrees conferred, how would that affect the range, mean, and median of the numbers?A.Only the range would increase.B.Only the range and mean would increase.C.The range, median, and mean would all increase.D.The range and median would increase. The change in mean is inconclusive.Correct answer: C Difficulty level: 336.The bar graph to the left summarizes the household size of social worker's client families. Whichstatement best describes the relationship between the mean and median household size?A.The mean is greater than the median, because there are 2families with many more than 4family members.B.The median is greater than the mean, because there are more families with more than 4 familymember than with fewer members.C.The mean and the median are equal, because there are more than twice as many families with4 member than with any other number.D.There is not enough information to compare the mean and the median.Correct answer: A Difficulty level: 337.The time in minutes, rounded to the nearest minute, that runners took to finish a 3-mile race is shown in the table to the left. If the mean finish time was 21 minutes, what is the value of r in this table?A. 1B. 2C. 3D. 6Correct answer: B Difficulty level: 438.A student repeatedly tests the solubility of dibutyl phthalate, a chemical used in plastic, in water. The results, in moles of dibutyl phthalate per liter of water are:5.2∙10−5 , 3∙10−5 , and 3.5∙10−5The student calculates the mean and median of the results, then reads on the safety sheet for the chemical that its solubility is 1.4∙10−4 moles per liter of water. How would the mean and median change if the student includes the solubility from the safety sheet in the calculations?A.They will both decrease, but the mean will decrease more.B.They will both decrease, but the median will decrease more.C.They will both increase, but the mean will increase more.D.They will both increase, but the median will increase more.Correct answer: C Difficulty level: 439.For each of the 50 largest airlines in the world, its percentage of on-time flights is plotted to the left to the nearest 5 percent. According to the dot plot, which of the following is true?A.There are an equal number of points to the left of 72.5 as to the right of 72.5, so the medianpercentage of on-time flights is 72.5.B.There are an equal number of points to the left of 72.5 as to the right of 72.5, so the meanpercentage of on-time flights is 72.5.C.There is a smaller concentration of points on the left side of the dot plot, so the medianpercentage of on-time flights is less than the mean.D.There is a smaller concentration of points on the left side of the dot plot, so the meanpercentage of on-time flights is less than the median.Correct answer: D Difficulty level: 440.The dot plot above depicts the heights in inches of players on a professional basketball team. What would happen to the standard deviation of the data set if the lowest and highest heights were removed?A.It would increase.B.It would decrease.C.It would remain the same.D.There is not enough information to determine the impact on the standard deviation of the dataset.Correct answer: B Difficulty level: 441.), of several varieties of onion A farmer recorded the total fresh yield, in kilograms per hectare (kgℎayield, crops. The table at left gives the results. If the farmer tried a new variety, with a 57,930kgℎahow would it affect the median and mean of the crop yields?A.Both the median and the mean will increase.B.Both the median and the mean will decrease.C.The median will decrease, but the mean will increase.D.The median will increase, but the mean will decrease.Correct answer: D Difficulty level: 442.Land surveyors visited a small fishing village and divided the land into plots, each 120 square meters in area. They counted the number of dwellings on each plot and recorded their data in the bar graph to the left. Due to people moving away from the village, some residents are **bining dwellings together in order to create larger ones. If this is the only change being made to the data, then which of the following must be true when the land is surveyed again?A.The mean number of dwellings will decrease.B.The median number of dwellings will decrease.C.The range of the number of dwellings will increase.D.The variance of the number of dwellings will increase.Correct answer: A Difficulty level: 443.Judah, a marketing consultant, tracked how many times his customers asked a question during his sales calls over a one month period. Based on the results shown in the distribution above, what was the median number of questions asked?A.4B.**5**Correct answer: B Difficulty level: 444.A class used catapults to launch 2 kinds of gummy candies. The dot plots at left record the distances the gummy candies travelled, in inches. Which statement **pares the standard deviations and the means of the distances travelled of the 2 kinds of candies?A.The worm gummy distances have a greater standard deviation and mean than the fish gummydisB.The worm gummy distances have a greater standard deviation, but a lower mean than the fishgummy distances.C.The fish gummy distances have a greater standard deviation and mean than the worm gummydistances.D.The fish gummy distances have a greater standard deviation, but a lower mean than the wormgummy distances.Correct answer: A Difficulty level: 445.An employer wanted to compare **mute times between 1st and 2nd shift employees. Both shifts had a **mute of 17 minutes. The histograms to the left summarize the **mute times of the employees. Which of the following statements **pares the standard deviations of the shifts?A.The standard deviations are equal.B.The standard deviation for the 1st shift employees is greater.C.The standard deviation for the 2nd shift employees is greater.D.Histograms do not provide enough information to compare standard deviations.Correct answer: C Difficulty level: 446.The histograms to the left show the test results of two different 11th grade history classes on the same exam. Which statement **pares the standard deviations of the two data sets?A.he standard deviation of the scores from class A is greater than the standard deviation of thescores from class B.B.The standard deviation of the scores from class B is greater than the standard deviation of thescores from class A.C.The standard deviation of the scores from class A is equal to the standard deviation of thescores from class B.D.There is not enough information to compare the two standard deviations.Correct answer: B Difficulty level: 447.A candidate in a local election analyzed the voter data for 7 of the towns where she was on the ballot. If the median number of votes that she received from the 7 towns was 421, then which statement must be true about this election?A.The total number of votes the candidate received in all 7 towns was 2947.B.The total number of votes the candidate received in each of the 7 towns was 60.C.The candidate received at least 421 votes in at least 4 of the 7 towns.D.The candidate received exactly 421 votes in 2 of the 7 towns.Correct answer: C Difficulty level: 448.In San Francisco, the number of employees in each occupation was recorded and rounded to the nearest 5 thousand. The results are displayed in the dot plot above. If each occupation is split into two separate occupations of equal number of employees, then which of the following occurs?A.Only the mean number of employees decreases.B.Only the mean and median number of employees decreases.C.Only the mean, median, and range of the number of employees decreases.D.The mean, median, range, and standard deviation of the number of employees decreases. Correct answer: D Difficulty level: 449.Bally tracked the number of living organisms she found at different depths in a pond near her home, as shown in the histogram to the left. What is the range of depths at which Bally found living organisms?A.1B.4C.5D.10Correct answer: B Difficulty level: 450.The number of runs scored by the Beavers little league baseball team in their previous six games is shown above. If the Beavers score 7 runs in the seventh game, which of the following statements must be true?A.The mean and median number of runs both increase.B.The mean and median number of runs both remain the same.C.The mean number of runs increases while the median number of runs stays the same.D.The mean number of runs stays the same while the median number of runs increases.Correct answer: C Difficulty level: 451.The four dot plots below show the student height distributions of four different 11th grade math classes. In which of the data sets is the mean greater than the median?Correct answer: D Difficulty level: 452.A survey in Boston measures the highest grade level that each person of age 30 or over has reached. Grades13-16represent college, and grades17-20represent advanced degrees. The number of people at each grade level is expressed as a percentage of the total population, as shown to the left. A new tutoring program will cause some people who did not reach grade 16 to reach grade16. If this is the only change that occurs in the data, then which of the following must be true?A.The mean highest grade level reached will increase.B.The mean highest grade level reached will decrease.C.The median highest grade level reached will increase.D.The median highest grade level reached will decrease.Correct answer: A Difficulty level: 453.The histogram at left summarizes the Flesch grade equivalents (a readability statistic) for the Newbery award winning books from1922-1993. If the book with the highest Flesch grade equivalent fit in the 6 to 6.9 interval instead, what effect would that likely have on the median and the standard deviation of the Flesch grade equivalents?A.The interval containing the median and the standard deviation would decrease.B.The interval containing the median would decrease, but the standard deviation would increase.C.The median would remain in the same interval, but the standard deviation would decrease.D.The median would remain in the same interval, but the standard deviation would increase. Correct answer: C Difficulty level: 454.The table to the left partially records the numbers of pairs of socks manufactured by a company each quarter. If the median of all 9 quarters is 11,830, and the range is the same with and without quarter I, which of the following could be the number of pairs of socks manufactured in quarter I?A.8,962B.10,816C.12,739D.15,511Correct answer: B Difficulty level: 455.The area in thousands of square kilometers of 19 countries in East and Southeast Asia are shown in the dot plot at left. Each value is rounded to the nearest 250 thousand square kilometers. China, which has an area of 9,597 thousand square kilometers, was excluded from the data. If China were included, then which of the following changes would NOT occur?A.The mean area would increase.B.The median area would increase.C.The range of the areas would increase.D.The standard deviation of the areas would increase.Correct answer: B Difficulty level: 456.The change in students' pulse rates after an activity was measured in beats per minute. In one group of students, the activity was running. In the other group of students, the activity was sitting. Both groups had roughly the same number of students. For the running group, the measurements were rounded to the nearest 5 beats per minute. Which of the following statements **pares the variance of the change in pulse rate of both groups?。