1_Drowsy Driving Detection by EEG Analysis Using Wavelet Transform and K-means Clustering
基于便携式脑电数据的实时疲劳驾驶检测系统
系统疲劳驾驶检测的 Sensitivity、Specificity 分别达到 68.31% 和 90.43%,系统同时具有无线、小巧和实时的特点。
关键词:可穿戴;疲劳驾驶检测;前额叶脑电;KNN
中图分类号:TP274
文献标识码:A
ቤተ መጻሕፍቲ ባይዱ
文章编号:2096-4706(2018)04-0037-03
A Real-time Driving Fatigue Detection System Based on Portable EEG
Abstract:According to the wireless,compact and real-time problems on the practical application of driving fatigue detection based on EEG,the relation between attentive and meditative EEG from the left prefrontal lobe of the driver who is in concentration,relax, tiresome and sleep states. Meanwhile,a new method for driving fatigue detection based on the correlation coefficient of driver’s Attentive and Meditative EEG is proposed,and the KNN is introduced to develop a new algorithm for driving fatigue detection. The experiments show that the Sensitivity and Specificity of the system are 68.31% and 90.43% respectively,and the system has the characteristics of wireless,compact and real-time.
视觉完形负波在评价托吡酯及丙戊酸钠对癫痫患者早期认知功能损害中的应用

u e ss i ul. Two t pe fviu lsi uiwe e pr s nt d r n om l s d a tm i y so s a tm l r e e e a d y:pit r sofc m plt a e c u e o e e f c s,pit e nc p e ef c s ( he c ur sofi om l t a e t
・
91 ・ 8
中 国康 复 理 论 与 实践 2 1 0 0年 l o月第 1 6卷 第 l 朔 C t 墨!a i= e h l! U
! !: !
!
: ! ! :
・
Байду номын сангаас专题 ・
视 觉 完 形 负 波 在 评 价 托 吡 酯 及 丙 戊 酸 钠 对 癫 痫 患 者 早 期 认 知 功 能 损 害 中 的 应 用
[ 关键 词] 癫 痫 ; 吡 酯 ; 戊 酸钠 ; 托 丙 事件 相 关 电位 N1 0 认 知 7;
Co n tv mpar e n Ep lptc t pia ae o g ii eI im nti ie is wih To r m t r Val o t e t ntb s a m plto g tvt SUN e pr a eTr a me y Viu lCo ei n Ne a i iy W i,M AO e , W i
面孔 相 片 , 忽 略 S 是 否 部 分 被 遮 盖 , 步 记 录 市 件 相 关 电位 。 结 果 3 受 试 者 在 面 孔 不 完 整 状 态 下 , 诱 发 出 P 0 ( 1 和 而 2 同 组 均 10 P ) N1 O N1 。与 完 整 面孔 相 比 , 完 整 面 孔 在 枕颞 区诱 发 出 明 显增 大 的 而孔 负 波 N1 并 且存 在 着 右 侧 优 势 。在 不 完 整 面 孔 状 态 下 , 7( ) 不 ,
脑电波信号多域变换与深度学习癫痫诊断
脑电波信号多域变换与深度学习癫痫诊断作者:陈浩滨葛薇杨超郑霖来源:《现代信息科技》2022年第20期摘要:单一维度的特征检测使现有基于EEG的癫痫诊断准确性受到限制。
通过将EEG转换成格拉姆角场图和小波时频图,构建一种由2个2维CNN和1个DNN的集成深度学习模型,2个2维CNN分别提取格拉姆角场图和小波时频图的特征并融合,将融合特征输出至DNN以进行癫痫融合识别。
借助波恩大学的脑电数据集测试了该集成深度学习模型的有效性,结果表明,该模型对癫痫EEG识别的准确度、特异性以及敏感度分别为96.5%、95.0%以及96.0%,整体识别性能优于传统的单神经网络模型,可为癫痫等疾病的诊断提供更好的辅助功能。
关键词:深度学习;癫痫;卷积神经网络;连续小波变换;格拉姆角场中图分类号:TP391 文献标识码:A文章编号:2096-4706(2022)20-0006-05Multi-domain Transformation of EEG and Deep Learning Epilepsy DiagnosisCHEN Haobin1, GE Wei2, YANG Chao1, ZHENG Lin1(1.Guangxi Key Laboratory of Wireless Wideband Communications and Signal Processing,Guilin University of Electronic Technology, Guilin 541004, China; 2.College of Humanities and Management, Guilin Medical University, Guilin 541004, China)Abstract: Feature detection in a single dimension limits the accuracy of existing EEG-based epilepsy diagnosis. By converting EEG into Gram angle field map and wavelet time-frequency map,an integrated deep learning model consisting of two 2D CNNs and one DNN is constructed. Two 2D CNNs extract and fuse the features of Gram angle field map and wavelet time-frequency map respectively, and output the fused features to DNN for epileptic fusion recognition. The effectiveness of the integrated deep learning model is tested with the EEG dataset of the University of Bonn. The results show that the accuracy, specificity and sensitivity of the model for EEG recognition of epilepsy are 96.5%, 95.0% and 96.0%, respectively. The overall recognition performance is better than the traditional single neural network model, which can provide better auxiliary functions for the diagnosis of epilepsy and other diseases.Keywords: deep learning; epilepsy; convolutional neural network; continuous wavelet transform; Gram angle field0 引言癫痫是由于大脑神经元突发性异常放电,导致短暂的大脑功能障碍的一种慢性疾病。
依达拉奉右莰醇治疗缺血性脑卒中的研究进展

- 179 -①滨州医学院附属医院神经内科 山东 滨州 256600通信作者:鹿树军依达拉奉右莰醇治疗缺血性脑卒中的研究进展席娅琳① 汪临华① 鹿树军① 【摘要】 缺血性脑卒中是脑血管疾病中的常见病,严重可导致高级认知及运动障碍,甚至死亡。
缺血性脑卒中的治疗方法主要包括早期溶栓和保护神经细胞等治疗,然而目前神经保护剂的临床疗效有待考证,大多数神经保护剂仍未得出有益的证据。
新型双靶点复合型神经保护剂依达拉奉右莰醇(ED)可抑制诱导型一氧化氮合酶(iNOS)和肿瘤坏死因子-α(TNF-α)的表达,降低自由基过氧化亚硝基阴离子(ONOO -)水平,从而改善缺血性脑卒中所致的神经损伤症状、功能障碍及活动障碍,本文将对ED 的作用机制及其应用发展做一综述,并对ED 的临床应用进行展望,为后续的用药提供指导。
【关键词】 缺血性脑卒中 自由基清除剂 神经保护剂 依达拉奉右莰醇 Research Progress of Edaravone Dexborneol in the Treatment of Ischemic Stroke/XI Yalin, WANG Linhua, LU Shujun. //Medical Innovation of China, 2024, 21(10): 179-183 [Abstract] Ischemic stroke is a common type of cerebrovascular disease that can lead to advanced cognitive and motor deficits and even death. The treatment of ischemic stroke mainly includes early thrombolysis and neuroprotection. However, the clinical efficacy of neuroprotective agents remains to be verified, and most neuroprotective agents have not yet received useful evidence. Edaravone Dexborneol (ED), a new dual-target neuroprotective agent, can inhibit the expression of inducible nitric oxide synthase (iNOS) and tumor necrosis factor-α(TNF-α), reduce the level of peroxynitrite anion (ONOO -), and improve the symptoms of nerve injury, dysfunction, and activity disorder caused by ischemic stroke. This article will review the mechanism of ED and its application development, and prospect the clinical application of ED, so as to provide guidance for subsequent medication. [Key words] Ischemic stroke Free radical scavenger Neuroprotective agent Edaravone Dextrogenol First-author's address: Department of Neurology, Binzhou Medical University Hospital, Binzhou 256600, China doi:10.3969/j.issn.1674-4985.2024.10.041 脑卒中已成为我国居民寿命的“第一杀手”,其中,急性缺血性脑卒中(acute ischemic stroke,AIS)约占我国脑卒中的70%,为最常见的卒中类型[1-2]。
用于检测废墟下被困者心跳的雷达设备
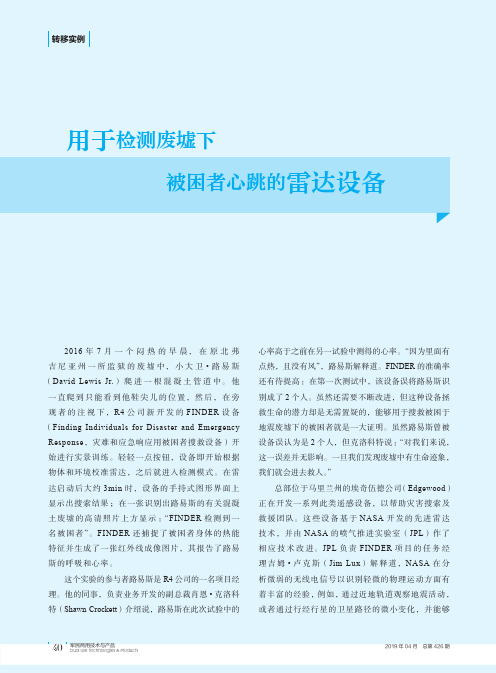
用于检测废墟下被困者心跳的雷达设备2016年7月一个闷热的早晨,在原北弗吉尼亚州一所监狱的废墟中,小大卫•路易斯(David Lewis Jr.)爬进一根混凝土管道中。
他一直爬到只能看到他鞋尖儿的位置,然后,在旁观者的注视下,R4公司新开发的FINDER设备(Finding Individuals for Disaster and Emergency Response,灾难和应急响应用被困者搜救设备)开始进行实景训练。
轻轻一点按钮,设备即开始根据物体和环境校准雷达,之后就进入检测模式。
在雷达启动后大约3min时,设备的手持式图形界面上显示出搜索结果;在一张识别出路易斯的有关混凝土废墟的高清照片上方显示:“FINDER检测到一名被困者”。
FINDER还捕捉了被困者身体的热能特征并生成了一张红外线成像图片,其报告了路易斯的呼吸和心率。
这个实验的参与者路易斯是R4公司的一名项目经理。
他的同事,负责业务开发的副总裁肖恩•克洛科特(Shawn Crockett)介绍说,路易斯在此次试验中的心率高于之前在另一试验中测得的心率。
“因为里面有点热,且没有风”,路易斯解释道。
FINDER的准确率还有待提高:在第一次测试中,该设备误将路易斯识别成了2个人。
虽然还需要不断改进,但这种设备拯救生命的潜力却是无需置疑的,能够用于搜救被困于地震废墟下的被困者就是一大证明。
虽然路易斯曾被设备误认为是2个人,但克洛科特说:“对我们来说,这一误差并无影响。
一旦我们发现废墟中有生命迹象,我们就会进去救人。
”总部位于马里兰州的埃奇伍德公司(Edgewood)正在开发一系列此类遥感设备,以帮助灾害搜索及救援团队。
这些设备基于NASA开发的先进雷达技术,并由NASA的喷气推进实验室(JPL)作了相应技术改进。
JPL负责FINDER项目的任务经理吉姆•卢克斯(Jim Lux)解释道,NASA在分析微弱的无线电信号以识别轻微的物理运动方面有着丰富的经验,例如,通过近地轨道观察地震活动,或者通过行经行星的卫星路径的微小变化,并能够▲NASA在通过消除大量噪声及分析微弱信号以探测轻微物理运动方面有着丰富的经验。
用AI预测癫痫发作

用AI预测癫痫发作预测癫痫发作是一件十分困难的事情。
过去,医生主要通过仪器监测脑电活动来预测癫痫。
但是,这个方法的精确度和实时性都比较差。
近年来,人工智能(AI)技术的发展为癫痫患者带来了新的希望。
AI预测癫痫发作的方法有很多,下面我们来看看其中几种常用的方法。
一、深度学习方法深度学习是目前最流行的AI技术之一,它通过模拟人类神经网络的运行方式来实现自我学习和自我优化。
深度学习可以自动发现数据中的规律,从而实现数据的分类、识别和预测。
针对癫痫的深度学习模型主要有两种:一种是卷积神经网络(CNN),另一种是循环神经网络(RNN)。
卷积神经网络主要用于处理视觉数据,但是也可以用于处理时间序列数据,因为癫痫脑电波的时域特征与图像的空间特征有些相似。
而循环神经网络则更加适用于处理时序数据,它可以在记录脑电波数据的同时建立起脑电波数据的时间序列模型。
二、支持向量机方法支持向量机是另一种常用的AI预测方法。
它是一种基于统计学习理论的监督学习算法,常用于分类和回归分析。
支持向量机的基本思想是将数据映射到高维空间中,然后在高维空间中找到一个最优超平面,从而使得各类数据点之间的距离最大化。
这样,就可以将不同癫痫发作状态对应的脑电波数据分开,从而实现预测。
三、密度聚类方法密度聚类是一种基于点密度的聚类分析方法,它的主要思路是将数据按照密度分布进行聚类。
对于癫痫发作预测而言,密度聚类可以用于将不同时间点的脑电波数据进行分类,从而确定癫痫发作的前兆。
四、基于小波分析的方法小波分析是一种针对时域分析的信号处理方法。
它的基本理念是通过一系列不同频率、不同时域的小波函数来构造复合函数,从而对信号进行分解和重构。
小波分析可以将脑电波数据分解成具有不同时域特征的各个子频带信号,从而更好地反映不同频率成分的变化。
这种方法可以用于对不同类型的癫痫发作进行分类。
总之,人工智能技术为癫痫发作的预测带来了新的希望。
未来随着技术的进一步发展,我们有理由相信这种方法将会变得越来越准确和实用。
用眼睛控制汽车行驶方向的eyeDriver软件
用眼睛控制汽车行驶方向的eyeDriver软件德国柏林自由大学的科学家们为汽车驾驶者带来了一种全新的规则:使用他们开发的eyeDriver软件,驾驶者能通过眼睛引导汽车朝不同的方向行驶。
人工智能教授劳尔-罗哈斯(Raúl Rojas)领导的科研小组负责这一项目。
在柏林滕珀尔霍夫机场旧址,罗哈斯向60多名来自世界各地的记者演示了用眼睛控制汽车的过程。
眼睛控制汽车的过程中使用了eyeDriver软件,这套软件是柏林自由大学和德国SensoMotoric Instruments (SMI)公司合作开发的。
eyeDriver可以收集驾驶者眼球的移动并转化成控制信号来控制汽车的方向盘。
但是,eyeDriver并不包含车辆速度控制系统。
研究人员称,SMI公司研发的HED4装置可以用来检测和跟踪眼球的移动。
HED4装置其实是把一个自行车头盔改装后制成的,头盔上装置了两个摄像头和一个红外发光二极管,同时还配备装载了特殊软件的微型电脑。
驾驶者戴上头盔,指向头盔前方的摄像头被称为现场摄像头,而另外一个摄像头拍摄驾驶者的一只眼睛,被称为眼球运动摄像头。
眼球运动摄像头发出的红外线指向驾驶者的眼球;装置上配置的透明镜子能反射眼球运动摄像头的红外线。
通过这面镜子,不仅可以调整眼球运动摄像头的视角,还能有效保证驾驶者的观察能力不受干扰。
对微型电脑中的软件进行校准后,HED4就可以用来捕获瞳孔的位置,同时,还可以通过现场摄像头传回的数据计算出驾驶者观察点的位置。
驾驶者观察点的坐标通过普通的局域网传输到汽车的计算机里。
通过车载局域网,车载计算机上的eyeDriver软件定期接收驾驶者的观察位置,并通过。
自动驾驶最全简称和英文缩写
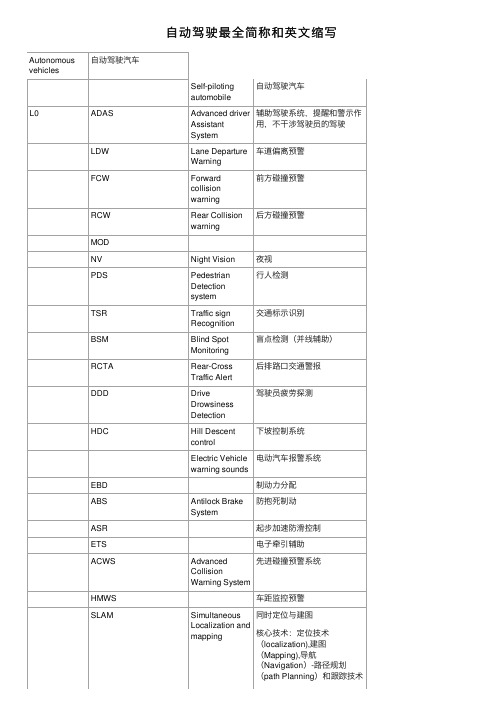
⾃动驾驶最全简称和英⽂缩写Autonomousvehicles⾃动驾驶汽车Self-pilotingautomobile⾃动驾驶汽车L0ADAS Advanced driverAssistantSystem 辅助驾驶系统,提醒和警⽰作⽤,不⼲涉驾驶员的驾驶LDW Lane DepartureWarning车道偏离预警FCW Forwardcollisionwarning前⽅碰撞预警RCW Rear Collisionwarning后⽅碰撞预警MODNV Night Vision夜视PDS PedestrianDetectionsystem⾏⼈检测TSR Traffic signRecognition交通标⽰识别BSM Blind SpotMonitoring盲点检测(并线辅助)RCTA Rear-CrossTraffic Alert后排路⼝交通警报DDD DriveDrowsinessDetection驾驶员疲劳探测HDC Hill Descentcontrol下坡控制系统Electric Vehiclewarning sounds电动汽车报警系统EBD制动⼒分配ABS Antilock BrakeSystem防抱死制动ASR起步加速防滑控制ETS电⼦牵引辅助ACWS AdvancedCollisionWarning System先进碰撞预警系统HMWS车距监控预警SLAM SimultaneousLocalization andmapping 同时定位与建图核⼼技术:定位技术(localization),建图(Mapping),导航(Navigation)-路径规划(path Planning)和跟踪技术(tracking),控制执⾏技术(Controlling) Odometer⾥程计Gyroscopes陀螺仪EKF Extended卡尔曼滤波器Kalman FilterRTK Real time实时动态KinematicFuzz logic模糊逻辑MODAT Moving ObjectDetection andTrackingStixel Sticks above theground in theimageRadar Radio Detectionand RangingTOF Time of FlightHCU Hydraulic压⼒控制模块PressureECU Electronic电控模块control unitSAS Steering angle⽅向盘转⾓传感器sensorIMU Inertial车⾝惯量传感器measurementunitsEBCM Electronic电⼦制动控制单元braking controlmoduleWSS Wheel speed轮速传感器sensorESC Electronic电⼦稳定控制系统stability controlRSC Rolling stability防侧翻稳定控制系统controlTCS Traction control牵引⼒控制系统SystemHSA Hill Start Assist坡道起步辅助AVH Auto vehicle车辆⾃动驻车HoldFBS Fading brake制动衰退补偿supportTVBB Torque制动⼒矩⽮量控制Vectoring byBrakeSTO Steering Torque转向⼒矩⼲预OverlayHMI Human Machine⼈机界⾯HMI Human MachineInterface ⼈机界⾯DDT DynamicDriving task动态驾驶任务OEDR Object andevent detectionand response周边监控ODD Operationaldesign Domain设计运⾏域LiDAR Light Detectionand RadarL1⼲预性辅助驾驶AEB AutoEmergencyBraking 检测前⽅的障碍物,并提供刹车制动ACC Adaptive cruisecontrol⾃适应巡航控制PA Parking Assist停车辅助系统ESC ElectronicStability Control车⾝电⼦稳定系统L2半⾃动驾驶,⼈在良好交通状况下选择性的启动⾃动驾驶,这个阶段以⼈驾驶为主,车⾃动驾驶为辅L3⼈车交互驾驶,车⾃动控制驾驶,⼈参与指挥车辆驾驶,车⾃动驾驶为主,⼈驾驶为辅助L4全⾃动驾驶,⼈不做任何指挥或控制车辆驾驶,由车辆全⾃助驾驶L5完全⾃动驾驶。
基于物联网的酒驾预检测系统
Science &Technology Vision科技视界0引言,。
20186, 3.19,、。
2018,24.5,、55%。
、、[1]。
:、、、。
,,,、。
、、,,。
1物联网20,MIT Auto-ID Ashton ,,“”,[2]。
,,“”。
:、[3-6]。
,、。
,。
、,基于物联网的酒驾预检测系统陈坤2张智超1,2罗旭1,2王金瑞2(1.吉林建筑大学事故预防科学研究院,吉林长春130000;2.吉林建筑大学,吉林长春130000)【摘要】据不完全统计,30%的交通事故是由酒驾、醉驾所引起的,其事故会导致严重的财产和生命损失,安全形势严峻。
文章提出“预先”酒驾检测的概念,以物联网技术为基础,在驾驶员行车之前完成酒驾检测。
通过指纹识别模块确认驾驶员身份,呼气式酒精检测仪判断驾驶员生理状况,完成两项检测后由系统发出指令放开锁死的电磁铁制动踏板以供驾驶员正常行车。
完成驾驶员行车之前的酒驾检测,实现从根源上杜绝酒驾现象的发生。
【关键词】酒驾检测;物联网;ZigBee ;交通事故中图分类号:TP27文献标识码:ADOI:10.19694/ki.issn2095-2457.2021.21.42【Abstract 】According to incomplete statistics,30%of traffic accidents are caused by drunk driving.Theaccidents can cause serious loss of property and life,and the safety situation is severe.This article proposes the concept of "pre -drunk driving"detection,based on the Internet of Things technology,to complete the drunk driving detection before the driver drives.The identity of the driver is confirmed by the fingerprint recognition module,and the breath alcohol detector judges the physiological condition of the driver.After the completion of the two tests,the system sends an instruction to release the locked electromagnet brake pedal for the driver to drive plete the driver's drunk driving test before driving,to prevent the phenomenon of drunk driving fromthe root cause.【Key words 】Drunk driving detection ;Internet of Things ;ZigBee;Traffic accident ※基金项目:吉林省2020年高等学校大学生创新创业训练项目(202010191019);一种预先酒驾检测-疲劳驾驶预警系统的设计;国家自然科学基金面上项目(51674224)。
基于EEG的驾驶持续性注意水平PSO_SVM识别模型
u
i s
属于第
k
级
u
i s
属于第
1
级
(2)
统计子集合 Ui 中各行为绩效点所对应的各级 持续性注意水平的分布频数为 fk,其中分布频率最 高的等级作为该驾驶段所对应持续性注意水平等级
的 C(i) ,即
C ( i)
= {i | fi
=
max (
1臆k臆n
f
k
)
,
fk
=
mk q
}
(3)
式中 mk 为第 k 级持续性注意水平所对应的行为绩 效点频数. 按照上述方法,依次确定集合 U = { U1, U2 ,…,UM}中各驾驶段所对应的持续性注意水平, 最终得到该次驾驶过程中持续性注意水平等级序列
将 EEG 三种信号频段( 兹(4 ~ 8 Hz) 、琢(8 ~ 13 Hz) 、茁
(13 ~ 30 Hz) ) 的平均幅值作为持续性注意水平的
识别参数. 对时段内 1 个电极的 EEG 参数计算处
理过程如下.
1) 以 0 ~ 80 Hz等伪迹干扰. 然后,
驶时长,采集 t 时段内驾驶员对突发事件的反应时
间,并构 成 反 应 时 间 序 列 的 集 合 z = { z1 , z2 , …, zm},计算其均值 z 与标准差 滓. 剔去[ z - 3滓, z + 3滓] 以外的异 常 数 据, 并 对 剩 余 数 据 按 从 小 到 大 顺
序排列,得到序列 Z = { z(1) ,z(2) , …, z(n) } ( n臆m) . 将持续性注意水平划分为 l 级,则第 k 级与第
GUO Zizheng1 , WU Zhimin1 , PAN Yufan1 , YU Gang2 , ZHANG Jun1
面向癫痫的脑电图可视分析方法
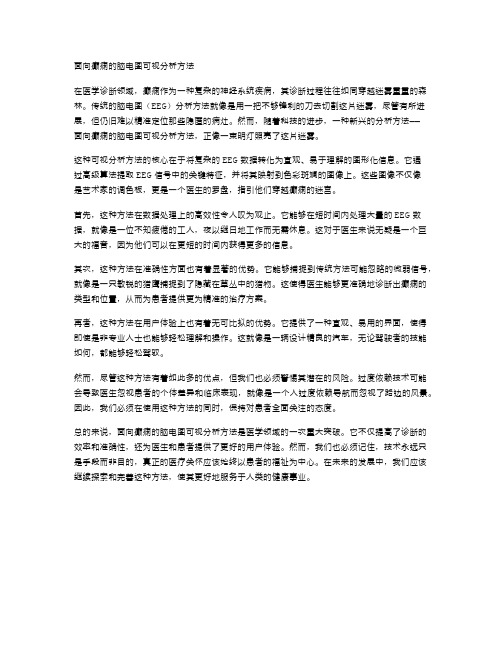
面向癫痫的脑电图可视分析方法在医学诊断领域,癫痫作为一种复杂的神经系统疾病,其诊断过程往往如同穿越迷雾重重的森林。
传统的脑电图(EEG)分析方法就像是用一把不够锋利的刀去切割这片迷雾,尽管有所进展,但仍旧难以精准定位那些隐匿的病灶。
然而,随着科技的进步,一种新兴的分析方法——面向癫痫的脑电图可视分析方法,正像一束明灯照亮了这片迷雾。
这种可视分析方法的核心在于将复杂的EEG数据转化为直观、易于理解的图形化信息。
它通过高级算法提取EEG信号中的关键特征,并将其映射到色彩斑斓的图像上。
这些图像不仅像是艺术家的调色板,更是一个医生的罗盘,指引他们穿越癫痫的迷宫。
首先,这种方法在数据处理上的高效性令人叹为观止。
它能够在短时间内处理大量的EEG数据,就像是一位不知疲倦的工人,夜以继日地工作而无需休息。
这对于医生来说无疑是一个巨大的福音,因为他们可以在更短的时间内获得更多的信息。
其次,这种方法在准确性方面也有着显著的优势。
它能够捕捉到传统方法可能忽略的微弱信号,就像是一只敏锐的猎鹰捕捉到了隐藏在草丛中的猎物。
这使得医生能够更准确地诊断出癫痫的类型和位置,从而为患者提供更为精准的治疗方案。
再者,这种方法在用户体验上也有着无可比拟的优势。
它提供了一种直观、易用的界面,使得即使是非专业人士也能够轻松理解和操作。
这就像是一辆设计精良的汽车,无论驾驶者的技能如何,都能够轻松驾驭。
然而,尽管这种方法有着如此多的优点,但我们也必须警惕其潜在的风险。
过度依赖技术可能会导致医生忽视患者的个体差异和临床表现,就像是一个人过度依赖导航而忽视了路边的风景。
因此,我们必须在使用这种方法的同时,保持对患者全面关注的态度。
总的来说,面向癫痫的脑电图可视分析方法是医学领域的一次重大突破。
它不仅提高了诊断的效率和准确性,还为医生和患者提供了更好的用户体验。
然而,我们也必须记住,技术永远只是手段而非目的,真正的医疗关怀应该始终以患者的福祉为中心。
基于脑电图识别结合操纵特征的驾驶疲劳检测_王斐
3. 2
脑电信号处理方法 小波包变换方法
[ 7 ]
Fig. 1 Schematic diagram for driving fatigue detection system
也被称为最优子带数结构( SB-
400
仪
器
仪
表
学
报
第35 卷
TS) , 也称为小波包分解( WPD) , 是一种利用小波变换, 其 中离散时间( 采样) 信号通过比更多的过滤器通过离散小 波变换( DWT) 。利用小波包变换可以将 EEG 信号分解成 不同的子频带, 并且可以进一步对重要子频带进行细致分 [ 8 ] 析, 提取子频带的能量作为特征 。但是该分析方法对于 先验知识的依赖程度较大, 需要根据经验从多个导联中挑 选出少数与实验任务相关的导联。而信号和噪声都从各 自的源发出, 相互关联弥散, 造成各个导联信号之间具有 [9 ] 很强的相关性 。由于脑电信号中噪声源和信号源都有 明显的时空分布特性, 因此利用多通道信号的空间信息对 数据预处理, 可以有效地提高信噪比。共空间模式方法
本文中选择 6 名男性在校本科生作为实验对象, 年 龄在 20 ~ 24 岁, 驾龄差小于 5 岁, 实验对象无身体和心 理问题, 实验前有足够的睡眠, 可以保证实验过程中状态 良好, 实验前和实验过程中均未服用咖啡、 茶叶和精神兴 奋型药物。 为获得驾驶员在不同生理状态下的驾驶行为数据, 实 3 。 1 : 验将在 种不同的精神状态下进行 状态 经过良好的 睡眠, 实验对象早晨起床后, 感觉十分警醒精力充沛; 状态 2 : 实验对象进行阅读等脑力劳动, 直至感觉非常疲倦, 不 愿再继续完成任务为止, 时间选在当天晚上 9 点左右; 状 态 3 : 实验对象继续进行脑力活动, 直至感觉非常疲倦, 不 愿再继续完成任务为止, 时间选在次日早 8 点左右。每个 状态采集时间约为 2 h, 每个被试者共计进行 6 h 左右的仿 真驾驶, 在驾驶过程中采集驾驶人的方向盘操纵数据和 EEG 信号, 实验步骤安排如表 1 所示。
瞌睡检测系统介绍
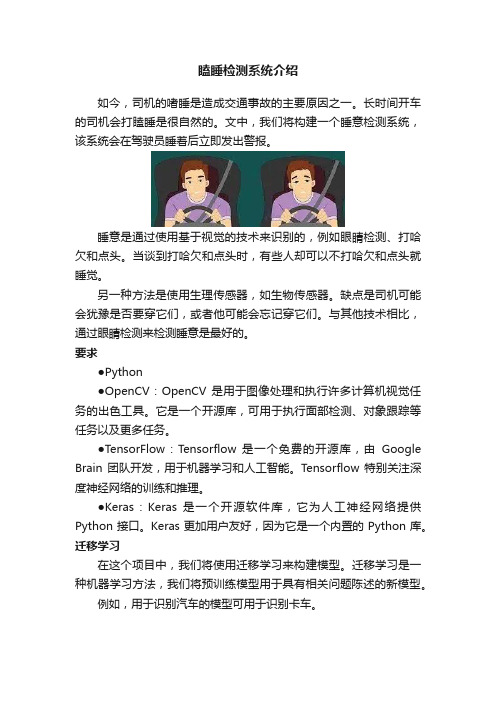
瞌睡检测系统介绍如今,司机的嗜睡是造成交通事故的主要原因之一。
长时间开车的司机会打瞌睡是很自然的。
文中,我们将构建一个睡意检测系统,该系统会在驾驶员睡着后立即发出警报。
睡意是通过使用基于视觉的技术来识别的,例如眼睛检测、打哈欠和点头。
当谈到打哈欠和点头时,有些人却可以不打哈欠和点头就睡觉。
另一种方法是使用生理传感器,如生物传感器。
缺点是司机可能会犹豫是否要穿它们,或者他可能会忘记穿它们。
与其他技术相比,通过眼睛检测来检测睡意是最好的。
要求●Python●OpenCV:OpenCV 是用于图像处理和执行许多计算机视觉任务的出色工具。
它是一个开源库,可用于执行面部检测、对象跟踪等任务以及更多任务。
●TensorFlow:Tensorflow 是一个免费的开源库,由Google Brain 团队开发,用于机器学习和人工智能。
Tensorflow 特别关注深度神经网络的训练和推理。
●Ke ras:Keras 是一个开源软件库,它为人工神经网络提供Python 接口。
Keras 更加用户友好,因为它是一个内置的 Python 库。
迁移学习在这个项目中,我们将使用迁移学习来构建模型。
迁移学习是一种机器学习方法,我们将预训练模型用于具有相关问题陈述的新模型。
例如,用于识别汽车的模型可用于识别卡车。
这里主要关注在解决一个问题时获得的知识,它适用于不同但相关的问题。
方法该项目的方法是使用网络摄像头捕获第一个视频,并使用Harcascade 算法从视频中检测第一张脸,检测眼睛。
然后我们使用我们的深度学习模型,该模型是使用迁移学习构建的,以了解眼睛的状态。
如果它是睁眼的,它会说司机是活跃的,如果它是闭眼的,它会检查几秒钟,然后它会说司机昏昏欲睡,并会发出警报。
我们将使用 Python、OpenCV、TensorFlow 和 Keras 来构建一个系统,该系统可以检测驾驶员的闭眼情况,并在他们在驾驶时睡着时提醒他们。
如果驾驶员的眼睛是闭着的,这个系统会立即通知驾驶员。
基于脑电信号空域特征的紧急制动行为识别
基于脑电信号空域特征的紧急制动行为识别
袁月婷;闫光辉;常文文;张玉婵
【期刊名称】《电子科技大学学报》
【年(卷),期】2024(53)1
【摘要】基于脑电信号对紧急制动行为的分类识别和预测,是开发以人为中心的智能辅助驾驶系统的关键问题。
为实现对驾驶过程中紧急制动和正常驾驶行为的分类识别,提出了基于PLV的特征表示方法来构建功能性脑网络,结合对网络特征参数的统计分析,确定显著性差异的特征参数,以及通过对数欧式距离提取脑电信号空域特征,并结合机器学习算法完成对紧急制动和正常驾驶行为的分类识别。
实验结果表明,针对17名被试的紧急制动和正常驾驶的分类准确率均高于84%,最高准确率达到95.7%;对功能性脑网络的分析结果表明,在两种驾驶行为过程中,脑区间的交互都涉及全脑区,且在紧急制动过程中,脑区间的交互主要出现在额-中央-颞叶区,这与紧急制动下大脑更专注于判断决策相符。
研究结果对理解驾驶过程中,尤其是紧急制动过程中驾驶员对应脑区间的依赖关系,以及开发智能辅助驾驶系统在驾驶过程中提前识别紧急制动意图具有一定的参考价值。
【总页数】8页(P84-91)
【作者】袁月婷;闫光辉;常文文;张玉婵
【作者单位】兰州交通大学电子与信息工程学院;甘肃日报报业集团甘肃省媒体融合技术与传播重点实验室
【正文语种】中文
【中图分类】U471.15;TP391
【相关文献】
1.基于能量特征的脑电信号特征提取与分类
2.基于下肢表面肌电的驾驶员紧急制动行为识别
3.基于共同空间模式的情感脑电信号的空域特征提取
4.基于脑功能网络和样本熵的脑电信号特征提取
因版权原因,仅展示原文概要,查看原文内容请购买。
脑诱发电位联合心理智能测验检测肝癌患者亚临床肝性脑病的研究
脑诱发电位联合心理智能测验检测肝癌患者亚临床肝性脑病的研究李薇;吴积坰;李惠芳;顾海蔚【期刊名称】《医学综述》【年(卷),期】2003(009)007【摘要】目的用脑诱发电位联合心理智能测验的方法,研究原发性肝癌患者并发亚临床肝性脑病(SHE)的情况.方法用视觉诱发电位(VEP)、听觉事件相关电位(P300)、数字连接试验(NCT)、数字符号试验(DSY)与数字广度试验(DSP)等检测对81例原发性肝癌并肝硬化患者及50例非肝痛患者及部分健康志愿者对照进行研究.结果患者组与对照组之间各检测值存在明显差异,81例患者中检出VEP、P300、NCT、DSY及DSP异常例数,分别为5例(6.2%)、17例(21.0%)、19例(23.5%)、12例(14.8%)与10例(12.3%),共检出亚临床肝性脑病33例(40.7%).肝功能Child-PughB级组亚临床肝性脑病的发生率明显高于Child-Pugh A级组.并发亚临床肝性脑病的患者死于肝性脑病的比例明显高于不伴亚临床肝性脑病的患者.结论亚临床肝性脑病在原发性肝癌并肝硬化患者中有一定的发生率,其发生情况与肝功能状况密切相关.肝癌患者并发亚临床肝性脑病与死因是否为肝性脑病有一定的关系.【总页数】2页(P447-封三)【作者】李薇;吴积坰;李惠芳;顾海蔚【作者单位】上海瑞金医院集团闵行医院,上海,201100;上海瑞金医院集团闵行医院,上海,201100;上海瑞金医院集团闵行医院,上海,201100;上海瑞金医院集团闵行医院,上海,201100【正文语种】中文【中图分类】R735.7;R575.2;R749.23【相关文献】1.心理智能测验检测原发性肝癌并肝硬化患者并发亚临床肝性脑病的研究 [J], 李薇;吴积垌2.心理测验、视觉诱发电位检测亚临床肝性脑病的价值 [J], 唐彤宇;陈立刚;吴扬3.探讨心理测验和脑诱发电位检测亚临床型肝脑的价值 [J], 钟碧慧;陈旻湖;袁育红;任明;胡品津4.心理智能测验检测肝动脉化疗栓塞对肝癌合并肝硬化患者亚临床肝性脑病的影响[J], 李薇;吴积炯;李惠芳;顾海蔚5.探讨心理测验和脑诱发电位检测亚临床型肝性脑病的价值 [J], 钟碧慧;陈Min湖因版权原因,仅展示原文概要,查看原文内容请购买。
- 1、下载文档前请自行甄别文档内容的完整性,平台不提供额外的编辑、内容补充、找答案等附加服务。
- 2、"仅部分预览"的文档,不可在线预览部分如存在完整性等问题,可反馈申请退款(可完整预览的文档不适用该条件!)。
- 3、如文档侵犯您的权益,请联系客服反馈,我们会尽快为您处理(人工客服工作时间:9:00-18:30)。
P roce dia Compute r Scie nce 34 ( 2014 )400 – 4091877-0509 © 2014 Elsevier B.V. This is an open access article under the CC BY-NC-ND license (/licenses/by-nc-nd/3.0/).Selection and peer-review under responsibility of Conference Program Chairs doi: 10.1016/j.procs.2014.07.045ScienceDirectAvailable online atThe 11th International Conference on Mobile Systems and Pervasive Computing(MobiSPC-2014)Drowsy Driving Detection by EEG Analysis Using WaveletTransform and K-Means ClusteringNikita Gurudath, H. Bryan Riley*School of Electrical Engineering and Computer Science, Ohio University, Athens, Ohio 45701, USAAbstractThis research aims to develop a driver drowsiness monitoring system by analyzing the electroencephalographic (EEG) signals in a software scripted environment and using a driving simulator. These signals are captured by a multi-channel electrode system. Any muscle movement impacts the EEG signal recording which translates to artifacts. Therefore, noise from the recording is eliminated by subtracting the noisy signal from the original EEG recording. The actual EEG signals are then subjected to band pass filtering with cut-off frequencies 0.5 Hz and 100 Hz. The filtered signals are analyzed using a time-frequency technique known as the Discrete Wavelet Transform (DWT). A third order Deba uchies’ wavelet and five level decomposition is utilized to segregate the signal into five sub-bands, namely, delta (0.5 – 4 Hz), theta (4 – 8 Hz), alpha (8 – 12 Hz), beta (12 – 30 Hz) and gamma (> 30 Hz). First order statistical moments such as mean, median, variance, standard deviation and mode of the sub-bands are calculated and stored as features. These features serve as an input to the next stage of system classification. Unsupervised learning through K-means clustering is employed since the classes of the signals are unknown. This provides a strong decision making tool for a real-time drowsiness detection system. The algorithm developed in this work has been tested on twelve samples from the Physionet sleep-EDF database.© 2014 The Authors. Published by Elsevier B.V. Peer-review under responsibility of the Program Chairs of MobiSPC-2014. Keywords: Driver health monitoring; EEG signal analysis; discrete wavelet transform; Debauchies’ wavelet; K-means clustering* Tel.: +1-740-597-3173E-mail address: rileyh1@© 2014 Elsevier B.V. This is an open access article under the CC BY-NC-ND license (/licenses/by-nc-nd/3.0/).Selection and peer-review under responsibility of Conference Program Chairs401 N ikita Gurudath and H. Bryan Riley / P rocedia Computer Science 34 ( 2014 )400 – 4091.IntroductionThe National Highway Transportation and Safety Administration (NHTSA) states that drowsy driving accounts for 1550 deaths, 40000 injuries and more than 56000 crashes every year in the United States [1]. This varies between 2.2% - 2.6% of the fatal crashes. A study by researchers in Australia has proven that being awake for 18 hours produces an impairment equivalent to a Blood Alcoholic Concentration (BAC) OF 5% and 10% after 24 hours [2]. With 8% of BAC being considered as legally drunk, this study provides alarming statistics. Drowsiness hampers driving by causing slower reaction times, vision impairment and major lapses in judgment [3, 4]. This reiterates the need to investigate various methods that can classify drowsiness by monitoring the awareness state of the driver.Drowsy driving detection is an important issue in today’s society because falling asleep while driving is clearly dangerous, while the propensity to be sleepy affects one’s ability to drive safely even if the person does not fall asleep. Drowsiness has the following effects•Decrease driver’s attention to surroundings•Slow down reaction time considerably•Affect a driver's ability to make decisionsFig. 1 below summarizes a drowsy driving study conducted by the Center for Disease Control and Prevention (CDCP).Fig.1. Statistics of adults falling asleep while driving (from [4]).1.1. Electroencephalographic signalsEEG signals are the indication of brain activity in a high level organism. It is a graph of low voltage levels versus time. The brain is made up of neurons which communicate via electrical impulses. It is analogous to a network with nodes corresponding to different activity centers, and meshes corresponding to various pathways. The voltage measured is extremely small (up to the order of microvolts) and is susceptible to artifacts and disturbances. These signals are non-stationary in nature. This means that they have different frequency components existing at different intervals of time. The five primary frequency bands in a typical EEG signal are defined as [3]:•Delta – (0.5 – 4) Hz•Theta – (4 – 8) Hz•Alpha – (8 – 12) Hz•Beta – (12 – 30) Hz•Gamma – >30 HzThe Theta, Alpha and Beta sub-bands are of interest for drowsy driving identification. Alpha activity is predominant when a person is resting or closing his eyes. During the transition from awake to sleep or drowsy state,402N ikita Gurudath and H. Bryan Riley / P rocedia Computer Science 34 ( 2014 )400 – 409alpha decreases and theta increases gradually [5]. It has also been proven that beta waves are significantly high when a person is taking sedative and hypnotic drugs such as benzodiazepines and/or barbiturates [6].EEG signals are measured by placing electrodes on the human scalp. The position of the electrodes is given by a standardized system known as the 10-20 montage [7]. Fig. 2 illustrates a configuration of electrodes utilized by neurologists and related healthcare professionals.Fig.2. Mapping of electrode placements for EEG data collection (from [7]).The regions marked by English letters F, P, T, O and C in Fig. 2 correspond to the frontal lobe, parietal lobe, temporal lobe, occipital lobe and central lobe respectively. A1 and A2 represent the regions where reference electrodes are placed. Fpz is the frontal polar region and Pz represents the nasopharyngeal position.1.2. Background and literature reviewIncreased focus on safe driving has made driver health monitoring an important aspect in the automotive industry. There are two ways to monitor the vigilance of a driver:•Image processing techniques that track facial and/or head movements and eye gaze monitoring•Signal processing techniques that utilize information from physiological signals from EEG, Electrocardiography (ECG), Electrooculography (EOG) and Electromyography (EMG) recordings.Academic researchers and automobile manufacturing companies have recognized the importance of evaluating drowsy driving and have implemented systems to detect drowsiness for the safety of drivers and passengers. [8] illustrates comprehensive parameters of the human body that could be used to monitor the health of the driver.Existing vehicles have state-of-the-art systems installed [9]. For example, the 2013 Mercedes Benz 5000 series model consists of the Attention Assist system which creates the driver’s profile by monitoring the driving during the first five minutes of the drive and then uses this as a reference to monitor driver input and vehicle parameters such as vehicle speed, angle of steering wheel, longitudinal and lateral acceleration. Volvo has incorporate d a driver alert control system that monitors drowsiness based on the car’s progress on the road. Delphi manufactures commercial products such as Driver State Monitor and Driver Fatigue Monitor that determine drowsiness by eye blink detection algorithms. These expensive systems have not been robustly tested under low illumination conditions (night time driving) and heavily rely on inputs from the vehicle.Literature reports that EEG data provides the best descriptors of sleep [10]. Kerkeni et al. described automatic classification of different sleep stages using frequency domain analysis. The Fast Fourier Transform (FFT) of the EEG signal was computed after certain pre-processing [11]. The spectral power of each of the resulting five sub-bands was calculated. These five values were used as an input for the three layered neural network employed as the classifier. A low classification accuracy of 76% indicated the ineffectiveness of using frequency analysis for non-stationary signals such as the EEG signals. When electing to deal with life threatening situations, a more robust system is required to be developed. The analysis of spatial and temporal aspect is required to evaluate non-stationary data such as EEG signals [12, 13]. In order to account for the non-stationary property, [13] suggested a time-frequency analysis using the wavelet transform. The work described by the method in [14] provides 93%403 N ikita Gurudath and H. Bryan Riley / P rocedia Computer Science 34 ( 2014 )400 – 409classification accuracy. The use of other classifiers such as support vector regression or fuzzy neural networks provide higher classification accuracy (97%) as indicated by [15]. However, this increases the complexity of the system and requires a large feature set.The number of channels used to record the EEG signals plays a major role. More information is obtained when many channels are used [16]. However, this increases the cost and computation time. When a single or double channel is used, the cost and time are manageable but the reliability decreases. This triggers the need for a trade-off between complexity and reliability. [17] indicates that recordings from 5 channels, Fp1, Fp2, Cz, O1 and O2 as shown in [7], provide a good description of drowsiness.1.3. Specific objectives of this researchIn this work, the aim is to implement classification of driver drowsiness. We intend to use data from a publically available Sleep-EDF database at Physionet [18]. The EEG signals collected would be analyzed by DWT that e mploys third order Debauchies’ wavelet and level five decomposition, resulting in the five sub-bands. The mean, median, variance, standard deviation and mode from each of the sub-bands would be calculated and stored as a set of features. Since the class of the EEG signals is unknown, K means clustering would be used to determine the classes of the data. The classes predicted from K-means clustering would be used as a priori information for classification via three layer neural net consisting of input layer, hidden layer and output layer. The three classes considered are awake, drowsy and asleep (class 1, class 2 and class 3).2.Description of the methodThe algorithm in this research has been developed taking into account the non-stationary property of EEG signals. A well-established mathematical theory (i.e. Wavelet) is implemented on a digital computer to analyze time and frequency (or scale) components simultaneously in a signal.2.1.Pre-Filtering and artefact removalThe EEG signals obtained from [18] are recorder from two channels- Fpz - Cz and Pz- Oz. It also consists of recordings from the eyelids (Electrooculography/EOG signals). These are considered as noise and must be subtracted from the EEG recordings in order to be able to use them for further processing. The signals are filtered at a frequency of 100Hz. Using this information, epochs of 30s is extracted and stored.2.2.Non-stationary signal analysis using discrete wavelet transformA signal contains information about the physical world. In order to extract useful data from these signals, they are required to be transformed from one domain (say, time) to another domain (say, frequency) to gain further insights. Applicable transforms for such purposes include the: [19]•Fourier transform•Radon transform•Hilbert transform•Wigner transform•Short-time Fourier transforms•Wavelet transformFourier transforms are widely used for analysis of stationary signals. When a signal consists of different frequency components for various time intervals, short-time Fourier transform (STFT) provides valuable information. The STFT is computed by sliding a window function over the entire length of the original signal [19]. The width of the window depends on the time, for which a single frequency component exits in the signal, i.e., the interval of time for which the signal is stationary. It is given as:ܵܶܨܶ௫ሺௐሻሺݐᇱǡ݂ሻൌ ሾݔሺݐሻήܹכሺݐെݐᇱሻሿ݁ିଶగ௧݀ݐ(1)௧404N ikita Gurudath and H. Bryan Riley / P rocedia Computer Science 34 ( 2014 )400 – 409Fig.3. Low pass and high pass filters of Deubauchies third order wavelet family.The frequency spectrum of each of the coefficients has been evaluated. They correspond to the five sub-bands of an EEG signal namely, gamma, beta, alpha, theta and delta.Feature extractionIn any pattern recognition system it is essential to isolate those attributes which are specific to a particular class. In this work, five first order features have been extracted from each of the sub-bands or DWT coefficients. They are:405N ikita Gurudath and H. Bryan Riley / P rocedia Computer Science 34 ( 2014 ) 400 – 409ݏҧൌ ଵேσݏேୀଵ (4)The median is the mid value of the sample. If N is odd, then the median is the ሺேାଵଶሻ௧ value of the sample. If N iseven, then the median is the average of ሺேଶሻ௧ and ሺேାଶଶሻ௧ value in the sample. Standard deviation is defined as:ߪൌ ටଵேσሺݏെݏҧሻଶேୀଵ (5)Variance is given by:ݒܽݎൌ ߪଶ(6)Mode is defined as the most frequently occurring point in the sample. If there are multiple points having the same frequency of occurrence, then the smallest of the values is chosen. These features are utilized as input to the neural network for classification.2.4. ClassificationLearning can be divided into two categories: supervised and unsupervised. Supervised learning involves useof a feedback-based algorithm such as backpropagation, where error responsibility is calculated at each node. Unsupervised learning, often using the Hebbian algorithm, finds correlations between input data and divides it into related sets [21]. In this research the classes of the EEG data is assumed to be unknown. In any real time drowsiness detection system using EEG signals, it is difficult to know the class to which a particular feature belongs. In order to determine which class each signal belongs to, a well-known clustering technique called K-means clustering is employed [22]. This method utilizes the mean of similar data points in order to group the signals together. It is an iterative procedure carried out to minimize within-class sum of squares. For n feature vectors, ࢞ଵǡ࢞ଶǡǥǡ࢞, that fall into k clusters (k<n) the objective/cost function to be minimized is given asܬൌσσฮݔሺሻെܿฮଶୀଵୀଵ(7)݉ is the mean of vectors in cluster i and the term inside the summation is a chosen distance measure between datapoint ݔሺሻand cluster center ܿ. The algorithm for K-means clustering [23] is x Step 1: Startx Step 2: Initialize 1, 2, …, k x Step 3: While no change in meanx Step 4: Classify samples into clusters using estimated means x Step 5: For i running from 1 to kx Step 6: Calculate the distance between each feature and the initialize cluster mean x Step 7: If the criterion in equation 7 is satisfied proceed to Step 9 else go to Step 8. x Step 8: Replace ݉i with mean of all samples for cluster i x Step 9: End for x Step 10: End while x Step 11: StopOnce the classes of the samples have been determined, training would be accomplished using Artificial Neural Networks (ANN). An ANN emulates the human brain’s ability to learn and recognize patterns. All neural nets consist of neurons as the basic processing nodes, and synapses which store a weight value to connect together the layers of neurons. A three layered ANN would be employed to classify the EEG signals into drowsy, awake or sleep states. The input, hidden and output layers would be trained using the back propagation algorithm [24]. The set of 15 features obtained from DWT form the inputs to the neural net. The output layer consists of three neurons corresponding to the three desired states. The number of hidden layers would be determined empirically after successive trials.406N ikita Gurudath and H. Bryan Riley / P rocedia Computer Science 34 ( 2014 )400 – 4093.Experimental resultsIn this research, 12 EEG samples have been used from the Physionet sleep-EDF database [18]. The files are in EDF/EDF+ (European Data Format) format which can be viewed using the Polyman software. Fig. 4 illustrates the EEG and EOG data from one sample.Fig.4. An EEG and EOG sample from Physionet database [18] displayed using Polyman software.It is essential to remove artifacts from the EEG data before the DWT can be applied for the purpose of analysis. This is achieved by subtracting the EOG data from the EEG data. The processed signals are subjected to a DWT with third order Debauchies’ wave let and five level decomposition to obtain five sub-bands.The mean, median, standard deviation, variance and mode for each of the five sub-bands are calculated. In order to determine the best set of classes for the EEG signals, K-means clustering for each of these features is conducted on all the sub-bands. The K-means clustering plots for channel 1and channel 2 and for standard deviation and variance is as shown in Figs. 5 and 6 respectively.(a)407 N ikita Gurudath and H. Bryan Riley / P rocedia Computer Science 34 ( 2014 )400 – 409(b)Fig. 5. Results of Kmeans clustering using standard deviation and variance as input from Fpz – Cz channel.(a)(b)Fig.6. Clusters obtained using standard deviation and variance from Pz- Oz channel of EEG recording.408N ikita Gurudath and H. Bryan Riley / P rocedia Computer Science 34 ( 2014 )400 – 4094.Conclusion and future workThis research aims to develop an automatic system for drowsy driving identification or detection by analyzing EEG signals of the driver. The wavelet transform is an effective tool to analyze the time as well as frequency components hidden in such non-stationary signals. The first order statistical features are tractable andhave low memory requirements. In real world driving scenarios where manual scoring of EEG signals is impossibleand impractical, the K-means clustering technique is a strong decision making tool in order to determine to whichsleep related state: (i.e., awake, drowsy or asleep) each sample belongs. It is concluded that classes obtained by clustering the variance data provides the best separation of clusters when visually inspected. This would be utilizedto input the features into a three layer ANN and conduct classification.AcknowledgementsWe wish to thank Dr. Shinichi Amano and Dr. S. Lee Hong for their guidance and suggestions during this research period. Dr. Amano is postdoctorial fellow in the Ohio Musculoskeletal and Neurological Institute (OMNI) College of Osteopathic Medicine. He earned a PhD degree in biobehavioural science from the University of Floridaand currently is a researcher at Ohio University in Athens, Ohio. Dr. Hong earned a PhD in Kinesiology, with an emphasis on motor control, and currently is an associate professor in the Department of Biomedical Sciences at Ohio University. His research interest include the study of dynamic patterns in brain, behavior, and physiology.References1.NHTSA, "Drowsy driver detection and warning system for commercial vehicle drivers: Field proportional test design, analysis, andprogress," /. Accessed on January 30th, 2014.2.National Sleep Foundation, “Facts and Stats,” /about/facts-and-stats/. Accessed on January 30th, 2014.3.L. Chin Teng, W. Ruei-Cheng, S.-F. Liang, W.-H. Chao, Y.-J. Chen and T.-P. Jung, "EEG based drowsiness estimation for safety drivingusing independent component analysis," IEEE Transactions on [Circuits and Systems I: Fundamental Theory and Applications], vol. 52, no.12, pp. 2726 – 2738, 2005.4.Centres for Disease Control and Prevention (CDC). Drowsy driving - 19 states and the District of Columbia, 2009-2010. MMWR.2013;61:1033-7, Accessed January 4, 20135.Lin C T, "Assessment of driver's driving performance and alertness using EEG-based fuzzy neural networks Circuits and Systems," IEEEInternational Symposium on Circuits and Systems, vol. 1, pp. 152-155, 2005.6.The McGill Physiology Virtual Lab, “Biomedical signal acquisition,”http://www.medicine.mcgill.ca/physio/vlab/biomed_signals/eeg_n.htm. Accessed on March 7th, 2014.7.Immrama Institute, “The International 10-20 System of Electrode Placement,” /eeg/electrode.html. Accessed onFebruary 2nd, 2014.8. A car that takes your pulse, "Designing vehicles to monitor brain waves, sleepiness,”/news/articles/SB10001424127887324352004578131083891595840.,November 5th, 2013.9.Y. Dong, Z. Hu, K. Uchimura, and N. Murayama, “Driver inattention monitoring system for intelligent vehicles: A review,” IEEE Trans.Intell. Transp. Syst., vol. 12, no. 2, pp. 596–614, Jun. 2011.10."Monitoring driver attentiveness to improve safety," Automotive Engineering Online, 2013.11. B. O. Peters, G. Pfurtscheller and H. Flyvbjerg, "Automatic differentiation of multichannel EEG signals.," IEEE Transactions on BiomedicalEngineering, vol. 48, pp. 111-116, 2001.12.N. Kerkeni, F. Alexandre, M. H. Bedoui, L. Bougrain and M. Dogui, "Automatic classification of sleep stages on a EEG signal by artificialneural networks," in Proceedings of the 5th WSEAS international conference on Signal, speech and image processing (SSIP'05), StevensPoint, Wisconsin, 2005.13. A. Picot, S. Charbonnier and A. Caplier, "On-line automatic detection of driver drowsiness using a single electroencephalographic channel,"in 30th Annual International Conference of the IEEE EMBS, 2008.14.Arjunan S. P, "Changes in Decibel Scale Wavelength Properties of EEG with Alertness Levels While Performing Sustained AttentionTasks." 31st Annual International Conference of the IEEE EMBS, Minnesota, 2009.409 N ikita Gurudath and H. Bryan Riley / P rocedia Computer Science 34 ( 2014 )400 – 40915. F. Ebrahimi, M. Mikaeili, E. Estrada and H. Nazeran, "Automatic Sleep Stage Classification Based on EEG Signals by Using NeuralNetworks and Wavelet Packet Coefficients," in 30th Annual International IEEE EMBS Conference, Vancouver, British Columbia, Canada, 2008.16. F.C. Lin, L.W. Ko, C.H. Chuang, T.P. Su and C.T. Lin, "Generalized EEG-Based Drowsiness Prediction System by Using a Self-Organizing Neural Fuzzy System," IEEE Transactions on Circuits and Systems—I: Regular papers, vol. 59, no. 9, pp. 2044-2055, 2012.17.S. Makeig, A. J. Bell, T. P. Jung and T. J. Sejnowski, "Independent Component Analysis of Electroencephalographic Data," in Advances inNeural Information Processing Systems, Cambridge,MA, MIT Press, 1996, p. 145–151.18.R. Broughton and J. Hasan, "Quantitative Topographic Electroencephalographic Mapping During Drowsiness and Sleep Onset," Journal ofClinical Neurophysiology, vol. 12, no. 4, pp. 372-386, 1995.19.Goldberger AL, Amaral LAN, Glass L, Hausdorff JM, Ivanov PCh, Mark RG, Mietus JE, Moody GB, Peng C-19. K, Stanley HE,“PhysioBank, PhysioToolkit, and PhysioNet: Components of a New Research Resource for Complex Physiologic Signals,” Circulation , vol. 101, no. 23 :e215-e220 [Circulation Electronic Pages; /cgi/content/full/101/23/e215]; 2000.20.R. Polikar, “The Wavelet Tutorial,” featured by the Science Magazine’s NetWatch Department, Science, vol. 300, no. 561, pp. 873, May2003.21.G. Kaiser, A Friendly Guide to Wavelets, Birkhauser 2011.22. C. Donalek, “Supervised and Unsupervised learning,” /~donalek/Teaching.html. Acc essed 21st April, 2014.23.MATLAB Cookbook, “How do I perform K-means clustering?,” /recipes/0100_Statistics/150_K-means_clustering.html. Accessed on 21st April, 2014.24. A. Subasi, "Automatic recognition of alertness level from EEG by using neural network and wavelet coefficients," Expert Systems withApplications, pp. 1-11, 2004.。