AEROHEATING THERMAL MODEL CORRELATION FOR MARS GLOBAL SURVEYOR (MGS) SOLAR ARRAY
动静干涉下高压涡轮外环非定常气膜冷却性能分析

2018版一年级数学下学期期末考试试题北师大版A卷含答案班级:_______ 姓名:_______ 学号:_______(试卷60分钟,满分为100分,附加题单独20分)题一二三四五六七八九附加题总分号得分同学们,一个学期过去了,你一定长进不少,让我们好好检验一下自己吧!一、我会填(本题共10分,每题2分)1、比6大比10小的数有()。
2、小朋友们排成一队做操,小红的前面有5人,后面有4人,从前往后数,小红排在第()个,这一队共有()人。
3、填空(人民币换算)。
1元=( )角 1角=()分24角=()元()角 48分=()角()分87角=()元()角 4元5角=()角67分=()角()分 23角=()元()角4、一个两位数,个位数比8大,十位数比2小,这个两位数是()。
5、填上合适的人民币单位。
一件上衣56 ()一个布娃娃4()一盒彩笔9 ()一根跳绳2 ()一支铅笔5()一个书包30()一个练习本4()一个笔筒4()5()一枚邮票8 ()一个文具盒5()一本故事书5()7()二、我会算(本题共20分,每题5分)1、小亚准备买4元钱的铅笔和10元钱的蜡笔,她带了15元钱,够不够,如果不够还缺多少元?如果够了还剩多少元?答:_____ ,还剩下()元。
2、计算题,我会做,瞧我的!3厘米+18厘米= 20厘米-8厘米=35厘米-26厘米= 45米+6米=1米-99厘米= 56厘米+14厘米-32厘米=100米-74米= 17米38厘米+62厘米=3、先计算,再填空。
4、树形图计算,填数。
三、我会比(本题共10分,每题5分)1、在○里填上“>”、“<”或“=”。
8+5 ○ 12 7+9 ○ 17 6+8 ○ 6+99+4 ○ 13 8+8 ○ 18 9+7 ○ 10+66+9 ○ 16 4+8 ○ 14 9+5 ○ 9+92、在○里填<、>或=10○8 6○6 8○6+1 4-4○05+4○10 10-3○8 7-3○2+3 6+3○7+3四、选一选(本题共10分,每题5分)1、同学们去浇树,六年级浇了30棵,三年级比六年级浇的少一些。
燃气环境内高温部件红外测温试验方法
收稿日期:2020-11-26基金项目:航空动力基础研究项目资助作者简介:苏文超(1989),男,硕士,工程师,从事航空发动机红外测试工作;E-mail :****************。
引用格式:苏文超,彭新,刘春宇,等.燃气环境内高温部件红外测温试验方法[J].航空发动机,2023,49(1):163-168.SU Wenchao ,PENG Xin,LIU Chunyu ,et al.Method of infrared temperature measurement of high temperature components in gas environment[J].Aeroengine ,2023,49(1):163-168.燃气环境内高温部件红外测温试验方法苏文超1,彭新2,刘春宇1,马慧1,张哲衡1,初少斌1,吴云1(1.中国航发沈阳发动机研究所,沈阳110015;2.空军装备部驻沈阳地区第二军事代表室,沈阳110043)摘要:针对航空发动机加力燃烧室高温部件温度场测试精度不高的问题,提出了一种燃气环境内高温部件红外测温试验方法。
在同一时刻,分别用配装3.97~4.01μm 窄带滤光片的红外热像仪和K 型热电偶测试了燃气环境内高温部件在8种不同状态下的壁面温度分布,并对测试结果进行了对比,根据K 型热电偶测试结果引入红外热像仪测试结果综合修正系数。
结果表明:所引入的综合修正系数可有效地修正表面发射率、高温燃气、蓝宝石玻璃窗口以及环境大气等因素在不同温度条件下所带入的测试误差,经修正后红外热像仪和热电偶之间的测试偏差可控制在1.5%以内。
该方法为后续航空发动机加力燃烧室高温构件温度分布测试提供了一种方法和思路。
关键词:高温部件;温度修正;红外热像;燃气环境;加力燃烧室;航空发动机中图分类号:V264.3文献标识码:Adoi :10.13477/ki.aeroengine.2023.01.024Method of Infrared Temperature Measurement of High Temperature Components in Gas EnvironmentSU Wen-chao 1,PENG Xin 2,LIU Chun-yu 1,MA Hui 1,ZHANG Zhe-heng 1,CHU Shao-bin 1,WU Yun 1(1.AECC Shenyang Engine Research Institute ,Shenyang 110015,China;2.Second Military Representative Office of Air ForceEquipment Department Stationed in Shenyang Area,Shenyang 110043,China )Abstract :To tackle the low accuracy problem of temperature field measurement for high temperature components in aeroengine after⁃burner,an infrared temperature measurement test method for high temperature components in gas environment was proposed.Infrared ther⁃mal imager equipped with 3.97to 4.01μm narrowband filter and K-type thermocouples were used to measure the surface temperature dis⁃tribution of high temperature components simultaneously under 8different conditions in the gas environment.The measurement results of the infrared thermal imager were compared with that of the thermocouples,and comprehensive correction coefficients for the infrared ther⁃mal imager were derived according to the results of the thermocouples.The results show that the coefficients can effectively correct the mea⁃surement errors caused by surface emissivity,high temperature gas,sapphire glass window,and ambient atmosphere.After the correction,the deviation between the results of the infrared thermal imager and the thermocouples can be controlled within 1.5%.The correction meth⁃od provides a valuable reference for subsequent measurement of temperature distribution of high temperature components in aeroengine af⁃terburner.Key words :high temperature components;temperature correction;infrared thermal imager;gas environment;afterburner;aeroengine 第49卷第1期2023年2月Vol.49No.1Feb.2023航空发动机Aeroengine0引言加力燃烧室是军用航空发动机核心部件之一,其内部各构件在工作时处于高温燃气环境中,承受的热负荷较高,常常会产生热变形和烧蚀问题[1],从而导致加力燃烧室无法正常工作。
注塑中英文对照

不良标签标示单整理整顿清扫清洁教养安全来料不良刮伤压痕螺栓热注射成型控制面板显示器安全门注射座螺杆料膛加热圈喷嘴定模板动模板成型机顶杆手动操作半自动操作全自动操作料膛清洗上料机温调机控制模具温度,保持在设定温度以内的温度控制设备参数监控画面对设备具体参数设定的画面,一般配有图表生产管理画面模板控制画面顶出控制画面加热管理画面注射速度画面注射压力画面保压控制画面计量控制画面报警显示画面最大高度最小高度能满足成型机性能的最小模具厚度锁模力锁模系统控制系统抽芯距白化制品破坏前变形引起的颜色差异缩痕收缩差异熔接线亮线冷熔接困气烧伤黑斑料纹烧焦色差脆化蠕变位移分层表面剥离三角洲效应方向收缩尺寸变化尺寸稳定性密度翘曲变形迟滞垂直于流动方向的收缩热变形温度脱模脱模斜度脱模困难内应力长链高分子凝固层比例取出粗加工伺服马达工序塑料件注射模斜销斜滑块悬臂搭扣连接模套型芯支架推块推杆推板复位杆扇形浇口浇口镶块圆柱头推杆扁顶杆连接推杆导套导柱浇口浇口长度浇口位置嵌件楔紧块凹模凹模拼块定模座板顶出系统设计顶出时间推板导套推板导柱冷料穴公模面模具温度支撑板隔板掏空型心拼块强度设计型芯固定板斜度母模面动模面斜槽导板推杆固定板弹性模量模具的 弹性变形加热圈定距拉板热流道板水平分型面热流道模具热塑性塑料注射模垫片拼块限位块限位丁浇口镶块钩型拉料杆球头拉料杆标准模架滑块煤油定位工作台车间故障低碳钢修正包装面板绘图机装模工花键条形码操作员课长外观检查内部检查前面板后面板电源按键工作间品质管理部门机械手车床工业酒精生锈换模装模修模到角淬火回火退火套筒无流道首件确认特采电极稳定性好气阀斜顶锁模块压条二板模三板模热嘴快接头扭距样品变形疲劳延展性翘曲熔接线脱模困难扭曲留痕鱼眼疲劳龟裂现象缩痕冻结浇口固化喷泉流动自由收缩中心趋向热熔接平均温度平均速度回流计量背压料筒溢料共混凸台分流道计算机辅助工程充填基本流动方式悬臂式卡扣毛细管流变仪型腔压力型腔 压力曲线中心温度热膨胀系数位移分布可压缩冷却效率冷却过程冷却速率冷却速度冷却阶段冷却系统冷却时间冷却水管锥板式流变仪冷却模拟冷却通道模面温度差分布弧制品产品轴钳工工作坯料黄铜毛刺铸钢压板轮廓制图点火花加工电极套管装配工磨光硬度应力集中应力断裂应力松弛应力集中源应力应变特性浇注系统纤维增强性材料纤维添加剂流动充填方式充填过程充填速率充填阶段充填时间注射力体积弯曲流动平衡流动控制流动长度流长比流动趋向流动模拟圆形流道三角筋半圆形流道热传导系数热传控制热传导速率冷却水管配置方式 玻璃化转变温度静置段冲击强度模内收缩流动方向的收缩率注射压力注射速度注射系统模内压力定压冷却阶段各向同性坚韧体积收缩率体积特性体积收缩率体积收缩 率分布长径比长度—厚度比线性收缩长期载荷隔热板热应力壁薄件螺纹型心螺纹型环熔体波前熔融指数成型温度计量区熔体流动速度微观结构带圆角的梯形流道再吸水模内收缩模具温度高分子链分子链的取向分子质量分布锥形定位件模架(注射模)塑料成型模具热塑性 塑料模具热固性塑料模具开模力模板闭合高度成型压力活动镶件动模动模座板多点进浇牛顿流体非牛顿流体喷嘴压力曲线过保压保压模拟保压流动保压压力保压过程保压阶段保压时间潜流效应冷却不均均匀度阀式浇口排气槽壁厚过度区域模具加工精度梯形流道护耳浇口絮流圆柱形塑料制品超声波焊接平头螺钉平行板流变仪制品装配制品设计制品尺寸制品收缩制品刚度制品强度制品顶出温度制品壁厚制品公差流道重量分型面点浇口塑料制品塑化平板型塑料制品脱膜后定压冷却入口压力压力控制压力差压力分布压力变化过程压力-体积-温度 关系成型循环加工参数投影面积赛马现象矩形流道增强增强成分增强筋筋筋的形状环行浇口流道浇道平衡流道截面积流道直径流道尺寸流道长度流道板份流道拉料杆螺杆旋转推流道板流道系统流道系统布局无流道模具封口压力半结晶型塑料半结晶齿壮设定的注塑压力曲线轴剪切剪切率切应力切应力分布剪切变稀特性短射短期载荷注射能力带肩推杆收缩率收缩收缩变形翘曲模拟收缩应力收缩空洞侧型心滑块导板银纹单浇口或多浇口表面层搭扣配合连接固化层,凝固层主流道浇口套拉料杆圆锥头拉料杆状态方程式阶跃式变化吸水程度吸水性塑料容积温度纤维素结晶型塑料玻璃纤维玻璃态低密度聚乙烯力学性能共塑物热物理特性热塑性塑料耐冲击聚苯乙烯黏度粘滞加热粘弹性交联结晶膨胀比热比体积热卡特性温度梯度热通量结晶热融化相变热高弹态热点相变温度熔点晶格英文术语qualitytolerancedefective product label identifying sheet listSeiriSeitonSeiketsuSeisoShitsukeSafedeficient purchasescratchdentsboltthermoplastic injection molding contorl platpro-facesaft doorenjection blendscrewfabbrelheaternozzleplammoving plamejector pinmansengle manautopurgeloaderproduct menutplam controlejector controlheat controlspeed controlfulling pressure controlpacking pressure controlexcit controlalarm viewmaximum daylightclamping forceclamping systemcontrol systemcore-pulling distancecore-pulling forcehydraulic systemshort shotjettingshrinkageasymmetric shrinkagelinescolor changeCold weldingair trapsburnblack specksblack streadsburn marksdiscolorationbrittlenessCreepDisplacementdelaminationdelta effectdiectional shrinkagedimensional variation dimensional stabilityDensitywarpagedistortionhesitationcross-flowshrinkagedeflection temperatu re demoldingdraftejection difficultiesinternal stresslong chain macromoleculesfrozen layer fractionremovalrough machiningservomotorworkstageplastic partsinjection mouldangle pin / finger camangled-lift / splitscantilever snap jointschase / bolster / frame Coreejector housing / mould base leg ejector padejector pinejector platepush-pack pinGate dimensions(sizes)disk gateedge gatefan gategating insertejector pin with cylindrical head flat ejector pinejector tie rodguide bushguide pillargategate lengthGate locationinsertheel lockcavity platecavity splitsfixed clamp plateejection system designejection timeejector bushingejector guide pillarcold-slug wellmale mold facemold temperaturebacking plate / support plate bafflecore outcore splitsDesign for strengthcore-retainer platedraft angleFamale mold facedynnamic mold facefinger guide plateejector retainer plateelastic moduluselastic deformation of toolheaterpuller plate; limit platehot-runner manifoldhorizontal parting linehot runner mouldinjection mold for thermoplastics gasketsplits(of a mould)stop blockstop pingating insertsprue puller,z-shapedsprue puller, ball headedstandard mould basescam slidestripper platesubmarine gatesupport pillarmould insertkerosenelocatemachine tablemachine shopmalfunctionlow carbon steelmodificationpackpanelplotterpress settersplinebarcodeoperatorsupervisorcosmetic inspectinner parts inspectfront platerear platepower buttonwork cellQC Sectionrobotlatheiudustrial alcoholrustdie changeto fix a dieto repair a diereverse angle = chamfer quenchingtemperingannealingsleaveRunner lessFAA first article assurance L/N Lot Number 特copper electrodegood stabilityvalvesangle from pinlock plateplate2-plate mold3-plate moldhot spruejiffy quick connector plug torquesamplecause analysisdefective productflashjettingdistortionfatigueductileWarpageweld lineejection difficultiestorsionflow marksfish eyesfatigueenvironmental stress crackresistancesink marksfreezegate freeze-offFountain Flowfree shrinkagecore orientationhot weldingAverage Temperatureaverage velocityback flowback pressurebarrelbleedingblendBossesBranched runnersCAE(computer aid engineering)Basic Flow Pattern in FillingCantilever snap (hook)Capillary viscometerCavity pressurecavity pressure profileCenter Temperaturecoefficient of thermal expansion displacement distributioncompressiblecooling efficiencycooling processcooling ratecooling rateCooling stagecooling systemcooling timecooling channelcone-and-plate viscometercool simulationcooling channel / cooling linedistribution of mold temperature difference cushionsectionapertureapplied loadsarcarticleaxisbench-workblankbrassburrcast steelclampcontourdrawingelectrochemical machining electrodeferrulefittergrindinghardnessStress concentrationstress crackingstress relaxationstress risersStress-strain behaviorfeed systemfiber-filled polymersfibersfillerfilling patternfilling processfilling ratefilling stagefilling timeejection forcefree volumeFlexuralflow balanceflow controlflow lengthflow length to thicknessflow orientationflow simulationFull-round runnerGussetsHalforound runnerheat transfer coefficientheat transfer controlheat transfer ratelayout of cooling channels Glass Transition Temperature,Tg holding stageholding timeImpact strengthin mold shrinkagein-flow shrinkageinjection pressureinjection speedinjection systemintemal mould pressure/cavity pressure isobaric coolingisotropictoughvolume shrinkagewolumetric Propertiesvolumetric shrindagevolumetric shrindage distribution, length-to-diameter ratiolength-to-thicknesslinear shrinkageLong-term loadthermal insulation boardthermal stressthinner walled partthread plug / threaded corethread ring /threaded cavitymeltmelt front (Advancement)melt index,MImelt temperaturemetering zoneMFRmicrostructureModified trapezoidal runnermoisture reabsorptionmold shrindagemold temperaturemolecular chainmolecular Chain Orientationmolecular weihght distribution,(MWD) mould ases locating elementsmould basesmould for plasticsmould for thermoplasticsmould for thermosetsmould opening forcemould platemould shut heihgtmoulding pressuremovable insert ,loose detailmovable mould / moving mouldmoving clamp plate / bottom clamp plate multiple gatingNewtonian fluidnon-Newtonian fluidNon-uniform Shrinkagenozzle pressure profileoverpackpack simulationpacking flowpacking pressurePacking ProcessPacking stagepacking timeunderflow effectuneven coolinguniformityvalve gatevent (of a mould)wall thickness transition regionstool tolerancesTrapezoidal runnertube gateturbulancecylinder-like partsUltrasonic weldingpan-head screwsparallel-plate viscometerPart AssemblyPart desingnpart dimensionPart ShrinkagePart StiffnessPart Strengthpart temperature at ejection/ejection tem Part thickness,thinkness of partPart Tolerancepart weightparting linepin-point gateplastic partsplasticizationplate-like partspost mold isobaric coolingPressure at the entrancepressure controlPressure differencePressure |DistributonPressure Historyprssure-volume-temperature relationship PVT process cycleprocessing parametersprojected arearace trackRectangular runnerreinforcedreinforcement contentreinforcing ribrelaxationResidual stressReynolds numberRheologyRibRib geometryring gaterunnerrunner balancerunner cross sectionrunner diameterrunner dimensions (sizes)runner lengthrunner platerunner pullerScrew rotation speedrunner stripper platerunner systemrunner system layoutsrunnerless mouldsealing pressuresemi-crystalline polymerssemi-crystallineserrationsSetted injection pressure profile shaftShearshear rateshear stressShear Stress Distributionshear-thinningshort shotshort term loadshot capacityshouldered ejector pinshrinkage rateshrinkageshrindage &warpage simulation shrinkage stressShrindage voidsslide coreside guide pinSilver streaksSingle vs.multiple gatesskin layersnap-fit Jointssolidification layerspruesprue bush / sprue busingsprue pullersprue puller,conical headedstate equationstep changeswitch-over positionthermal degradation temperature Amorphous polymersdegree of crystallinity degree of moisture absorption hygroscopic polymersBulk temperatureCA(Cellulosics)crystalline polymersGF (glass-fiber)glsaay stateLDPE (Low Density Polyethylene) mechanical performancecpolymerThermophysical Properties thermoplasticsHIPS(high impact polystyrene) viscosityviscous heatingViscoelastic behaviorcross-linkcrystallineswellSpecific HeatSpecific VolumeCalorimertric properties temperature gradientheat fluxHeat of CrystallizationHeat of Fusionheat of phase transitionHigh elastics satatehot spotTransition TemperatureMelting Temperature/TMlattice通用翻译满足或高于消费者期望的产品综合质量保证质量前提下允许尺寸的波动范围表明制品,不良或不合格内容的小说明表明制品,物品,地点等特性或作用的小说明必要与不必要的物品分开处理物品分门别类,按规定摆放并标识去除赃污防止再次发生将整理、整顿清扫制度化、标准化人人按照规定和制度行事,养成良好习惯自身安全,他人安全和设备安全上一工序的产品质量不符合本工序质量要求在制品表面因手或其它物体摩擦形成的影响制品外观质量的现象由于重力或压力引起接触面的痕迹,可影响外观美观起固定作用的栓件通过加热使物料熔化在注射到模具内形成期望的制品对设备参数控制的简易操作平台显示设备必要信息的屏幕防止事故发生,增大安全系数的保护装置门注射成型机组成部件,支撑并协助注射的金属平台起旋转计量作用的螺纹状部件.是成型机的核心机械件树脂预塑的炮膛状部件,和螺杆配合俎件质量要求较高围绕在料膛周围,起迅速并均匀加热作用的片状加热器连接注射成型机料筒与模具浇口套接触的像针头状的组件可固定模具在成型机上的铁板,是成型机的一部分成型机曲臂连接板,使模具固定在成型机上做开合模运动的动模板连接到模具上控制模具顶杆顶出或回退作用的连接杆只能手动单一步骤状态操作可半自动状态操作根据设置的程序在全自动状态动作一般用PE料做射出动作来清除或淡化料膛内物料或颜色在料杯树脂不足在传感器监控下吸取储备树脂的成型辅助设备在全自动生产状态下对产品质量和数量控制的页面模板动作状态控制页面顶出动作状态控制画面材料加热控制画面注射过程中对速度控制的画面注射过程中注射压力控制画面注射后保持设定压力提高制品质量的控制画面计量尺寸和相关参数控制画面设备动作异常或监控报警预览成型机模板打开的最大尺寸成型过程中为保证动,定模相互紧密配合而需施加的在模具上的力模板控制系统,注塑机上系统的一部分计算机通过检测、处理信息并重新输入计算机进行控制相关参数将侧型心抽至不防碍制品脱落的滑块滑动的距离从模内的成型塑件中,抽拔出侧型心所需要的力生产每个制品的时间或是单位时间内生产制品的个数液压动力注射机上的压力系统由于一次注射压力不足或速度偏低引起的浇不足现象材料水份超标,结构不良引起的表面气泡等不良现象热熔体在收缩情况下表面会形成凸凹状现象的统称制品厚度不均匀或分子排列不同引起的不均匀收缩两股或多股熔体结合位置形成的线状痕迹一种有明亮痕迹的注塑成型缺陷,一般为线状少为带状低温区域的熔接,多见于冲填结束,不同塑料熔前交汇造成又称包气,熔体流动将气体堵住或包住不能及时排出填充时模具内部气体不能迅速排出产生压缩高温,导致制品局部变色注射成型过程中因高温或树脂分解等原因引起的黑色不良现象树脂在模具腔内流动时由于层流因素引起的外观不良现象因高温引起的成型缺陷的一种制品本身颜色有其他杂质颜色混入形成的不良现象成型缺陷(因树脂性质发生变化引起的脆化或者破裂)高聚物在恒定温度和应力下,长度随时间延长而逐步深长的现象熔体内部压力差引起高压部份向低压部分推移现象,可产生层次感同一树脂或不同树脂发生层流后产生的 现象局部温度差由大分子链排列引起的具有方向特性的收缩生产出的制品在不同的环境下都会产生尺寸的变化制品尺寸的稳定性和一致性单位体积的质量有多种原因引起的变形现象,如收缩翘曲,配向翘曲等产品在内应力或外力的作用下产生的尺寸变化以及形状变化熔体的某一部份发生停止流动或极缓慢流动的现象发生在垂直于熔体流动方向上的收缩热力的作用下,塑料可以发生变形的温度保压后制品在模具内部成型完毕脱离模具的现象方便成型制品脱离模具而设计的角度成型制品不容易脱离模具的现象残留在制品内部因各种原因产生的应力很多小分子连接而成的具有较大质量的长分子连熔体在模具内冷却状态之一的数学表示方法成型后制品拿出的过程毛坯加工或留有大量余量的待加工品配合CPU工作的马达完成一个组件或产品经过的步骤以塑料为原料生产的制品通过注射方式成型的模具倾斜于分型面、随模具的开闭产生相对运动的圆柱零件斜向镶块或滑动的镶块组合方式之一使镶件或拼块定位并紧固在一起的框套形结构零件成型模具内表面突起的组件使动模能固定在压机或注塑机上的L型垫块在腔内起部分成型作用,并在开模时把塑件从型腔内推出的零件用于推出塑件或浇注系统凝料的杆件支撑推出和复位零件,直接传递机床推出力的板件借助模具的闭合动作,强制推出机构复位的杆件浇口的相关尺寸熔融塑料经主流道直接进入型腔的进料方式沿塑料件内圆周扩展进料的浇口设置在模具的分型处 从塑件的内或外侧进料的方式从分流道道型腔方向的宽度逐渐增加的呈扇型的浇口浇口以镶块的形式存在推杆的一种,头部形状是圆柱型形工作截面为矩形的顶杆连接推件板与推杆固定板,传递推力的杆件与导柱相配合,用于初步确定模具起导向作用的部件,一般为圆柱体连接分流道合型腔的进料通道浇口的长度树脂流入模腔的点相对整体模腔的位置成型中埋入或随后压入塑件中的金属或其他材料的部件带有楔角,用于合模时楔紧滑块的零件成型塑件外表面的凹壮零件(包括零件的内腔和实体两部分)母模中的镶件拼块使定模固定在注塑机的固定工作台面上的板件 是模具的基座顶出制品机构的类型,布置方式的设计 包括模具和成型机两部分制品脱离模具可安全取出的时间与导柱滑配合,用于推出机构导向的圆柱形零件与推板导柱滑配合,用于推出机构导向的圆柱形零件在浇口流道末端用于储藏低温熔体的槽指凸模面或是动模面注射成型使用的模具的实际温度或设置温度支撑模具芯体和其它运动结构的板状模块为改变蒸汽或冷却水的流向而在模具内部设置的金属条或板将制品的一 部分设计成掏空的部分凸模中的镶拼件,一般成型出制品内表面的某个部分对应制品使用环境要求而设计的强度用于固定型心的板状零件为了方便出型或脱模设计的斜度指凹模面也叫定模指凸模面也叫公模具有斜导槽,用以使滑块随槽动作抽芯合复位动作的板状零件用于固定推杆位置,使其不发生位置变化的压板衡量材料产生弹性变形难易程度的指标模具在行腔压力下发生的弹性变形用于加热使用的环行加热部件在开模时限定某一板动作距离的板件为开设分流道设置的加热元件,保持融料的温度立式成型机中,模具天地开模(上下),分型面为水平状态也称无流道,浇口料在模具内部保持熔融状态的模具热塑性材料使用的注射成型模具调整高度使用的薄金属片按设计和工艺要求,用以拼合模具型腔或型芯的零件限制活动范围的零件限制位置的丁状零件以浇口形式存在的镶块形状像钩子,起拉料作用拉料部位呈圆型的零件但不是规范的圆形通用并具有互换性的模架可以滑动,带动侧型心完成出型,抽芯和复位动作的零件直接推出塑件的板壮零件起局部或整体推出塑件作用的环行或盘型零件位置不明显,一般可自动剪切的浇口为增强动模的钢度设在动模支撑板和动模座板之间的支撑零件在工艺上便于加工或修理与主体部件分开制造的局部零件石油提炼出的油脂,一般在模具行业中清洗附着的分解物或异物固定在要求位置操作或加工的区域,可能是安全区域也可能是非接触区域.工作的场合,一般指一线工作人员的工作区域而非文件处理办公室影响机械设备正常工作的现象含碳量在0.10%至0.30%之间,也称为软钢一般指在接近标准的基础上进行小尺寸的修改以达到更高的要求为了美观或防止潮湿,灰尘,碰伤等采取的保护措施多指可视或裸露在外面的并起到遮盖作用的部件可联网专用于绘制图纸的机械组装并研磨模具的工人齿轮状起到连接固定作用的部件用于储存部件相关信息的条状代码使用或控制机械设备人员外来语,日本,韩国称为课长,中国一般称科长对制品外观质量目视或测量的过程对制品内部质量目视或测量的过程组件前部或正对着使用者方向的部件组件后部或背向使用者方向的部件控制电源开启或关闭的按键小型工作车间或有几个人协作完成的一道工序的线体品质控制和管理的部门,国际上多与生产分开管理代替操作人员手动工作的半自动或自动机械设备用车刀对对旋转的工件进行车削加工的机床可以导致人体中毒的甲醇模具因潮湿和空气中的氧气发生的一种化学反应成红赫色物质换模就是切换其它模具,将原来的模具卸下换上另一副开机生产前将模具使用手动或机械自动夹持在成型机上一种对模具非正常状态进行处理并修理到正常状态的过程为了防止金属锐利的角划伤或使外形美观将锐角去处的一种方法提高钢强度和硬度的一种工艺方法淬火后一般都经过回火,可提高组织稳定性生产中常用的预备热处理工艺中空的小管,和套筒芯组成组件形成孔,顶出时只有套筒动作即热流道,熔体不形成冷却废弃的材料,在模具内保持熔体状态对生产的第一个制品进行外观检查或组装等实验,确保可继续生产在不防止阻碍制品正常应用的条件下被允许生产的托词铜制品,在电加工上对坯放电造型质量在允许范围内波动控制气体的阀与推板动作方向不一直的顶杆防止模具在运输过程中打开的锁紧件固定相关组件的条状零件无中间板的模具,看模后只见两个板有中间板的模具,可见三个板可加热的端口区域实现快速连接的接头扭转变形时,内力偶距称为扭距可代表综合质量的个别产品通常采用人,机,料,法,环来剖析问题的过程符合质量规定的产品不符合质量规定的产品在模具缝隙中形成的不良现象,片状的称为飞边树脂熔体形成泉流后在制品表面形成的不良现象由于收缩和其它原因引起的形状变化高聚物材料在长期应用情况下所表现出来的特性可锤炼可压延的程度,材料特性之一由于非均匀收缩或分子排列等引起的抽曲熔体相遇后在连接位置形成的不良现象制品脱落时发生的困难一种载荷类型注塑成型缺陷的一种包括料留痕,气留痕和型腔结构留痕注射成型缺陷的一种,表面有颗粒状物质高聚物材料在长期应用情况下所表现出来的特性由于内应力的存在发生的制品段列,裂纹现象熔体遇冷后产生的收缩现象大分子链停止运动,熔体开始凝固浇口中的熔体由流动到冷却静止的过程像泉水涌出,中间层熔体向两侧翻出的现象在常温常压以及不受载荷时发生的自由收缩现象注塑成型工艺中的有一个重要参数熔体分流后再次融合的一起的现象不同测控点的温度平均值熔体在流动时候速度的平均值由于不同区域压力差引起的熔体倒流现象树脂在计量时候形成推动螺杆向后移动的压力树脂计量时的外部部件,与螺杆配合进行计量融体在充填或保压时刻发生熔体溢出的现象聚合物该性方法的一种呈突起状区域,具体作用与设计相关流道系统的一部分,与主流道相连的小流道分支计算机模拟流动,保压,变形,气辅等模拟手段融体在充填时流动的基本模式类是于“ 7 ” 型的钩子妆连接方式测量流体黏度的测量仪器熔体填充到模具内部时,模具内的压力以曲线的形式描绘出腔内随时间,速度变化的压力曲线制品中心层处的温度单位长度的材料温度每升一度的伸长量制品各个部分尺寸的线形伸长或缩短的分布情况塑料在不同的温度下体积发生变化的现象单位时间内带走热量多少的度量塑料冷却的全过程熔体冷却的速度塑件冷却的速度成型周期的一部分,制品冷却直至可安全取出用于冷却塑件的系列冷却装置以及布置方式塑件从保压开始一直到顶出的一段时间用于冷却塑件分布在模具外部的水路一种流体的黏度测试仪器CAE辅助分析的一种,用于模拟冷却过程设计在模具内部的冷却液通道,用以控制所要求的模温制品的两个和模具接触表面的温度差分布情况保压后螺杆所剩余的计量长度塑料制品壁部的厚度变化断开的端面起到组装或固定作用的孔(不一定是圆形)实际载荷或受力直线的过度联系常使用的弧,可以起到加强或美观的作用物品,制造生产的部件应用在不同环境下的轴,可起到对称基准或连接等作用研磨,组装,修理模具等工作没有进行细致加工的原材料由铜和锌组成的合金尖锐的比较小的突出部分用于浇注铸件的钢用于固定模具的夹具造型艺术术语,指界定表现对象形体范围的边缘线给予说明加工尺寸或外观图纸制作过程一种采用高压放电对金属部件加工的工艺铜材料,用于放电加工的阴模,放电加工完毕后被加工部件形成阳模筒装管子组装研磨工人研磨抛光材料局部抵抗硬物压入其表面的能力在应力的情况下出现在应力聚集的现象在应力的情况下发生断裂在恒温和应变情况下应力随时间延长而减小的情况产生 应力集中的区域应力发生变化的特点由喷嘴到型腔之间的进料通道组成包括主,分,浇口合冷料穴为了提高或降低某中特性在塑料材料中添加了其它成分高分子材料的一种添加到高分子内部改善塑料有关性能的成分填充过程熔体流动的各种形式熔体填充到模具的整个过程单位时间内添入模腔的熔体量熔体填充到模具阶段熔料充满型腔所用的时间严格上讲包括保压填充时间熔体从料膛注入模具内所需要的力一定量的熔体材料占据空间的部分一种可发生弯曲的载荷类型熔体填充到模具内流动均匀性的一种表现形式螺杆速度及压力控制模具腔内熔体的体积流量形式熔体流过的长度壁厚与熔体流动距离的比塑料在流动或冷却的过程呢中,发生在分子链定向的一种行为CAE辅助分析虚拟流动的一种方式截面为圆形的流道三角形状起到加强或者支撑作用的筋等截面的形状为半圆形的流道将热量从热的地方向冷的地方传导速度的量度控制热量传导的仪器设备单位时间内热能传递的量度冷却水管在墨菊内部布置和排列的方式粘流态树脂冷却成玻璃态时刻的温度Pack结束后,螺杆基本静止不动而维持压力不便的阶段填补收缩时保持设置压力的时间盛放待加工树脂塑料的容器。
航空发动机高温合金叶片热力耦合性能分析

航空发动机高温合金叶片热力耦合性能分析摘要:在确立高温叶片的传热理论的基础上,依据有限元理论利用Abaqus软件对GH4169合金叶片终锻后的冷却过程中的进行了热力耦合数值模拟,通过观测到的数据分析了冷却过程中温度场的分布规律和冷却后应力分布以及叶片的变形规律。
关键词:高温合金;航空发动机叶片;冷却;热力耦合性能中图分类号:文献标志码:文章编号:在航空发动机工作时,内部叶片需要承受十分高的温度载荷,但温度变化对金属叶片的性能有重要的影响[1]。
在高温冷却的过程中,叶片的形状会因为温度变化而发生形变,产生的残余应力会使叶片的质量和使用寿命降低,这种由高温引起的形变难以用传统的实验方法测量,但数值模拟就可以很直观的表现出来[2]。
本文分析在冷却过程中叶片所受的温度场的变化,热应力的变化以及变形规律,为叶片高温锻造后的热处理和终锻磨具的设计提供理论依据。
1传热理论及模拟条件1.1热传导方程热传导微分方程的建立是以热力学第一定律为依据的,假设材料导热各项同性,热传导的基本方程为[3]:(1)(1)式中:T 微元体瞬时温度为K;代表材料密度,单位为kg/m3;材料比热,J/(kg·K);t 为时间,s;k为热传导系数,单位W/(m·K);q为内热源强度,J/ m3。
1.2初始条件与边界条件假设叶片的初始温度的特征是均匀的并且数值设定为1000℃,叶片周围的环境温度设定为25℃,叶片与环境的热交换形式为对流,将对流换热边界条件归结为第三类边界条件[4]。
在对流系数的求解过程中,设叶片温度变化过程函数为:5(2)(2)式中:k,a为该点系数。
2有限元分析模型建立2.1材料属性的定义本课题中使用的叶片模型所选取的材料为In718高温镍基合金(GH4169合金),此高温合金的热力学性能参数和力学性能参数为:熔化温度为1260~1320℃、弹性模量为9800MPa、密度为8230kg/m3、泊松比为0.4,导热率、比热和线性膨胀系数随温度的变化而变化。
《2024年航空发动机气冷涡轮叶片的气热耦合数值模拟研究》范文

《航空发动机气冷涡轮叶片的气热耦合数值模拟研究》篇一一、引言航空发动机是现代航空器的“心脏”,其性能直接影响飞行器的运行效率、安全性及使用寿命。
作为航空发动机关键部件之一,气冷涡轮叶片的工作环境极端复杂,涉及到高温、高压、高速度的气流冲击,因此其性能的优化和设计至关重要。
近年来,随着计算流体动力学(CFD)技术的不断发展,气热耦合数值模拟技术为航空发动机气冷涡轮叶片的设计和优化提供了新的方法和手段。
本文旨在研究航空发动机气冷涡轮叶片的气热耦合数值模拟技术,为航空发动机的研发和改进提供理论支持。
二、研究背景及意义随着航空技术的快速发展,航空发动机的性能要求越来越高,特别是在高温、高压、高速度的工作环境下,对气冷涡轮叶片的耐热性能和强度性能提出了更高的要求。
传统的试验方法在研发过程中耗时耗力,成本高昂,而气热耦合数值模拟技术能够在不进行实际试验的情况下,预测气冷涡轮叶片在极端工作环境下的性能表现,为设计优化提供理论支持。
因此,研究航空发动机气冷涡轮叶片的气热耦合数值模拟技术具有重要的理论意义和实际价值。
三、研究内容本研究采用气热耦合数值模拟方法,对航空发动机气冷涡轮叶片的流场、温度场及应力场进行综合分析。
具体研究内容包括:1. 几何建模与网格划分:根据实际气冷涡轮叶片的几何形状,建立精确的三维模型,并进行网格划分。
网格的质量直接影响到数值模拟的精度和计算效率,因此需要采用合适的网格划分方法。
2. 边界条件设定:根据实际工作情况,设定气冷涡轮叶片的进出口边界条件、热物理参数等。
3. 数值模拟方法:采用计算流体动力学(CFD)方法,对气冷涡轮叶片进行流场、温度场及应力场的数值模拟。
在流场分析中,考虑气体的可压缩性、湍流效应等因素;在温度场分析中,考虑气体与叶片之间的热交换过程;在应力场分析中,考虑温度梯度引起的热应力。
4. 气热耦合分析:将流场、温度场及应力场进行气热耦合分析,研究气冷涡轮叶片在高温、高压、高速度气流冲击下的性能表现。
浅谈航空飞行器中的热环境和热结构问题 1100200330 陈鸿威
Harbin Institute of Technology热环境控制大作业题目:浅谈航空飞行器中的热环境和热结构问题院系:能源学院班级: 1002104 姓名:陈鸿威学号: 1100200330哈尔滨工业大学浅谈航空飞行器中的热环境和热结构问题1100200330 陈鸿威摘要:为了对超高空低速飞行器的热环境特性进行分析,建立了超高空低速飞行器的热环境分析模型。
通过数值模拟研究了热辐射和对流对超高空低速飞行器热环境特性的影响。
研究结果表明,飞行器表面吸收辐射比越大,气流速度对超高空低速飞行器热效应的影响越大;飞行器表面辐射物性的变化可使飞行器蒙皮温度改变70 K。
热辐射和对流换热均对飞行器的热特性有重要影响,飞行器蒙皮温度存在非均匀性并随时间变化。
高超声速飞行器热结构设计分析的关键技术及其发展趋势:(1)高超声速飞行器瞬态表面温度和气动加热率计算技术;(2)流-热-固多物理场耦合机理模型技术;(3)流-热-固多场耦合计算分析技术;(4)高超声速飞行器热防护结构设计技术。
关键词:航空飞行器,热结构,热环境控制,热辐射,超音速飞行等。
超高空低速飞行器主要靠浮力提供升力, 可长期驻留高空或低速飞行, 在情报侦察、预警、导航、通信中继及大气环境监测等领域有广泛的应用前景。
高速航空器(如飞机)飞行速度很大, 高速对流换热是影响其热特性的主要因素,而外部热辐射的作用很小。
近地轨道航天器的主要热环境因素是太阳辐射、地球对太阳的反射和地球红外辐射, 几乎没有外部对流换热。
超高空低速飞行器主要有飞艇和高空气球两大类。
其环境热效应是对流和热辐射综合作用的结果。
大气物性和温度等参数随高度大幅度变化。
太阳热辐射昼夜变化。
从而影响超高空低速飞行器蒙皮和气囊中气体的温度。
超高空低速飞行器蒙皮的辐射物性影响其吸收的外部辐射和本身辐射。
超高空气流速度变化影响飞行器外部的对流换热。
研究超高空低速飞行器的热环境特性对超高空低速飞行器的研制有重要意义。
二氧化硅气凝胶隔热复合材料的制备与应用
Vol 133No 13・46・化工新型材料N EW CH EMICAL MA TERIAL S 第33卷第3期2005年3月作者简介:董志军(1973-),男,讲师,在读博士,主要从事纳米功能材料的研究。
二氧化硅气凝胶隔热复合材料的制备与应用董志军1 颜家保1 涂红兵2 宋子逵1 范晓霞1(1.武汉科技大学,武汉430081;2.武钢焦化厂,武汉430082)摘 要 介绍了二氧化硅(SiO 2)气凝胶的结构特点及隔热性能;对二氧化硅气凝胶隔热复合材料的制备方法及其应用前景进行总结并作了适当的评述;探讨了该领域今后的研究方向。
关键词 SiO 2气凝胶,超临界干燥,隔热材料Studying on the preparation and application ofsilica aerogel composites for thermal insulationDong Zhijun Yan Jiabao Tu Hongbing Song Zikui Fan Xiaoxia (1.Wuhan University of Science and Technology.430081;2.Coking Plant of Wuhan Iron and Steel Company ,Wuhan 430082)Abstract The structure feature and thermal insulation property of silica aerogel are introduced in this paper ,then the preparation methods and application perspective of Silica aerogel composites for thermal insulation are summa 2rized and commented properly ,and the research direction in the f uture are also discussed finally.K ey w ords Silica aero 2gel ,supercritical drying ,Thermal insulation material 气凝胶的热传导由气态传导、固态传导和热辐射传导组成。
舱外推进剂管路冗余电加热技术
2018年第5期 导 弹 与 航 天 运 载 技 术 No.5 2018 总第364期 MISSILES AND SPACE VEHICLES Sum No.364收稿日期:2017-07-03;修回日期:2018-08-02作者简介:刘小旭(1983-),男,工程师,主要研究方向为上面级热控设计文章编号:1004-7182(2018)05-0027-04 DOI :10.7654/j.issn.1004-7182.20180506舱外推进剂管路冗余电加热技术刘小旭,邰艳芳(北京宇航系统工程研究所,北京,100076)摘要:火箭在飞行过程中上面级推进剂输送管路长时间暴露于舱外,为确保推进剂温度满足要求,设计了一种主动冗余电加热方法。
通过热仿真分析,设计了合理的加热功率,可以确保一度故障下管路温度仍在可接受的范围内,并通过热平衡试验进行了验证。
验证结果表明:该技术已应用于上面级热控设计中,达到了预期的效果。
关键词:上面级;推进剂;电加热中图分类号:TK124 文献标识码:APropellant Pipe Redundancy Electric Heating TechnologyLiu Xiao-xu, Tai Yan-fang(Beijing Institute of Astronautical Systems Engineering, Beijing, 100076)Abstract: The propellant pipe of upper stage exposed in the space long time, to meet the temperature range, in this paper, it aredundancy electric heating method is designed. A reasonable heating power design method is proposed by thermal analysis. It can satisfy the temperature range when the fault occurs of pipe heating tape. The design method has passed the thermal balance test. This technology has been applied in the upper stage.Key words: upper stage; propellant; electric heating0 引 言火箭、卫星等飞行器中的推进剂输送管路主要用于将贮箱中的推进剂输送到发动机,供发动机燃烧工作,为飞行器飞行提供动力[1]。
基于红外辐射的涡轮转子叶片前缘温度场测量
第29卷第4期燃气涡轮试验与研究Vol.29,No.4 2016年8月Gas Turbine Experiment and Research Aug.,2016严严严严严严严严严严严严严严严严严严严严严严严严严严严严严严严严严严严严严严严严严严严严严严严严严严严严严严严严严严严严严严严严严严严严严严严严严严严收稿日期:2015-09-30;修回日期:2016-01-28作者简介:刘先富(1985-),男,贵州遵义人,工程师,硕士,主要从事航空发动机测试技术研究。
1引言提高航空发动机推重比最直接和最有效的方法之一就是提高涡轮前燃气温度[1-2]。
涡轮转子叶片在复杂的高温、高压环境高转速旋转,必然产生一系列复杂的“热问题”,为保证发动机安全,需要准确测量涡轮转子叶片表面温度,为冷却设计模型的优化提供试验数据支持,提高涡轮转子叶片的安全工作可靠性,延长其寿命[3]。
涡轮叶片表面温度测量方法较多。
常规的热电偶测量方法是在涡轮转子叶片表面开槽,将铠装热电偶埋入涡轮叶片表面,或通过陶瓷涂层将裸偶固定在涡轮叶片表面,利用引电器将温度信号输出,但这种方法存在测点有限、信号引出困难、破坏试验件摘要:根据发动机涡轮转子叶片温度场测试需求,对发动机进行了局部改装,并设计了安装支架,利用红外辐射高温计测量了发动机涡轮叶片前缘及叶盆温度场。
试验结果表明,所有叶片表面温度分布具有明显的规律性——中截面附近区域前缘温度最高、叶盆次之,在前缘和叶盆之间存在一低温区;从前缘到叶盆的叶尖弦向温度呈反S形分布。
各涡轮叶片叶盆存在一椭圆形高温区,该高温区在中截面附近温度最高,沿叶尖和叶根方向延伸并伴随温度递减。
各涡轮叶片前缘温度的高温区都集中在中截面附近约1/3叶高范围,叶尖和叶根温度都较低。
关键词:航空发动机;涡轮转子叶片;温度场;红外测量技术;叶片前缘;叶盆中图分类号:V263.3文献标志码:A文章编号:1672-2620(2016)04-0047-04Temperature field measurement of turbine rotor blade leadingedge based on infrared radiation pyrometerLIU Xian-fu,XIONG Bing,LI Yang,HUI Guang-lin,LI Hua-chen(China Gas Turbine Establishment,Jiangyou621703,China)Abstract:In order to measure turbine rotor blade temperature field of engine,according to the test require⁃ments,the engine was refitted and the testing bracket was designed.At last,the temperature field of the leading edge and concave of the rotor blades was obtained by the infrared pyrometer.The testing results show that the temperature field of rotor blades was regular,the leading edge temperature of blade was the highest,and the temperature of the concave was lower.There was an area of low temperature between the leading edge and the concave of blade.The tip chordwise temperature distribution presents reversed“S”type.In the concave of every rotor blade,there was an elliptical district with high temperature,where the temperature was the highest near the middle section of the blade,then reduced from the middle section of blade to the tip and the root of blade.On the leading edge of blade,the highest temperature focused on prob⁃ably1/3span.The temperature of tip and the root of blade became lower.Key words:aero-engine;turbine rotor blade;temperature field;infrared measurement technology;leading edge of blade;concave of blade47燃气涡轮试验与研究第29卷等缺陷。
飞机客舱地板加热功率及送风温度的反向建模
两者之间的最大温差可达到 4.3 ℃;根据飞机内 域均温达到 26 ℃,上身区域均温达到 24 ℃的舒
部结构设计和热流动情况,客舱内天花板温度相 适区域温度,客舱地板加热功率及送风温度应进
收稿日期: 2018-03-05
基金项目: 国家自然科学基金项目(51708146);广西自然科学基金项目(2017GXNSFBA198148)
Lei Lei1,Xue Yu2
(1.Guilin University of Electronic Technology,Guilin 541004,China; 2.Dalian University of Technology,Dalian 116024,China)
Abstract:Thermal boundary conditions in commercial airliner cabins are crucial for creating a comfortable cabin environment. In order to create a comfortable environment where the average temperature in the foot area of the passengers reaches 26 ℃ and the average temperature of upper body of the passenger reaches 24 ℃ in the cabin,this paper proposed a combined inverse model for designers to determine the total underfloor heating rates and the air-supply temperature in an aircraft cabin. This model contains three sub-models:(i)model for computation of the convective heat rates of the underfloor heaters,(ii)model for solution of underfloor heater’s surface temperatures,and(iii)model for computation of the radiant heat rates.The above model was in a 3D aircraft cabin computation example and a 3D cavity test bench. The research results show that the proposed model can effectively determine the total underfloor heating rates and air-supply temperature,which are in good agreement with the measurement data. Key words:inverse modeling;thermal boundary condition;tikhonov regularization;CFD
飞机短舱加热表面水膜流动分布的数值研究
计算机科学与人工智能河南科技Henan Science and Technology总第801期第7期2023年4月收稿日期:2022-11-30基金项目:陕西工业职业技术学院2021年自然科学类科研项目“涡轮导向器叶片表面侵蚀及性能影响研究”(2021YKYB-054)。
作者简介:马鸿(1990—),男,硕士,助教,研究方向:航空发动机内部流动。
飞机短舱加热表面水膜流动分布的数值研究马鸿(陕西工业职业技术学院,陕西咸阳712000)摘要:【目的】通过对飞机发动机短舱加热除冰时表面水膜的流动状况进行分析,为飞机短舱防冰热系统的设计提供参考。
【方法】本研究以某型飞机短舱为研究对象,并基于欧拉-拉格朗日框架,采用离散模型(DPM )来建立水膜流动过程的数学模型,对短舱加热表面溢流水的溢流范围和水膜厚度变化情况进行分析。
【结果】研究发现,短舱加热表面的水膜厚度呈现出先增大后减小的流动规律,水膜厚度最大为80μm 。
同时,对比水滴的撞击极限位置,短舱加热表面水膜的溢流范围最大为32%。
【结论】受气流驱动,短舱表面水膜出现溢流的现象,研究结果对飞机短舱防冰热系统的设计具有重要参考价值。
关键词:水膜流动;溢流水;数值模拟;UDF 中图分类号:V233.94文献标识码:A文章编号:1003-5168(2023)07-0028-05DOI :10.19968/ki.hnkj.1003-5168.2023.07.005Numerical Study of Water Film Flow Distribution on the HeatingSurface of Aircraft NacelleMA Hong(Shaanxi Polytechnic Institute ,Xianyang 712000,China)Abstract:[Purposes ]The flow of water film on the surface of aircraft engine nacelle during heating andde-icing is analyzed to provide reference for the design of aircraft nacelle anti-icing thermal system.[Methods ]In this study,a certain type of aircraft nacelle was taken as the research object.Based on the Euler-Lagrangian framework,a discrete model (DPM )was used to establish a mathematical model of the water film flow process.The overflow range and water film thickness of the nacelle heating surface were analyzed.[Findings ]It was found that the water film thickness on the heating surface of the nacelleincreased first and then decreased,and the maximum water film thickness was 80μm.At the same time,compared with the impact limit position of water droplets,the maximum overflow range of water film on the heating surface of the nacelle is 32%.[Conclusions ]Driven by airflow,the water film on the nacelle surface overflows.The research results have important reference value for the design of aircraft nacelleanti-icing thermal system.Keywords:water film flowing;overflow;numerical simulation;UDF0引言飞机结冰问题是影响飞行安全运行的一大隐患。
《2024年航空发动机气冷涡轮叶片的气热耦合数值模拟研究》范文

《航空发动机气冷涡轮叶片的气热耦合数值模拟研究》篇一摘要本文主要对航空发动机中气冷涡轮叶片的气热耦合现象进行了深入的数值模拟研究。
首先概述了该研究的目的、方法和主要内容。
通过使用先进的数值模拟技术,对气热耦合现象进行了详细的分析和讨论,并得出了相应的结论。
本文旨在为航空发动机的设计和优化提供理论依据和指导。
一、引言随着航空工业的快速发展,航空发动机的性能要求越来越高。
其中,气冷涡轮叶片作为航空发动机的关键部件之一,其性能的优劣直接影响到发动机的整体性能。
因此,对气冷涡轮叶片的气热耦合现象进行研究具有重要的工程实际意义。
本文采用数值模拟的方法,对气冷涡轮叶片的气热耦合现象进行深入的研究和分析。
二、气热耦合数值模拟方法1. 物理模型与数学描述气热耦合现象涉及到流体动力学、传热学、热力学等多个学科领域。
本文首先建立了气冷涡轮叶片的物理模型,并使用计算流体动力学(CFD)和传热学理论,对气热耦合现象进行了数学描述。
通过建立合理的数学模型,为后续的数值模拟提供了基础。
2. 数值方法与求解过程在数值方法上,本文采用了高精度的有限元方法和有限体积法,对气冷涡轮叶片的气热耦合现象进行了数值模拟。
通过求解流体动力学方程、传热方程等,得到了气冷涡轮叶片内部流场、温度场等物理量的分布情况。
在求解过程中,采用了迭代法和多网格法等技术,保证了求解的精度和效率。
三、气热耦合现象的分析与讨论1. 流场与温度场分析通过对气冷涡轮叶片的数值模拟,得到了内部流场和温度场的分布情况。
结果表明,气冷涡轮叶片内部的流场分布不均匀,存在较大的速度梯度和压力梯度。
同时,由于气冷效应的存在,叶片内部的温度分布也呈现出不均匀的状态。
这些现象都会对气冷涡轮叶片的性能产生影响。
2. 气热耦合效应的分析气热耦合效应是气冷涡轮叶片性能的重要因素之一。
通过对数值模拟结果的分析,发现气热耦合效应对流场和温度场的影响是相互的。
一方面,流场的不均匀性会导致温度场的不均匀分布;另一方面,温度场的不均匀分布也会影响流场的分布和流动状态。
《2024年航空发动机气冷涡轮叶片的气热耦合数值模拟研究》范文

《航空发动机气冷涡轮叶片的气热耦合数值模拟研究》篇一一、引言随着航空工业的快速发展,航空发动机作为核心部件,其性能的优劣直接决定了飞机的整体性能。
而涡轮叶片作为发动机的核心组成部分,其工作环境异常恶劣,因此对其进行深入的研究具有重大的意义。
其中,气热耦合现象对涡轮叶片的工作状态有着重要影响,而对其进行数值模拟研究则是目前研究的重要方向之一。
本文将对航空发动机气冷涡轮叶片的气热耦合数值模拟进行研究,以期为航空发动机的设计和优化提供理论支持。
二、气热耦合数值模拟理论基础气热耦合数值模拟是通过对流场和温度场的耦合计算,来研究气体流动和热量传递的过程。
在航空发动机中,气冷涡轮叶片的流场和温度场是相互影响、相互依存的。
因此,气热耦合数值模拟是研究涡轮叶片性能的重要手段。
在气热耦合数值模拟中,需要考虑到流场的湍流特性、传热过程、热应力分布等因素。
同时,还需要建立合适的数学模型和物理模型,以实现对流场和温度场的准确描述。
此外,还需要采用高效的计算方法和算法,以保证计算的精度和效率。
三、航空发动机气冷涡轮叶片的气热耦合数值模拟针对航空发动机气冷涡轮叶片的气热耦合数值模拟,本文采用了高精度的数值计算方法和算法。
首先,建立了涡轮叶片的三维几何模型和计算网格,并进行了适当的边界条件和初始条件设置。
其次,通过求解流场和温度场的耦合方程,得到了流场和温度场的分布情况。
最后,通过对计算结果的分析和处理,得到了涡轮叶片的气动性能、传热性能和热应力分布等信息。
在数值模拟过程中,我们重点关注了气热耦合现象对涡轮叶片的影响。
通过对比分析有气冷和无气冷的情况下涡轮叶片的流场和温度场分布,我们发现气冷技术可以有效地降低涡轮叶片的温度,提高其耐久性和使用寿命。
同时,我们还发现气热耦合现象对涡轮叶片的气动性能和传热性能有着重要的影响,需要进行深入的研究和探讨。
四、结果与讨论通过气热耦合数值模拟,我们得到了航空发动机气冷涡轮叶片的流场和温度场分布情况,以及其气动性能、传热性能和热应力分布等信息。
涡轮叶片应变温度非接触同步测试技术分析
涡轮叶片应变、温度非接触测试技术克服了传统测试的干扰流场、破坏被测件等缺点,可以为热端部件结构设计与强度寿命评估提供更为可靠的技术支撑。
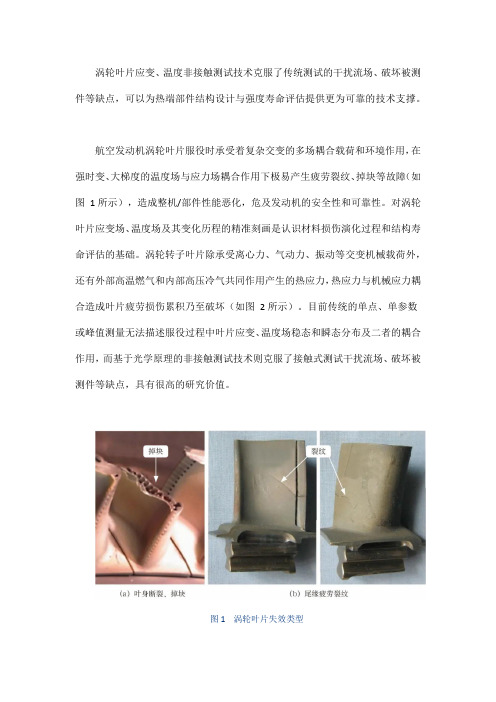
航空发动机涡轮叶片服役时承受着复杂交变的多场耦合载荷和环境作用,在强时变、大梯度的温度场与应力场耦合作用下极易产生疲劳裂纹、掉块等故障(如图1所示),造成整机/部件性能恶化,危及发动机的安全性和可靠性。
对涡轮叶片应变场、温度场及其变化历程的精准刻画是认识材料损伤演化过程和结构寿命评估的基础。
涡轮转子叶片除承受离心力、气动力、振动等交变机械载荷外,还有外部高温燃气和内部高压冷气共同作用产生的热应力,热应力与机械应力耦合造成叶片疲劳损伤累积乃至破坏(如图2所示)。
目前传统的单点、单参数或峰值测量无法描述服役过程中叶片应变、温度场稳态和瞬态分布及二者的耦合作用,而基于光学原理的非接触测试技术则克服了接触式测试干扰流场、破坏被测件等缺点,具有很高的研究价值。
图1 涡轮叶片失效类型图2 发动机I类循环涡轮叶片上的热-机械耦合载荷示意应变非接触测量技术现状高温环境下应变非接触测量技术概况目前用于材料表面全场高温变形的非接触式光学测量方法主要有云纹干涉(moire interferometry,MI)、电子散斑干涉(electronic speckle pattern interferometry,ESPI)和数字图像相关(digital image correlation,DIC)等方法。
基于相干光波干涉原理的云纹和电子散斑干涉法的位移测量灵敏度非常高(可达波长量级),具有测量结果直观可视的优点,缺点是需激光作为照明光源,测量光路较复杂,对被测试样表面和测量环境要求苛刻,只能在实验室暗室中的光学隔振平台上进行,很难在真实试验现场测量高温变形。
数字图像相关方法更适合全场高温变形测量,优势包括:仅需一个或两个数字相机,光路、试验设备和试验过程简单;采用白光或单色光照明,对测量环境和隔振要求较低,可实现现场测量;时间和空间分辨率可根据测试对象需求灵活调整。
《2024年航空发动机气冷涡轮叶片的气热耦合数值模拟研究》范文

《航空发动机气冷涡轮叶片的气热耦合数值模拟研究》篇一一、引言随着航空工业的飞速发展,航空发动机的性能要求日益提高,其中气冷涡轮叶片作为发动机的核心部件之一,其性能的优劣直接关系到发动机的整体性能。
因此,对气冷涡轮叶片的气热耦合数值模拟研究显得尤为重要。
本文旨在通过对航空发动机气冷涡轮叶片的气热耦合数值模拟进行研究,为提高发动机性能提供理论依据。
二、气冷涡轮叶片概述气冷涡轮叶片是航空发动机的核心部件,其作用是将燃气能量转化为机械能。
由于燃气在叶片内部的高温环境,使得叶片在高速运转过程中承受着极大的热负荷和机械负荷。
因此,气冷涡轮叶片的设计和制造过程十分复杂,需要考虑到多种因素的影响。
三、气热耦合数值模拟方法气热耦合数值模拟是一种基于计算机技术的方法,通过建立物理模型、设定初始条件和边界条件,运用数学方法和计算机程序对气体流动、传热过程进行模拟。
在气冷涡轮叶片的研究中,气热耦合数值模拟主要考虑了燃气流动、热量传递、热应力等多个因素。
通过对这些因素进行综合分析,可以得到叶片在高温环境下的工作状态和性能。
四、气热耦合数值模拟过程在气热耦合数值模拟过程中,首先需要建立物理模型,包括燃气流动模型、传热模型等。
然后设定初始条件和边界条件,如进口气流参数、出口压力、叶片材料属性等。
接着运用数学方法和计算机程序进行数值计算,得到燃气在叶片内部的流动状态、热量传递过程以及热应力分布情况。
最后对计算结果进行分析和评估,为叶片的设计和制造提供依据。
五、研究结果与分析通过对气冷涡轮叶片的气热耦合数值模拟研究,可以得到以下结论:1. 燃气在叶片内部的流动状态对叶片的传热性能和机械性能有着重要影响。
合理的燃气流动设计可以有效地降低叶片的温度和热应力,提高叶片的耐久性和可靠性。
2. 传热过程是影响叶片性能的另一个重要因素。
通过对传热过程的分析,可以了解叶片在不同工况下的温度分布和热量传递规律,为叶片的材料选择和结构优化提供依据。
整流罩保温仓体的热失真分析
整流罩保温仓体的热失真分析1.引言整流罩是航空发动机中非常重要的部件之一,它保护了涡轮机内部部件,并流出了足够的气流冷却涡轮。
为了保证整流罩的性能和寿命,必须保证它的材料和结构在高温环境下具有足够的稳定性和强度。
此外,整流罩内壁需要加装保温材料,以减少其表面温度,防止热辐射对发动机的损害。
然而,随着飞机飞行的时间和使用寿命的延长,整流罩保温仓体的热失真问题也逐渐显现出来。
因此,进行热失真分析、找出影响因素并采取相应的措施、解决整流罩保温仓体的热失真问题,具有非常重要的现实意义。
2.热失真分析的目的和方法热失真是指在高温环境下,因材料受热后热膨胀系数大于其受热所产生的应变,从而导致结构发生形变和变形的现象。
整流罩保温仓体的热失真,主要是由于钢材及保温材料的热膨胀差异引起的。
分析整流罩保温仓体的热失真,需要使用有限元方法。
首先,利用计算机对整流罩保温仓体进行建模,然后对温度、应力及应变场进行计算,最后得到整流罩保温仓体的热失真分析结果。
3.整流罩保温仓体热失真影响因素分析整流罩保温仓体的热失真受多种因素的影响。
考虑下列三个最重要的影响因素:(1)保温材料的热导率和厚度:保温材料的热导率和厚度,是影响保温效果的主要因素。
保温材料热导率越小,保温效果越好。
但是,随着保温材料厚度的增加,其强度也会降低,从而导致整流罩保温仓体热失真程度加剧。
(2)整流罩保温仓体的结构材料及形状:整流罩保温仓体的结构材料及形状,也会对整流罩保温效果和热失真产生影响。
材料的强度影响其受热后形变程度,而形状则会影响受热后产生的应力和应变的分布。
(3)机器所处的工作环境温度:整流罩所处的工作环境温度,是导致整流罩表面温度升高的直接因素。
机器所处的环境温度越高,就越容易导致整流罩保温仓体表面温度过高,从而产生更加严重的热失真。
4.热失真防护方法为了防止整流罩保温仓体受到过高的温度和热失真损害,需要采取以下措施:(1)设计合理的结构形态,缩小整流罩的表面积,减小其所处环境中的工作温度。
舱内失压下航天员热舒适度和散热量仿真
Vod 42 N/j 5May 2021第42卷第5期 宇航学报2021 年 5 月Journal of Astronautics舱内失压下航天员热舒适度和散热量仿真方明元1>2,王 晶1>2,李西园2,毕研强2(1.可靠性与环境工程技术重点试验室,北京100094 & 2.北京卫星环境工程研究所,北京100094)摘要:针对载人登月舱内失压应急返回过程中,不同条件下航天员穿着舱外航天服维持生存时的热舒适度 问题,基于MatPb 建立了人-航天服热模型。
其中人体热模型基于Fmla 模型建立,航天服热模型使用集总参数法 建立。
经过不同工况的对比,仿真结果与文献数据基本吻合,验证了模型的正确性。
在此基础上,基于DTS 热舒适度计算方法对不同失压紧急情况下的人体热舒适度进行了分析,得到了舱内不同环境下人体热舒适度、航天服所需散热量和通风气体湿度的变化规律,并提出了系统优化方案,为我国应急舱内压力防护系统的设计和生保方案 制定提供了参考。
关键词:人体热模型;航天服热模型;数值仿真;热舒适度;舱内失压中图分类号:V445. 1文献标识码:A 文章编号:1000-1328(2021)05-0660-09DOI : 10. 3873/j . issn. 10000 328.2021.05.013Simulation of Astronaut Thermal Comfort and Heat Dissipationunder Cabis Pressure Loss ConditionFANG Miny-yuen 1,2,WANG Jiny 1,2,LI Xi-yuan 2,BI Yen-qiany 2(1. National Key Laboratoy of Science and Technology on Reliability and EnvironmenWl Engineeing ,Beijing 100094,China &2. Bei oing 2ns ii iu ie o oSpacec aa oiEn ei aonmen iEnginee aing , Bei oing 100094, China )Abstract : Aiming at the problem of thermal comfort of astronauts wearing space suits for survival in dibemnt conditionsduaingiheemeagencyaeiuan paoce s wiih cabin paessuae o s , ahuman-spacesuiiiheamaImodeIisesiab ished based onMa iab. The human iheamaImodeIisesiab ished based on iheFiaamodeI , and ihespacesuiiiheamaImodeIisesiab ishedbyiheIumped paaameieameihod.Thesimu aiion aesu isooihehuman-spacesuiiiheamaImodeIin di o eaeniwoakingcondiiionsaaein agaeemeniwiih ihedaiain iieaaiuae , and iheco a e cine s ooihemodeIiseeaioied.On ihisbasis , ihehuman body thermal comfort under dibemnt pressure loss conditions is anWyzed based on the DTS thermal comfortagoaiihm , iheaeaiion amonghuman iheamaIcomooai , heaidi s ipaiion and eeniiaiion gashumidiiyisobiained , and ihepaoposasioopiimieeihesysiem aaepuiooawaad.ThemodeIand iissimu aiion aesu iscan paoeideaeoeaencesooaihedesignoocabin pae s uaepaoieciion sysiem and iheesiab ishmeniooasiaonauisioesuppoaischemein China.Key words : Human t hermal model & Space suit thermal model & Numerical simulation & Thermal comfort & Cabinpae s uae osso 引言在载人航天任务中,工艺缺陷、微流星撞击、环控生保系统自身缺陷等原因引起的座舱失压是可能 造成任务成败的最为严重故障之一⑴。
- 1、下载文档前请自行甄别文档内容的完整性,平台不提供额外的编辑、内容补充、找答案等附加服务。
- 2、"仅部分预览"的文档,不可在线预览部分如存在完整性等问题,可反馈申请退款(可完整预览的文档不适用该条件!)。
- 3、如文档侵犯您的权益,请联系客服反馈,我们会尽快为您处理(人工客服工作时间:9:00-18:30)。
AIAA 2003-3765Aeroheating Thermal Model Correlation for Mars Global Surveyor (MGS) Solar Array Ruth M. Amundsen and John A. DecNASA Langley Research CenterHampton, VALt. Benjamin E. GeorgeUnited States Air ForceKirtland Air Force BaseAlbuquerque, NM36th AIAA Thermophysics Conference23-26 June 2003Orlando, FloridaAEROHEATING THERMAL MODEL CORRELATION FOR MARS GLOBAL SURVEYOR (MGS) SOLAR ARRAYRuth M. Amundsen, John A. DecNational Aeronautics and Space AdministrationLangley Research CenterHampton, VA 23681-2199Lt Benjamin E. GeorgeUnited States Air ForceKirtland Air Force BaseAlbuquerque, NM 87111ABSTRACTThe Mars Global Surveyor (MGS) Spacecraft made use of aerobraking to gradually reduce its orbit period from a highly elliptical insertion orbit to its final science orbit. Aerobraking produces a high heat load on the solar arrays, which have a large surface area exposed to the airflow and relatively low mass. To accurately model the complex behavior during aerobraking, the thermal analysis needed to be tightly coupled to the spatially varying, time dependent aerodynamic heating. Also, the thermal model itself needed to accurately capture the behavior of the solar array and its response to changing heat load conditions. The correlation of the thermal model to flight data allowed a validation of the modeling process, as well as information on what processes dominate the thermal behavior. Correlation in this case primarily involved detailing the thermal sensor nodes, using as-built mass to modify material property estimates, refining solar cell assembly properties, and adding detail to radiation and heat flux boundary conditions. This paper describes the methods used to develop finite element thermal models of the MGS solar array and the correlation of the thermal model to flight data from the spacecraft drag passes. Correlation was made to data from four flight thermal sensors over three of the early drag passes. Good correlation of the model was achieved, with a maximum difference between the predicted model maximum and the observed flight maximum temperature of less than 5%. Lessons learned in the correlation of this model assisted in validating a similar model and method used for the Mars Odyssey solar array aeroheating analysis, which were used during on-orbit operations.INTRODUCTIONThe Mars Global Surveyor (MGS) Spacecraft launched in November of 1996 and arrived at Mars in September 1997. The initial orbit was highly elliptical, with an apoapsis of 54,026 km and a 45-hour period. Aerobraking was used to slow the spacecraft and decrease the orbit altitude to allow insertion into a final science orbit. Aerobraking is the process of skimming the spacecraft through the planetary atmosphere at periapsis, decreasing its speed and thus lowering apoapsis. This method saves substantially on the amount of fuel that must be used to achieve the science orbit. The aerobraking effort was originally planned to take four months to bring the orbit apoapsis to 450 km. Early in the aerobraking, aerodynamic pressure caused one of Surveyor's two solar panels to bend backward slightly. The panel in question had been damaged shortly after launch. This event led to a pause in aerobraking and eventually a more conservative approach toward aerobraking, to put less stress on the damaged solar panel. Drag passes were designed to remain higher in the atmosphere than originally planned, thus decreasing the pressure load on the solar arrays but substantially increasing aerobraking duration. Aerobraking in this reduced fashion continued until March 1999, when the spacecraft was placed in the final science orbit.The solar panels constitute the main drag on the spacecraft, and as low-mass “wings” they bear the brunt of aeroheating. The duration of aerobraking is often critical, because of high mission costs during that period, and because the duration of aerobraking affects the final science orbit achieved. The Mars Odyssey mission was to use a similar mission plan as MGS, with solar arrays bearing the brunt of aerobraking. Thus it was important to fully understand the MGS mission performance. In particular, it was important to determine the thermal behavior of the solar arrays, since they were the limiting factor in aerobraking. If more aggressive aerobraking could be used (i.e., deeper cuts into the atmosphere on each pass), it would bring down the total time and cost for the Odyssey mission,as well as improving the ability to control the final science orbit. MGS flight data was used to correlate a thermal model of the solar arrays, to ensure that the behavior during aerobraking was fully quantified. Then, this information was used in the thermal analysis of Odyssey’s aerobraking which ultimately affected mission planning.Because of the discovery of the damaged solar panel which led to the mid-mission change in MGS aerobraking operations, only the first 15 passes were done in the original flight corridor at relatively high atmospheric densities with a comparatively high aeroheating environment. At the start of the aerobraking phase of the mission, the mission plan was to progressively lower the aerobraking altitude due to uncertainties in the density of the Mars atmosphere. Since correlation of the thermal model to high aeroheating environments was desired, the first 14 passes, which experienced fairly benign environments, were not used and pass 15 was the first one considered for correlation.THERMAL MODEL DEVELOPMENTThe thermal methods have been described in detail in an accompanying paper1, but enough will be described here to understand the driving factors in correlating the model. A thermal model of the spacecraft assembly was needed in order to capture the radiative environment of the solar arrays. Shading and view factors from the spacecraft helped determine the initial steady-state temperature of the solar array, as well as defining the solar and planetary flux environment that affect temperatures during a drag pass. This model captured only geometry and external surface properties for both the spacecraft and solar array. The orientation of the spacecraft with relation to the planet and sun was included in the telemetry data received from MGS. For the detailed thermal solution, a full thermal model was developed for the solar array only. The solar arrays were mounted on gimbals with a low thermal conductance to the rest of the spacecraft, which minimized the conductive effect of the spacecraft on the array. The view factors to the spacecraft as well as solar and planetary fluxes from the radiation model were applied to the solar array model. This method allowed much more detail to be captured in the solar array thermal model without sacrificing solution time by having to include spacecraft elements in that model. Since the extent of damage to the solar array on the -Y side of the spacecraft was unknown, only the +Y array was modeled with the analytically determined temperatures from that array being correlated to flight thermocouple data received in the telemetry. Radiation modelThe radiation model of the spacecraft and the +Y solar array was developed in Thermal Desktop2. A view is shown in Figure 1 (arrows are used to indicate view angles to planet and Sun). This model was used to calculate view factors from the solar array to deep space, and also to calculate solar and planetary fluxes.View factors to space are shown in Figure 2.Figure 1. Radiation model of spacecraft/solar array.Figure 2. View factors to space from solar array.Thermal ModelThe full 3D thermal model was created inMSC/PATRAN3. This was done for two reasons. One was that existing FORTRAN code would allow simple inclusion of the aeroheating fluxes in PATRAN. The other was that the structural analysis of thermal stresses would be easily accomplished using existing methods. Normally, it is not more efficient to develop two models. However, in this case a time constraint of finishing the correlation before it was needed for Mars Odyssey on-orbit operations drove the use of existing, easily adapted methods. The radiation model in Thermal Desktop was necessary since orbital capabilities do not exist within MSC/PATRAN.The solar array was mounted to the spacecraft at a gimbal, and had a magnetometer mounted at the outsidetip. The array was a sandwich construction using graphite polycyanate facesheets with an aluminum honeycomb core. In places where structural connections were made, the facesheets were reinforced with doublers and the aluminum core density was increased. The solar cells were mounted over more than 90% of the surface on one side. Since the thermocouples that were used to correlate were in locations where coverage by solar cells is complete, it was decided to approximate the solar cell coverage as 100% to simplify modeling. During the drag passes the solar cell side was oriented away from the direction of flight, so that the bare graphite side, often referred to as the “hot” side, received the aerodynamic heating.The solar array was modeled in PATRAN as five distinct layers, as shown in Figure 3. Each layer was modeled with plate elements, except for the aluminum core, which was modeled with solid elements. The layers were spaced apart, so that they could be connected via a contact conductance. This value could be varied to account for the adhesives used between the layers. Also, it accounted for the reduced contact area between the facesheets and honeycomb core. The solar cell layer was made up of a combination of materials, as described below. The Kapton sheet between the solar cell layer and graphite facesheet was 0.002" thick (0.051 mm). The facesheets were M55J/RS-3, 0.0075" thick (0.19 mm). The aluminum honeycomb core was 1.0" thick (25.4 mm). The film adhesive used between the core and facesheets was M1025A. The finite element mesh on the facesheets was customized to take the thermal sensor locations into account.Figure 3. Layup of solar array.The solar cell layer consisted of the following, from the outside in: a 0.005" glass coversheet, a layer ofDC93500 adhesive (0.003" thick), the solar cells themselves, a metal backing to the solar cells, and a layer of CV2568 adhesive that held the cells down to the Kapton sheet. The solar cells were silicon on the outboard section of the array, GaAs on the inboard section, .008" thick. The overall thickness of this layer was 0.022" (0.5 mm). The properties of this layer were calculated as a weighted average of those five materials. The roughly 1 kg of wiring for the solar cells on each section was added to this layer as a smeared mass. The effective properties were a specific heat of 807 J/kg and a density of 3508 Kg/m3 for the GaAs panel and 2402 kg/m3 for the silicon cell panel.White paint was used over portions of the hot surface, and this was included in both the radiation model in Thermal Desktop and the radiation boundary conditions of the PATRAN model. These lower absorptivity regions on the edges and inboard corners of the array are shown in Figure 4 on the radiation model. The purpose of the paint was to provide a lower absorptance for the solar flux and allow a lower temperature for the outer portions of the array. The pattern was chosen to correspond with the areas with the highest aeroheating flux, thus helping keep them within their thermal limits. Another modification included in the model was local thickening of the Kapton sheet in the highest heating areas. At the inboard array corners, the Kapton was laid up in layers to augment the thickness so that more thermal mass was available to absorb the heating. This was included in the model by using a spatial field for the facesheet thickness, as well as changing the sheet thickness for all areas thickened with doublers. This is illustrated in Figure 5. On the solar cell side, the different optical properties of the two solar cell types were also included in both models.Figure 4. White paint on hot side facesheet (α).Other parts included in the model were the hinges and magnetometer. The hinges were included as simple flat plates that correctly captured the mass of the hinge as well as the contact area on the array. The magnetometer mass was lumped over its contact area at the outermost tip of the array.All material properties (except density and emissivity) were included as functions of temperature.Solar cellsFigure 5. Thickness definition on hot side facesheet (m).The mass of the overall model was verified by a comparison with the as-built mass from flight assembly records. The model did not include the drag flaps, and the as-built mass of only the modeled portion was roughly 26 kg. The mass of the total thermal model was 23 kg, for an error of roughly 11%. This was not unreasonable considering the approximations within the model, and the fact that some components mounted on the solar arrays were not modeled if they were known to be far enough from any thermocouple not to affect sensor results. Since the model was too light, it was expected to lead to conservatively high temperature predictions. Several of the densities were varied during the correlation process to ascertain their effects on the model performance. The 23 kg mass is for the final correlated model.Boundary ConditionsBoundary conditions included contact conductance between layers, convection, radiation, aeroheating, and solar and planetary fluxes. The contact between layers was calculated as the effective conductance due to the adhesive thickness. These calculations and the overall total effective conductance through the thickness of the entire array are shown in Table 1. The total calculated value of 19 W/m2K was somewhat higher than the value from correlation of a 2-node model in early ground testing (0.01 W/in2C, or 15.5 W/m2K)4. However, it is difficult to compare the two values for several reasons. In the ground test, local effects and sensor mass could affect the correlated value. Radiation through the core was treated as a separate radiation boundary condition in this modeling, whereas in the 2-node model it was included in the effective conduction value. Also, this effective conduction is shown only for the majority of the array, not for local regions such as the areas with doublers. The contact conductance values were varied during correlation, especially the most uncertain value, which was that ofthe facesheet to the core. The values shown are for thefinal correlated model.Table 1. Effective Conduction through ArrayThicknessLayer Thick-nessMat'l AddedlayerEff.conduct-ance(W/m2K)Face-sheet tocore(eachside).0075" M55J/RS-30.003"adhesivelayer, incontactover 1%of area(honey-combcellwalls)52Kapton .002" Kapton 2755Solarcells.0075"(GaAs).008"(Si)Solarcells0.006"CV2568bond822Core 1" Alhoney-comb79Totalconduct-ance19The radiation boundary conditions included bothinternal and external radiation. Radiation through thealuminum core, from one facesheet to another, wasapplied. The view factors from the Thermal Desktopspacecraft model were applied as fields in theappropriate regions, by mapping the viewfactors intothe PATRAN model, as shown in Figure 6. Viewfactors to both space and the spacecraft were included.Space temperature was fixed at 3 K during the exo-atmospheric portion of the analysis, and then wasallowed to vary to simulate the Martianatmosphere/space combination during the drag pass.Figure 6. Viewfactors to space from solar cell side. The aeroheating was calculated using a two-stepprocess. First, the atmospheric density experienced by the spacecraft was calculated using accelerometer data from the spacecraft. Then using the atmosphericdensity and the velocity relative to the atmosphere, the aeroheating on the solar array was calculated. The correlation of the atmospheric density to theaccelerometers was made using Direct SimulationMonte Carlo (DSMC) which modeled the interaction of atmospheric particles with the entire spacecraft. The relation between the density and the acceleration is captured in the equation:221V c ma d ρ= (1)where m is the known mass of the spacecraft, a is the acceleration due to atmospheric drag, c d is the drag coefficient determined using DSMC, ρ is theatmospheric density, and V is the velocity relative to the atmosphere. The acceleration due to drag was calculated at time intervals throughout the drag pass directly from the flight accelerometer data. Similarly, the velocity relative to the atmosphere was calculated at the same time intervals using the orbital trajectory. Then, for each time interval, the aerothermal heating over the surface of the solar array was calculated for the given atmospheric density and relative velocity, once again using DSMC techniques. This relationship is defined by the following equation:321V C q H ρ=(2)where q is the aerothermal heating, C H is the heating coefficient at a given point on the array calculated using DSMC, ρ is the atmospheric density, and V is thevelocity relative to the atmosphere. The heating coefficient is a function of density, velocity, and orientation relative to the velocity. Due to the large computational time needed to perform the DSMCcalculations, some simplifying assumptions were made. The effects on C H due to changes in velocity andorientation through the pass are negligible compared to the changes in density. Thus the calculations were made at a constant, average velocity for the nominal orientation. DSMC calculations were performed at prescribed intervals of density encapsulating the range of expected flight conditions, and interpolation was used to determine the heating coefficients over the surface of the array for the calculated density. Then, using equation (2), the aerothermal heating over the surface of the array was calculated at time intervals spanning an entire aerobraking pass. These aeroheating calculations were performed using MATLAB with an aeroheating flux array exported as the product for use in the PATRAN model.The aeroheating flux array was a function of bothphysical position on the array, and time within the drag pass. The aeroheating was interpolated in both time and space onto the PATRAN model on the entireexterior. User-developed FORTRAN was used within PATRAN to accomplish this interpolation. Themapping at one time point, on the hot side, is shown in Figure 7. As shown, the inboard corners of the array received the highest heating, which was the reason for localized use of white paint and thickened Kapton. Average heating on the edges of the array was taken to be 10% of the heating on the nearest point of the hotside 5.Figure 7. Aeroheating near peak during pass 15 (W/m 2). The aeroheating data included incident heating only, so reflected heating needed to be calculated withinPATRAN. The following equation was developed empirically to approximate the reflected component 5:[]()300/)1(06.0015.0,,,wall i H i H net H T C C C ∗−∗+−= (3) Where the coefficients C H are defined as:()321V qC H ρ= (4)This calculation was carried out within the existing FORTRAN code in order to subtract that component from the incident heating.Orbital ConditionsInitially, the model was intended to be run from a steady-state condition with a single global constant temperature. However, it became evident that theinitial condition would substantially affect the transient solution. Thus, the model was run for a steady-state solution using the orbital orientation of the spacecraft just prior to initiation of aerobraking. This allowed at least an approximate gradient prediction across the array, so that the response at the start of aerobraking would be accurate. The main focus of the model was to correlate to aerodynamic heating, so many of the pre-aerobraking spacecraft operations that occur in the vacuum were not included. Using a steady-state temperature for the vacuum phase condition gave an accurate enough prediction of the thermal initialcondition that no detailed transient in the vacuum phase was considered.INITIAL THERMAL RESULTSThe first runs of the thermal model were done with no knowledge of the flight data, to see how close themodel would be with no alterations based on post-flight knowledge. This simulates to some extent a normal thermal progression, where the initial modeling is done before flight, and there is no knowledge of in-flight performance. The results are shown plotted on the 3D model in Figure 8. The through thickness scale in this figure is exaggerated to allow the thickness to bevisible. The cooling effects of the mass of the hinges, doubler areas and magnetometer can be seen. Also, the temperature difference between the hot side and solarcell side is substantial.(a)(b)Figure 8. Initial thermal predictions for MGS solar array: (a) hot side, (b) cell side, °C.THERMAL CORRELATION PROCESS The flight data consisted of thermocouplemeasurements for four different locations on the solar array. There were two sensors on the solar cell side, and two on the hot side. The two on the hot side were applied to the underside of the graphite facesheet, with a hole through the core and solar cell facesheet to allow the penetration. The sensors on the solar cell side were applied directly to the outer facesheet. The two hot side sensors were T211 and T213, and the cell side sensors were T210 and T212, as shown in Figure 9. In this figure only the facesheets are shown, and the through-thickness dimension is greatly exaggerated to allow visualization of the thermal sensor locations. The initial comparison to flight sensor data is shown in Figure 10. The time scale starts prior to aerobraking, and a time of 0 seconds corresponds to the peak of the pass (periapsis). This first comparison was only for thehot side sensors, since those defined the peak heating that can be sustained by the array and thus were most critical to correlate. Also, since the point of this model was to correlate to changes that occurred during aerobraking, the initial condition was subtracted off, and only temperature changes for both flight and the model were compared. As is evident, the sensors in the model were responding too quickly to the heating, and were getting too hot. The sensor predictions on the solar cell side followed a similar pattern, although they were somewhat closer to the flight data. The hot side sensors were over 60°C too hot in the model (much worse on the inboard side), and reached their peaks about 60 seconds before they should. The cell side sensors were about 30°C too hot in the model. The temperature difference between hot side and cold side was also too high, and occurred too quickly.Figure 9. Flight temperature sensor locations.04080120160-150-100-50050100150Time (s)T e m p e r a t u r e (°C )Figure 10. Initial comparison of model to flight data. Another interesting comparison was the difference between the hot side and cell side sensors, both on the outboard and inboard panels. This illustrates where the model was off on both through thickness and lateral conduction, since the sensors were separated not only by the thickness of the panel, but also by most of the area of the panel as well. The initial comparison is shown in Figure 11. It is obvious that the temperature difference between hot side and cell side was too high, and was occurring too rapidly, in the model.-202060100-150-100-50050100150Time (s)T e m p e r a t u r e D e l t a (°C )Figure 11. Initial comparison of hot-to-cell-side differences.Several actions were taken to make the model more representative of flight. Most of these changes were additional detailing and refinements of the model. Radiation within the thermal sensor holes was added. The radiation within the holes was between the hot side facesheet and a layer of Kapton over the hole in the solar cell side. This brought the hot side thermocouple temperature down by about 2.5°C. The solar cellproperties were modified to include the metal backing, wires and other components that had not been broken out separately. This helped by about 5-10°C. The thickness of the facesheets was increased to include the effective thickness of the adhesive, which also helped bring temperatures down slightly.Even though the main intent of the model was only to model accurately the behavior during aerobraking, it became obvious that the initial temperature distribution was affecting the behavior. Thus, the steady state model in the vacuum phase was improved, andcomparisons with flight data were done using the actual temperatures, rather than changes from an initial condition.Radiation within the aluminum honeycomb was added, which helped by another 2°C, but still left the inboard hot side much worse than the outboard hot side. The detail of the thermal sensors was increased, including adding adhesive under them as their connection to the face sheet, and adding wires with radiation to the enclosing hole for the hot side sensors. The optical properties for the GaAs solar cells, silicon cells and white paint were refined and detailed on both the radiation and thermal models, and run for both the steady-state initial condition and the transient model. This helped improve the difference between the inboard and outboard panels.Myriad other minor changes were made, such asmaking sure all material properties were bounded overT211the thermal excursions experienced, adding radiation over the edges of the core, refining the hinges and adding damper masses. Also, many properties were varied to experiment with their effects, such as aluminum honeycomb core density, facesheetconductivity, adhesive thickness under sensors, and honeycomb core contact area. Another small change was to increase the thickness of the facesheets in the areas where white paint was applied, which is a real effect that had not been considered in the originalmodeling. This did help by 2.5°C on the sensor directly under that painted area (T211).FINAL THERMAL RESULTSThe final corrected run to the pass 15 flight data is shown in Figure 12. The hottest thermocouple ispredicted very well, and all others are conservative (i.e., prediction is somewhat too warm).-150-100-50050100150Time (s)T e m p e r a t u r e (°C )Figure 12. Final correlation, actual temperatures. Because the intent of this model was mainly to predict the rise in temperature due to aeroheating, and notfocused on the pre-aerobraking vacuum orbit phase, the correlation was also evaluated only from the point of view of temperature rise during aerobraking. To do this, the initial temperature of each sensor andprediction were removed from the data, leaving only the change from the start of aerobraking. The results of this are shown in Figure 13. All sensor responses look very good, except that the prediction for sensor T213 is rising a little too rapidly. This may be due to the low mass of the model, or to excessive conductance for the adhesive under the sensor. The hot side to cell side differences are shown in Figure 14, and these have obviously improved greatly in the correlation.Overall quality of the model was evaluated in several ways, which are listed in Table 2. The primary measure of correlation was the change in temperature due to aerobraking. This difference in peak temperature change between model and flight, regardless of thetiming, is shown in the row "Difference in peaktemperature change". The worst value on a sensor was 4.4°C. Another measure was the time differencebetween when peak temperature was reached between the model and flight, shown in the row "Difference in peak timing". The difference in actual peaktemperature is listed next in the table; differences of about 8°C reflect the inaccuracy of the startingtemperatures. The RMS difference in the aeroheating temperature rise was calculated, which gives a measure of the accuracy of the model over all times, not just at the peak. The worst RMS difference was 6.7°C. The largest overall difference between prediction and flight over all time points was worst for T211 at 12°C. The final row gives the error of the model as a percentage, based on the first row values (peak temperature rise). If the RMS of these is taken, it gives an overallcorrelation error of 3%. All these measures point to a robust model that reflects in-flight performanceaccurately.04080120-150-100-50050100150Time (s)T e m p e r a t u r e (°C )Figure 13. Final correlation, temperature change.-75-50-2502550-150-100-50050100150Time (s)T e m p e r a t u r e D e l t a (°C )Figure 14. Temperature differences, hot to cell side.。