2019-04FinancialRatios-文档资料
financialratios(accounting)

IntroductionFinancial statements obviously play an important role in a fundamental approach to security analysis. Among the items of potential interest to analysts are financial ratios relating key parts of the financial statement. Financial Ratio is a measure of the relationship which exists between two figures shown in a set of financial statements, which indicates performance and financial situation of a company. Financial ratios could assess the profit of investments during the different years, and it can be also used to analyze trends and to compare the firm’s financials to those of other firms. Thus, financial ratios could compare the benefits and risks of different companies, which help investors and creditors to make rational decision. Moreover, this can evaluate the finance condition, operating results and cash flows for a business as well. Financial ratios can be classified according to the information they provide. There are some types of ratios: Liquidity ratios, Profitability rations, Efficiency ratios and Gearing ratios. However, financial ratios relate to both benefits and limitations in evaluating the performance and management of firms. This assignment is going to analyzing the EasyJet plc annual report and accounts in 2003 to discuss the usefulness and limitations of financial ratios.The ratios analysis is one of the most powerful tools of financial management. It can be computed from any pair of numbers. Given the large quantity of variables included in financial statements, a very long list of meaningful ratios can be derived. A standard list of ratios or standard computation of them does not exist. Financial ratios are used by bankers, investors, and business analysts to assess a company’s financial status. Financial ratio analysis can be used in two different but equally useful ways. Business can use them to examine the current performance of your company in comparison to past periods of time, from the prior quarter two years ago. Frequently, this can help you identify problems that need fixing. Even better, it can direct company attention to potential problems that can be avoided.Financial ratio plays an important role in financial statements, so there are some benefits of financial ratios. First of all, most of the rations become much more meaningful when used as a basis for comparison, which make a company very easy to compare firms against each other. Besides, it also makes possible comparison of the performance of different divisions of the business. Secondly, financial ratio provides information for inter-firm comparison. It highlights the factors associated with successful and unsuccessful firm, and it also reveal strong firms and weak firms, overvalued and undervalued firms. There are no firm has all the strength points, but ratio analysis can create co-ordination between strength points and weak points. Thirdly, it simplifies the comprehension of financial statements, which is able to illustrate the financial condition of a company by the number. For example, a company’s gross profit in 2011 is 25.3% and in 2012, it is 27.5%. According to this ratio, people can understand whether their company is growing or falling. In addition, financial ratio helps in planning and forecasting as well. This means it could be used to assess the risk factor involved for an investor and predict the bankruptcy of acompany. Thus, financial ratio is an early warning system for businesses that are heading into financial distress.Although ratio analysis is an extremely useful and powerful tool for the analysis and interpretation of financial statements, but it still has some limitations. Firstly, there are no two companies are exactly the same. This means many large firms operate different divisions in different industries, so it is difficult to find a meaningful set of industry –average ratios. Additionally, inflation might be damage of balance sheets of a company, which will be affected profits of a company as well. After that, small companies tend to pay more debt than large companies, and this will affect the interest coverage ratio formula as a way needs to be explained. Moreover, ratio analysis explains relationships between past information while users are more concerned about current and future information. Therefore, it is only the reference value for the future decision making. What is more, some accounting ratios might be defined in more than one way. This means, different companies may choose different accounting procedure, and each operators have different calculation methods that lead to different interpretations of data. It is very important that users should be aware of this problem when basing important economic decisions on information provided in the form of ratio analysis. Furthermore, a statement of financial position shows only a snapshot of a company’s financial position on a single date, whilst a statement of comprehensive income covers an entire accounting period. Therefore, if the company’s assets and liabilities end of the period are not typical of the period as a whole, any ratio which combines a figure drawn from the statement of financial position with a figure drawn from the statement of comprehensive income might produce a misleading result. Last but not least, financial ratio just able to show the data of company to the analysts or managers, but it cannot explain the problems and deal with them.EasyJet is a British airline carrier based at London Luton Airport. This is helpful to take a look at what information is obvious from the financial statement. There is some information to interpretation of the ratios, which from the EasyJet plc annual report and accounts in 2013. On the one hand, the non-current assets increased by about 26% (from 2191 pounds to 2964 pounds) between 2009 and 2013. This may be due to the fact that the company invested in some property, such as plane, airline, staffs and so on. Moreover, the number of revenue keep grew up between the 2009 and 2013. Companies use selling products or providing services to achieve the revenue, so the high revenue means the increase of assts or decrease of liabilities in a company. At the same time,there was a significantly increased in the number of profit during the 5 years, which were from 71million pounds in 2009 to 398 million pounds in 2013. Obviously, this means EasyJet Company getting better continually during the year. Return on capital employed is an important ratio expresses a company’s profit as a percentage of the amount of capital invested in the company. This version of ROCE interprets “capital employed”as the total amount of money in the long-term, regardless of whether that money has been supplied by shareholders or lenders. This amount is then compared with the return achieved on that capital. According to theinformation from the EasyJet report, there was a remarkable jumped in the number of the return on capital employed from 3.6% to 17.4% during the five years. Generally, the higher the rate of return on capital employed of the company has more growth in the future.Financial information can be “massaged” in several ways to the figures used for ratios more attractive. For example, many businesses delay payments to trade creditors at the end of the financial year to make the cash balance higher than normal and the creditor days figure higher too.these ratios to compare the performance of the company against that of competitors or other members of same industry Performing a ratio analysis on a single set of financial statements is usually a fairly pointless exercise. For example, if the company's inventory turnover ratio of 1 to 4 this year when it was 1 to 3 last year, this means that inventory levels are building in the current year. The increase in the ratio is an indication that sales are slowing or that inventory levels (which are expensive to maintain) are growing. The ratio change alerts the business manager to a pending cash crunch in time to avert it.If you are evaluating two businesses to hire as subcontractors, their respective debt-to-asset ratios will give you an idea about which of these two companies is the more stable choice. The company with a higher debt-to-asset ratio could be more likely to go out of business as a result of defaulting on interest and principal repayments. However, if your primary objective is investing in a business, and you are seeking high returns, the company with the higher ratio may be a better bet. Firms that borrow heavily are high-risk, high-return investments and tend to do either very well or fail spectacularlyA company can burn through its cash reserves quickly during tough economic times or industry contraction. Financial ratios can operate as an early warning system for businesses that are heading into financial distress. Ratios such as the quick ratio (how much money will there be to pay current debts?), gross margin (how much is the company making on every widget it sells?), and accounts receivable ratio (how quickly are sales being paid for?) tell the company's owners if the money is going to run out and how quickly. The sooner the cash flow problem is identified, the sooner it can be corrected.. The liquidity and non-bank credit ratio are used for assessing the companies going through a hard time. The non-bank ratio is used by a firm where the firm cannot afford to get more credit from banks. This ratio means the greater risk as if the company cannot repay the loan to the bank, it may be charge a higher interest. Therefore, good financial ratio analysing can help business to avoid unnecessary risks.The positive use of financial ratios has been of two types: by accountants and analysts to forecast future financial variables.。
lecture4_financial_ratios
Chap. 4 KMPLECTURE 4 FINANCIAL ANALYSISLearning Objectives •Explain the purpose and importance of financial analysis.•Calculate and use a comprehensive set of measurements to evaluate a company’sperformance.•Describe the limitations of financial ratio analysis.Slide ContentsPrinciples used in this Chapter1.The purpose of Financial Analysis2.Measuring Key Financial Relationships: Five KeyQuestions3.The Limitations of Financial Ratio AnalysisPrinciples Appliedin this Chapter •Principle 5:Conflicts of interest cause agency problems •Principle 4:Markets are generally right•Principle 3:Risk requires a reward1. The Purpose ofFinancial AnalysisFinancial Analysis using Ratios• A popular way to analyze the financial statements is by computing ratios. A ratio is a relationship between twonumbers, e.g. If ratio of A: B= 30:10 ==> A is 3 times B. • A ratio by itself may have no meaning. Hence, a given ratio is compared to:–(a) ratios from previous years–(b) ratios of other firms and/or leaders in the same industryWithin the Firm •Identify deficiencies in a firm’s performance andtake corrective action.•Evaluate employee performance and determine incentive compensation.•Compare the financial performance of different divisions within the firm.Within the Firm •Prepare, at both firm and division levels,financial projections.•Understand the financial performance of the firm’s competitors.•Evaluate the financial condition of a major supplier.Outside the FirmFinancial ratios are used by:•Lenders in deciding whether or not to make a loan to a company.•Credit-rating agencies in determining a firm’s credit worthiness.•Investors(shareholders and bondholders) in deciding whether or not to invest in a company.•Major suppliers in deciding to whether or not to grant credit terms to a company.2. Measuring Key Financial Relationships: Five Key Questions1.How liquid is the firm?2.Is management generating adequate operatingprofits on the firm’s assets?3.How is the firm financing its assets?4.Is management providing a good return on thecapital provided by the shareholders?5.Is the management team creating shareholdervalue?How Liquid Is the Firm?•A liquid asset is one that can be converted quickly and routinely into cash at the current market price.•Liquidity measures the firm’s ability to pay its bills on time. It indicates the ease with which non-cash assets can be converted to cash to meet the financial obligations.How Liquid Is the Firm?•Liquidity is measured by two approaches:–Comparing the firm’s current assets andcurrent liabilities–Examining the firm’s ability to convertaccounts receivables and inventory into cash on a timely basisMeasuring Liquidity:Perspective 1•Compare a firm’s current assets with current liabilities–Current Ratio–Acid Test or Quick RatioTable 4-2Current Ratio•Current ratio compares a firm’s current assets to its current liabilities.•Formula:Current ratio = Current assets/Current liabilitiesDavies Example:= $143M / $64M= 2.23Interpretation (Current ratio)•Davies has $2.23 in current assets for every $1 in current liabilities.•The average is higher than the peer group’s ratio of 1.80.Acid Test or Quick Ratio•Quick ratio compares cash and current assets (minus inventory) that can be converted into cash during the year with the liabilities that should be paid within the year.•What is the rationale for excluding inventories?•Formula:Quick Ratio = Cash and accounts receivable/Current liabilities Davies Example= ($20M + $36M) / $64M= 0.88Interpretation (Quick Ratio)•Davis has 88 cents in quick assets for every $1 in current liabilities.•Davis is less liquid compared to its peers that have 94 cents for every $1in current liabilities.•Which ratio (Current or Quick ratio) is a more stringent test of a firm’s liquidity?Measuring Liquidity:Perspective 2•Measures a firm’s ability to convert accounts receivable and inventory into cash–Average Collection Period–Inventory TurnoverTable 4-1Average Collection Period (ACP)•How long does it take to collect the firm’s receivables?•Formula:ACP = Accounts receivable/(Annual credit sales/365)•Davies Example:= $36M / ($600M/365) = 21.95 days•Davis is faster than peers (25 days) in collecting the accounts receivable.Inventory Turnover•How many times is inventory rolled over per year? •Formula: Inventory Turnover = Cost of goods sold/InventoryDavies Example= $460M / $84M = 5.48 times•# of days = 365/Inventory turnover = 365/5.48 = 67 days •Thus Davis carries the inventory for a longer time than its competitors (Competitors = 365/7 = 52 days).Davis vs. Peer Group: Question #1 SummaryRatio Davies Inc.Peers Current Ratio 2.23 1.80Quick Ratio.88.94 Avg. Collection21.9525 PeriodInventory Turnover5.48 (67)7 (52) (days in inventory)Are the Firms’ManagersGenerating Adequate OperatingProfits on the Company’s Assets?•This question focuses on the profitability of theassets in which the firm has invested. We will consider the following ratios to answer the question:–Operating Return on Assets–Operating Profit Margin–Total Asset Turnover–Fixed Asset TurnoverOperating Return on Assets(ORA)•ORA indicates the level of operating profits relative to the firm’s total assets.•Formula: ORA = Operating profits/Total assets Davies Example= $75M / $438M = .171 or 17.1%•Thus managers are generating 17.1 cents ofoperating profit for every $1 of assets (peer group average = 17.8)Dis-aggregation of Operating return on Assets ORA = Operating profits/Total assets= Operating profit/sales * Sales/assets= Operating profit margin * Total asset turnoverManaging operations: Operating Profit Margin (OPM)•OPM examines how effective the company is in managing its cost of goods sold and operating expenses thatdetermine the operating profit.•Formula: OPM = Operating profit/SalesDavies Example= $75M / $600M = .125 or 12.5%•Davies managers are not as good as peers in managing the cost of goods sold and operating expenses, as the average for peers is higher at 15.5%Total Asset Turnover•This ratio measures how efficiently a firm is using its assets in generating sales.•Formula: Total Assets Turnover = Sales/Total assets Davies Example= $600M / $538M = 1.37X•Davies is generating $1.37 in sales for every $1 invested in assets, which is higher than the peers average of$1.15.Fixed Asset Turnover•Examines efficiency in generating sales from investment in “fixed assets”•Formula: = Sales/Fixed assetsDavies Example= $600M / $295M = 2.03X•Davies generates $2.03 in sales for every $1 invested in fixed assets (peer group average = $1.75)Figure 4-3Davies vs. Peer Group: Question #2 SummaryRatio Davies Inc.Peers Operating Return on17.1%17.8% AssetsOperating Profit12.5%15.5% MarginTotal Asset Turnover 1.37x 1.15x Fixed Asset Turnover 2.03x 1.75x•Here we examine the question: Does the firm finance its assets by debt or equity or both? We use the following two ratios to answer the question:–Debt Ratio–Times Interest Earned2.3 How Is the FirmFinancing Its Assets?Debt Ratio•This ratio indicates the percentage of the firm’s assets that are financed by debt (implying that the balance is financed by equity).•Formula: Debt Ratio = Total debt/Total assetsDavies Example= $235M / $438M = .54 or 54%•Davies finances 54% of firm’s assets by debt and 46% by equity. This ratio is higher than peer average of 35%.Times Interest Earned•This ratio indicates the amount of operating income available to service interest payments.•Formula: Times Interest Earned = Operating income/InterestDavies Example= $75M / $15M = 5.0X•Davies operating income are 5 times the annual interest expense or 20% of the operating profits goes towards servicing the debt.Times Interest EarnedNote:•Interest is not paid with income but with cash •Oftentimes, firms are required to repay part of the principal annually•Thus, times interest earned is only a crude measure of the firm’s capacity to service its debt.Davies vs. Peer Group: Question #3 SummaryRatio Davies Inc.Peers Debt Ratio54%35%Times Interest5X7X Earned•This is analyzed by computing the firm’s accounting return on common stockholder’s investment or return on equity (ROE).•Formula: ROE = Net income/Common equity •Common equity includes both common stock and retained earnings.Are the Firm’s Managers Providinga Good Return on the Capital Providedby the Shareholders?ROEDavies ExampleROE = $42M / $203M= .207 or 20.7%•Owners of Davies are receiving a higher return (20.7%) compared to the peer group (18%).•One of the reasons for higher ROE for Davies is the higher debt used by Davies. Higher debt translates to higher ROE under favorable business conditions.Figure 4-4Question #4 Summary: Davies vs. Peer GroupRatio Davies Inc.Peers Return on Equity12.9%12.0%•We can use two approaches to answer this question:–Market value ratios (P/E)–Economic Value Added (EVA)•These ratios indicate what investors think of management’s past performance and future prospects. 2.5 Are the Firm’s Managers Creating Shareholder Value?Price/Earnings Ratio •Measures how much investors are willing to pay for $1 of reported earnings.•Formula:PE = Price per share/Earnings per shareDavies Example= $32.00 / $2.10 = 15.24X•Investors are willing pay less for Davies for every dollar of earnings compared to peers ($15.24 for Davies versus $19 for peers).Price/Book Ratio •Compares the market value of a share of stock to the book value per share of the reported equity on the balance sheet.•Formula:= Price per share/Equity book value per share Davies Example= $32.00 / $10.15 = 3.15X• A ratio greater than 1 indicates that the shares are more valuable than what the shareholders originally paid. However, the ratio is lower than the S&P average of 3.70.Economic Value Added (EVA)•How is shareholder value created?–If the firm earns a return on capital that is greater thanthe investors’required rate of return.•EVA attempts to measure a firm’s economic profit, rather than accounting profit.•EVA recognizes the cost of equity in addition to the cost of debt (interest expense).EVA: Formula•EVA = (r–k) ×Awhere:r=Operating return on assetsk=Total cost of capitalA=Amount of capital(or Total Assets)EVA example• A firm has total assets of $5,000 and has raised money from both debt and equity in equal proportion. Further, assume that cost of debt is 8% and the cost of equity is 16%. Assume that the firm earns 17% operating income on its investments.•EVA = (17% –12%)* $5,000 = $250•Where,Cost of capital= .5*(8%) + .5*(16%) = 12%Question #5 Summary:Davies vs. S&P/PeersRatio Davies Inc.Peers Price/Earnings15.24X19X (Peers) RatioPrice/Book Ratio 3.15X 3.7X(S&P 500)3. The Limitations ofFinancial Ratio Analysis•It is sometimes difficult to identify industry categories or comparable peers.•The published peer group or industry averages are only approximations.•Industry averages may not provide a desirable target ratio.•Accounting practices differ widely among firms.• A high or low ratio does not automatically lead to a specific conclusion.•Seasons may bias the numbers in the financial statements.Table 4-1Table 4-2Table 4-3。
关于财务比率 英文版
financial ratios1 the meaning of financial ratios financial ratio is a financial statement material as the basis,it will be two related data in the data and deduct get ratio.2 financial ratio classification financial ratio mainly includes the debt paying ability, operation ability, profit ability. Debt paying ability reflect enterprise to repay debts that are due ability, operation ability reflect enterprise use capital efficiency, profitability reflect enterprise profit ability. The above three aspects are connected. For example, profitability will affect short-term and long-term liquidity, and assets operation efficiency and can affect profitability, so financial analysis requires a combination of the ratio.3 financial ratio calculation method1) short-term debt paying ability ratio1 flow ratio = current assetsCurrent liabilitiesTwo quick ratio = quick assetsCurrent liabilities2) long-term debt paying ability ratio1 asset-liability ratio = total liabilitiesTotal assets2 equity ratio = total liabilitiesShareholders' equityThree rights multiplier = total assetsShareholders' equityThe second operation capacity index1 inventory turnover ratio = operating costsAverage inventory2 accounts receivable turnover = operating income Average accounts receivable3 the total assets turnover = operating income Average total assetsThree earnings ratio1 sales (business) net interest rate = net profit Operating income2 sales (business) gross profit rate = operating margin Operating income3 business profitability = operating profitOperating incomeCase analysisThe guarantor name shandong province zibo vermicular cast iron co., LTDTime was established on March 1, 1993 the registered address of huantai county tangshan town village tang chapter line road no. 3Registered capital of 11.3623 million yuan paid-in capital of21.3623 million yuanCharacteristics of the enterprise co., LTD., the legal representative ZhangYueChengScope of business cast iron parts, machinery processing, building engineering machinery manufacture, marketing; Construction machinery leasing; Record range import and export business.Main business coking equipment, metallurgical equipment, casting machinery, engineering machinery, smelting ironNearly three years and recent financial data short list (ten thousand yuan)Serial number of mesh 2008 2009 2010 2011 years1 total assets of 86588 98211 120281 1525611.1 flow assets of 60900 74105 89759 124339Among them: monetary fund 6742 7836 19139 33198 Notes receivable 0 0 0 0Accounts receivable 30537 44391 51931 70941 Advance payment 2329 2147 3712 4673Other receivables 11675 10585 5163 5913Inventory 9618 9147 9813 96131.2 long-term investment of 331 331 0 01.3 net value of fixed assets 25149 23572 30369 28075 1.4 construction in progress 0 0 0 01.5 intangible assets 208 202 154 147Other receivables 255 1133 1430 1317Inventory 18344 23883 22129 215131.2 long-term investment 0 0 0 01.3 net value of fixed assets 33660 39149 50710 54828 1.4 the project under construction 1605 1760 3635 84691.5 intangible assets 339 324 2449 17672 total liabilities 46193 72003 99143 1058882.1 current liabilities 45138 69003 96143 102888Among them: short term loan 20082 41672 57772 55972 Notes payable 11100 15600 29200 35200Accounts payable 4597 3521 4441 6843Deferred payment 7390 5603 2601 2710Other due 967 1215 962 7922.2 long-term loans 1055 3000 3000 30003 the owner's equity 30674 40348 54190 59568Among them: paid-in capital 2136 2136 2136 2136Capital reserve 1216 1216 1216 1216Four business income is 104886 119425 154051 44283Five operating profit 11849 16329 22381 63906 investment income 0.3 0.5 1 07 total profit of 11774 16234 22647 64668 net profit 9174 10275 13841 53789 business activities cash inflow 129392 135913 171038 4961610 business activities cash net flow 8996 6863 16986 865011 investment activity cash net flow - 6876-8813-18870-920012 financing activities cash net flow - 20764 and 11610-2993analysis1, debt paying ability indexItem mesh name called the 2008 2009 2010 in March 2011 industry average (if any)Asset liability ratio 31.67 34.84 45.08 49.83 82.90Current ratio 222.06 216.60 165.53 155.62Quick ratio 186.99 189.86 147.43 140.99 85.50The multiple of interest safeguard 8.48 7.29 5.41 6.06 1.90 For three consecutive years by the enterprise financial statements of the look, asset-liability ratio is low, the multiple of interest safeguard is higher, long-term debt paying ability is strong, flow ratio, quick action is higher, has strong short-term debt paying ability.2, operation ability indexItem mesh name called the 2008 2009 2010 in March 2011 industry average (if any)Inventory turnover ratio 15.46 16.04 17.48 4.33 7.40 Accounts receivable turnover 5.50 4.56 3.89 0.86 3.10Total assets turnover 1.90 1.85 1.72 0.37 1.10For three consecutive years by the enterprise financial statements of the look, three operation ability index are higher than the industry average, show the good operation ability. 3, profitability indexItem mesh name called the 2008 2009 2010 in March 2011 industry average (if any)EBITDA 8680 9788 10728 2375The net interest rate of the sale of 3.56 3.70 3.50 3.13 Return on equity 10.20 10.29 10.08 2.23 2.70For three consecutive years by the enterprise financial statements to see, the company operating stability, in recent years, three indexes keep in a relatively stable level, does not appear fluctuations.。
财务指标(Financial index)
财务指标(Financial index)财务指标是指收集传达财务信息,说明资金活动,反映企业生产经营过程和成果的经济指标。
是可以通过企业的财务报告中的数据计算的指标。
财务指标的优缺点传统的业绩评价大多使用财务指标,用财务指标来评价业绩简单明了。
但是仅用财务指标来评价管理者的业绩存在以下缺陷:(1)财务指标面向过去而不反映未来,不利于评价企业在创造未来价值的能力上的业绩。
(2)财务指标容易被操纵,过分注重企业财务报告中的会计利润,使得企业管理当局采用各种方法操纵利润。
(3)财务指标主要来自财务报表资料,不包含大多数影响企业长期竞争优势的因素,如产品质量,员工的素质和技能,也不能反映经营过程和顾客的满意程度等。
财务指标的选择与运用财务工作实践中,通过对企业财务状况和经营成果进行解剖和分析,能够对企业经济效益的优劣作出准确的评价与判断。
而作为评价与判断标准的财务指标的选择和运用尤为重要。
一、根据企业选指标要根据不同的对象确定不同的指标。
规模一般跨国公司、大型企业、母公司等或决策者需要综合性分析指标。
可运用杜邦分析、沃尔比重评分法将指标综合起来进行分析,一个指标内含企业的偿债、营运、盈利等多方信息。
分公司、中小企业、子公司或投资者、债权人适用具体指标分析。
针对不同的财务信息需求者的要求,应具体选择偿债能力分析指标、营运能力分析指标、盈利能力分析指标、发展能力分析指标等。
不应不分对象盲目适用指标分析方法和选择不能体现企业特点的指标作为财务分析指标。
财政部颁布的财务分析指标有近30个,但具体到某个企业的一般性分析不必面面俱到都选择。
一般企业可选择常用的净资产收益率、总资产报酬率、主营业务利润率、成本费用利润率、总资产周转率、流动资产周转率、应收账款周转率、资产负债率、速动比率、资本积累率等10项具有代表性的指标。
二、严把指标运算关1.了解指标生成的运算过程。
会计电算化进入日常工作后,财务指标数据由计算机自动生成,许多指标的计算过程被忽略,若指标波动大,计算生成的结果就不准确。
关于财务比率 英文版
financial ratios1 the meaning of financial ratios financial ratio is a financial statement material as the basis,it will be two related data in the data and deduct get ratio.2 financial ratio classification financial ratio mainly includes the debt paying ability, operation ability, profit ability. Debt paying ability reflect enterprise to repay debts that are due ability, operation ability reflect enterprise use capital efficiency, profitability reflect enterprise profit ability. The above three aspects are connected. For example, profitability will affect short-term and long-term liquidity, and assets operation efficiency and can affect profitability, so financial analysis requires a combination of the ratio.3 financial ratio calculation method1) short-term debt paying ability ratio1 flow ratio = current assetsCurrent liabilitiesTwo quick ratio = quick assetsCurrent liabilities2) long-term debt paying ability ratio1 asset-liability ratio = total liabilitiesTotal assets2 equity ratio = total liabilitiesShareholders' equityThree rights multiplier = total assetsShareholders' equityThe second operation capacity index1 inventory turnover ratio = operating costsAverage inventory2 accounts receivable turnover = operating income Average accounts receivable3 the total assets turnover = operating income Average total assetsThree earnings ratio1 sales (business) net interest rate = net profit Operating income2 sales (business) gross profit rate = operating margin Operating income3 business profitability = operating profitOperating incomeCase analysisThe guarantor name shandong province zibo vermicular cast iron co., LTDTime was established on March 1, 1993 the registered address of huantai county tangshan town village tang chapter line road no. 3Registered capital of 11.3623 million yuan paid-in capital of21.3623 million yuanCharacteristics of the enterprise co., LTD., the legal representative ZhangYueChengScope of business cast iron parts, machinery processing, building engineering machinery manufacture, marketing; Construction machinery leasing; Record range import and export business.Main business coking equipment, metallurgical equipment, casting machinery, engineering machinery, smelting ironNearly three years and recent financial data short list (ten thousand yuan)Serial number of mesh 2008 2009 2010 2011 years1 total assets of 86588 98211 120281 1525611.1 flow assets of 60900 74105 89759 124339Among them: monetary fund 6742 7836 19139 33198 Notes receivable 0 0 0 0Accounts receivable 30537 44391 51931 70941 Advance payment 2329 2147 3712 4673Other receivables 11675 10585 5163 5913Inventory 9618 9147 9813 96131.2 long-term investment of 331 331 0 01.3 net value of fixed assets 25149 23572 30369 28075 1.4 construction in progress 0 0 0 01.5 intangible assets 208 202 154 147Other receivables 255 1133 1430 1317Inventory 18344 23883 22129 215131.2 long-term investment 0 0 0 01.3 net value of fixed assets 33660 39149 50710 54828 1.4 the project under construction 1605 1760 3635 84691.5 intangible assets 339 324 2449 17672 total liabilities 46193 72003 99143 1058882.1 current liabilities 45138 69003 96143 102888Among them: short term loan 20082 41672 57772 55972 Notes payable 11100 15600 29200 35200Accounts payable 4597 3521 4441 6843Deferred payment 7390 5603 2601 2710Other due 967 1215 962 7922.2 long-term loans 1055 3000 3000 30003 the owner's equity 30674 40348 54190 59568Among them: paid-in capital 2136 2136 2136 2136Capital reserve 1216 1216 1216 1216Four business income is 104886 119425 154051 44283Five operating profit 11849 16329 22381 63906 investment income 0.3 0.5 1 07 total profit of 11774 16234 22647 64668 net profit 9174 10275 13841 53789 business activities cash inflow 129392 135913 171038 4961610 business activities cash net flow 8996 6863 16986 865011 investment activity cash net flow - 6876-8813-18870-920012 financing activities cash net flow - 20764 and 11610-2993analysis1, debt paying ability indexItem mesh name called the 2008 2009 2010 in March 2011 industry average (if any)Asset liability ratio 31.67 34.84 45.08 49.83 82.90Current ratio 222.06 216.60 165.53 155.62Quick ratio 186.99 189.86 147.43 140.99 85.50The multiple of interest safeguard 8.48 7.29 5.41 6.06 1.90 For three consecutive years by the enterprise financial statements of the look, asset-liability ratio is low, the multiple of interest safeguard is higher, long-term debt paying ability is strong, flow ratio, quick action is higher, has strong short-term debt paying ability.2, operation ability indexItem mesh name called the 2008 2009 2010 in March 2011 industry average (if any)Inventory turnover ratio 15.46 16.04 17.48 4.33 7.40 Accounts receivable turnover 5.50 4.56 3.89 0.86 3.10Total assets turnover 1.90 1.85 1.72 0.37 1.10For three consecutive years by the enterprise financial statements of the look, three operation ability index are higher than the industry average, show the good operation ability. 3, profitability indexItem mesh name called the 2008 2009 2010 in March 2011 industry average (if any)EBITDA 8680 9788 10728 2375The net interest rate of the sale of 3.56 3.70 3.50 3.13 Return on equity 10.20 10.29 10.08 2.23 2.70For three consecutive years by the enterprise financial statements to see, the company operating stability, in recent years, three indexes keep in a relatively stable level, does not appear fluctuations.。
财务指标分析RATIOS

1、变现能力比率变现能力是企业产生现金的能力,它取决于可以在近期转变为现金的流动资产的多少。
(1)流动比率公式:流动比率=流动资产合计 / 流动负债合计企业设置的标准值:2意义:体现企业的偿还短期债务的能力。
流动资产越多,短期债务越少,则流动比率越大,企业的短期偿债能力越强。
分析提示:低于正常值,企业的短期偿债风险较大。
一般情况下,营业周期、流动资产中的应收账款数额和存货的周转速度是影响流动比率的主要因素(2)速动比率公式:速动比率=(流动资产合计-存货)/ 流动负债合计保守速动比率=0.8(货币资金+短期投资+应收票据+应收账款净额)/ 流动负债企业设置的标准值:1意义:比流动比率更能体现企业的偿还短期债务的能力。
因为流动资产中,尚包括变现速度较慢且可能已贬值的存货,因此将流动资产分析提示:低于1 的速动比率通常被认为是短期偿债能力偏低。
影响速动比率的可信性的重要因素是应收账款的变现能力,账面上的应收账款不一定都变现能力分析总提示:(1)增加变现能力的因素:可以动用的银行贷款指标;准备很快变现的长期资产;偿债能力的声誉。
(2)减弱变现能力的因素:未作记录的或有负债;担保责任引起的或有负债。
2、资产管理比率(1)存货周转率公式:存货周转率=产品销售成本 / [(期初存货+期末存货)/2]企业设置的标准值:3意义:存货的周转率是存货周转速度的主要指标。
提高存货周转率,缩短营业周期,可以提高企业的变现能力。
分析提示:存货周转速度反映存货管理水平,存货周转率越高,存货的占用水平越低,流动性越强,存货转换为现金或应收账款的速度越快。
它不仅影(2)存货周转天数Days sales in inventory公式:存货周转天数=360/存货周转率 =[360*(期初存货+期末存货)/2]/ 产品销售成本企业设置的标准值:120意义:企业购入存货、投入生产到销售出去所需要的天数。
提高存货周转率,缩短营业周期,可以提高企业的变现能力。
中级财务会计Topic 4 Financial Ratio Analysis
The current ratio is an indication of a firm's market liquidity and ability to meet creditor's demands. Acceptable current ratios vary from industry to industry. If a company's current ratio is in this range, then it is generally considered to have good short-term financial strength. If current liabilities exceed current assets (the current ratio is below 1), then the company may have problems meeting its short-term obligations. If the current ratio is too high, then the company may not be efficiently using its current assets or its short-term financing facilities. This may also indicate problems in working capital management.
流动比率是一个财务比率衡量在接下来的12个 月企业是否有足够的资源来支付其债务,是公 司的流动资产比流动负债。它是表示如下:
For example, if WXY Company's current assets are $50,000,000 and its current liabilities are $40,000,000, then its current ratio would be $50,000,000 divided by $40,000,000, which equals 1.25. It means that for every dollar the company owes in the short term it has $1.25 available in assets that can be converted to cash in the short term. A current ratio of assets to liabilities of 2:1 is usually considered to be acceptable (i.e., your current assets are twice your current liabilities).[1]
03. Financial Ratio Analysis 财务分析 国外MBA课程英文版 之 比率分析
Financial ratio analysisA reading prepared by Pamela Peterson DrakeO U T L I N E1.Introduction2.Liquidity ratios3.Profitability ratios and activity ratios4.Financial leverage ratios5.Shareholder ratios1.IntroductionAs a manager, you may want to reward employees based on their performance. How do you know how well they have done? How can you determine what departments or divisions have performed well? As a lender, how do decide the borrower will be able to pay back as promised? As a manager of a corporation how do you know when existing capacity will be exceeded and enlarged capacity will be needed? As an investor, how do you predict how well the securities of one company will perform relative to that of another? How can you tell whether one security is riskier than another? We can address all of these questions through financial analysis.Financial analysis is the selection, evaluation, and interpretation of financial data, along with other pertinent information, to assist in investment and financial decision-making. Financial analysis may be used internally to evaluate issues such as employee performance, the efficiency of operations, and credit policies, and externally to evaluate potential investments and the credit-worthiness of borrowers, among other things.The analyst draws the financial data needed in financial analysis from many sources. The primary source is the data provided by the company itself in its annual report and required disclosures. The annual report comprises the income statement, the balance sheet, and the statement of cash flows, as well as footnotes to these statements. Certain businesses are required by securities laws to disclose additional information.Besides information that companies are required to disclose through financial statements, other information is readily available for financial analysis. For example, information such as the market prices of securities of publicly-traded corporations can be found in the financial press and the electronic media daily. Similarly, information on stock price indices for industries and for the market as a whole is available in the financial press.Another source of information is economic data, such as the Gross Domestic Product and Consumer Price Index, which may be useful in assessing the recent performance or future prospects of a company or industry. Suppose you are evaluating a company that owns a chain of retail outlets. What information do you need to judge the company's performance and financial condition? You need financial data, but it doesn't tell the whole story. You also need information on consumerspending, producer prices, consumer prices, and the competition. This is economic data that is readily available from government and private sources.Besides financial statement data, market data, and economic data, in financial analysis you also need to examine events that may help explain the company's present condition and may have a bearing on its future prospects. For example, did the company recently incur some extraordinary losses? Is the company developing a new product? Or acquiring another company? Is the company regulated? Current events can provide information that may be incorporated in financial analysis.The financial analyst must select the pertinent information, analyze it, and interpret the analysis, enabling judgments on the current and future financial condition and operating performance of the company. In this reading, we introduce you to financial ratios -- the tool of financial analysis. In financial ratio analysis we select the relevant information -- primarily the financial statement data -- and evaluate it. We show how to incorporate market data and economic data in the analysis and interpretation of financial ratios. And we show how to interpret financial ratio analysis, warning you of the pitfalls that occur when it's not used properly.We use Microsoft Corporation's 2004 financial statements for illustration purposes throughout this reading. You can obtain the 2004 and any other year's statements directly from Microsoft. Be sure to save these statements for future reference.Classification of ratiosA ratio is a mathematical relation between one quantity and another. Suppose you have 200 apples and 100 oranges. The ratio of apples to oranges is 200 / 100, which we can more conveniently express as 2:1 or 2. A financial ratio is a comparison between one bit of financial information and another. Consider the ratio of current assets to current liabilities, which we refer to as the current ratio. This ratio is a comparison between assets that can be readily turned into cash -- current assets -- and the obligations that are due in the near future -- current liabilities. A current ratio of 2:1 or 2 means that we have twice as much in current assets as we need to satisfy obligations due in the near future.Ratios can be classified according to the way they are constructed and their general characteristics. By construction, ratios can be classified as a coverage ratio, a return ratio, a turnover ratio, or a component percentage:1. A coverage ratio is a measure of a company's ability to satisfy (meet) particular obligations.2. A return ratio is a measure of the net benefit, relative to the resources expended.3. A turnover ratio is a measure of the gross benefit, relative to the resources expended.4. A component percentage is the ratio of a component of an item to the item.When we assess a company's operating performance, we want to know if it is applying its assets in an efficient and profitable manner. When we assess a company's financial condition, we want to know if it is able to meet its financial obligations.There are six aspects of operating performance and financial condition we can evaluate from financial ratios:1. A liquidity ratio provides information on a company's ability to meet its short−term,immediate obligations.2. A profitability ratio provides information on the amount of income from each dollar ofsales.3.An activity ratio relates information on a company's ability to manage its resources (that is,its assets) efficiently.4. A financial leverage ratio provides information on the degree of a company's fixedfinancing obligations and its ability to satisfy these financing obligations.5. A shareholder ratio describes the company's financial condition in terms of amounts pershare of stock.6. A return on investment ratio provides information on the amount of profit, relative to theassets employed to produce that profit.We cover each type of ratio, providing examples of ratios that fall into each of these classifications.2.Liquidity RatiosLiquidity reflects the ability of a company to meet its short-term obligations using assets that are most readily converted into cash. Assets that may be converted into cash in a short period of time are referred to as liquid assets; they are listed in financial statements as current assets. Current assets are often referred to as working capital because these assets represent the resources needed for the day-to-day operations of the company's long-term, capital investments. Current assets are used to satisfy short-term obligations, or current liabilities. The amount by which current assets exceed current liabilities is referred to as the net working capital.1The role of the operating cycleHow much liquidity a company needs depends on its operating cycle. The operating cycle is the duration between the time cash is invested in goods and services to the time that investment produces cash. For example, a company that produces and sells goods has an operating cycle comprising four phases:(1)purchase raw material and produce goods, investing in inventory;(2)sell goods, generating sales, which may or may not be for cash;(3)extend credit, creating accounts receivables, and(4) collect accounts receivables, generating cash.The operating cycle is the length of time it takes to convert an investment of cash in inventory back into cash (through collections of sales). The net operating cycle is the length of time it takes to convert an investment of cash in inventory and back into cash considering that some purchases are made on credit.The number of days a company ties up funds in inventory is determine by:(1)the total amount of money represented in inventory, and(2)the average day's cost of goods sold.The current investment in inventory -- that is, the money "tied up" in inventory -- is the ending balance of inventory on the balance sheet. The average day's cost of goods sold is the cost of goods1 You will see reference to the net working capital (i.e., current assets – current liabilities) as simply working capital, which may be confusing. Always check the definition for the particular usage because both are common uses of the term working capital.sold on an average day in the year, which can be estimated by dividing the cost of goods sold found on the income statement by the number of days in the year.We compute the number of days of inventory by calculating the ratio of the amount of inventory on hand (in dollars) to the average day's Cost of Goods Sold (in dollars per day):365/ sold goods of Cost Inventory sold goods of cost s day' Average Inventory inventory days of Number == If the ending inventory is representative of the inventory throughout the year, the number of days inventory tells us the time it takes to convert the investment in inventory into sold goods. Why worry about whether the year-end inventory is representative of inventory at any day throughout the year? Well, if inventory at the end of the fiscal year-end is lower than on any other day of the year, weinventory. balance of inventory wouldbe lower than the typicaldaily inventory of the year. look at quarterly financial inventory balances to get a better idea of the typical other ratios, we will make a note of this problem and ratios. We can extend the same number of days between a sale -- when an account receivable is created -- to the time it is collected in balance of receivables at receivables on any day throughout the year, then it takes, on average, approximately the "number of days credit" to collect the accounts receivable, or the number of days receivables:==Accounts receivable Accounts receivable Number of days receivables Average day's sales on credit Sales on credit / 365What does the operating cycle have to do with liquidity? The longer the operating cycle, the more current assets needed (relative to current liabilities) because it takes longer to convert inventories and receivables into cash. In other words, the longer the operating cycle, the more net working capital required.We also need to look at the liabilities on the balance sheet to see how long it takes a company to pay its short-term obligations. We can apply the same logic to accounts payable as we did to accounts receivable and inventories. How long does it take a company, on average, to go from creating a payable (buying on credit) to paying for it in cash?==Accounts payable Accounts payable Number of days payables Average day's purchases Purchases / 365First, we need to determine the amount of an average day's purchases on credit. If we assume all purchases are made on credit, then the total purchases for the year would be the Cost of Goods Sold, less any amounts included in this Cost of Goods Sold that are not purchases.2The operating cycle tells us how long it takes to convert an investment in cash back into cash (by way of inventory and accounts receivable):Number of days Number of days Operating cycle of inventory of receivables=+ The number of days of purchases tells us how long it takes use to pay on purchases made to create the inventory. If we put these two pieces of information together, we can see how long, on net, we tie up cash. The difference between the operating cycle and the number of days of payables is the net operating cycle:Net operating cycle = Operating Cycle - Number of days of purchasesor, substituting for the operating cycle,purchasesof days of Number s receivable of days of Number inventory of days of Number cycle operating Net −+= The net operating cycle therefore tells us how long ittakes for the company to get cash back from its investment in inventory and accountsreceivable, considering that purchases may be made on credit. By not paying for purchases immediately (that is, using trade credit), the company reduces its liquidity needs. Therefore, the longer the net operating cycle, the greater the company’s need for liquidity.Microsoft's Number of Days Receivables 2004: Average day's receivables = $36,835 million / 365 = $100.9178 million Number of days receivables = $5,890 million / $100.9178 million = 58.3643 days Now try it for 2005 using the 2005 data from Microsoft’s financial statements. Answer: 65.9400 days Source of data: Income Statement and Balance Sheet, Microsoft Corporation Annual Report 20052For example, depreciation is included in the Cost of Goods Sold, yet it not a purchase. However, as a quite proxy for purchases, we can use the accounting relationship: beginning inventory + purchases = COGS + ending inventory.Measures of liquidityLiquidity ratios provide a measure of a company’s ability to generate cash to meet its immediate needs. There are three commonly used liquidity ratios:1. The current ratio is the ratio of current assets to current liabilities; Indicates a company's ability to satisfy its current liabilities with its current assets:sliabilitie Current assets Current ratio Current = 2. The quick ratio is the ratio of quick assets (generally current assets less inventory) to current liabilities; Indicates a company's ability to satisfy current liabilities with its most liquid assetssliabilitie Current Inventory - assets Current ratio Quick = 3. The net working capital to sales ratio is the ratio of net working capital (current assets minus current liabilities) to sales; Indicates a company's liquid assets (after meetingshort −term obligations) relative to its need for liquidity (represented by sales)Saless liabilitie Current - assets Current ratio sales to capital working Net = Generally, the larger these liquidity ratios, the better the ability of the company to satisfy its immediate obligations. Is there a magic number that defines good or bad? Not really.Consider the current ratio. A large amount of current assets relative to current liabilities provides assurance that the company will be able to satisfy its immediate obligations. However, if there are more current assets than the company needs to provide this assurance, the company may be investing too heavily in these non- or low-earning assets and therefore not putting the assets to the most productive use.Another consideration is the operating cycle. A company with a long operating cycle may have more need to liquid assets than a company with a short operating cycle. That’s because a long operating cycle indicate that money is tied up in inventory (and then receivables) for a longer length of time. Microsoft Liquidity Ratios -- 2004Current ratio = $70,566 million / $14,696 million = 4.8017Quick ratio = ($70,566-421) / $14,696 = 4.7731Net working capital-to-sales = ($70,566-14,969) / $36,835 = 1.5515Source of data: Balance Sheet and Income Statement, Microsoft Corporation Annual Report 20053. Profitability ratiosProfitability ratios (also referred to as profit margin ratios ) compare components of income with sales. They give us an idea of what makes up a company's income and are usually expressed as a portion of each dollar of sales. The profit margin ratios we discuss here differ only by the numerator. It's in the numerator that we reflect and thus evaluate performance for different aspects of the business: The gross profit margin is the ratio of gross income or profit to sales. This ratio indicates how much of every dollar of sales is left after costs of goods sold:Gross income Gross profit marginSales = The operating profit margin is the ratio of operating profit (a.k.a. EBIT, operating income, income before interest and taxes) to sales. This is a ratio that indicates how much of each dollar of sales is left over after operating expenses: Microsoft's 1998 Profit MarginsGross profit margin = ($14,484 - 1,197)/$14,484 = 91.736%Operating profit margin = $6,414 / $14,484 = 44.283%Net profit margin = $4,490 / $14,484 = 31% Source of data: Microsoft Corporation Annual Report 1998 ___ Microsoft's 2004 Profit MarginsGross profit margin = ($36,835 – 6,716)/$36,835 = 81.767%Operating profit margin = $9,034 / $36,835 = 24.526%Net profit margin = $8,168 / $36,835 = 22.175%Source of data: Income Statement, Microsoft Corporation Annual Report2005 Operating incomeOperating profit margin = Sales The net profit margin is the ratio of net income (a.k.a. net profit) to sales, and indicates how much of each dollar of sales is left over after all expenses: Net income Net profit margin Sales=. 4. Activity ratiosActivity ratios are measures of how well assets are used. Activity ratios -- which are, for the most part, turnover ratios -- can be used to evaluate the benefits produced by specific assets, such as inventory or accounts receivable. Or they can be use to evaluate the benefits produced by all a company's assets collectively.These measures help us gauge how effectively the company is at putting its investment to work. A company will invest in assets – e.g., inventory or plant and equipment – and then use these assets to generate revenues. The greater the turnover, the more effectively the company is at producing a benefit from its investment in assets.The most common turnover ratios are the following:1. Inventory turnover is the ratio of cost of goods sold to inventory. This ratio indicates how many times inventory is created and sold during the period:Inventorysold goods of Cost turnover Inventory = 2. Accounts receivable turnover is the ratio of net credit sales to accounts receivable. This ratio indicates how many times in the period credit sales have been created and collected on:receivableAccounts credit on Sales turnover receivable Accounts = 3. Total asset turnover is the ratio of sales to total assets. This ratio indicates the extent that the investment in total assets results in sales.assetsTotal Sales turnover asset Total = 4. Fixed asset turnover is the ratio of sales to fixed assets. This ratio indicates the ability of the company’s management to put the fixed assets to work to generate sales:assetsFixed Sales turnover asset Fixed = Microsoft’s Activity Ratios – 2004Accounts receivable turnover = $36,835 / $5,890 = 6.2538 times Total asset turnover = $36,835 / $92,389 = 0.3987 timesSource of data: Income Statement and Balance Sheet, Microsoft Corporation AnnualReport 2005Turnovers and numbers of daysYou may have noticed that there is a relation between the measures of the operating cycle and activity ratios. This is because they use the same information and look at this information from different angles. Consider the number of days inventory and the inventory turnover:=Inventory Number of days inventoryInventorysold goods of Cost turnover Inventory = The number of days inventory is how long the inventory stays with the company, whereas the inventory turnover is the number of times that the inventory comes and leaves – the complete cycle – within a period. So if the number of days inventory is 30 days, this means that the turnover within the year is 365 / 30 = 12.167 times. In other words,==365365Cost of goods sold Inventory turnover =Inventory Number of days inventory Inventory5. Financial leverage ratiosA company can finance its assets either with equity or debt. Financing through debt involves risk because debt legally obligates the company to pay interest and to repay the principal as promised. Equity financing does not obligate the company to pay anything -- dividends are paid at the discretion of the board of directors. There is always some risk, which we refer to as business risk, inherent in any operating segment of a business. But how a company chooses to finance its operations -- the particular mix of debt and equity -- may add financial risk on top of business risk Financial risk is the extent that debt financing is used relative to equity.Financial leverage ratios are used to assess how much financial risk the company has taken on. There are two types of financial leverage ratios: component percentages and coverage ratios. Component percentages compare a company's debt with either its total capital (debt plus equity) or its equity capital. Coverage ratios reflect a company's ability to satisfy fixed obligations, such as interest, principal repayment, or lease payments.Component-percentage financial leverage ratiosThe component-percentage financial leverage ratios convey how reliant a company is on debt financing. These ratios compare the amount of debt to either the total capital of the company or to the equity capital.1. The total debt to assets ratio indicates the proportion of assets that are financed withdebt (both short −term and long −term debt):assetsTotal debt Total ratio assets to debt Total = Remember from your study of accounting that total assets are equal to the sum of total debt and equity. This is the familiar accounting identity : assets = liabilities + equity.2. The long −term debt to assets ratio indicates the proportion of the company's assets thatare financed with long −term debt.assetsTotal debt term -Long ratio assets to debt term -Long =3. The debt to equity ratio (a.k.a. debt-equity ratio ) indicates the relative uses of debt and equity as sources of capital to finance the company's assets, evaluated using book values of the capital sources:equity rs'shareholde Total debt Totalratio equity to debt Total = One problem (as we shall see)with looking at risk through a financial ratio that uses the book value of equity (the stock) is that most often there is little relation between the book value and its market value. The book value ofequity consists of:• the proceeds to the company of all the stock issued since it was first incorporated, less any treasury stock (stock repurchased by thecompany); and • the accumulation of all the earnings of the company, less any dividends, since it was first incorporated. Let's look at an example of the book value vs. market value of equity. IBM was incorporated in 1911. So its book value of equity represents the sum of all its stock issued and all its earnings, less all dividends paid since 1911. As of the end of 2003, IBM's book value of equity was approximately $28 billion and its market value of equity was approximately $162 billion. The book value understates its market value by over $130 billion. The book value generally does not give a true picture of the investment of shareholders in the company because:Note that the debt-equity ratio is related to the debt-to-total assets ratio because they are both measures of the company’s capital structure. The capital structure is the mix of debt and equity that the company uses to finance its assets. Let’s use short-hand notation to demonstrate this relationship. Let D represent total debt and E represent equity. Therefore, total assets are equal to D+E. If a company has a debt-equity ratio of 0.25, this means that is debt-to-asset ratio is 0.2. We calculate it by using the ratio relationshipsand Algebra: D/E = 0.25 D = 0.25 E Substituting 0.25 E for D in the debt-to-assets ratio D/(D+E): D/(D+E) = 0.25 E / (0.25 E + E) = 0.25 E / 1.25 E = 0.2In other words, a debt-equity ratio of 0.25 is equivalent to a debt-to-assets ratio of 0.2This is a handy device: if you are given a debt-equity ratio and need the debt-assets ratio, simply: D/(D+E) = (D/E) / (1 + D/E) Why do we bother to show this? Because many financial analysts discuss or report a company’s debt-equity ratio and you are left on your own to determine what this means in terms of the proportion of debt in the company’s capital structure. •earnings are recorded according to accounting principles, which may not reflect the true economics of transactions, and • due to inflation, the dollars from earnings and proceeds from stock issued in the past do not reflect today's values.The market value, on the other hand, is the value of equity as perceived by investors. It is what investors are willing to pay, its worth. So why bother with the book value of equity? For two reasons: first, it is easier to obtain the book value than the market value of a company's securities, and second, many financial services report ratios using the book value, rather than the market value. We may use the market value of equity in the denominator, replacing the book value of equity. To do this, we need to know the current number of shares outstanding and the current market price per share of stock and multiply to get the market value of equity.Coverage financial leverage ratiosIn addition to the leverage ratios that use information about how debt is related to either assets or equity, there are a number of financial leverage ratios that capture the ability of the company to satisfy its debt obligations. There are many ratios that accomplish this, but the two most common ratios are the times interest coverage ratio and the fixed charge coverage ratio.The times-interest-coverage ratio, also referred to as the interest coverage ratio, compares the earnings available to meet the interest obligation with the interest obligation:Interesttaxes and interest before Earnings ratio coverage -interest -Times = The fixed charge coverage ratio expands on the obligations covered and can be specified to include any fixed charges, such as lease payments and preferred dividends. For example, to gauge a company’s ability to cover its interest and lease payments, you could use the following ratio:paymentLease Interest payment Lease taxes and interest before Earnings ratio coverage charge - Fixed ++= Coverage ratios are often used in debt covenants to help protect the creditors.Microsoft’s Financial Leverage Ratios – 2004Total debt to total assets = ($94,368 - 74,825) / $94,368 = 0.20709 or 20.709%Debt to equity ratio = ($94,368 - 74,825) / $74,825 = 0.26118 or 26.118%Source of data: Balance sheet, Microsoft Corporation Annual Report 20056. Shareholder ratiosThe ratios we have explained to this point deal with the performance and financial condition of the company. These ratios provide information for managers (who are interested in evaluating the performance of the company) and for creditors (who are interested in the company's ability to pay its obligations). We will now take a look at ratios that focus on the interests of the owners -- shareholder ratios. These ratios translate the overall results of operations so that they can be compared in terms of a share of stock:Earnings per share (EPS) is the amount of income earned during a period per share of common stock.goutstandin shares of Number rs shareholde to available income Net share per Earnings = As we learned earlier in the study of Financial Statement Information, two numbers of earnings per share are currently disclosed in financial reports: basic and diluted. These numbers differ with respect to the definition of available net income and the number of shares outstanding. Basic earnings per share are computed using reported earnings and the average number of shares outstanding. Diluted earnings per share are computed assuming that all potentially dilutive securities are issued. That means we look at a “worst case” scenario in terms of the dilution of earnings from factors such as executive stock options, convertible bonds, convertible preferred stock, and warrants. Suppose a company has convertible securities outstanding, such as convertible bonds. In calculating diluted earnings per share, we consider what would happen to both earnings and the number of。
所财务报表分析(Financial
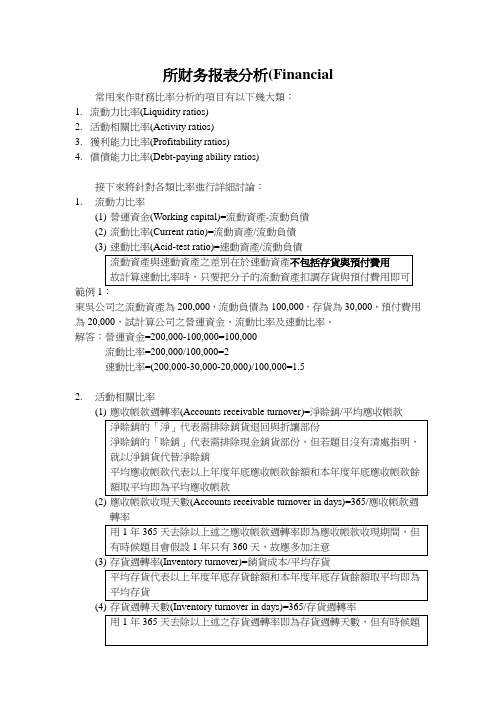
所财务报表分析(Financial所財務報表分析(Financial statement analysis)是指利用財務報表中之相關資訊作財務比率分析,以辨認企業之相關風險,亦可評估企業之財務狀況與經營成本是否良好。
常用來作財務比率分析的項目有以下幾大類:1.流動力比率(Liquidity ratios)2.活動相關比率(Activity ratios)3.獲利能力比率(Profitability ratios)4.償債能力比率(Debt-paying ability ratios)接下來將針對各類比率進行詳細討論:1.流動力比率(1)營運資金(Working capital)=流動資產-流動負債⑵流動比率(Current ratio)=流動資產/流動負債(3)速動比率(Acid-test ratio)=速動資產/流動負債流動資產與速動資產之差別在於速動資產不包括存貨與預付費用故計算速動比率時,只要把分子的流動資產扣調存貨與預付費用即可範例1:東吳公司之流動資產為200,000,流動負債為100,000,存貨為30,000,預付費用為20,000,試計算公司之營運資金、流動比率及速動比率。
解答:營運資金=200,000-100,000=100,000流動比率=200,000/100,000=2速動比率=(200,000-30,000-20,000)/100,000=1.52.活動相關比率(1)應收帳款週轉率(Accounts receivable turnover)=淨賒銷/平均應收帳款淨賒銷的「淨」代表需排除銷貨退回與折讓部份淨賒銷的「賒銷」代表需排除現金銷貨部份,但若題目沒有清處指明,就以淨銷貨代替淨賒銷平均應收帳款代表以上年度年底應收帳款餘額和本年度年底應收帳款餘額取平均即為平均應收帳款(2)應收帳款收現天數(Accounts receivable turnover in days)=365/ 應收帳款週轉率(3)存貨週轉率(Inventory turnover)= 銷貨成本/平均存貨⑷ 存貨週轉天數(Inventory turnover in days)=365/存貨週轉率用1年365天去除以上述之存貨週轉率即為存貨週轉天數,但有時候題目會假設1年只有360天,故應多加注意⑸ 應付帳款週轉率(Acoounts payable turnover)=銷貨成本/平均應付帳款平均應付帳款代表以上年度年底應付帳款餘額和本年度年底應付帳款餘額取平均即為平均應付帳款⑹ 應付帳款收現天數(Acoounts payable turnover in days)=365/應付帳款週轉率⑺總資產週轉率(Total asset turnover)=淨銷貨/平均總資產範例2:東吳公司財務報表相關資訊如下:97年底98年底應收帳款80,000 100,000存貨100,000 130,000總資產600,000 750,000應付帳款40,000 50,000總負債300,000 320,000銷貨收入(現銷部份皆為100,000) 500,000 800,000銷貨退回(賒銷部份) 2,000 3,000銷貨折讓(賒銷部份) 1,000 3,000銷貨成本300,000 400,000淨利36,000 58,000試計算98年度上述各種活動比率,假設1年有365天。
Financial_Ratios
• Return on Assets =
Net Profit Average Total Assets
* 100
• Return on Equity =
Net Profit *100 Average Total Equity
• Trend percentage • Line-by-line item analysis • Items are expressed as a percentage of a base year • This is a time series analysis • For example, a line item could look at increase in sales turnover over a period of 5 years to identify what the growth in sales is over this period.
– focus on net profit
• Assessing the return on assets and return on equity
5
Profitability Ratios
• Gross Profit % = Gross Profit * 100 Net Sales • Net Profit % = Net Profit after tax * 100 Net Sales Or in some cases, firms use the net profit before tax figure. Firms have no control over tax expense as they would have over other expenses.
财务指标分析RATIOS
财务指标分析RATIOS
投资评价有许多不同的指标,但财务比率指标(Financial Ratios)是最常用的投资评价指标之一、财务比率是根据公司财务报表中的财务数据计算出来的,可以反映公司财务状况,从而帮助投资者分析公司的发展趋势和投资价值。
一般而言,财务比率指标包括成长类比率,利润类比率,现金流类比率和存货类比率。
1.成长类比率
成长类比率指标反映公司的发展和前景,一般投资者会通过比较销售收入、营业收入、净利润和资产等指标,来分析公司的发展趋势。
例如,营业收入增长率(Sales Growth Rate)可以反映公司销售收入的增长情况,而净利润增长率(Net Profit Growth rate)则可以反映公司利润水平的提高情况。
2.利润类比率
利润类比率指标反映公司的盈利能力,一般投资者会通过比较毛利率(Gross Profit Margin)、净利率(Net Profit Margin)、收入利润率(Return on Sales)、股东权益报酬率(Return on Equity)等景气类比率,来分析公司是否有良好的盈利能力。
例如,毛利率(Gross Profit Margin)指的是一家公司的销售收入中扣除原材料费用、生产成本和研发费用后,剩余收入的百分比,是衡量公司经营利润能力的重要指标。
Financial Ratios(财务指标)
Financial Ratios Notes:Big textbook page 488 - 492Financial Ratios (Standardized Measures)•Used by managers for planning and current evaluationUsed by credit managers to assess risk•Used by investors to assess stocks and bondsUsed to compare with other firms or industry standardsUsed to study the efficiency of operationsFactors that banks consider●• Credit worthiness of the borrower●• Integrity/reputation●• Credit risk profile●• Sensitivity to economic and market developments●• Liquidity –ability to cover current obligations●• Solvency –cover debt obligations●• Profitability of business●• Resource efficiency –example, manage money●• Analysis of projected financial statementsWhat are ratios and why are they good for analysis?●It takes the absolute numbers from a company’s financials andconverts them into meaningful indicators. (% or multiple)●Can indicate areas of potential strengths and weakness●Predict returns● A ratio is not absolute answers, but clues to understanding thecompany.●Shows ways in which firm’s situation deviates from: 1. It’sown past, 2. Other firms 3. The industryKeep in mind…● A good ratio for one company might not be appropriate for another.Therefore..1. …evaluate the ratio in the context of the business, industry and economic environment (produce vs. jewelry)2. Ratios should be evaluated in comparison with the industry and competitors (Benchmarking and Peer Group Analysis)●As your team considers each ratio, ask yourself what the ratio is trying tomeasure and why that information is important.Ratio ……(Turnover)●Example:●Inventory turnover measures efficiency of the firm in managing & sellinginventory.●Inventory turnover can tell us which products are selling fast and whichproducts are not selling fast.●Question: Does a low inventory turnover mean a company is not sellingenough products?●Answer: No! Perhaps the company is carrying too much inventory.Where are ratios found in the AR?● 1. Financial Highlights● 2. Historical summary of financial data● 3. MD&ARatios are generally grouped into 5 categories handout pg. 210● 1. liquidity● 2. debt (solvency ratio)● 3. profitability: asses profits relative to amount of resourcesused.● 4. Cash flow● 5. market measures: asses market price relative to assets orearnings.There are two important liquidity ratios:●Current Ratio●Quick RatioCurrent Ratio: handout pg. 198, big textbook page 489Under normal circumstances, a company will pay its current liabilities (bills due) with its current assets.Very important for creditors and investorsThe higher the ratio, the more capacity there is to pay current liabilities.Min. of 1.0 is good. 2:1 is very healthyA high current ratio means that the company should more easily be able to pay its bills. So that’s good to know if the company owes you money.But … if you’re an investor, too high a current ratio could mean that the company is not using its assets optimally.Balance Sheet: Quick Ratio●Focuses on current assets that can readily be converted to pay currentobligation.● A more rigorous test for short term solvency (it eliminates inventory)●Current assets –inventory/current liabilities●The higher the ratio, the lower the dependence on inventory to pay currentliabilitiesLeverage RatiosLeverage in business refers to how much debt a company uses to finance its operations.The idea is that if a company can borrow money at say 7% and then use this money to make a 27% profit, it’s clever to take out the loan.Two of the most important leverage ratios are:•Total Debt Ratio•Debt to Equity RatioTotal Debt RatioThe Total Debt Ratio shows how much of a company’s assets are financed through loans.Total Debt RatioIn general, a low Total Debt Ratio is good with the critical number being 1.Smaller than one means that the company has more assets than debtVice versa, larger than one mean that the company has more debt than asset. If this is the case you’d better hope they will not go out of business …Debt to Equity Ratio●Measures how much creditors have put into the company versus theshareholders.●The lower the %, the greater the company’s financial safety and operatingfreedom.●Total liabilities/stockholders’equityDebt Equity RatioAs with the Total Debt Ratio, a low Debt Equity Ratio is good with the critical number being 1.Smaller than one means that the company has more equity than debts.Vice versa, larger than one mean that the company has more debts than equity. Investors prefer this number since Equity is after all that which belongs to the stock holders.Return on Assets (ROA)/ROI●Measures how efficient management is in managing its investment in assets.●Measures the profitability of a company’s total resources.●Net income/ total assetsReturn on Equity●Shows how much shareholders earn on their investment (profit generated onshareholder’s invested capital)●The higher the ratio, the higher the return on investment.●Net earnings/stockholders’equityPE Ratio●Indicates the relationship between a company’s market price per share andearnings per share.●Market price of common stock/EPS●Evaluates market price●Example: 2 competitors have EPS of $2.00●A: $10 (MP) B: $20 (MP)●A: PE = 5, B: PE = 10●Higher PE associated with companies with substantial growth potential.●Low PE = slow growth●Measures market prices but not good for evaluating real growth of a company. Earnings Per Share●Shows the return to common shareholders for each share owned.● 2 amounts shown:● 1. primary (basic), 2. fully diluted●Diluted (convertible securities cause more shares to be outstanding. EPSweakens.)●How can a company improve EPS?●Net income/# of shares outstanding.Reading and Question●Chapter 6 handout: (only study ratios discussed in class).●Big text: pages 488 - 492● 1. What are the major categories of ratio and what is as one example of a ratiois each category?● 2. What are some potential problems or shortcomings of using ratios?● 3. What is undefined P/E?● 4. What are some factors that could affect PE ratio of an individual stock?。
(财经英语)Chapter 3 Financial Ratios
• As far as government regulations are concerned, bookkeeping keeps record properly as required by low. (off the mark)
• From the point of view of business owners or managers, first, bookkeeping will give them better financial analysis and management. (unnecessary)
• But Jesus bent down and started to write on the ground with his finger. When they kept on questioning him, he straightened up and said to them, “If any one of you is without sin, let him be the first to throw a stone at her.” Again he stooped down and wrote on the ground.
• At this, those who heard began to go away one at a time, the older ones first, until only Jesus was left, with the woman still standing there… (John 8:2-9)
Financial Ratios
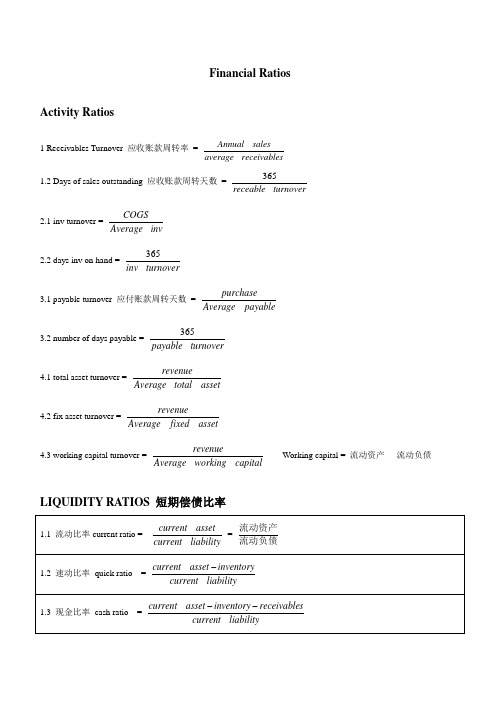
Financial RatiosActivity Ratios1 Receivables Turnover 应收账款周转率 =sreceivable average salesAnnual __1.2 Days of sales outstanding 应收账款周转天数 =turnoverreceable _3652.1 inv turnover =invAverage COGS_2.2 days inv on hand =turnoverinv _3653.1 payable turnover 应付账款周转天数 =payableAverage purchase_3.2 number of days payable =turnoverpayable _3654.1 total asset turnover =assettotal Average revenue__4.2 fix asset turnover =assetfixed Average revenue__4.3 working capital turnover = capitalworking Average revenue__ Working capital = 流动资产 - 流动负债LIQUIDITY RATIOS 短期偿债比率1.1 流动比率current ratio =liabilitycurrent assetcurrent __ = 流动负债流动资产1.2 速动比率 quick ratio =liabilitycurrent inventoryasset current __-1.3 现金比率 cash ratio =liabilitycurrent sreceivable inventory asset current __--1.4 速动资产够用天数 defensive interval =endituresdaily average sreceivable urities marketable cash exp __sec _++1.5 cash conversion cycle = days sales outstanding + days inv. on hand - days payableCurrent asset = current liabilities + cash + marketable securities + receivables + inventoriesSOLVENCY RATIOS1.1 D to E (D :短期债,一年内到期的长期债,剩余长期债)1.2 D to A (严格来说A 要从asset 中扣除 deferred tax liabilities and average payables) 1.3 debt to capital =ED D+ 1.4 Financial leverage = A:E 1.5 Interest coverage = EBIT: interest 1.6 fixed charge coverage = pmtlease erest pmtlease EBIT _int _+-PROFITABILITY RATIOS1.1 Net profit margin = profit / sales or net income/revenue 1.2 Gross profit margin = gross profit / revenue 1.3 operating profit margin = EBIT / revenue2.1 Gross profit = net sales - COGS 2.2 Operating profit = EBIT2.3 Net income = net income before dividends2.4 Total capital = long-term capital + short-term capital + common and preferred equity = Total Asset3.1 return on common E =Equityaverage divpreferred income net ___-It only measures the accounting profits available to , and the capital invested by, common stockholders,instead of common and preferred stockholders. 3.2 ROE = net income / Equity3.3 return on assets =assetstotal average t I income net __)1(*_--To add interest adjusted for tax back to net income puts the returns to both equity and debt holders. 3.4 ROA=net income / AThe DuPont analysis method: to decompose ROEROE =salesincomenet_assetssalesequityassetsNet profit margin Asset turnover Equity multiplier/ leverage ratioROE=EBTincomenet_EBITEBTrevenueEBITassetsrevenueequityassetsTax burdenInterestburdenEBIT marginAssetturnoverEquity multiplier/leverage ratio(sales - COGS = gross profitgross profit - operating expenses(SG&A)= EBIT(operating profit)EBIT -I-T=net incomenet income - preferred dividend = income available for common stockholders )。
04FinancialRatios
Financial Ratios
Overview
Financial Ratios 1 (U15) Financial Ratios 2 (U16)
2
Financial Ratios 1 (U15)
Types of Financial Ratio Liquidity and solvency ratios Earnings and dividends
3
Ratios
Liquidity Ratios 变现(短期偿债)能力比率 Market ratios 市场比率 Profitability ratios 盈利能力比率 Solvency Ratios 偿债能力比率 Activity Ratios 营运能力比率
4
Liquidity Ratios
26
27
Z-Score Financial Analysis Tool
Z-score formula for predicting bankruptcy was published in 1968 by Edward I. Altman, Professor of Finance at New York University`s Stern School of Business. Original Z-score (P39) Z-score estimated for private firms Z-score estimated for Non-Manufacturer Industrials & Emerging Market Credits
7
Market ratios 市场比率
Market ratios measure investor response to owning a company's stock and also the cost of issuing stock. EPS P/E Payout ratio Dividend cover
所财务报表分析(Financial
所财务报表分析(Financial常用來作財務比率分析的項目有以下幾大類:1.流動力比率(Liquidity ratios)2.活動相關比率(Activity ratios)3.獲利能力比率(Profitability ratios)4.償債能力比率(Debt-paying ability ratios)接下來將針對各類比率進行詳細討論:1.流動力比率(1)營運資金(Working capital)=流動資產-流動負債(2)流動比率(Current ratio)=流動資產/流動負債(3)速動比率(Acid-test ratio)=速動資產/流動負債範例1:東吳公司之流動資產為200,000,流動負債為100,000,存貨為30,000,預付費用為20,000,試計算公司之營運資金、流動比率及速動比率。
解答:營運資金=200,000-100,000=100,000流動比率=200,000/100,000=2速動比率=(200,000-30,000-20,000)/100,000=1.52.活動相關比率(1)應收帳款週轉率(Accounts receivable turnover)=淨賒銷/平均應收帳款(2)應收帳款收現天數(Accounts receivable turnover in days)=365/應收帳款週轉率(3)存貨週轉率(Inventory turnover)=銷貨成本/平均存貨(4)存貨週轉天數(Inventory turnover in days)=365/存貨週轉率目會假設1年只有360天,故應多加注意(5)應付帳款週轉率(Acoounts payable turnover)=銷貨成本/平均應付帳款(6)應付帳款收現天數(Acoounts payable turnover in days)=365/應付帳款週轉率(7)總資產週轉率(Total asset turnover)=淨銷貨/平均總資產範例2:東吳公司財務報表相關資訊如下:97年底98年底應收帳款80,000 100,000存貨100,000 130,000總資產600,000 750,000應付帳款40,000 50,000總負債300,000 320,000銷貨收入(現銷部份皆為100,000) 500,000 800,000銷貨退回(賒銷部份) 2,000 3,000銷貨折讓(賒銷部份) 1,000 3,000銷貨成本300,000 400,000淨利36,000 58,000試計算98年度上述各種活動比率,假設1年有365天。
FinanceRatio财务比率分析
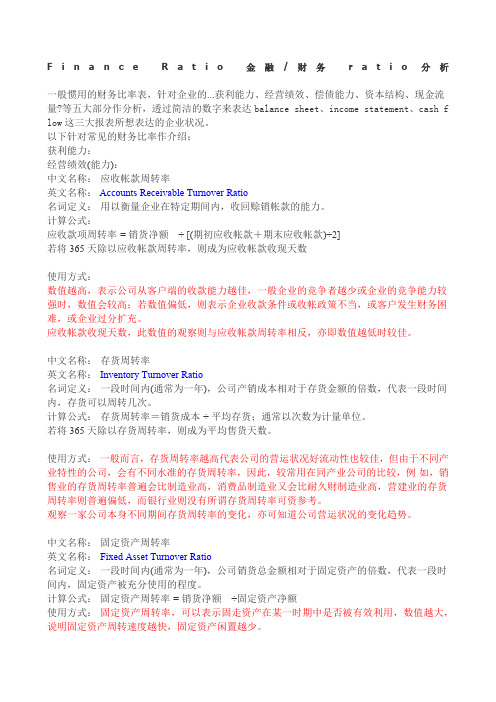
F i n a n c e R a t i o金融/财务r a t i o分析一般惯用的财务比率表,针对企业的...获利能力、经营绩效、偿债能力、资本结构、现金流量?等五大部分作分析,透过简洁的数字来表达balance sheet、income statement、cash f low这三大报表所想表达的企业状况。
以下针对常见的财务比率作介绍:获利能力:经营绩效(能力):中文名称:应收帐款周转率英文名称: Accounts Receivable Turnover Ratio名词定义:用以衡量企业在特定期间内,收回赊销帐款的能力。
计算公式:应收款项周转率= 销货净额÷ [(期初应收帐款+期末应收帐款)÷2]若将365天除以应收帐款周转率,则成为应收帐款收现天数使用方式:数值越高,表示公司从客户端的收款能力越佳,一般企业的竞争者越少或企业的竞争能力较强时,数值会较高;若数值偏低,则表示企业收款条件或收帐政策不当,或客户发生财务困难,或企业过分扩充。
应收帐款收现天数,此数值的观察则与应收帐款周转率相反,亦即数值越低时较佳。
中文名称:存货周转率英文名称:Inventory Turnover Ratio名词定义:一段时间内(通常为一年),公司产销成本相对于存货金额的倍数,代表一段时间内,存货可以周转几次。
计算公式:存货周转率=销货成本÷平均存货;通常以次数为计量单位。
若将365天除以存货周转率,则成为平均售货天数。
使用方式:一般而言,存货周转率越高代表公司的营运状况好流动性也较佳,但由于不同产业特性的公司,会有不同水准的存货周转率,因此,较常用在同产业公司的比较,例如,销售业的存货周转率普遍会比制造业高,消费品制造业又会比耐久财制造业高,营建业的存货周转率则普遍偏低,而银行业则没有所谓存货周转率可资参考。
观察一家公司本身不同期间存货周转率的变化,亦可知道公司营运状况的变化趋势。
- 1、下载文档前请自行甄别文档内容的完整性,平台不提供额外的编辑、内容补充、找答案等附加服务。
- 2、"仅部分预览"的文档,不可在线预览部分如存在完整性等问题,可反馈申请退款(可完整预览的文档不适用该条件!)。
- 3、如文档侵犯您的权益,请联系客服反馈,我们会尽快为您处理(人工客服工作时间:9:00-18:30)。
Quick Ratio / acid test 速动比率
速动比率是公司偿付短期负债能力的指标,该比 率越大,表示公司资金周转越稳健。速动比率与 流动比率相似,差别在于后者所用的流动资产计 入存货,而存货往往是流动资产中最不容易变现 的。它的值一般以1为恰当。
速动资产包括货币资金、短期投资、应收票据、 应收账款、其他应收款项等。而流动资产中存货、 预付账款、待摊费用等则不应计入。
负债权益比率是指企业的负债与所有者权益(股东权益)之 间的比值。在广义的资本结构含义下,负债权益比率是指 企业负债总额与所有者权益(股东权益)之间的比值,又称 为产权比率。在狭义的资本结构含义下,负债权益比率是 指企业的长期负债与所有者权益(股东权益)之间的比值。
杠杆比率亦是反映公司偿债能力的一个指标。比率越高, 意味着公司越容易受景气变动的冲击,股东所承受的风险 也较高,因此会要求较高的回报。杠杆比率是否处于可接 受的水平,通常视与同业相比较的结果。
要维持正常偿债能力,利息保障倍数至少应大于1, 且比值越高,企业长期偿债能力越强。如果利息 保障倍数过低,企业将面临亏损、偿债的安全性 与稳定性下降的风险。
21
Debt ratio 资产负债率
Total debt divided by total assets. 即债权人权益对总资产比率,它表明公司
一般认为该比率保持在20-30之间是正常的。
10
Payout ratio 股息派发比率
亦作Dividend Payout Ratio,股息支付率,股利 分配率,股利发放率;指公司的净利以现金股息 派发给股东的比例,等于每股股息除以每股盈余。
股利发放率=(每股股利/每股净收益)×100%
11
Dividend cover 股息保障倍数
稳健经营的公司的股东权益收益率在10%~25%之间不等。 大多数投资者喜好股东权益收益率为两位数的公司,或至 少高于低风险投资如政府债券的收益率。
18
Solvency Ratios
Leverage Interest cover Debt ratio
19
Gearing/leverage 杠杆比率
9
P/E 市盈率
市盈率是最常用来评估股价水平是否合理的指标 之一。
任何股票若市盈率大大超出同类股票或是大盘, 都需要有充分的理由支持,而这往往离不开该公 司未来盈利料将快速增长这一重点。一家公司享 有非常高的市盈率,说明投资人普遍相信该公司 未来每股盈余将快速成长,以至数年后市盈率可 降至合理水平。一旦盈利增长不如理想,支撑高 市盈率的力量无以为继,股价往往会大幅回落。
的资产总额中,债权人的投资额的大小。
22
Activity Ratios
Activity ratios measure the effectiveness of the firms use of resources.
Asset turnover Inventory turnover
23
Asset turnover 总资产周转率
流动比率的正常范围值为0.5~2.0。较高的比率可能意味 着公司有太多闲置现金、客户拖欠大笔账款,或者公司的 经营需要大量的库存。较低的比率并不一定意味着公司有 无法偿还短期债务的风险,可能只是因为公司所在行业以 支付现金为标准(例如餐馆通常只有很少或没有应收账 款),或其经营不需要太多的库存(例如大多数服务业公 司),或所在行业客户支付的速度较慢(例如建筑业)。
3
Ratios
Liquidity Ratios 变现(短期偿债)能力比率 Market ratios 市场比率 Profitability ratios 盈利能力比率 Solvency Ratios 偿债能力比率 Activity Ratios 营运能力比率
4
Liquidity Ratios
25
DuPont analysis 杜邦分析
杜邦分析法利用几种主要的财务比率之间的关系 来综合地分析企业的财务状况,这种分析方法最 早由美国杜邦公司使用,故名杜邦分析法。
杜邦分析法是一种用来评价公司赢利能力和股东 权益回报水平,从财务角度评价企业绩效的一种 经典方法。
其基本思想是将企业净资产收益率逐级分解为多 项财务比率乘积,这样有助于深入分析比较企业 经营业绩。
存货周转率是企业一定时期主营业务成本与平均存货余额 的比率。存货周转率不仅可以用来衡量企业生产经营各环 节中存货运营效率,而且还被用来评价企业的经营业绩, 反映企业的绩效。
通过存货周转率的计算与分析,可以测定企业一定时期内 存货资产的周转速度,是反映企业购、产、销平衡效率的 一种尺度。存货周转率越高,表明企业存货资产变现能力 越强,存货及占用在存货上的资金周转速度越快。
Original Z-score (P39) Z-score estimated for private firms Z-score estimated for Non-Manufacturer
Industrials & Emerging Market Credits
28
率、销售成本率、销售期间费用率等。
16
ROA 资产收益率
资产收益率,也叫资产回报率(ROA),它是用 来衡量每单位资产创造多少净利润的指标。
特别地,资产收益率是业界应用最为广泛的衡量 银行盈利能力的指标之一,该指标越高,表明企 业资产利用效果越好,说明企业在增加收入和节 约资金使用等方面取得了良好的效果,否则相反。
指企业在一定时期内销售(营业)收入同平均 资产总额的比值。
总资产周转率是综合评价企业全部资产的 经营质量和利用效率的重要指标。周转率 越大,说明总资产周转越快,反映出销售 能力越强。企业可以通过薄利多销的办法, 加速资产的周转,带来利润绝对额的增加。
24
Inventory turnover 存货周转率
ROA对银行很重要。银行管理层出于战略管理的 目的,通常非常密切地关注这一指标。主要是将 该指标与同组的银行进行横向比较,或者与该银 行的历史状况进行纵向比较。
17
ROE 股权收益率
是公司的利润与其股东权益的比率。该比率是最常用于衡 量公司管理层运用股东资金状况的指标。
该比率的主要缺点是忽略了公司融资的债务一面,因此不 能反映在创造收益时所涉及的风险。高股东权益收益率可 以是高收益或低股东权益所致,因此,亦应关注公司的杠 杆(即公司的债务/股东权益比率)。
8
EPS 每股收益
指税后利润与股本总数的比率。 它是测定股票投资价值的重要指标之一,是综合
反映公司获利能力的重要指标。 该比率反映了每股创造的税后利润, 比率越高, 表
明所创造的利润就越多。 若公司只有普通股时,每股收益就是税后利润,
股份数是指发行在外的普通股股数。如果公司还 有优先股,应先从税后利润中扣除分派给优先股 股东的利息。
表达式是将净资产收益率分解为三部分:利润率, 总资产周转率和财务杠杆。
26
27
Z-Score Financial Analysis Tool
Z-score formula for predicting bankruptcy was published in 1968 by Edward I. Altman, Professor of Finance at New York University`s Stern School of Business.
20
Interest cover 利息保障倍数
利息保障倍数是指企业息税前利润与利息费用之 比,又称已获利息倍数,用以衡量偿付借款利息 的能力,它是衡量企业支付负债利息能力的指标。
利息保障倍数反映了获利能力对偿还到期债务的 保证程度,它既是企业举债经营的前提依据,也 是衡量企业长期偿债能力大小的重要标志。
15
Profit Margin 销售净利率
net margin, net profit margin or net profit ratio
销售净利率,是净利润占销售收入的百分比。 该指标反映每一元销售收入带来的净利润的多少,
表示销售收入的收益水平。 销售净利率能够分解成为销售毛利率、销售税金
Current ratio Quick Ratio / acid test
5
Байду номын сангаасurrent ratio 流动比率
流动资产包括现金及现金等价物、应收账款和库存,而流 动负债则等于短期贷款和应付账款之和。
由于各行业的经营性质不同,对资产的流动性的要求也不 同。例如,商业零售企业所需的流动资产,往往要高于制造 企业,因为前者需要在存货方面投入较大的资金。
Lecture 4
Financial Ratios
Overview
Financial Ratios 1 (U15) Financial Ratios 2 (U16)
2
Financial Ratios 1 (U15)
Types of Financial Ratio Liquidity and solvency ratios Earnings and dividends
Gross margin Profit margin ROA ROE
14
Gross margin 销售毛利率
Gross profit margin or Gross Profit Rate 销售毛利率是指毛利占销售收入的百分比,也简
称为毛利率,其中毛利是销售收入与销售成本的 差额。 销售毛利率,表示每一元销售收入扣除销售成本 后,有多少钱可以用于各项期间费用和形成盈利。 销售毛利率是企业销售净利率的最初基础,没有 足够大的毛利率便不能盈利。
7
Market ratios 市场比率
Market ratios measure investor response to owning a company's stock and also the cost of issuing stock.