AMD_NICE_DSU_report
amdbios的设置图解教程
amd bios的设置图解教程amd bios设置图解教程?这个你会了吗?如果不会的话,那就由小编给你们分享一下吧!一.Main(标准设定)此菜单可对基本的系统配置进行设定。
如时间,日期等。
其中Primary/Secondary IDE Master/Slave 是从主IDE装置。
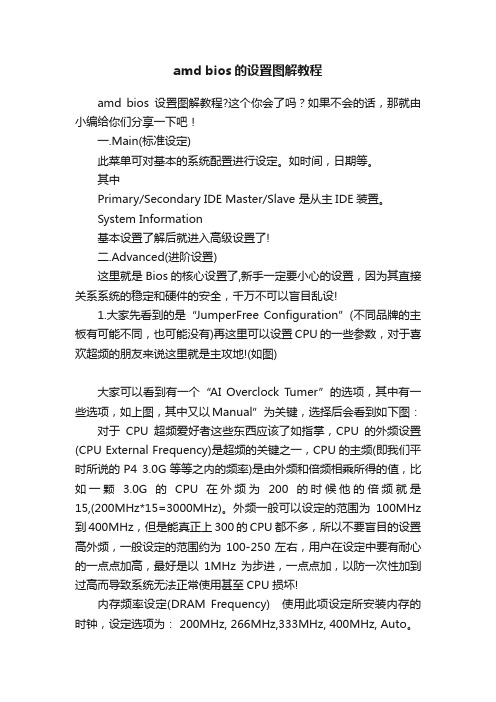
System Information基本设置了解后就进入高级设置了!二.Advanced(进阶设置)这里就是Bios的核心设置了,新手一定要小心的设置,因为其直接关系系统的稳定和硬件的安全,千万不可以盲目乱设!1.大家先看到的是“JumperFree Configuration”(不同品牌的主板有可能不同,也可能没有)再这里可以设置CPU的一些参数,对于喜欢超频的朋友来说这里就是主攻地!(如图)大家可以看到有一个“AI Overclock Tumer”的选项,其中有一些选项,如上图,其中又以Manual”为关键,选择后会看到如下图:对于CPU超频爱好者这些东西应该了如指掌,CPU的外频设置(CPU External Frequency)是超频的关键之一,CPU的主频(即我们平时所说的P4 3.0G等等之内的频率)是由外频和倍频相乘所得的值,比如一颗 3.0G的CPU在外频为200的时候他的倍频就是15,(200MHz*15=3000MHz)。
外频一般可以设定的范围为100MHz 到400MHz,但是能真正上300的CPU都不多,所以不要盲目的设置高外频,一般设定的范围约为100-250左右,用户在设定中要有耐心的一点点加高,最好是以1MHz为步进,一点点加,以防一次性加到过高而导致系统无法正常使用甚至CPU损坏!内存频率设定(DRAM Frequency) 使用此项设定所安装内存的时钟,设定选项为: 200MHz, 266MHz,333MHz, 400MHz, Auto。
AGP/PCI设备频率设定(AGP/PCI Frequency),本项目可以修改AGP/PCI设备的运行频率频率,以获得更快的系统性能或者超频性能,设定值有:[Auto],[66.66/33.33],[72.73/36.36]。
微星AMD主板的BIOS设置详解

微星AMD主板的BIO S设置详解本设置讲解,以785GT M-E65为蓝本,其他AMD主板也可参考。
不同型号AMD主板只是B IOS设置项目有多有少,只要是有的项目,设置方式和内容基本相同。
一、BIOS主菜单1、Standa rd CMOS Featur es 标准CMOS属性2、Advanc ed BIOS Featur es 高级BIOS属性3、Integr atedPeriph erals整合周边设备4、PowerManage ment电源管理5、H/W Monito r 硬件监测6、GreenPower绿色节能7、BIOS Settin g Password 开机密码设置8、Cell Menu 核心菜单9、M-Flash U盘刷新BI OS10、User Settin gs 用户设置项11、Load Fail-Safe Defaults 加载安全缺省值12、Load Optimi zed Defaul ts 加载优化值13、Save & Exit Setup保存设置并退出14、Exit Withou t Saving退出而不保存二、Cell Menu 核心菜单设置1、CPU相关设置CPU相关设置有9项1-1、CPU Specif icati ons:这是查看CP U的规格和参数,也可以随时按F4查看。
1-2、AND Cool `n` Quiet:AMD CPU的节能技术,也叫“凉又静”。
依据CPU负载改变CP U 的倍频和电压。
当CPU空闲时,核心电压降到最低,倍频也降到最低。
如果主板有微星的AP S功能,请开启这个选项。
该选项的设置是Enab led和D i sabl ed。
1-3、Adjust CPU FSB Freque ncy (MHz):调整CPU的前端总线频率。
amd主板bios设置方法

amd主板bios设置方法你们知道怎么设置BIOS吗,下面是店铺带来amd主板bios设置方法的内容,欢迎阅读!amd主板bios设置方法:不同类型的主板进入BIOS设置程序的方法会有所不同,具体进入方法请注意开机后的屏幕提示。
BIOS设置程序的基本功能如下。
Standard CMOS Features(标准CMOS功能设置):使用此选项可对基本的系统配置进行设定,如时间、日期、IDE设备和软驱参数等。
Advanced BIOS Features(高级BIOS特征设置):使用此选项可对系统的高级特性进行设定。
Advanced Chipset Features(高级芯片组特征设置):通过此菜单可以对主板芯片组进行设置。
Integrated Peripherals(外部设备设定):对所有外围设备的设定。
如声卡、Modem和USB键盘是否打开等。
Power Management Setup(电源管理设定):对CPU、硬盘和显示器等设备的节电功能运行方式进行设置。
PnP/PCI Configurations(即插即用/PCI参数设定):设定ISA的PnP即插即用界面及PCI界面的参数,此项功能仅在系统支持PnP/PCI 时才有效。
PC Health Status(计算机健康状态):主要是显示系统自动检测的电压、温度及风扇转速等相关参数,而且还能设定超负荷时发出警报和自动关机,以防止故障发生等。
Frequency/Voltage Control(频率/电压控制):设定CPU的倍频,设定是否自动侦测CPU频率等。
Load Fail-Safe Defaults(载入最安全的默认值):使用此选项可载入工厂默认值作为稳定的系统使用。
Load Optimized Defaults(载入高性能默认值):使用此选项可载入最好的性能但有可能影响稳定的默认值。
Set Supervisor Password(设置超级用户密码):使用此选项可以设置超级用户的密码。
AMD系统板说明书

System boardDescription Spare part numberSystem boardAMD A10-9600P system board with UMA graphics and a non-Windows operating system856269-001AMD A10-9600P system board with UMA graphics and a Windows operating system856269-601AMD A9-9410P system board with UMA graphics and a non-Windows operating system856270-001AMD A9-9410P system board with UMA graphics and a Windows operating system856270-601AMD A6-9210P system board with UMA graphics and a non-Windows operating system856271-001AMD A6-9210P system board with UMA graphics and a Windows operating system856271-601856272-001 AMD A10-9600P R16M M1-70 system board with 4 GB discrete graphics and a non-Windows operatingsystemAMD A10-9600P R16M M1-70 system board with 4 GB discrete graphics and a Windows operating system856272-601856273-001 AMD A10-9600P R16M M1-70 system board with 2GB discrete graphics and a non-Windows operatingsystemAMD A10-9600P R16M M1-70 system board with 2 GB discrete graphics and a Windows operating system856273-601AMD A9-9410P R16M M1-70 system board with 2 GB discrete graphics and a non-Windows operating856274-001 systemAMD A9-9410P R16M M1-70 system board with 2 GB discrete graphics and a Windows operating system856274-601856275-001 AMD A6-9210P R16M M1-70 system board with 2 GB discrete graphics and a non-Windows operatingsystemAMD A6-9210P R16M M1-70 system board with 2 GB discrete graphics and a Windows operating system856275-601860280-001 AMD A9-9410P R16M M1-70 system board with 4 GB discrete graphics and a non-Windows operatingsystemAMD A9-9410P R16M M1-70 system board with 4GB discrete graphics and a Windows operating system860280-601AMD A12-9700P system board and a non-Windows operating system862978-001AMD A12-9700P system board and a Windows operating system862978-601IMPORTANT:Make special note of each screw and screw lock size and location during removaland replacement.Before removing the system board, follow these steps:1.Shut down the computer.2.Disconnect all external devices connected to the computer.3.Disconnect the power from the computer by first unplugging the power cord from the AC outlet and thenunplugging the AC adapter from the computer.4.Remove the base enclosure (see Base enclosure on page 28), and then remove the followingcomponents:a.Battery (see Battery on page 30).b.Optical drive (see Optical drive (select products only) on page 26).48Chapter 6 Removal and replacement procedures for authorized service provider partsc.Hard drive (see Hard drive on page 31).d.Solid-state drive (see SSD (M.2) on page 33).e.Memory (see Memory on page 34).f.WLAN module (see WLAN module on page 37).g.Fan (see Fan on page 41).h.Heat sink (see Heat sink on page 43).i.I/O board (see I/O board on page 45).j.Power button board Power button board on page 46).Remove the system board:1.Disconnect the following zero-insertion force (ZIF) connectors from the system board:.●Speaker cable (1)●Display cable (2)●Battery cable (3)●Power button board connector (4)●Power button board cable (5)●I/O board cable (6)●I/O board connector (7)●TouchPad cable (8)●Keyboard cable (9)●Solid-state drive cable (10)●Hard drive cable (11)●SD card reader cable (12)Component replacement procedures492.Remove 2 Phillips 2x5 screws (1), and then lift the system board to remove it (2).Reverse this procedure to install the system board.SD card readerDescription Spare part numberSD card reader board857791-001SD card reader board cable856347-00150Chapter 6 Removal and replacement procedures for authorized service provider parts。
amd媒体申报-操作

媒体申报系统使用手册3 5 7 91.1 系统结构表媒体申报系统(m18)│├─申报税籍数据维护作业(amdi001)├─进销项凭证维护作业(amdi100)├─发票字轨数据维护作业(amdi010)├─营业税营业人零税率销售额数据档案媒体生成作业(amdp106)├─进项凭证明细表打印(amdr100)├─进项凭证明细表打印(二)(amdr101)├─进项凭证折让明细表打印(amdr110)├─进项凭证折让明细表打印(二)(amdr111)├─销项凭证明细表打印(amdr200)├─电子计算器统一发票明细打印(二联式)(amdr310)├─电子计算器统一发票明细表打印(amdr311)├─营业人申报适用零税率销售额清单(amdr312)├─营业人零税率固定资产清单(amdr313)├─进项媒体错误清单打印(amdr300)├─营业人销售与税额申报书(401)(amdr401)├─营业人销售与税额申报书(403)(amdr403)├─进销项媒体生成作业(amdp100)├─营业人媒体申报表(amdr102)├─已申报年月更新作业(amdp101)├─已申报年月还原作业(amdp105)├─媒体申报其它数据维护作业(amdi002)├─进项凭证检核明细表打印(amdr500)├─销项凭证检核明细表打印(amdr510)├─进项凭证与总帐凭证不合检核表打印(amdr520)├─媒体申报进项发票数据检查表(amdr900)├─统一发票调节表(amdr530)├─免税区厂商提供适用零税率进项凭证明细表(amdr112)├─营业人销售与税额申报书媒体生成作业(401)(amdp401)└2.1 进销项媒体数据生成作业程序作业流程作业说明───────────────────────────────┌─────┐┌─────┐ 1.进销项数据生成│进销项维护││进销项维护││(amdi100) ││(amdi100) ││G.进项生成││S.销项生成│└──┬──┘└──┬──┘└───┬───┘┌──┴──┐│进销项维护│ 2.进销项数据维护│││(amdi100) │└──┬──┘┌───┴───┐┌──┴──┐┌──┴──┐│进项凭证明││销项凭证明││细表││细表││(amdr100) ││(amdr103) │└──┬──┘└──┬──┘└───┬───┘┌──┴──┐│统一发票明││细表││(amdr311) │└──┬──┘│┌──┴──┐│进销项媒体││生成作业││(amdp100) │└──┬──┘│┌──┴──┐│营业人媒体││申报表││(amdr102) │└─────┘2.2 系统程序总览┌──────┬──────────────────┬───────┐│程序编号│程序名称│ R E M A R K │├──────┼──────────────────┼───────┤│m18 │媒体申报系统│││amdi001 │申报税籍数据维护作业│││amdi002 │媒体申报其它数据维护作业│││amdi010 │发票字轨数据维护作业│││amdi100 │进销项凭证维护作业│││amdp100 │进销项媒体生成作业│││amdp101 │已申报年月更新作业│││amdp105 │已申报年月还原作业│││amdp106 │营业税营业人零税率销售额资料档媒体生成作业││amdp401 │营业人销售与税额申报书媒体生成作业(4) ││amdr100 │进项凭证明细表打印│││amdr101 │进项凭证明细表打印(二) │││amdr102 │营业人媒体申报表│││amdr110 │进项凭证折让明细表打印│││amdr111 │进项凭证折让明细表打印(二) │││amdr112 │免税区厂商提供适用零税率进项凭证明细│││amdr200 │销项凭证明细表打印│││amdr300 │进项媒体错误清单打印│││amdr310 │电子计算器统一发票明细打印(二联式) │││amdr311 │电子计算器统一发票明细表打印│││amdr312 │营业人申报适用零税率销售额清单│││amdr313 │营业人零税率固定资产清单│││amdr401 │营业人销售与税额申报书(401) │││amdr403 │营业人销售与税额申报书(403) │││amdr500 │进项凭证检核明细表打印│││amdr510 │销项凭证检核明细表打印│││amdr520 │进项凭证与总帐凭证不合检核表打印│││amdr530 │统一发票调节表│││amdr900 │媒体申报进项发票数据检查表││└──────┴──────────────────┴───────┘2.3 档案总览┌──────┬────────────────────┬───────┐│档案编号│档案名称│备注│├──────┼────────────────────┼───────┤│ama_file │申报税籍资料维护││├──────┼────────────────────┼───────┤│amb_file │发票字轨档││├──────┼────────────────────┼───────┤│amd_file │进销项凭证数据维护││├──────┼────────────────────┼───────┤│ame_file │媒体申报其它数据││├──────┼────────────────────┼───────┤│amf_file │进销项凭证单身数据维护││└──────┴────────────────────┴───────┘程序名称amdi001 申报税籍数据维护作业运行指令amdi001屏幕格式作业目的1.本作业用以维护申报税籍资料。
诊断结果

AMD A4-6210 APU with AMD Radeon R3 Graphics (CPU:0)2级高速缓存测试
通过
AMD A4-6210 APU with AMD Radeon R3 Graphics (CPU:0)数学寄存器测试
通过
AMD A4-6210 APU with AMD Radeon R3 Graphics (CPU:0)MMX测试
系统内存棋盘测试
通过
系统内存反演(Moving Inversion)测试
通过
系统内存Modulo20测试
通过
系统内存地址测试
通过
系统内存Windows內存测试
通过
系统内存高级模式码测试
通过
鼠标
硬件类型 诊断名称
结果
USB Optical Mouse USB状态测试
通过
TSSTcorp DVD+-RW SU-208GB SATA CdRom Device主IC测试
通过
TSSTcorp DVD+-RW SU-208GB SATA CdRom DeviceOPU测试
通过
TSSTcorp DVD+-RW SU-208GB SATA CdRom Device托盘弹出测试
通过
ST500LT0 12-1DG142 SATA Disk Device随机寻道测试
通过
HD音频控制器
硬件类型 诊断名称
结果
High Definition Audio 控制器 PCI Express状态测试
通过
集线器
硬件类型 诊断名称
结果
戴尔易安信 PowerEdge 服务器第二代 AMD EPYC 处理器的平衡内存说明书

WhitepaperBalanced Memory with 2nd GenerationAMD EPYC TM Processorsfor PowerEdge ServersOptimizing Memory PerformanceRevision: 1.4Issue Date: 4/21/2020AbstractProperly configuring a server with balanced memory is critical to ensure memorybandwidth is maximized and latency is minimized. When server memory is configured incorrectly, unwanted variables are introduced into the memory controllers’ algorithm, which inadvertently slows down overall system performance. To mitigate this risk of reducing or even bottlenecking system performance, it is important to understand what constitutes balanced, near balanced and unbalanced memory configurations.Dell EMC has published this brief to educate PowerEdge customers on what balanced memory means, why it is important and how to properly populate memory to 2ndGeneration AMD EPYC TM server processors for a balanced configuration.RevisionsDate Description12 September 2019 Initial release for 1st wave of AMD CPUs21 April 2020Includes all AMD CPU SKUs AcknowledgementsThis paper was produced by the following people:Name RoleMatt Ogle Technical Product Marketing, Dell EMC Trent Bates Product Management, Dell EMCJose Grande Software Senior Principal Engineer, Dell EMC Andres Fadul Software Senior Principal Engineer, Dell EMCTable of Contents1.Introduction (4)2.Memory Topography and Terminology (5)3.Memory Interleaving (6)3.1NPS and Quadrant Pairing (6)4.Memory Population Guidelines (9)4.1Overview (9)4.2Memory Channel Population (9)4.3Identical CPU and DIMM Parts (10)4.4Identical Memory Configurations for Each CPU (10)5.Balanced Configurations (Recommended) (11)6.Near Balanced Configurations (12)7.Unbalanced Configurations (13)8.Conclusion (19)9. References (19)1. IntroductionUnderstanding the relationship between a server processor (CPU) and its memory subsystem is critical when optimizing overall server performance. Every processor generation has a unique architecture, with volatile controllers, channels and slot population guidelines, that must be satisfied to attain high memory bandwidth and low memory access latency.2nd Generation AMD EPYC TM server processors, which will be referred to by their code name throughout this white paper, Rome processors, offer a total of eight memory channels with up to two memory slots per channel.1 This presents numerous possible permutations for configuring the memory subsystem with traditional Dual In-Line Memory Modules (DIMMs), yet there are only a couple of balanced configurations that will achieve the peak memory performance for Dell EMC PowerEdge servers.Memory that has been incorrectly populated is referred to as an unbalanced configuration. From a functionality standpoint, an unbalanced configuration will operate adequately, but introduces significant additional overhead that will slow down data transfer speeds. Similarly, a near balanced configuration does not yield fully optimized data transfer speeds but it is only suboptimal to that of a balanced configuration. Conversely, memory that has been correctly populated is referred to as a balanced configuration and will secure optimal functionality and data transfer speeds.This white paper explains how to balance memory configured for Rome processors within Dell EMC PowerEdge servers.2. Memory Topography and TerminologyFigure 1: CPU-to-memory subsystem connectivity for Rome processorsTo understand the relationship between the CPU and memory, terminology illustrated in Figure 1 must first be defined:•Memory controllers are digital circuits that manage the flow of data going from the computer’s main memory to the corresponding memory channels.2 Romeprocessors have eight memory controllers in the processor I/O die, with onecontroller assigned to each channel.•Memory channels are the physical layer on which the data travels between the CPU and memory modules.3 As seen in Figure 1, Rome processors have eightmemory channels designated A, B, C, D, E, F, G and H. These channels wereintended to be organized into pairs such as two-way (AB, CD, EF, GH), four-way (ABCD, EFGH) or eight-way (ABCDEFGH).•The memory slots are internal ports that connect the individual DIMMs to their respective channels.4 Rome processors have two slots per channel, so there are a total of sixteen slots per CPU for memory module population. DIMM 1 slots are the first eight memory modules to be populated while DIMM 0 slots are the last eight.In the illustrations ahead, DIMM 1 slots will be represented with black text marked A1-A8 and DIMM 0 slots will be represented with white text marked A9-A16.•The memory subsystem is the combination of all the independent memory functions listed above.3. Memory InterleavingMemory interleaving allows a CPU to efficiently spread memory accesses across multiple DIMMs. When memory is put in the same interleave set, contiguous memory accesses go to different memory banks. Memory accesses no longer must wait until the prior access is completed before initiating the next memory operation. For most workloads, performance is maximized when all DIMMs are in one interleave set creating a single uniform memory region that is spread across as many DIMMs as possible.5 Multiple interleave sets create disjointed memory regions.3.1 NPS and Quadrant PairingRome processors achieve memory interleaving by using Non-Uniform Memory Access (NUMA) in Nodes Per Socket (NPS).6 There are four NPS options available in the Dell EMC BIOS:1. NPS 0– One NUMA node per system (on two processors systems only). Thismeans all channels in the system are using one interleave set.2. NPS 1– One NUMA node per socket (on one processor systems). This means allchannels in the socket are using one interleave set.3. NPS 2– Two NUMA nodes per socket (one per left/right half). This means eachhalf containing four channels is using one interleave set; a total of two sets.4. NPS 4– Up to four NUMA nodes per socket (one per quadrant). This means eachquadrant containing two channels is using one interleave set; a total of four sets. The simplest visual aid for understanding the NPS system is to divide the CPU into four quadrants. We see below in Figure 2 that each quadrant contains two paired DIMM channels that can host up to two DIMMs. The paired DIMM channels in each quadrant were designed to group and minimize the travel distance for interleaved sets. NPS 1 would correlate to all four quadrants being fully populated. NPS 2 would correlate to having either the left or right half quadrant being fully populated. NPS 4 would correlate to having any one quadrant being fully populated.Figure 2: Quadrant layout of Rome processors3.2 NPS and Quadrant PairingNPS 0 and NPS 1 will typically yield the best memory performance, followed by NPS 2 and then NPS 4. The Dell EMC default setting for BIOS NUMA NPS is NPS 1 and mayneed to be manually adjusted to match the NPS option that supports the CPU model. As seen below in Figure 3 there are various CPUs that will not support NPS 2 or 4 that require awareness of which memory configurations are optimized for each CPU. Figure 4 below shows our recommended NPS setting for each # of DIMMs per CPU:Figure 3: A full list of 2nd Gen AMD EPYC™ CPUs and their respectivesupported NPS models. The CPUs with an asterisk have been optimizedto reduce the performance impact of only filling four DIMM channels.Figure 4: Recommended NPS setting for each# of DIMMs per CPUIf the NPS setting for a memory configuration will limit performance (as seen in Figure 5), Dell EMC BIOS will return the following informative prompts to the user:UEFI0391: Memory configuration supported but not optimal for the enabledNUMA node Per Socket (NPS) setting. Please consider the following actions:1) Changing NPS setting under System Setup>System BIOS>ProcessorSettings>NUMA Nodes Per Socket, if supported.2) For optimized memory configurations please refer to the General MemoryModule Installation Guidelines section in the Installation and ServiceManual, of the respective server model available on the support site.In layman’s terms, a different NPS setting or memory configuration will result in better memory performance. The system is fully functional when this message appears, but it is not fully optimized for best performance.Figure 5: Color-coded table illustrating whenan informative message will occur (yellow) orno message (green)4. M emory Population Guidelines4.1 OverviewDIMMs must be populated into a balanced configuration to yield the highest memory bandwidth and lowest memory access latency. Various factors will dictate whether a configuration is balanced or not. Please follow the guidelines below for best results 7:o Memory Channel Population•Balanced Configuration-All memory channels must be fully populated with one or two DIMMs for best performance; a total of eight or sixteen DIMMs per CPU•Near Balanced Configuration-Populate four or twelve DIMMs per socket-Populate DIMMs in sequential order (A1-A8)o CPU and DIMM parts must be identicalo Each CPU must be identically configured with memory4.2 Memory Channel PopulationTo achieve a balanced configuration, populate either eight or sixteen DIMMs per CPU. By loading each channel with one or two DIMMs, the configuration is balanced and has data traveling across channels most efficiently on one interleave set. Following this guideline will yield the highest memory bandwidth and the lowest memory latency. If a balanced configuration of sixteen or eight DIMMs per CPU cannot be implemented, then the next best option is a near balanced configuration. To obtain a near balanced population, populate four or twelve DIMMs per CPU in sequential order. When any number of DIMMs other than 4, 8, 12 or 16 is populated, disjointed memory regions are created making NPS 4 the only supported BIOS option to select.The last guideline is that DIMMs must be populated in an assembly order because Rome processors have an organized architecture for each type of CPU core count. To simplify this concept, the lowest core count was used as a common denominator, so the assembly order below will apply across all Rome processor types. Populating in this order ensures that for every unique Rome processor, any DIMM configuration is guaranteed the lowest NPS option, therefore driving the most efficient interleave sets and data transfer speeds. Figure 6 illustrates the assembly order in which individual DIMMs should be populated, starting with A1 and ending with A16:Figure 6: DIMM population order, starting with A1 and ending with A164.3 Identical CPU and DIMM PartsIdentical DIMMs must be used across all DIMM slots (i.e. same Dell part number). Dell EMC does not support DIMM mixing in Rome systems. This means that only one rank, speed, capacity and DIMM type shall exist within the system. This principle applies to the processors as well; multi-socket Rome systems shall be populated with identical CPUs.4.4 Identical Memory Configurations for Each CPUEvery CPU socket within a server must have identical memory configurations. When only one unique memory configuration exists across both CPU sockets within a server, memory access is further optimized. Figure 7 below illustrates the expected memory bandwidth curve when these rules are followed:Figure 7: Bar graph illustrating expected performance variation as # of dimms increases 16151413121110987654321M e m o r y B a n d w i d t h #DIMMs per CPU populatedR6525 Memory Bandwidth per DIMM Population BalancedNear-Balanced Unbalanced5. Balanced Configurations (Recommended)Balanced configurations satisfy NPS 0/1 conditions by requiring each memory channel to be populated with one or two identical DIMMs. By doing this, one interleave set can optimally distribute memory access requests across all the available DIMM slots; therefore, maximizing performance. Memory controller logic was designed around fullypopulated memory channels, so it should come as no surprise thateight or sixteen populated DIMMs are recommended. Having eight DIMMs will reap the highestmemory bandwidth while having sixteen DIMMs will yield the highest memory capacity.Figure 8: Eight DIMMs are populated in a balanced configuration, producing the highest memorybandwidth while at a lower capacity than sixteenFigure 9: Sixteen DIMMs are populated in a balanced configuration, producing the highest memorycapacity while at a lower bandwidth than eight6. Near Balanced ConfigurationsNear balanced configurations satisfy NPS 1 or 2 conditions by populating either four or twelve identical DIMMs per CPU. These configurations are not optimized because the channels are partially populated, which creates disjointed memory regions that reduce performance (making it near balanced). Performance for near balanced configurationswill undergo degradation when compared to balanced configurations. Although the below configurations are adequate for implementation, they are not highly recommended. *Note that CPUs 7282, 7252, 7232P and 7272 were designed to reduce the performance impact of populating four DIMM channels.Figure 10: Four DIMMs are populated in a near balanced configurationFigure 11: Twelve DIMMs are populated in a near balanced configuration7. U nbalanced ConfigurationsUnbalanced configurations can only satisfy NPS 4 conditions. More than two interleave sets can now be introduced to the memory controller algorithm which causes very disjointed regions. Memory performance for the unbalanced configurations below are significantly less than balanced or near balanced and are not recommended.Figure 12: One DIMM is populated in an unbalanced configurationFigure 13: Two DIMMs are populated in an unbalanced configurationFigure 14: Three DIMMs are populated in an unbalanced configurationFigure 15: Five DIMMs are populated in an unbalanced configurationFigure 16: Six DIMMs are populated in a near balanced configurationFigure 17: Seven DIMMs are populated in an unbalanced configurationFigure 18: Nine DIMMs are populated in an unbalanced configurationFigure 19: Ten DIMMs are populated in a near balanced configurationFigure 20: Eleven DIMMs are populated in an unbalanced configurationFigure 21: Thirteen DIMMs are populated in an unbalanced configurationFigure 22: Fourteen DIMMs are populated in a near balanced configurationFigure 23: Fifteen DIMMs are populated in an unbalanced configuration8. ConclusionBalancing memory with 2nd Generation EPYC TM server processors increases memory bandwidth and reduces memory access latency. When memory modules are configured in such a way that the memory subsystems are identical, and channels are fully populated with one or two DIMMs, one interleave set will create a single uniform memory region that is spread across as many DIMMs as possible. This allows the distribution of data to perform most efficiently on Dell EMC PowerEdge servers. Applying the balanced memory guidelines demonstrated in this brief will ensure that both memory bandwidth and memory access latency are optimized, therefore ensuring peak memory performance within Dell EMC PowerEdge servers.9. References1 https:///wp-content/resources/56301_1.0.pdf2 https:///travel_guide/124468/hardware/computer_memory_controllers_how_they_work.html3 https:///jargon/d/dual-channel-memory.htm4 https:///jargon/m/memoslot.htm5 https:///memory-interleaving/6 https:///system/files/2018-03/AMD-Optimizes-EPYC-Memory-With-NUMA.pdf7 https:///wp-content/resources/56301_1.0.pdfThe information in this publication is provided “as is.” Dell Inc. makes no representations or warranties of any ki nd withrespect to the information in this publication, and specifically disclaims implied warranties of merchantability or fitness for a particular purpose.Use, copying, and distribution of any software described in this publication requires an applicable software license.© 2020 Dell Inc. or its subsidiaries. All Rights Reserved. Dell, EMC, Dell EMC and other trademarks are trademarks of DellInc. or its subsidiaries. Other trademarks may be trademarks of their respective owners.Dell believes the information in this document is accurate as of its publication date. The information is subject to changewithout notice.。
浪潮服务器故障问题报告分析

故障问题分析报告⼀、故障概述时间:2024年9⽉24⽇22:06主机:192.168.x.x 问题现象:存储池 A 和 B 未挂载,导致部分虚拟机⽆法访问其存储资源。
CPU 使⽤率 99.5%,内存占⽤率达到 84%。
⽆法通过 SSH 、KVM 和 BMC 远程连接节点。
其他 ⼏ 个节点运⾏正常,磁盘阵列⽆报警。
通过 ping 可以连接节点,但远程管理⼯具⽆法访问。
⼆、故障现象详细分析1. 存储池未挂载的连锁反应存储池 A 和 B 未能成功挂载,导致虚拟机进程⽆法访问磁盘数据。
虚拟机在尝试 I/O 操作时陷⼊阻塞状态,导致 CPU 和内存资源耗尽。
2. 系统⾼负载与 SSH/KVM 失效CPU 使⽤率 99.5%:表明系统中的⽤户进程或内核进程出现资源竞争。
内存使⽤率 84%:可能由于阻塞进程堆积,内存压⼒上升,触发 OOM (内存不⾜)⾏为。
系统在⾼负载下暂停 SSH 和 BMC 进程,使管理员⽆法通过远程访问登录系统排查问题。
3. dmesg 中的 BAR 13 分配失败关键⽇志信息如下:这条⽇志表明 PCI 资源分配不⾜,可能影响某些存储设备(如 HBA 卡或 RAID 控制器)正常⼯作。
4. crontab 任务过多导致系统资源耗尽通过⽇志分析,发现有⼤量 ⾃动任务被频繁触发,导致系统在短时间内创建⼤量会话:在 CPU 和内存接近饱和的情况下,这些任务进⼀步恶化了系统性能。
三、核⼼原因分析PCI: BAR 13: No available resource for PCI bridgesession_start: 400 sessions activeNo. 1 / 4三、核⼼原因分析1. 存储池挂载失败的具体原因PCI BAR 分配失败直接导致某些 PCI 设备(如 RAID/HBA 卡)⽆法正常注册资源,进⽽导致存储设备不可⽤:PCI: BAR 13: No available resource for PCI bridgeBAR(Base Address Register)是 PCI 设备⽤于内存映射的地址寄存器,分配失败意味着系统未能为该设备提供必要的地址空间,导致存储池不可访问。
梅捷AMD系列主板说明书

梅捷AMD系列主板说明书适用于:AMD系列芯片组说明书版本V1.7更新日期2014年5月30日梅捷简体中文网站/梅捷中国大陆技术支持E-mail:梅捷官方微博/soyo1999梅捷中国大陆服务电话************版权声明:说明书版权归梅捷科技所有。
梅捷科技有权在不知会用户的前提下增益、删除内容。
本说明书为纯技术文档,无任何暗示及映射第三方内容。
且不承担因印刷及排版错误而导致的任何歧义。
本说明书中所涉及之任何第三方之注册商标,所有权归其制造商或品牌供应商所有。
Copyright©1999——2014版权所有、未经授权,禁止以任何方式复制传播。
关于本手册:本说明书适合初学者,包含相关产品特性介绍及软体安装介绍,以及一些名词的解释。
本说明书可以作为技术性参考资料,用户使用时请以实物为准。
非正常保修范围:1、产品因不当使用与安装,自行拆解或更换零件,或是任意变更规格所造成的故障与损坏,不在保修范围内。
2、产品一经变更或修改,以及任何因间接、特殊或意外情况所造成的损害,不在保修范围内。
避免在下列环境中使用本产品:高温、低气压、低温、潮湿、多尘、磁场强大及长期暴露于阳光之下。
本公司建议您在海拔3000米以下,0°至35°C,湿度为5%至95%的环境中使用。
FCC条款:本装置完全遵循FCC条款第15部分的规定。
遵照下列两项条件来作业:1、本装置不会造成人身伤害;2、本装置必须能接受任何已回复的冲突干扰,包括可能会造成不当操作的冲突。
注意:依照FCC条款第15部分规定,本装置已经通过测试并且符合Class B数位装置的限制。
这项限制是为了安装过程中可能造成的伤害性冲突的合理防范措施。
本装置产生、使用、并且可以发射无线电的频率能量,但如果没有依照制造商的指示安装和使用,可能会与通讯工具造成伤害性冲突。
然而,并不保证在特定的安装下不会产生任何冲突。
如果关闭和重开本装置后,仍确定本装置真的造成收音机或电视机的冲突,请使用者利用下列一项或多项知识来更正所造成的冲突:●重新安装接收天线;●增加装置与受讯器间的分隔;●将电脑插入不同的插座以便于两个装置使用不同的回路。
AMD解决方案

AMD解决方案
1.简介
AMD(Advanced Micro Devices)是一家全球性的半导体厂商,其主要生产和销售的产品有微处理器、显示控制器、网络芯片、芯片组和处理器协处理器等,专注于个人计算机、游戏系统和服务器应用市场。
AMD的解决方案是一个完整的解决方案,旨在以最低的成本实现最佳性能水平,同时还提供增值功能。
AMD解决方案的一个重要特点就是它支持AMD的处理器,AMD的处理器在性能、可扩展性和功能方面都受到了认可,能够为用户提供丰富的解决方案。
2.芯片产品
AMD的解决方案主要包括AMD处理器、内存芯片、显卡、网络芯片及其它芯片系列。
AMD处理器可提供高效的性能,它们是全球应用程序性能优化产品之一,拥有强大的多核心和虚拟化技术,低功耗、高可靠性和可缩减的体积,使它们成为便携式服务具,为用户带来良好的性价比。
AMD的内存芯片由一体式芯片和分立式芯片组成,支持DDR2和DDR3内存,使用户可以轻松兼容更多内存,并能够更好地使用系统资源。
AMD 的显卡拥有高性能图形处理器,支持更新的DirectX和OpenGL,具有高帧率渲染,高质量的照片和视频解码功能,并能够扩展更大的显存。
AMD 网络芯片拥有高效的传输速率,支持以太网和Wi-Fi,使网络性能更加优秀。
AMD E2 A4 A6 A9 APU处理器说明书
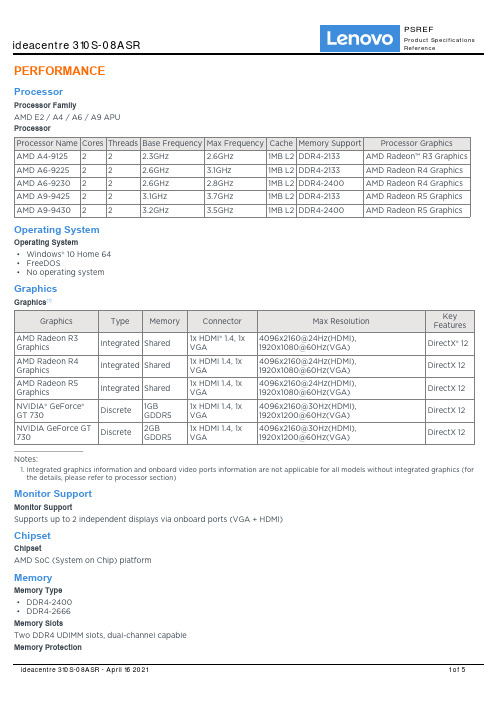
PERFORMANCEProcessorProcessor FamilyAMD E2 / A4 / A6 / A9 APUProcessorOperating SystemOperating SystemWindows® 10 Home 64••FreeDOS•No operating systemGraphicsGraphics[1]Notes:Integrated graphics information and onboard video ports information are not applicable for all models without integrated graphics (for 1.the details, please refer to processor section)Monitor SupportMonitor SupportSupports up to 2 independent displays via onboard ports (VGA + HDMI)ChipsetChipsetAMD SoC (System on Chip) platformMemoryMemory Type•DDR4-2400•DDR4-2666Memory SlotsTwo DDR4 UDIMM slots, dual-channel capableMemory ProtectionNon-ECCMax Memory[1]Up to 16GB DDR4-2666Notes:1.The max memory is based on the test results with current Lenovo® memory offerings. The system may support more memory as the technology develops.StorageStorage SupportUp to 2 drives, 1x 3.5" HDD + 1x 2.5" SSD3.5" HDD up to 2TB2.5" SSD up to 256GBRAIDNot supportStorage TypeRemovable StorageOptical•DVD burner (DVD??RW), SATA 1.5Gb/s, slim (9.0mm)•NoneCard Reader7-in-1 card reader (SD, SDHC, SDXC, MMC, MS, MS-Pro, MMC plus)••No card readerMulti-MediaAudio ChipHigh Definition (HD) Audio, Realtek® ALC662 codecPower SupplyPower SupplyDESIGNInput DeviceKeyboard•Lenovo Calliope Keyboard (USB connector), black•Lenovo Calliope Keyboard (USB connector), silver•Lenovo Calliope Wireless Keyboard, silver•No keyboardMouse•Lenovo Calliope Wireless Mouse, silverLenovo Calliope Mouse (USB connector), black••Lenovo Calliope Mouse (USB connector), silver•No mouseMechanicalButtons•Power buttonOptical drive eject button(for the models with ODD)•Form FactorSFF (8.4L)Dimensions (WxDxH)90 x 297 x 344mm (3.54 x 11.69 x 13.54 inches)Weight4.3 kg (9.5 lbs)Case ColorBlack••SilverBays•1x slim ODD bay•1x 2.5" disk bay•1x 3.5" disk bayExpansion Slots•One PCIe 2.0 x16, low-profile•One PCIe 2.0 x1, low-profile•Two M.2 slots (one for WLAN, one for SSD)CONNECTIVITYNetworkOnboard EthernetGigabit Ethernet, 1x RJ45WLAN + Bluetooth™•802.11ac 1x1 Wi-Fi + Bluetooth 4.0, M.2 card•No WLAN and BluetoothPortsFront Ports[1]•2x USB 2.0•2x USB 3.2 Gen 1•1x headphone / microphone combo jack (3.5mm)•1x microphone (3.5mm)Optional Front Ports1x card readerRear Ports[2]•2x USB 2.0•1x Ethernet (RJ-45)•1x HDMI 1.4•1x VGA•1x microphone (3.5mm)•1x line-in (3.5mm)•1x line-out (3.5mm)•1x power connectorNotes:1.The transfer speed of following ports will vary and, depending on many factors, such as the processing speed of the host device, file attributes and other factors related to system configuration and your operating environment, will be slower than theoretical speed.USB 2.0: 480 Mbit/s;USB 3.2 Gen 1 (SuperSpeed USB 5Gbps, formely USB 3.0 / USB 3.1 Gen 1): 5 Gbit/s;USB 3.2 Gen 2 (SuperSpeed USB 10Gbps, formely USB 3.1 Gen 2): 10 Gbit/s;USB 3.2 Gen 2x2 (SuperSpeed USB 20Gbps): 20 Gbit/s;Thunderbolt™ 3: 40 Gbit/s;FireWire 400: 400 Mbit/s;FireWire 800: 800 Mbit/s;For video ports on discrete graphics, please see graphics section 2.SECURITY & PRIVACYSecurityBIOS Security•Power-on password•Administrator passwordHard disk password•SERVICEWarrantyBase Warranty•1-year depot or mail-in service•1-year limited onsite service•2-year depot serviceCERTIFICATIONSGreen CertificationsGreen Certifications•ErP Lot 3•GREENGUARD®•RoHS compliant。
AMD 芯片组开机时序

OUT
38 OUTPUTS
1D1V_S0(7.5A)
IN
North Bridge
AMD RS780M
CPU I/F LVDS, CRT I/F INTEGRATED GRAHPICS
SYSTEM DC/DC
RT8202
INPUTS 39 OUTPUTS
1D8V_S3(11A) DCBATOUT
A-Link 2.5Gb/s*4=10Gb/s=1GB/s (除以10的原因是原本的8位元再加上2個偵錯位 INT MIC 元) 30 Codec AZALIA
S3
S0
ISL6265HR
BT+
VDDNB(3000mA)
Battery Conn.:11.1V / 4000mAh
5V_S5(2000mA)
AO4468 AO4468
5V_S0(5206mA)
3D3V_S5(1472mA)
3D3V_S0(3787mA)
TPS51125
5V_AUX_S5(175mA) 2D5V_S0(250mA)
G9161
3D3V_S5 1D2V_S5 (400mA)
40
INT.SPKR
30
OP AMP
APA2057 30
High Definition Audio ATA 66/100 ACPI 1.1 LPC I/F PCI/PCI BRIDGE 17,18,19,20,21
KBC Winbond
WPC775 31
TPS51125
EN1 EN2
PM_SLP_S5#
6 3D3V_S0
5V_S0
3D3V_S5 5V_S5
-4
1
映泰A770L3主板 BIOS说明书

免责说明
本手册内容系 BIOSTAR®知识产权,版权归 BIOSTAR®所有。我们本着对用户负 责的态度,精心地编写该手册,但不保证本手册的内容完全准确无误。BIOSTAR® 有权在不知会用户的前提下对产品不断地进行改良、升级及对手册内容进行修正, 实际状况请以产品实物为准。本手册为纯技术文档,无任何暗示及影射第三方之 内容,且不承担排版错误导致的用户理解歧义。本手册中所涉及的第三方注册商 标所有权归其制造商或品牌所有人。
SATA II
板载串行ATA控制器
数据传输率为3 Gb/s 符合SATA 2.5 规范
网络
Realtek RTL 8102EL
10 / 100 Mb/s自适应传输模式 半双工/全双工工作模式
音效
ALC662 / VT1708B
6声道音频输出 支持高清音频
PCI Express Gen2 x16 插槽
注意: 此附件内容可能会因区域或主板版本而异。
1
主板手册
1.3 主板特性
SPEC
CPU
Socket AM3 AMD Sempron / Athlon II / Phenom II处理器 (最大瓦数:95W)
AMD 64架构兼容32和64位 支持Hyper Transport 3.0技术
支持HyperTransport 3.0
amdsb710环境控制ite8721hw监控高级io控制器提供最基本的io功能风扇速度控制器低管脚数接口ites智能保护功能双通道模式ddr3内存模块ddr3dimm插槽x2支持ddr380010661333主内存最大内存容量为8gb支持ddr31600oc每个dimm支持512mb1gb2gb4gbddr3不支持registereddimm和eccdimmmultiworddma多字节dmaide板载ide控制器ultradma3366100133总线控制模式数据传输率为3gbssataii板载串行ata控制器符合sata25规范10100mbs自适应传输模式网络realtekrtl8102el半双工全双工工作模式6声道音频输出音效alc662vt1708b支持高清音频pciexpressgen2x16插槽x1支持pciegen2x16扩展卡插槽pciexpressgen2x1插槽x1支持pciegen2x1扩展卡pci插槽x3支持pci扩展卡软驱接口x1每个接口支持2个软驱打印机接口x1每个接口支持1个打印机端口板载接口ide接口x1每个接口支持2个ide设备sata接口x4每个接口支持1个sata设备2a770l3spec前置面板接口x1支持前置面板设备前置音频接口x1支持前置音频功能spdif输出接口x1支持数字音频输出功能cpu风扇接头x1cpu风扇电源智能风扇功能系统风扇接头x1系统风扇电源清空cmos数据接头x1清空cmos数据usb接口x2每个接口支持2个前置面板usb端口电源接口24pinx1连接电源电源接口4pinx1连接电源ps2键盘x1连接ps2键盘ps2鼠标x1连接ps2鼠标串行端口x1连接rs232端口后置面板接口lan端口x1连接rj45以太网数据线usb端口x4连接usb设备音频插孔x3提供音频输入输出和连接麦克风接口主板尺寸182mmwx305mmlatx特性支持raid0110如有增加或减少任何os支持biostar保留不预先通操作系统支持windowsxpvista7知的权利
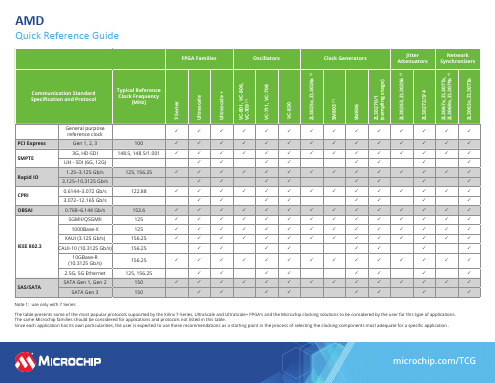
AMD 快速参考指南说明书
ü
ü
ü
ü
ü
ü
ü
ü
G.8251
OTU-1
166.6286
ü
ü
ü
ü
ü
ü
ü
ü
ü
ü
ü
ü
ü
ü
G.8251
OTU-2 (10.709225 Gb/s)
167.3316, 669.3266
ü
ü
ü
ü
ü
ü
ü
ü
OIF-CEI
OTU-4 (11.180997 Gb/s)
174.7031
ü
ü
ü
ü
ü
ü
ü
ü
OIF
SFI-5
195.3125
/TCG
FPGA Families
Oscillators
Clock Generators
Jitter Attenuators
Network Synchronizers
7-Series Ultrascale Ultrascale + VC-801, VC-806, VC-709 (1) VC-711, VC-708 VC-830 ZL3025x, ZL3026x (1) SM803 (1) SM806 ZL30270/1 (sampling stage) ZL30253, ZL30256 (1) ZL30272/3/4 ZL3067x, ZL3077x, ZL3069x, ZL3079x (1) ZL3063x, ZL3073x
ü
ü
ü
ü
ü
ü
ü
ü
ü
ü
ü
ü
ü
ü
SFF-8431
amd芯片组

amd芯片组AMD芯片组是Advanced Micro Devices(AMD)开发的一款芯片组产品。
芯片组是计算机系统的重要组成部分,它将CPU(中央处理器)和其他外围设备(如内存、硬盘、显卡等)连接起来,并负责控制和协调它们之间的数据传输和交互。
AMD芯片组的设计目标是提供高性能和低能耗的解决方案,以满足不同应用场景和需求。
首先,AMD芯片组在性能方面具有显著的优势。
它采用了先进的制造工艺和设计技术,可以实现更高的时钟速度和更多的核心数量。
这意味着它可以处理更多的计算任务,并提供更快的响应速度。
例如,AMD的最新一代芯片组可以支持多处理器配置,具有更好的多线程性能,适用于大规模的科学计算和数据分析领域。
其次,AMD芯片组在能耗方面表现出色。
它采用节能设计和先进的功耗管理技术,可以有效地降低能耗,并延长电池续航时间。
对于移动设备和嵌入式系统,这一点尤为重要。
此外,AMD芯片组还支持硬件加速技术,如AMD Accelerated Processing Unit(APU),可以在处理器和显卡之间共享资源,提高系统的整体性能和效率。
再次,AMD芯片组具有良好的兼容性和扩展性。
它支持多种接口和标准,如USB、PCI Express、SATA等,可以连接各种外部设备,并实现快速和稳定的数据传输。
此外,AMD芯片组还提供了丰富的扩展接口和功能,如内存控制器、图形引擎、音频处理器等,可以根据实际需求进行配置和定制。
最后,AMD芯片组还提供了丰富的软件支持和开发工具。
它与多个操作系统和开发环境兼容,并提供了一系列的驱动程序和工具,方便开发者进行应用程序的开发和调试。
此外,AMD还积极参与开放源代码社区和标准组织,推动开源软件和硬件生态系统的发展。
综上所述,AMD芯片组具有高性能、低能耗、良好的兼容性和扩展性等优势。
它适用于各种应用场景,如台式计算机、移动设备、嵌入式系统等。
在竞争激烈的芯片市场上,AMD凭借其卓越的技术和产品性能不断赢得市场份额,并成为全球领先的芯片组提供商之一。
amd ipu 用法 -回复

amd ipu 用法-回复AMD IPU 是什么?AMD IPU(Infinite Performance Unit)是AMD推出的一款先进的芯片设计,旨在提供无限的性能和计算能力。
这款芯片设计是为高性能计算和数据处理而构建的,具备出色的处理速度、能效和可靠性。
AMD IPU 的用途是什么?AMD IPU 可以应用于多种领域和应用场景,包括人工智能、机器学习、大数据分析、虚拟现实和游戏开发等。
由于其强大的计算能力和性能优势,AMD IPU 成为了许多企业和研究机构的首选芯片。
AMD IPU 的架构和工作原理是怎样的?AMD IPU 的架构采用了多核心设计,每个核心都配备了自己的浮点运算单元和高速缓存。
这些核心可以同时进行多个任务的处理,从而提高了整体的计算速度。
此外,AMD IPU 还采用了先进的内存架构和设备互联技术,可以与其他设备进行高速数据传输和交互。
AMD IPU 的优势和特点有哪些?1. 强大的计算能力:AMD IPU 配备了多个高性能核心,并且每个核心都具备先进的浮点运算单元。
这使得AMD IPU 在进行复杂的计算和数据处理任务时非常高效。
2. 高能效和低功耗:AMD IPU 使用先进的芯片制造工艺和节能设计,能够在保持强大性能的同时降低功耗。
这使得AMD IPU 在节能环境下能够长时间运行,并且对环境的影响较小。
3. 可靠性和稳定性:AMD IPU 经过了严格的测试和验证,具备出色的可靠性和稳定性。
它可以在极端条件下运行,并且能够保持高效的性能,为用户提供稳定的计算环境。
4. 易于开发和集成:AMD IPU 提供了完善的软件开发工具和支持,使得开发人员能够迅速开发和优化应用程序。
此外,AMD IPU 还与其他硬件设备和平台兼容,可以轻松集成到现有的系统中。
AMD IPU 如何运用于不同的领域?1. 人工智能和机器学习:AMD IPU 可以加速深度学习算法的训练和推理过程,提供更快速、准确和高效的人工智能功能。
电脑AMD芯片组时序信号解释

AMD芯片组时序信号解释:VBAT:RTC电路的供电,3V(RTC电路有问题会导致没复位或不跑码等故障)RTC clock in:晶振起振给南桥提供32.768KHz频率(RTC电路有问题会导致没复位或不跑码等故障)+3.3V_S5:南桥主待机电压,3.3V+1.2V_S5:南桥第二个待机电压,有的是1.2V,有的是1.1V,AMD单桥也是1.1VRSMRST#:南桥待机电压好,3.3VPWR_BTN#:电源开关触发后,最终送达南桥的触发信号,高低高的脉冲WAKE#:唤醒信号,通常来自于网卡芯片,作用类似于PWR_BTN#SLP_S5#:南桥发出的退出关机状态的信号,3.3V,用于控制内存供电产生SLP_S3#:南桥发出的退出睡眠状态的信号,3.3V,用于控制所有的S0电压产生ALL power rails:所有电源被开启,包括内存供电、桥供电、VDDA供电、CPU供电、总线供电(单桥无此供电)等System clocks(单桥由桥内部完成):时名钟芯片开始开作PCIE_RCLKP/N(单桥此信号不采用):时钟芯片送给南桥的100M差分时钟对,作为南桥的主时钟信号PWR_GOOD:通知南桥,此时S0状态电压全部OK (25M开始起振)。
PCICLK(5:0):南桥发出的PCI时钟NB_PWRGD(单桥无此信号):南桥发出的,表示北桥的供电正常,连接北桥的POWERGOOD脚SB700南桥具备完整时钟功能,如果启用南桥内部集成的时钟芯片,NB_PWRGD可以空置,把北桥的POWERGOOD脚连接到PWR_GOOD即可;如果不启用南桥内部全部时钟功能,必须等待时钟电路工作且稳定后,南桥才会发出NB_PWRGD给北桥POWERGOOD脚。
LDT_ STP#:南桥发给CPU的退出停止状态的信号,由内存供电上拉LDT_PG:南桥发出给CPU的电源好,由内存供电上拉A_RST#:南桥发出的平台复位,相当于INTEL的PLTRST#,3.3VPCIE_RST#:PCIE_RST#复位,仅AMD SB8XX后南桥有PCIRST#:南桥发出的PCI复位,3.3VLDT_RST#:南桥直接发给CPU的复位,由内存供电上拉。
惠普 m1136 多功能一体机 安装指南说明书

台达嵌入式工业计算机操作手册-J1900 系列说明书

中达电通公司版权所有如有改动,恕不另行通知文件编码 :DIAVH-092AG10-01文件日期 : 2019/02/20238201209 0215863-56780215863-0003 扫一扫,关注官方微信上海电话:(021)6301-2827武汉电话:(027)8544-8475济南电话:(0531)8690-7277乌鲁木齐电话:(0991)4678-141沈阳电话:(024)2334-16123南昌电话:(0791)8625-5010长沙电话:(0731)8549-9156郑州电话:(0371)6384-2772西安电话:(029)8836-0780长春电话:(0431)8892-5060合肥电话:(0551)6281-6777南宁电话:(0771)5879-599北京电话:(010)8225-3225成都电话:(028)8434-2075南京电话:(025)8334-6585厦门电话:(0592)5313-601天津电话:(022)2301-5082重庆电话:(023)8806-0306 杭州电话:(0571)8882-0610广州电话:(020)3879-2175太原电话:(0351)4039-475哈尔滨电话:(0451)5366-0643绵密网络 专业服务中达电通已建立了71个分支机构及服务网点,并塑建训练有素的专业团队,提供客户最满意的服务,公司技术人员能在2小时内回应您的问题,并在48小时内提供所需服务。
400 - 820 - 9595台达嵌入式工业计算机操作手册-J1900系列版权说明©Delta Electronics, Inc. All rights reserved.台达电子工业股份有限公司保留所有权利本使用手册编撰的所有信息内容属台达电子工业股份有限公司(以下简称「台达」)之专属财产,且受到著作权法及所有法律保护。
台达依著作权法及其它法律享有并保留一切著作权及其他法律专属权利,非经台达事先同意,不得就本手册部分或全部任意地仿制、拷贝、誊抄、转译或为其它利用。
AMD RAID 安装指南说明书

AMD RAID 安装指南AMD RAID 安装指南 (1)1. AMD BIOS RAID 安装指南 (2)1.1 RAID 简介 (2)1.2 RAID 配置的注意事项 (5)1.3 UEFI RAID 配置 (6)2. AMD Windows RAID 安装指南 (19)2.1 在Windows 下创建RAID 卷 (19)2.2 在Windows 下删除RAID 阵列 (26)该指南中的BIOS 截图仅供参考,可能与您主板的实际设置画面有所不同。
您看到的实际设置画面根据您所购买的主板而定。
请参考产品规格页面了解RAID支持信息。
由于主板规格及BIOS 软件可能会更新,此文档的内容可能会受影响,恕不另行通知。
1.AMD BIOS RAID 安装指南AMD BIOS RAID 安装指南介绍如何在BIOS 环境下使用板载FastBuild BIOS 实用程序配置RAID 功能。
装入SATA 驱动器软盘后,按[F2] 或[Del] 进入BIOS 安装程序,按照支持CD 中“用户手册”的具体说明设置进入RAID 模式的选项,随后开始使用板载RAID Option ROM 实用程序配置RAID。
1.1 RAID 简介“RAID”这一术语表示“独立磁盘冗余阵列”(Redundant Array of Independent Disks),是一种将两个或多个硬盘驱动器合并为一个逻辑单元的方法。
为达到最佳性能,创建RAID 组时,请安装型号相同、容量相同的驱动器。
RAID 0(数据分条)RAID 0 称为数据分条,可对两个完全相同的硬盘驱动器进行优化,在并行、交错的堆栈中读取和写入数据。
RAID 0 将使单一磁盘的数据传输速率倍增,同时两个硬盘以一个硬盘的形式执行相同操作,但数据传输速率保持不变,因此可提高数据访问和存储性能。
警告!!虽然RAID 0 功能可提高访问性能,但不具备任何容错能力。
对RAID 0 磁盘的任何硬盘驱动器进行热插拔都将导致数据损坏或丢失。
- 1、下载文档前请自行甄别文档内容的完整性,平台不提供额外的编辑、内容补充、找答案等附加服务。
- 2、"仅部分预览"的文档,不可在线预览部分如存在完整性等问题,可反馈申请退款(可完整预览的文档不适用该条件!)。
- 3、如文档侵犯您的权益,请联系客服反馈,我们会尽快为您处理(人工客服工作时间:9:00-18:30)。
R ANIBIZUMAB AND PEGAPTANIB FOR AGE-RELATEDMACULAR DEGENERATIONR EPORT BY THE NICE D ECISION S UPPORT U NIT.24 September 2007CHAPTER 1: THE COST-EFFECTIVENESS OF PEGAPTANIB FOR AGE-RELATED MACULAR DEGENERATION:R E-ANALYSIS OF THE P FIZER MODEL…………………..PAGE 2 xxxxxxxxxxxxx, Centre for Health Economics, University of YorkC HAPTER 2:R EVIEW OF U TILITY S TUDIES IN AGE-RELATED MACULAR DEGENERATION…………………………………………………………..P AGE 26 xxxxxxxxxxxxxxxxHealth Economics and Decision Science, ScHARR, University of Sheffield Decision Support UnitScHARR, University of SheffieldC HAPTER 1:T HE COST-EFFECTIVENESS OF PEGAPTANIB FOR AGE-RELATED MACULAR DEGENERATION:R E-ANALYSIS OF THE P FIZER MODEL1.BackgroundFollowing the Appraisal Committee meeting of 8th of May 2007, a consultation document with preliminary recommendations was issued. Ranibizumab was recommended for the treatment of wet AMD for people with a confirmed diagnosis of predominantly classic lesions, only for the better-seeing of two affected eyes. Pegaptanib was not recommended for treatment of wet AMD. One of the issues raised during consultation was that pegaptanib may be more clinically and cost effective when used to treat a subgroup of patients with early stage disease. In the submission by Pfizer, the manufacturer of pegaptanib, a range of incremental cost-effectiveness ratios (ICERs) was presented, for groups of patients stratified by initial levels visual acuity. The Pfizer model is based on patient-level data and is structurally different to the Assessment Group (AG) model. The Decision Support Unit (DSU) were therefore requested to produce cost-effectiveness estimates from the Pfizer model using alternative parameter assumptions in order to enable consideration of the subgroups by initial visual acuity, but with a range of parameter assumptions consistent with those applied in the original AG model. In addition, additional analyses based on the Pfizer model were requested to match the assumptions being used in the revised analysis being undertaken by the AG.The alternative parameter assumptions covered 4 main areas:1.The costs of administration2.Health utilities3.The disease modifying effect of pegaptanib4.The costs of blindness2.MethodsThe following work was undertaken by the DSU to address each of these respective areas:The costs of administration•Adjusting the costs of AMD treatment in the Pfizer model in line with changes in unit costs and resource use the Assessment Group applied in the originalAssessment Report. These included:-OCT costs (£50.86) added to each visit-Optometrist assessment (£58.76) added to each visit-Fluoroscein angiography costs (£184.08) added every 6 months-Costs of injection procedure altered from extended outpatient attendance (£90.20) to day case (£395).•Adjusting the costs of AMD treatment in the Pfizer model in line with changes in unit costs and resource use based on the Royal College of Ophthalmologists costing guidelines published in July 2007.1 These included:-Replacing resource use and unit cost assumptions for pegaptanib with the(i) full assessment and treatment costs and (ii) treatment (injection only)costs reported in the Royal College costing guidelines-Full assessment and treatment costs were applied at the 1st attendance. For subsequent attendances the costs were based on full assessment andtreatment costs and treatment (injection only) at alternate attendances (i.e.equivalent to a full assessment every 3 months).Health utilities•Adjusting the utility estimates in the Pfizer model based on alternative estimates reported in the Novartis submission supporting ranibizumab (CICdata) referred to as the “Brazier” utility values and estimates reported in thepublication by Espallargues et al (2005).1 Commissioning contemporary AMD services: A guide for commissioners and clinicians (July 2007)The disease modifying effect of pegaptanib•Examining the impact of alternative assumptions related to the potential disease modifying effect of pegaptanib. These included:-(i) Lifetime effect (based on approach used in the submission by Pfizer), (ii) no continuing effect after cessation of treatment and (iii) a diseasemodifying effect lasting 1-year after cessation of treatment (i.e. patientsreverted back to the prognosis of sham injections at year 3 in the model) The costs of blindness•Examining the impact of alternative assumptions related to the costs of blindness based on the additional work undertaken by the AG.The cost-effectiveness of pegaptanib was assessed in different subgroups corresponding to the base-case population presented by Pfizer (Scenario A in the manufacturers submission with a starting visual acuity between 6/12 to 6/95) and the subgroups reported in the original Assessment Group report (Subgroup 1: 6/12 to>6/24, Subgroup 2: 6/24 to >6/60 and Subgroup 3: 6/60 to >3/60). Where feasible uncertainty around the ICER estimates was explored using probabilistic sensitivity analysis (all areas except the costs of blindness). Due to the number of potential assumptions considered related to the costs of blindness, estimates of the ICER were based on deterministic analyses only.A total of 13 separate scenarios were considered covering these areas. The alternative assumptions employed in each individual scenario are reported in Table 1. Table 2 provides a summary of the respective ICERs from each scenario undertaken using probabilistic analysis. Full details of the probabilistic results including the probability the pegaptanib is cost-effective at alternative threshold values for the ICER (£20,000, £30,000 and £40,000 per additional QALY) are reported in full in Appendix 1. The results of the scenarios run deterministically related to the costs of blindness are reported in Table 3.3.ResultsThe costs of administrationScenarios 1-3 report the results of the ICER based on the alternative assumptions related to the costs of drug administration. Scenario 1 provides the results using the manufacturer’s original costing assumptions, while Scenarios 2 and 3 are based on the costing assumptions based on the Assessment Group report and the Royal College of Ophthalmologists costs respectively. In summary, estimates of the ICER were markedly different between the manufacturer’s assumptions and those employed using Scenarios 2 and 3. Estimates of the ICER using the manufacturer’s estimates were below £30,000 per QALY in the base-case population (6/12 to 6/95) and Subgroups 1 (6/12 to >6/24) and 2 (6/24 to >6/60). There was a marked difference in the estimates of the ICER for the worst visual acuity group (Subgroup 3, ICER = £62,518). In contrast, estimates of the ICER in Scenarios 2 and 3 were only below £30,000 per QALY for Subgroup 1. The results using Scenarios 2 and 3 across each of the subgroups considered were broadly consistent with each other.Given the disparity between the manufacturer’s original estimates for administration costs and those employed in the Assessment Group model and by the Royal College of Ophthalmologists, subsequent scenarios were based on the costing assumptions considered by the latter 2 sources.Health utilitiesScenarios 4 to 7 are based on alternative estimates reported in the Novartis submission supporting ranibizumab (CIC data) referred to as the “Brazier” values (Scenarios 4-5) and estimates reported in the publication by Espallargues et al (2005) (Scenarios 6-7). In summary, estimates of the ICER using the Brazier values were slightly less favourable than the estimates based on the original utility values (Brown et al 2000). In common with the results based on the original utility estimates, the ICERs based on the Brazier utility values were only below £30,000 per QALY for Subgroup 1. This was true regardless of whether the Assessment Group costs or the Royal College costs were used as the basis for costing drug administration.In contrast, the estimates based on Espallargues et al were markedly higher, such that estimates of the ICER exceeded £50,000 per additional QALY in each of the subgroups considered.The disease modifying effect of pegaptanibIn their original submission Pfizer used separate transition probabilities between the visual acuity states for patients post-pegaptanib (i.e. reflecting subsequent prognosis after cessation of treatment) and for those who initially received a sham procedure. This approach was used to account for the potential disease modifying effect of pegaptanib. The analysis presented by Pfizer continued to apply separate transition probabilities for the full time horizon (10-years), in effect assuming that the disease modifying effect remains for the remainder of the patient’s lifetime.However, this analysis was based on only limited follow-up data and henceconcerns were raised regarding the duration (if any) of the potential diseasemodifying effect. A series of alternative assumptions (Scenarios 8-11) wereexplored to examine the impact on the ICER related to the potential diseasemodifying effect of pegaptanib. These included:-(i) assuming no disease modifying effect after cessation of treatment and (ii) a disease modifying effect lasting 1-year after cessation of treatment(i.e. patients reverted back to the prognosis of sham injections at year 3 inthe model)In the absence of a disease modifying effect after cessation of treatment, the ICERs increased to over £40,000 per QALY in each of the separate subgroups. Assuming that the disease modifying effect was maintained for an additional year only resulted in less favourable ICER estimates, relative to the base-case assumption (lifetime effect), although estimates of the ICER in Subgroup 1 remained below £30,000 per QALY.The costs of blindnessA range of alternative assumptions related to the costs of blindness were examined based on additional work undertaken by the AG. Due to the number of potential scenarios considered, these analyses were based on deterministic estimates from the model. The majority of analyses made only minimal difference to the ICER estimatesbased on the original assumption employed in relation to the costs of blindness. The variable which had the greatest impact on the ICER was the assumption related to the proportion of patients receiving community care services (varied between 17% and 25% compared to 6% in the base-case analysis). Due to the minimal impact of the other assumptions on the ICER, only the assumption related to the proportion of patients receiving community care services was undertaken using both the Assessment Group and the Royal College administration costs. All other analyses were only undertaken using the Assessment Group estimates as the basis for administration costs.As previously stated, each of the individual assumptions made only a minor impact to the ICER results. As such, ICER estimates below £30,000 per QALY were only identified in Subgroup 1. When the proportion of patients receiving community care services was increased to 25%, the ICER estimates for Subgroup 1 were below £20,000 per QALY.4.DiscussionThe ICER estimates were demonstrated to be sensitive to a number of potential issues. Clearly the costs of administration are central to the cost-effectiveness results. The original estimates applied in the manufacturer’s submission result in markedly more favourable ICER estimates compared to estimates provided by the AG and the Royal College of Ophthalmologists. Estimates of the ICER of pegaptanib based on the latter two sources were similar, although slightly more favourable ICERs were derived based on the original estimates provided by the AG. In contrast to the ICER estimates based on the manufacturer’s assumptions related to the costs of administration, re-analysis of the Pfizer model using both the AG and Royal College costs identified that the ICER of pegaptanib was only below £30,000 per QALY in the subgroup with the best starting visual acuity (Subgroup 1: 6/12 to >6/24).The ICER results were also demonstrated to be sensitive to the health state utility values applied to the separate visual acuity groups. Estimates using the ‘Brazier’ utility values resulted in slightly less favourable ICERs compared to the base-caseanalysis. However, the ICER of pegaptanib in Subgroup 1 remained below £30,000 per QALY. In contrast, the ICER estimates employing the utility values reported in the study by Espallargues et al (2005) markedly increased the ICER estimates, such that the ICERs exceeded £50,000 per QALY in all subgroups considered. However, it is worth noting that the results based on the Espallargues study should be treated with some caution. In particular, the visual acuity categories reported in the Espallargues study do not appear to discriminate well between the subgroups being considered here (e.g. one of the subgroups covers patients <20/80 to 20/400. This covers about 60% of the patients in the Pfizer trials). Given the broad groupings reported, the study has important limitations for examining the impact of utility differences between the subgroups of interest. Indeed, the utility values from the Espallargues study only report a 0.02 utility difference between any of the states that patients are likely to be maintained on treatment for in the Pfizer model. This contrasts markedly with the estimates derived from the other utility studies considered. Hence, it is doubtful that the results from the Espallargues study are appropriate to represent the incremental difference in utility values between the alternative visual acuity groups considered. What they are potentially helpful for is in questioning the absolute utility values applied in the model as opposed to providing reliable estimates which discriminate well between the different acuity states. Clearly the absolute utility values from the Espallargues study are a lot lower than the other estimates. However, it is less clear whether the absolute utility estimates are central to the cost-effectiveness estimates since the ICER results will be largely driven by the incremental difference in utilities between the health states as opposed to the absolute utility values.The assumption related to the potential disease modifying effect of pegaptanib is also central to the cost-effectiveness of pegaptanib. Assuming that there is no continuing effect of pegaptanib once treatment ceases results in ICERs in excess of £40,000 per QALY in all subgroups. However, if it assumed that pegaptanib has a disease modifying effect then the estimates of the ICER are less than £30,000 per QALY in Subgroup 1, regardless of whether this effect lasts only one additional year or for the remaining lifetime of the patient. Hence, the cost-effectiveness of pegaptanib appears to depend upon the existence of a disease modifying effect as opposed to the exact duration of this effect.The ICER estimates based on the alternative scenarios considered relating to the costs of blindness outlined by the AG demonstrate that these appear to have only a minor impact on the cost-effectiveness results using the Pfizer model.In addition it is evident that the starting visual acuity is a key factor in relation to the cost-effectiveness of pegaptanib. With the exception of the scenarios based on the assumption of (i) no disease modifying effect and (ii) the Espallargues et al (2005) utility values, the ICER of pegaptanib was consistently lower than £30,000 in the subgroup with the best starting visual acuity (6/12 to >6/24). In every scenario considered, based on using either the AG or the Royal College estimates for the costs of pegaptanib administration, ICER estimates were consistently above £40,000 per QALY in the two subgroups with a lower starting visual acuity (6/24 to >6/60 and6/60 to >3/60). However, given that the ICER estimates vary markedly between Subgroup 1 and Subgroup 2, this raises an important question as to whether there are patients within Subgroup 2 for whom the ICER is less than £30,000 per QALY.An additional set of analyses was therefore examined by the DSU in relation to the cost-effectiveness of pegaptanib in different visual acuity levels within Subgroup 2. This approach is helpful since the results could be used to establish appropriate subgroups based on cost-effectiveness considerations. The approach used was to examine the cost-effectiveness of pegaptanib in this subgroup, starting with patients with the highest visual acuity in Subgroup 2 (i.e. patient with exactly 6/24 vision) and continuing to examine successively lower acuity levels until the ICER exceeded £30,000 per QALY. The ICER results for patients with 6/24 vision are reported in Table 4 using both the AG and Royal College estimates for drug administration costs. The results demonstrate the ICER estimates for this subgroup exceed £30,000 per QALY. Consequently no additional visual acuity levels were considered within Subgroup 2 (on the basis that the ICER estimates would get progressively less favourable). In conclusion, it appears that of the different subgroups considered, the ICER for pegaptanib is only less than £30,000 per QALY in patients with a starting visual acuity of 6/12 to >6/24.ReferencesBrown GC et al (2000) Utility values and age-related macular degeneration. Archives of Ophthalmology. 118(1): 47-51Espallargues M et al (2005). The impact of age-related macular degeneration on health status utility values. Investigative Opthalmology and Visual Science. 46(11): 4016-4023.Table 1: Summary of alternative assumptions employed in each scenarioScenario Drug/Admin Costs Utilities Disease Modifying EffectCosts ofblindnessIssue 1: Costs of administration1 Manufacturer Brown (TTO) Lifetime Manufacturer2 Assessment GroupBrown (TTO) Lifetime Manufacturer3 Royal College of Opthalmol.Brown (TTO) Lifetime ManufacturerIssue 2: Health utility estimates4 Assessment GroupBrazier (TTO) Lifetime Manufacturer5 Royal College of Opthalmol.Brazier (TTO) Lifetime Manufacturer6 Assessment Group Espallargues (HUI-3)Lifetime Manufacturer7 Royal College of Opthalmol. Espallargues (HUI-3)Lifetime ManufacturerIssue 3: Disease modifying effect8 Assessment GroupBrown (TTO) None Manufacturer9 Royal College of Opthalmol.Brown (TTO) None Manufacturer10 Assessment Group Brown (TTO) 1-year (effect stopped atYear 3)Manufacturer11 Royal College of Opthalmol. Brown (TTO) 1-year (effect stopped atYear 3)ManufacturerIssue 4: Costs of blindness12 Assessment GroupBrown (TTO) Lifetime Various13 Royal College of Opthalmol.Brown (TTO) Lifetime VariousTable 2: Summary of cost-effectiveness results for alternative scenarios (probabilistic estimates)ICER estimates (Incremental cost per QALY)Scenario Base-Case*(6/12-6/95) Subgroup 1(6/12 to>6/24)Subgroup 2(6/24 to>6/60)Subgroup 3(6/60 to>3/60)1 2 3 Administration costsManufacturer’s costsAssessment Group costsRoyal College costs£16,105£35,614£37,604£8,829£23,104£24,036£21,900£46,588£46,897£62,518£110,223£109,6944 5 Brazier utility estimatesAssessment Group costsRoyal College costs£38,434£39,441£26,329£27,159£46,302£47,049£120,295£123,8506 7 Espallargues utilityestimatesAssessment Group costsRoyal College costs£76,709£80,188£55,541£58,377£87,872£90,027£235,969£227,2948 9 No disease modifyingeffect**Assessment Group costsRoyal College costs£61,819£62,213£44,894£45,767£73,546£75,984£138,883£139,5271011Disease modifying effectuntil year 3**Assessment Group costsRoyal College costs£38,735£39,015£25,583£26,214£49,156£48,737£112,583£109,757 *Manufacturers base-case scenario (Scenario A)** Assuming manufacturer’s utility estimates13Table 3: Alternative assumptions related to the costs of blindness (deterministic estimates)ICER EstimatesScenario Base case value Value in sensitivity analysis Base-Case (6/12-6/95)Subgroup 1 (6/12 to >6/24)Subgroup 2 (6/24 to >6/60)Subgroup 3(6/60 to >3/60)Scenario 12: Assessment Group CostsProportion registering blind who were previously registered partially sighted0.00 0.45 £35,296 £22,723 £45,937 £114,816 Proportion having annual re-assessment by OT 0.00 1.00 £35,185 £22,622 £45,814 £115,685Proportion having annual re-assessment by OT and repeat low vision rehabilitation each year 0.00 0.00 1.00 0.50 £34,850 £22,294 £45,450 £114,483 Proportion having annual re-assessment by OT and new low vision aids each year 0.00 0.00 1.00 0.50 £34,976 £22,417 £45,587 £114,559 Uptake of low vision rehabilitation 0.11 0.44 £35,285 £22,708 £45,928 £114,848Uptake of low vision aids0.33 0.47 £35,306 £22,737 £45,947 £114,785Proportion receiving community care services0.060.25£32,107 £19,608 £42,475 £112,829Proportion receiving community care services(home care)0.06 0.17£33,457 £20,930 £43,939 £113,644Scenario 13: Royal College Costs – only reported for community care due to minimal impact on ICER due to other elements Proportion receiving community care services 0.06 0.25 £32,353 £19,803 £42,792 £113,169 Proportion receiving community care services (home care)0.06 0.17£33,703 £21,125 £44,257 £113,984NICE Decision Support Unit Table 4: Subgroup analysis of patients with starting visual acuity of 6/24Subgroup = 6/24 (Assessment Group costs) Probability CE at Max WTP Intervention Mean Costs Mean QALYs ICER £20,000 £30,000 £40,000 Pegaptanib £25,639 3.3975 £39,444 0.03 0.18 0.525 Sham £14,726 3.1208 NA 0.97 0.82 0.475Subgroup = 6/24 (Royal College costs) Probability CE at Max WTP Intervention Mean Costs Mean QALYs ICER £20,000 £30,000 £40,000 Pegaptanib £24,898 3.4058 £40,613 0.03 0.17 0.49 Sham £13,547 3.1263 NA 0.97 0.83 0.51NICE Decision Support Unit APPENDIX 1: DETAILED RESULTS OF PROBABILISTIC ANALYSESScenario 1 – Costing assumptions based on Pfizer submissionBase Case – Scenario A (6/12 to 6/95) Probability CE at Max WTP Intervention Mean Costs Mean QALYs ICER £20,000 £30,000 £40,000 Pegaptanib £20,782 3.3189 £16,105 0.77 0.99 1 Sham £15,999 3.0219 NA 0.23 0.01 0Subgroup 1 (6/12 to >6/24) Probability CE at Max WTP Intervention Mean Costs Mean QALYs ICER £20,000 £30,000 £40,000 Pegaptanib £17,303 3.7946 £8,829 0.99 1 1 Sham £13,525 3.3668 NA 0.01 0 0Subgroup 2 (6/24 to >6/60) Probability CE at Max WTP Intervention Mean Costs Mean QALYs ICER £20,000 £30,000 £40,000 Pegaptanib £21,662 3.1495 £21,900 0.38 0.88 0.99 Sham £16,315 2.9053 NA 0.62 0.12 0.01Subgroup 3 (6/60 to >3/60) Probability CE at Max WTP Intervention Mean Costs Mean QALYs ICER £20,000 £30,000 £40,000 Pegaptanib £27,259 2.5604 £62,518 0 0.01 0.08 Sham £21,623 2.4702 NA 1 0.99 0.92Scenario 2 – Costing assumptions based on Assessment Group report (inc costs for OCT and optometrist at each visit, flouroscein angiography every 6 months, day case costs for injection procedure)Base Case – Scenario A (6/12 to 6/95) Probability CE at Max WTP Intervention Mean Costs Mean QALYs ICER £20,000 £30,000 £40,000 Pegaptanib £26,529 3.3202 £35,614 0.04 0.27 0.68 Sham £15,995 3.0244 NA 0.96 0.73 0.32Subgroup 1 (6/12 to >6/24) Probability CE at Max WTP Intervention Mean Costs Mean QALYs ICER £20,000 £30,000 £40,000 Pegaptanib £23,402 3.7897 £23,104 0.32 0.83 0.98 Sham £13,542 3.3630 NA 0.68 0.17 0.02Subgroup 2 (6/24 to >6/60) Probability CE at Max WTP Intervention Mean Costs Mean QALYs ICER £20,000 £30,000 £40,000 Pegaptanib £27,628 3.1460 £46,588 0.01 0.07 0.29 Sham £16,324 2.9034 NA 0.99 0.93 0.71Subgroup 3 (6/60 to >3/60) Probability CE at Max WTP Intervention Mean Costs Mean QALYs ICER £20,000 £30,000 £40,000 Pegaptanib £31,786 2.5717 £110,223 0 0 0 Sham £21,650 2.4798 NA 1 1 1Scenario 3 – Costing assumptions based on Royal College of Opthalmologists Guide (Assuming Full assessment & treatment every 3 months)Base Case – Scenario A (6/12 to 6/95)Probability CE at Max WTP Intervention Mean Costs Mean QALYsICER £20,000 £30,000 £40,000 Pegaptanib £25,842 3.3228 £37,604 0.01 0.21 0.60 Sham £14,724 3.0271 NA 0.99 0.79 0.40Subgroup 1 (6/12 to >6/24) Probability CE at Max WTP Intervention Mean Costs Mean QALYs ICER £20,000 £30,000 £40,000 Pegaptanib £22,844 3.8045 £24,036 0.26 0.80 0.97 Sham £12,470 3.3729 NA 0.74 0.20 0.03 Subgroup 2 (6/24 to >6/60)Probability CE at Max WTP Intervention Mean Costs Mean QALYsICER £20,000 £30,000 £40,000 Pegaptanib £26,541 3.1443 £46,897 0 0.05 0.26 Sham £15,026 2.8987 NA 1 0.95 0.74 Subgroup 3 (6/60 to >3/60) Probability CE at Max WTP Intervention Mean Costs Mean QALYs ICER £20,000 £30,000 £40,000 Pegaptanib £30,012 2.5684 £109,694 0 0 0 Sham £19,880 2.4760 NA 1 1 1Scenario 4 – Costing assumptions based on Assessment Group report & Brazier utility estimatesBase Case – Scenario A (6/12 to 6/95)Probability CE at Max WTP Intervention Mean Costs Mean QALYsICER £20,000 £30,000 £40,000 Pegaptanib £26,512 3.7555 £38,434 0.02 0.22 0.57 Sham £16,001 3.4821 NA 0.98 0.78 0.43Subgroup 1 (6/12 to >6/24) Probability CE at Max WTP Intervention Mean Costs Mean QALYs ICER £20,000 £30,000 £40,000 Pegaptanib £23,549 4.1021 £26,329 0.19 0.68 0.93 Sham £13,533 3.7217 NA 0.81 0.32 0.07 Subgroup 2 (6/24 to >6/60)Probability CE at Max WTP Intervention Mean Costs Mean QALYsICER £20,000 £30,000 £40,000 Pegaptanib £27,605 3.6596 £46,302 0.01 0.1 0.31 Sham £16,324 3.4160 NA 0.99 0.9 0.69 Subgroup 3 (6/60 to >3/60) Probability CE at Max WTP Intervention Mean Costs Mean QALYs ICER £20,000 £30,000 £40,000 Pegaptanib £31,707 3.1203 £120,295 0 0 0 Sham £21,641 3.0366 NA 1 1 1Scenario 5 – Costing assumptions based on Royal College of Opthalmologists Guide & Brazier utility estimatesBase Case – Scenario A (6/12 to 6/95) Probability CE at Max WTP Intervention Mean Costs Mean QALYs ICER £20,000 £30,000 £40,000 Pegaptanib £25,555 3.7587 £39,441 0.03 0.17 0.51 Sham £14,732 3.4843 NA 0.97 0.83 0.49Subgroup 1 (6/12 to >6/24) Probability CE at Max WTP Intervention Mean Costs Mean QALYs ICER £20,000 £30,000 £40,000 Pegaptanib £22,846 4.0967 £27,159 0.19 0.62 0.91 Sham £12,476 3.7149 NA 0.81 0.38 0.09Subgroup 2 (6/24 to >6/60)Probability CE at Max WTP Intervention Mean Costs Mean QALYsICER £20,000 £30,000 £40,000 Pegaptanib £26,547 3.6600 £47,049 0.01 0.07 0.28 Sham £15,023 3.4150 NA 0.99 0.93 0.72Subgroup 3 (6/60 to >3/60) Probability CE at Max WTP Intervention Mean Costs Mean QALYs ICER £20,000 £30,000 £40,000 Pegaptanib 3.1299 3.1299 £123,850 0 0 0 Sham 3.0478 3.0478 NA 1 1 1。