A Review of Turbine Blade Tip Heat Transfer (pages 64–79)
透平叶片顶部间隙流动特性的实验和数值研究
透平叶片顶部间隙流动特性的实验和数值研究张洪;王建华;张清波【摘要】利用粒子图像测速技术(PIV)捕捉透平叶片顶部泄漏流特征,并以此数据验证湍流模型和用商业软件CFX12.0进行的数值模拟方法.所研究的叶片为典型的GE-E3叶片,为了展示泄漏涡的生成和发展过程,用实验数据展示了3个不同截面的速度分布.数值计算中使用了混合网格生成技术及5种湍流模型.通过与实验数据的比较发现:RNG k-ε模型计算所得的泄漏涡与实验所拍摄的真实流动能较好地吻合.此模型和计算方法同样适用于研究叶顶射流对泄漏流的影响.计算结果显示:通过叶片顶部气膜孔射流产生的阻挡效应,最多能降低6.12%的主流泄漏.%The flow characteristics of turbine blade tip leakage were measured with a particle image velocimetry (PIV) system, and the experimental data was used to estimate the turbulence model and numerical simulation conducted with commercial software CFX12. 0. The test model was a typical GE-E3 blade. To exhibit the generation and development of leakage vortex, three velocity distribution profiles obtained by the PIV system are exhibited. Hybrid mesh generation process and five turbulence models were used during the numerical simulation. Through comparison of experimental data with the simulation results, it can be seen that the vortex obtained by vising RNG k-ε mod el was closer to that captured by PIV system. This turbulence model and numerical approach can be used to estimate the effects of blade tip injection, The numerical results indicated that with coolant injection through the film holes at the blade tip, the leakage flow rate can be reduced by 6, 12% at most.【期刊名称】《实验流体力学》【年(卷),期】2012(026)003【总页数】5页(P56-60)【关键词】PIV;泄漏流;数值模拟;泄漏涡;湍流模型【作者】张洪;王建华;张清波【作者单位】中国科学技术大学热科学与能源工程系,合肥 230027;中国科学技术大学热科学与能源工程系,合肥 230027;中国科学技术大学热科学与能源工程系,合肥 230027【正文语种】中文【中图分类】V231.30 引言在现代燃气透平叶片设计中,动叶片顶部应该尽量接近透平环形的固定壁面,同时又必须留有一定间隙,以适应叶片因离心力及受热引起的伸长和固定壁的热变形。
Performance improvements of unshrouded turbines through management of leakage and injection flows
Aero-thermal performance improvements of unshrouded turbines through management of tip leakage and injection flowsJie Gao *,Qun Zheng,Zhengyi Zhang,Yuting JiangCollege of Power and Energy Engineering,Harbin Engineering University,Harbin 150001,Chinaa r t i c l e i n f oArticle history:Received 25August 2013Received in revised form 12March 2014Accepted 15March 2014Available online 13April 2014Keywords:Cavity tipTip leakage flow Tip injectionTip clearance height Injection mass flow rate Aero-thermal performancea b s t r a c tThe tip leakage flow not only is responsible for a signi ficant amount of aerodynamic losses in a turbine stage,but also leads to high heat-loads on the tip region.The paper presents a numerical investigation of in fluences of tip injection on aero-thermal performance of the tip leakage flow for both flat tip and cavity tip in an unshrouded turbine rotor,in an attempt to improve the turbine blade tip aero-thermal per-formance by the management of tip leakage and injection flows.The effects studied include the sensi-tivities to the geometrical clearance height and the injection mass flow rate.The results show that,at all tip clearances,tip injection has a good effect on the control of the leakage flow,and it signi ficantly re-duces the sensitivities of turbine performances to the effects of the tip clearance height.With tip in-jection,cavity tip geometry does not play a major role in the turbine performance improvement,but it obtains the good film-cooling performance on the blade tip.Tip clearance height,blade tip geometry and injection mass flow rate have related effects on the blade tip aero-thermal performance,and the turbine blade tip obtains the best aero-thermal performance with an optimum injection mass flow rate.Ó2014Elsevier Ltd.All rights reserved.1.IntroductionTurbomachinery has seen widespread use in the industry (Wu et al.[1],Gomes et al.[2]and so on);however,the tip clearances between rotor tips and the casing wall,which are necessary to prevent rubbing,result in an undesirable loss of ef ficiency,driven by the pressure difference between the blade pressure side (PS)and the suction side (SS).And,tip leakage flow is believed to be detri-mental to the performance of turbomachinery (Booth et al.[3]and Mohamed and Shaaban [4]).The work output of the rotor decreases because the leakage flow passes through the tip gap without being properly turned and expanded.Thus,tip leakage flow acts as an obstruction and leads to loss generation inside the rotor passage.Booth et al.stated that a tip gap of about 1%of the rotor span could cause a loss of 1e 3%on the stage ef ficiency.Moreover,another important consequence is the deterioration of the blade tip surface,due to regions of high local heat transfer in the narrow gap caused by flow separation and reattachment.Metzger and Rued [5]per-formed fundamental studies and showed that the generated tip leakage flow increases in the heat transfer of about 200%near thetip gap.Therefore,it is important to take measures to minimize the impact of tip leakage flow.In previous studies,several different methods were investigated to control the effects of the tip leakage flow.These methods are generally divided into passive control (no energy import)and active control (energy import)from the viewpoint of the energy.Most of the passive control methods reported involve modi fication of the tip surface geometry in an effort to decrease the leakage mass flow rate,including winglets (Zhou et al.[6]),squealer tips (Lee and Chae [7]),tip surface optimization (Maesschalck et al.[8]),casing treatments (Gao et al.[9])and so on.Of these methods reviewed only the cavity tip (double squealer tips)finds actual application in service.Double squealer rims offer the advantages of minimizing contact surface area and partly shielding cavity surface from ther-mal degradation.The other methods presented added cooling re-quirements that may not be easily addressed.Generally the active turbine clearance flow control can be ach-ieved by means of mechanical force,plasma actuator and tip in-jection.In order to reduce the blade tip clearance as far as possible,a first generation mechanically actuated active clearance control (ACC)system has been designed and fabricated (DeCastro and Melcher [10]).The system utilizes independent actuators,a segmented shroud structure,and a clearance measurement feed-back to provide fast and precise active clearance control throughout engine operation.In addition,the control of the tip leakage flow*Corresponding author.Tel.:þ8613895710245.E-mail addresses:gaojie_d@ ,gaojie_d@ (J.Gao).Contents lists available at ScienceDirectEnergyjournal ho me page:www.elsevier.co m/locate/energy/10.1016/j.energy.2014.03.0600360-5442/Ó2014Elsevier Ltd.All rights reserved.Energy 69(2014)648e 660using plasma actuators mounted to a turbine blade tip was inves-tigated in a linear cascade facility by Van Ness et al.[11].The active control results indicated that the actuators led to qualitative changes in the structure of downstream wake profiles;the tip leakageflow can lead to a significant increase in emission and specific fuel consumption in the high-pressure turbine.The tip injection has showed potential success for increasing the aerodynamic performance around the blade tip regions.Chen et al.[12]studied the aerodynamics of tip injection using a two-dimensional model.They concluded that when the coolant is ejected normal to the tip,it is able to block the leakageflow.Li et al.[13]carried out a numerical simulation of the effects of tip injec-tion.They suggested that the jet could obstruct the tip leakageflow and weaken the interaction between tip leakageflow and main passageflow,improving the turbine efficiency by0.41%when the clearance gap is small.Rao and Camci[14e16]conducted an experimental study of a turbine tip desensitization method based on tip injection in a large-scale rotating turbine rig,and took the effect of the injection mass flow rate and the injection location into consideration.It was found that tip injection could cause the tip leakage vortex to be reduced, and its associated losses decreased to the level observed for the case with half the tip gap height.And,the tip injection at81%blade axial chord was most successful in reducing the total pressure deficit in the leakage vortex.It was shown that such information would be useful in optimizing tip injection schemes.Niu and Zang [17e19]performed parametric investigations of tip injection in a high-turning axial turbine linear cascade,including injection circumferential angle and injection location in the blade thickness direction.The results showed that the nearer to the PS corner the injection holes are,and the smaller the injection circumferential angle is,the more tip injection can affect the tip leakageflow.Be-sides,injection chordwise location also plays an important role in the redistribution of the secondaryflow within the cascade pas-sage,and the holes located in the aft part of blade can perform much better than those in the front part.Yet,the effect of the relative blade-casing motion on theflowfield and heat transfer was not investigated here.Based on the above investigations,they[20] investigated the influence of tip injection at design and off-design incidences.It was found that even at off-design conditions,tip in-jection can still perform well in reducing the tip leakage massflow and its associated losses.However,the potential thermal benefits were not investigated in their research.The tip coolant injection has also been used to protect the blade tips from the high gas temperatures.Hohlfeld et al.[21]and Couch et al.[22]conducted experimental and computational in-vestigations on blowing from the dirt purge holes of aflat tip in a linear cascade.They stated that theflow ejected from the dirt purge holes is able to block the tip leakageflow.The obstruction effect by tip injection performed quite well for a small tip gap,but it was not effective for a large tip gap.It should be noted that,the main focus of their research was the thermal performance of the tip.Newton et al.[23]provided detailed measurements of heat transfer condition on the tip of a general cooled turbine blade,and reported that the injection at the location of separation bubble could result in a better cooling benefit.Kwak and Han[24]inves-tigated thefilm cooling of gas turbine blade tips in a linear cascade. Blade tip heat transfer coefficients were found to increase with the tip clearance height increasing.Thefilm cooling from radial holes along the camber line was shown to be more effective at larger clearances and at higher blowing ratios;however,the aerodynamic performance of tip cooling is unknown.Also,Acharya et al.[25] computationally simulated thefilm cooling of turbine blade tips. Thefilm cooling at three different tip clearances was simulated.The tip injection was found to alter the leakage vortex and also to decrease the heat transfer coefficient along the coolant trajectory;film-cooling effectiveness was found to increase slightly with the tip clearance size.Nowadays,some modern,unshrouded turbine blades have some sort of squealer tips.Mhetras et al.[26]investigated the ef-fects of tip injection on heat transfer conditions on a squealer tip. They stated that due to the combined effect of squealer tip and tip injection,significant improvements could be obtained on the cavity floor and inner rim walls,and a larger cavity depth or higher blowing ratios could give higher effectiveness on all tip surfaces, whereas the overall mixing of cooling air and hot leakageflow was rarely mentioned.Han et al.[27,28]investigated thefilm cooling of bothflat tip and cavity tip in a linear cascade.They found that the film cooling ejections on both plane tip and squealer tip dramati-cally affect theflow behaviors at the tip region,and the coolant injected from the holes on the blade PS produced an additional reduction in the blade tip heat transfer coefficient.Besides,the cooled cavity tip is superior to the cooledflat tip in terms of the thermal performance;however,this labyrinth andfilm cooling design can lead to a coolant accumulation in the squealer cavity.In order to allow the accumulated coolant in the cavity to escape,and meanwhile to cool the tip TE(the trailing edge),a piece of rim wall of PS squealer near the TE is cut.The literature mentioned above were focused either on the aerodynamic performance of the tip leakageflow with tip injection or on the thermal performance of cooled blade tips.Only few in-vestigations have been focused on the aero-thermal performance of the tip leakageflow with injection as well as the combined effect of cavity tip and tip injection.The objectives of this paper are to systematically investigate the physics and loss mechanisms of the tip leakageflow with tip injection;to assess the combined effect of cavity tip and tip injection;to compare the aero-thermal perfor-mance of the tip leakageflow offlat and cavity tips with injection and to examine the effects of tip clearance height and injection massflow rate.Numerical methods(similar methods have been successfully used for the study on a small scale horizontal axis wind turbine in Ref.[29])have been employed to make a comprehensive understanding of the aero-thermal performance of the tip leakage flow with injection onflat and cavity tips.2.Tip injection configurationsIn this investigation,results are presented for bothflat and cavity tips with and without injection.The design clearance is1.5%Fig.1.Schematic of blade tip geometry and mesh with injection holes.J.Gao et al./Energy69(2014)648e660649of blade span.Fig.1shows the blade tip geometry with injection holes.For the squealer tip,the depth of the cavity is2%of the blade span,and the width of the shoulder is0.77mm,which forms a narrow rim and a wide cavity.For all injection cases,there are four radial injection holes placed on each blade tip.The injection holes are assumed to be1mm in diameter and20mm in length,and are located at10%,30%,50%and70%blade axial chords.The blade geometry chosen for the investigation is taken from GE-E3first stage highly loaded turbine rotor as shown in Fig.2, which represents a modern gas turbine blade geometry.The rotor blades are twisted,and have a constant axial chord length of 28.7mm and an aspect ratio(span to chord)of1.39.The main blade geometry parameters are shown in Table1,and detailed blade geometry and operating conditions can be found in the NASA report(Timko[30]).3.Numerical techniquesThe numerical investigation presented in the paper was per-formed by using ANSYS CFX11.0(AEA[31]),an available general finite volume based Navier e Stokes solver.The solutions are ob-tained by solving the compressible Reynolds-Averaged Navier e Stokes equations using afinite volume method to discretize the equations.The overall accuracy is of the second order.A standard k e u two-equation model developed by Wilcox[32]is used in the investigation for turbulence closure,and no wall functions are used.The commercial structured grid generation package Autogrid5 (preprocessor to NUMECA)was used in the investigation.Fig.2 shows the representative computational grid of the rotor blade used.The channel was discretized into H-type grids,while the re-gions around the blade surface and the tip gap were discretized into O-type grids to ensure high grid quality.Also,details of the cavity tip mesh can be seen more closely as shown in Fig.1.The tip gap and the cavity were modeled with butterfly mesh topology.There are17nodes in the boundary layer to provide grid-independent results,and there are33cell layers distributed from the blade tip to the casing wall with23points across each squealer.Additionally, 27grid nodes per holes diameter had been ensured everywhere inside the injection holes,with33nodes in the hole length direc-tion.There are over100points from the leading edge(LE)toward the trailing edge(TE)along the blade chord.The average of the dimensionless distance,yþ(of the closest grid point from wall)on the wall is less than1,and the maximum yþon the wall is about3. In order to keep the grids for the cases considered in the investi-gation as similar as possible,the same grid topology is adopted for all the cases considered.The computational domain consisted of a single blade channel with periodic boundary conditions imposed along the circumfer-ential direction.At the inlet,which is placed at one axial chord length upstream of the rotor blade,absolute total pressure,absolute total temperature andflow angle are specified along with the tur-bulence intensity.At the exit,which is placed at a distance equal to two axial chord lengths downstream of the rotor blade,static pressure is specified.At the inlet of injection holes,injection mass flow rate and static temperature(350K)are also predefined.The isothermal wall condition(478.1K,a scaled experimental value)is imposed on the blade tip,and the other walls are assumed to be adiabatic.In addition,the no-slip condition is applied to all walls. Detailed boundary conditions are listed in Table1.Convergence criteria for these computations are based on the reduction of RMS residuals below1Â10À5.All results have been checked for convergence by using isentropic efficiency monitoring, and the solution was said to be converged when the isentropic efficiency was not changed more than0.01%during10successive iterations.Typically,500iterations were necessary for convergence.Grid independence is checked by comparing the solutions on a flat tip blade with injection obtained with1.3million nodes and the solutions obtained with1.6million nodes.From the distribution of the heat transfer coefficient on the blade tip,it is found that results from the simulation with 1.6million nodes are in reasonable agreement with that with1.3million nodes.Besides,there are few changes in the tip leakage loss when increasing the grid nodes from 1.3to1.6million.Thus,the total number of grid nodes for theflat tip with injection is1.6million in the investigation.Likewise,the total number of grid points for other cases ranges from1.4million to1.9Fig.2.3D computational grid and details of the LE,TE and tip grids.Table1Blade geometry andflow conditions.Parameters ValuesTip(outer)diameter732mmBlade number76Axial chord28.7mmInlet Mach number(relative)0.37Absolute total pressure ratio 2.25Absolute inlet angle from axial direction(hub)69degAbsolute inlet angle from axial direction(midspan)74.5degAbsolute inlet angle from axial direction(shroud)78.5degRotational speed8450r/minInlet turbulence intensity5%parison of heat transfer coefficient on the blade tip:(a)experimental result,and(b)predicted result.J.Gao et al./Energy69(2014)648e660650million cells,with the more complex tip geometry requiring more cells.In order to validate the ability of the standard k e u turbulence model to predict the blade tip leakage flow and heat transfer,a linear cascade studied by Azad et al.[33]was calculated.The cases is a no-injection flat tip blade with a 1.5%tip clearance and tur-bulence intensity Tu ¼6.1%.Since Azad ’s linear cascade data are often used for validation,only cascade heat transfer dataareFig.4.Streamlines near the blade tip (a)without and (b)with injection at a tip clearance of1.5%.Fig.5.Velocity magnitude contours near the blade tip (a)without and (b)withinjection.Fig.6.Entropy-increase contours near the blade tip (a)without and (b)with injection at 30%,50%,80%and 110%axial chords.J.Gao et al./Energy 69(2014)648e 660651presented here for the sake of brevity.Fig.3compares the measured and predicted heat transfer coefficient distributions on the blade tip without injection,and it should be noted that the uncertainty estimate in the heat transfer coefficient reported by Azad is7.9%.The regions of high heat transfer coefficient are located along the PS where theflow accelerates into the tip-gap region.The location and the size of the predicted“sweet spot”region,as well as the corresponding heat transfer coefficients are in excellent agreement with the measurements.In view of the experimental uncertainties,the measurements and predictions appear to exhibit quite reasonable agreement with each other,with the magnitude of the peak predicted heat transfer coefficient agreeing with the cor-responding measured value to within12%.Although there is no experimental data available to validate the present CFD results for the injection cases,as nowadays accepted in open literature,the use of a proper grid with a reliable turbulence modeling provides a modeling of satisfactory accuracy.4.Results and discussionAs a by-product of the presentflow and heat transfer compu-tations,it is possible to compute the isentropic efficiency and the possible effect of tip coolant injection on turbine efficiency. Despite40years development of gas turbine cooling technology, there is no general agreement on the most appropriate definition of cooled turbine efficiency;the critical issue is the choice of a hypothetical“ideal”process.Based on the review of the definitions in use,Young and Horlock[34]presented new proposals for overcoming the problems to compute the inlet total pressure and inlet total temperature after mixing.Thus,the isentropic efficiency can be calculated in terms of the natural turbine efficiency formula.The mixing process is defined to be adiabatic and the total temperature after mixing T0m can be calculated from the steady-flow energy equation,written for semi-perfect gases as,ð1ÀfÞZ T0mT01g c pgðT0Þd T0þXif iZ T0mT01c ic pcðT0Þd T0¼0(1)The total pressure after mixing p0w is given by,p0w 01g ¼Yip01c i01g!ðfiR C=RÞ(2)where f i¼m c i/(m gþPm c i),f¼P fi and the summation is over then coolant streams.c pg is specific heat related with the total tem-perature T0.R denotes the specific gas constant,and p0is the total pressure.The subscripts c i,g and m denote the i th coolant stream, mainstream gas and mixed conditions.Because the blade tip surface temperature was set at a constant temperature of478.1K,in order to recover adiabatic conditions,the mixed-out total temperature at the exit must be modified to reflect the loss of energy through heat transfer.The change in mass-averaged normalized total temperature at the exit of the blade row can be computed as follows,D T0;ex¼P ZAðm v T=v n j wÞd Am RePr(3)In the above equation m is dimensionless viscosity and n is the normalized distance to the wall;m is the normalized massflow rate through the blade passage and A is the surface area.The integration is performed over all of the heat transfer surfaces.Thus,the mass-averaged value of the exit total temperature is computed as,T0;ex¼T unmodifiedþD T0;ex(4) Also,the effect of non-adiabatic wall conditions must be taken into account in the calculation of entropy-increase D S.4.1.The physics and loss mechanisms of tip leakageflow with tip injectionFlow patterns over theflat tip with and without injection at a tip clearance of1.5%are shown in Fig.4.It shows that the coolant ejected from the injection holes reduces the overall tip leakageflow that enters the tip gap in two ways.Firstly,the coolant is injected normally into the tip gap and has little momentum in the direction of the tip leakageflow.The tip leakageflow that crosses the PS of the tip gap collides with the coolant over the tip gap.As shown in Fig.4(b),several streamlines suddenly change the direction in the tip gap,which is due to the collision with the leakageflow from upstream.This happens in a region where the leakageflow velocity is locally low as shown in Fig.5.Secondly,the coolant mixes with theflow across the tip gap downstream of the injection holes,and it slows the leakageflow.Also,Fig.4shows that several leakage streamlines turn upstream of the injection holes(called the “reverse leakageflow”)with the effect of the coolant.Additionally, it is found that with tip injection,the leakageflow is turned toward the SS edge of the blade,which can also be proven from Fig.5.Fig.5shows velocity magnitude contours on the blade tip sur-face with and without tip injection.In Fig.5(a),theflow accelera-tion in the tip-gap region can clearly be seen(except in the“sweet spot”LE region),and theflow decelerates as the leakageflow rolls up into a vortex along the SS.With tip injection as shown in Fig.5(b),due to the lower injection velocity,the tip-gap region is characterized by the accelerating leakageflow interspersed by lower velocity coolant streaks.The momentum exchange between the coolant and theflow that enters the tip gap is expected to block and deflect the tip leakageflow.Thus,it can be concluded that the coolant jets are turned toward the blade SS and appear to form a film on the tip surface.It should be noted that the injection results in the extra mixing losses,although it blocks the leakageflow.In order to judge the overall effect of tip injection on the tip leakage losses,entropy-increase contours near the blade tip with and without injection at0.20.40.60.81.01.21.4Efficiency-increaseLeakage-decreaseValue(%)Injectionmass flow rateparison of tip leakage-decrease and efficiency-increase between without and with tip injection forflat and cavity tips.J.Gao et al./Energy69(2014)648e660 65230%,50%,80%and 110%axial chords are shown in Fig.6.The injection flow signi ficantly alters the nature of the leakage vortex,and also alters the SS passage flow in the vicinity of the tip.With tip injection,the most noticeable phenomenon is the dramatic reduction of the tip leakage vortex in both its strength and size;the passage vortex is signi ficantly weakened due to the changed endwall flow fields.Overall,the turbine performance has been signi ficantly improved.Denton [35]indicated that,the leakage loss depends both on the proportional leakage flow and on the magnitude of the velocity difference between the leakage flow and the main flow with which it mixes.The coolant is injected normally into the tip gap,and then it mixes with the flow across the tip gap downstream of the in-jection holes.After exiting the tip gap,they mix with the main flow inside the blade passage,forming the tip leakage vortex.It can be concluded that,the tip leakage flow and the coolant have approx-imately the same magnitude of the velocity difference.Therefore,the overall effect of tip injection on the turbine performance de-pends on the relative magnitude of the injection mass flow and the reduction in the tip leakage mass flow.If the tip injection can reduce the flow which enters the tip gap from the PS by more than the injection mass flow rate,the turbine performance would be improved,and vice versa.The above analyses can also be proven from Fig.7.The tip leakage and injection mass flow rates are reported as percentage of total turbine mass flow.The leakage-decrease values were ob-tained by calculating the leakage difference between with and without tip injection;so did the ef ficiency-increase values.It is shown that,with tip injection,the tip leakage flow decreases dramatically,and the reduction in the tip leakage flow is larger than the injection mass flow rate.The results in the reduction in the mass flow that exits out of the tip gap from the SS,which increases the turbine ef ficiency obviously.In addition,the cavity tip with injection performs worse performance in controlling the tip leakage flow than the flat tip with injection.This means that there is a mutual coupling between the tip injection and the blade tip geometry.bined effects of cavity tip and tip injection on aero-thermal performance of tip leakage flowsFig.8shows the comparison of velocity vectors and Mach number distribution on flat and cavity tips with an injection mass flow rate of 0.4%.The cut plane passes through the center of the second hole from the LE,and it is parallel to the direction of thetipparison of velocity vectors and Mach number distribution on flat and cavity tips with injection mass flow rate of 0.4%at tip clearances of 1%and 2%:(a)without injection,1%,(b)with injection,1%,(c)without injection,2%,and (d)with injection,2%.J.Gao et al./Energy 69(2014)648e 660653leakage flow.As shown in Fig.8(a),for a flat tip the flow in the blade tip region is directed primarily from the PS to the SS,with the leakage flow rolling up into a vortex as it encounters the SS passage flow.For a cavity tip,the flow inside the cavity is quite complex andstrongly three-dimensional.The flow that enters the tip gap from the LE is directed toward the PS rim,and bounces off the rim surface toward the SS eventually exiting the gap near or past mid-chord,rolling up into a vortex that createsblockage.parison of heat transfer coef ficient distribution on flat and cavity tips at tip clearances of 1%and 2%:(a)without injection,1%,(b)with injection,1%,(c)without injection,2%,and (d)with injection,2%.x /hEntropy-increase (J/(kg·K))x /hEntropy-increase (J/(kg·K))Fig.10.Mass-averaged entropy-increase distribution along the span at rotor exit for flat and cavity tips:(a)1%and (b)2%tip clearances.J.Gao et al./Energy 69(2014)648e 660654As shown in Fig.8(b),for a flat tip with injection,the coolant is injected normally into the tip gap and counteracts with the tip leakage flow passing the tip region near the PS.This blocks the tip leakage mass flow and leads to low momentum activity between the injection holes and the SS corner.At the same time,coolant jets are turned toward the SS of the tip gap.For a cavity tip with in-jection,the coolant first mixes with the flow in the cavity,then it enters the tip gap,and finally it exits the tip gap along the SS squealer of the cavity tip.Thus,it can be concluded that due to the collision of the coolant and the flow that enters the tip gap from the PS,the momentum exchange is smaller than that in the case of the cooled flat tip.Besides,it can be seen that,over the PS inlet of the tip gap,the colors indicate that when coolant is used,the velocity magnitude is lower than that in the uncooled case.This shows that the leakage flow across the tip PS is partially blocked by the coolant injection.At the tip SS,the velocity magnitude is also low in regions where the coolant exits the tip gap.With the effect of tip clearance heights,it is shown that,for the small tip clearances,the coolant from the injection holes fills the tip gap.For the large tip clearances,however,there is physically enough space for the jets to impinge on the outer shroud and then reattach to the blade tip.This means that,with the same injection mass flow rate,the coolant creates a proportionally larger blockage at the smaller tip clearances.Also,Hohlfeld et al.[21]and Couch et al.[22]found that the blockage effect of the coolant is more evident at the smaller tip clearances.The comparison of the heat transfer coef ficient distribution on flat and cavity tips with an injection mass flow rate of 0.4%is shown in Fig.9.It can be seen that without tip injection,the high heat transfer coef ficient occurs near the LE,where the passage flow is driven into the tip gap by higher pressure near the stagnation point of the blade.For the cavity tip,the separation vortex has the characteristics of separation and reattachment,occupying about half of the cavity region.The point of reattachment corresponds to high heat transfer coef ficients on the cavity floor.When the coolant is injected from the blade tip surface,the heat transfer coef ficient along the coolant trajectory decreases signi ficantly.Particularly for the cavity tip,the heat transfer coef ficient is lower due to coolant accumulation inside the tip cavity.However,as the tip clearance increases,the lateral spreading of the coolant jets becomes small,caused by the increased peak velocities in the leakage flow path.Additionally,for the flat tip,high heat transfer coef ficients still occur near the LE,where no injection holes are located.However,for the cavity tip,the heat transfer coef ficient near the TE of the blade tip is reduced obviously due to coolant accumulation from upstream holes in the tip cavity.This recon firmed that the leakage flow is turned toward the blade SS edge,which reduces the magnitude of the velocity difference between the leakage flow and the main flow,and then the tip leakage losses.It can also be seen that the effect of coolant injection on heat transfer coef ficients is relatively large for the small tip gaps (s /h ¼1%),with a reduced effect on the large tip gaps (s /h ¼2%).This is because,for the small clearance gap case,the amount of leakage flow is small,and the coolant injection has relatively large effect on heat transfer coef ficients.However,for the large clearance gap case,because the amount of leakage flow is large,the effect of coolant injection on heat transfer coef ficients is less important.The dominating secondary flow phenomena in the rotor passage are the tip leakage vortex and the passage vortex,and there ism L (%)τ/h (%)ξ(%)τ/h (%)ξm i x i n g (%)τ/h (%)ηi s (%)τ/h (%)Fig.11.Effects of tip clearance on (a)tip leakage flow rate,(b)losses inside the tip gap,(c)caused by the mixing when the leakage flow leaves the tip gap,and (d)isentropic ef ficiency for flat and cavity tips with and without injection.J.Gao et al./Energy 69(2014)648e 660655。
径流涡轮叶尖间隙对叶片振动的影响研究
Computational fluid dynamics Excitation order Finite element analysis Fast-Fourier-Transform Fluid-structure interaction High cycle fatigue Pressure ratio Pressure surface Passage vortex Root mean square Suction surface Shear-stress transport model Tip leakage vortex Unsteady Reynolds averaged NavierStokes equations
*Fund Program: National Natural St No. 51606121).
· 46 ·
第 63 卷,2021 年第 3 期 Vol.63,2021,No.3
Lei Pan1 Ming-yang Yang1 Shouta Murae2 Wataru Sato2 Naoto Shimohara2 Akihiro Yamagata2
(1. Shanghai Jiao Tong University; China,2. IHI Corporation, Japan)
Abstract:With the increasing demand of turbochargers with high performance and low turbo lag, high cycle fatigue (HCF) of radial turbine blades has become the most common form of turbocharger failure. Tip clearance is the key to influencing the strength and evolution of tip leakage vortex which plays an important role in HCF due to the impact on aerodynamic excitation. This paper studies the influence of tip clearance on blade excitation of a vaneless radial turbine. One-way fluid-structure interaction numerical method is employed in this research, which is validated by experimental data. The results suggest that a‘V-shape’correlation exists between vibration amplitude and tip clearance. Generalized energy analysis indicates that complex distributions of harmonic pressure amplitude on the blade determine the‘Vshape’correlation. Flow field analysis further suggests that distributions of harmonic pressure amplitude on pressure surface and suction surface are both dominated by tip leakage vortex, whereas the mechanisms are quite different. Keywords:Tip Clearance; Aerodynamic Excitation; Vaneless Radial Turbine; High Cycle Fatigue
翻译
Hindawi Publishing CorporationInternational Journal of Rotating MachineryVolume2008,Article ID109120,10pagesdoi:10.1155/2008/109120Research ArticleExperimental Investigation of Innovative Internal Trailing Edge Cooling Configurations with Pentagonal Arrangement and Elliptic Pin FinL.Tarchi,1B.Facchini,1and S.Zecchi21Dipartimento di Energetica“Sergio Stecco”,Universit`a di Firenze,Via S.Marta3,50139Firenze,Italy2A VIO S.P.A,Via I Maggio99,10040Rivalta di Torino,ItalyCorrespondence should be addressed to L.Tarchi,lorenzo.tarchi@htc.de.unifi.itReceived6March2008;Accepted6August2008Recommended by Ken-Ichi FunazakiThis paper describes a heat transfer experimental study of four different internal trailing edge cooling configurations based on pinfin schemes.The aim of the study is the comparison between innovative configurations and standard ones.So,a circular pinfin configuration with an innovative pentagonal scheme is compared to a standard staggered scheme,while two elliptic pinfin configurations are compared to each other turning the ellipse from the streamwise to the spanwise direction.For each configuration,heat transfer and pressure loss measurements were made keeping the Mach numberfixed at0.3and varying the Reynolds number from9000to27000.In order to investigate the overall behavior of both endwall and pedestals,heat transfer measurements are performed using a combined transient technique.Over the endwall surface,the classic transient technique with thermochromic liquid crystals allows the measurement of a detailed heat transfer coefficient(HTC)map.Pinfins are made of high thermal conductivity material,and an inverse data reduction method based on afinite element code allows to evaluate the mean HTC of each pinfin.Results show that the pentagonal arrangement generates a nonuniform HTC distribution over the endwall surface,while,in terms of average values,it is equivalent to the staggered configuration.On the contrary,the HTC map of the two elliptic configurations is similar,but the spanwise arrangement generates higher heat transfer coefficients and pressure losses.Copyright©2008L.Tarchi et al.This is an open access article distributed under the Creative Commons Attribution License,which permits unrestricted use,distribution,and reproduction in any medium,provided the original work is properly cited.1.INTRODUCTIONThe trailing edge is one of the most critical parts of gas turbine blades and vanes since it is exposed to very high thermal loads.A very efficient cooling system is,therefore, required so as to keep metal temperature below critical values.Inline and staggered arrays of short cylindrical pin fins are one of the most common types of cooling devices used in turbine blades.Such arrays enhance the heat transfer levels mainly increasing the heat transfer coefficient and,for H/D>0.5,the wet surface.Being easier to manufacture, pinfins with circular cross-sections are the most used and investigated.Thefirst experimental investigations on circular pinfins were carried out by[1–3].They measured row by row heat transfer coefficients and pressure losses for inline and staggered configurations.Reference[4]investigated the influence of acceleratingflow in a wedge-shaped duct on heat transfer.Their results showed thatflow acceleration decreases the influence of Reynolds number on Nusselt number.By means of the transient TLC technique,[5,6] studied the effects of thefillet radii on the endwall heat transfer,while[7–9]studied the effects of turningflow in a wedge-shaped duct with circular,elliptical,and diamond cross-section pinfins.It has been demonstrated by various authors[23,24]that cylinders with streamline-shaped cross-section have much lessflow resistance than circular ones, while they have about the same behavior in terms of heat transfer.The work in[10]also investigated the partial length circular pinfin concept and found that both the array averaged-heat transfer and friction factor decrease with increasing gap distance.Even if streamwise-oriented elliptic pinfins show an overall better behavior than other shapes,devices with a non-aerodynamic shape are employed in gas turbine airfoils too.In modern multipass cooling systems,the airflow approaches the trailing edge region from the hub or from2International Journal of RotatingMachineryFigure 1:Experimental setup.the tip of the airfoil;hence,the implementation of cooling devices with low pressure losses could lead to nonuniform coolant distribution in the radial direction and then to higher di fferences in airfoil temperature.That is the reason why cooling devices with high pressure losses have been implemented and investigated.Reference [8]studied the e ffects of diamond pin fins and turning flow on heat transfer.Pin fins with oblong cross-section were investigated by [11]for various pin orientations with respect to the main flow.Their results indicate that the use of elongated pin fins (oblong shape)increases endwall heat transfer and also causes higher levels of aerodynamic penalty than the circular pin fins when the main flow direction deviates from the direction of the major axis of the oblong pin fin.When the main flow approaches zero incidence,the pressure loss levels become lower than circular pin fins ones.In the present paper,the di fferences between streamwise-and spanwise-oriented elliptic cross-section pin fins are investigated.Pin fins are inserted in a wedge-shaped duct in order to replicate a typical trailing edge cooling system.Then,two geometries with circular cross-section are investigated:one is a standard staggered array,while the other consists of an innovative array based on a pentagonal scheme.As already mentioned,in modern cooling systems,the flow does not approach the pin fin array in the axial direction,but in a mixed axial-radial direction.In this case,a staggered pin fin array works as an in line configuration,leading to lower heat transfer capability.Hence,the idea is to develop an innovative array insensitive to the mainstream direction.The aim of this paper is then the comparison in terms of heat transfer and pressure losses between the standard staggered array and the innovative pentagonal scheme,with a mainstream flow oriented in the axial direction.An experimental survey with mixed axial-radial flow is planned as well.About the experimental techniques,in the pioneering works of [1,3],an average HTC row by row value was evaluated employing copper test articles and a steady-state technique.Afterwards,[12,13]used the naphthalene sublimation method,based on heat-mass transfer analogy,to investigate the separate contribution of endwall and pin fin.The work in [5,6]performed detailed heat transfer measurements on the endwall surface of pedestals array with TLC transient technique.With the same experimental method,[7,9,14]evaluated heat transfer and pressurelosses in trailing edge cooling geometries typical of real blades:wedge and trapezoidal ducts,pin shape,and lateral flow e ffects were tely,[15],besides the endwall HTC measurements with TLC,evaluated the pin fin contribution to heat transfer using high conductivity pedestals and an inverse data reduction method based on a finite element simulation of the transient test.Results shown that pin fins have higher HTC than the surrounding endwall surface.On the contrary,[16],using the so-called “lumped heat capacity method”to estimate the pin fin contribution,measured lower heat transfer values over the pin fin surface.2.EXPERIMENTS 2.1.Test facilityThe experimental survey was performed at the Dipartimento di Energetica of the University of Florence.The final aim of this activity is the measurement of the HTC over the whole internal surfaces of four di fferent geometries using a transient technique.The test rig (Figure 1)consists of a suction-type circuit that allows complete control of the air stream in terms of both temperature and mass flow rate.The mainstream air passes through a 9.0kW electronically controlled electric heater;then,the flow rate is measured by an orifice.A three-way valve,with pneumatic actuator,assures the sample at room temperature,as required by transient technique,while the other components of the test rig are warming up.Two rotary vane vacuum pumps,powered by two 7.5kW electric motors,blow air outside and provide the suction for a maximum mass flow rate of 0.10kg /s.The flow rate is set up by guiding the motor speed between 300rpm and 1300rpm and by throttling the remote-controlled-motorized valve;the air temperature exiting the heater is controlled by means of a four-wire RTD (Pt100).Two pressure scanners Scanivalve DSA 3017with temperature-compensated piezoresistive relative pressure sensors allow us to measure the total or static pressure in 32di fferent locations with an accuracy of 6.9Pa.Several T-type thermocouples connected to a data acquisition/switch unit (HP-Agilent 34970A)measure the mainstream temperature and the alu-minum pin fin temperature.A digital three-charge-coupled-device (3CCD)camcorder (Canon XM-2)records a sequence of color bitmap images (720×576pixel,25frames/s)from the thermochromic liquid crystal-(TLC-)painted surface on a PC (IEEE-1394standard).The illuminating system (Shott-Fostec KL1500LCD)uses an optical fiber ring light to ensure a uniform illumination on the test surface,and it allows us to keep both color temperature and light power constant.In order to reduce any undesired polymethyl methacrylate (PMMA)reflections,two polarized lens filters are fitted on both ring light and camcorder lenses.TLCs are the devices used to evaluate surface temperature and,consequently,the heat transfer coe fficient.For our purpose,we used the 40C5W formulation of Hallcrest active from 40◦C to 45◦C.Crystals are thinned with water and sprayed with an airbrush on the test surface,then a black background paintL.Tarchi et al.32.12.2L0L1L2TCPTFigure2:Streamwise and spanwise staggered elliptical pinfin configurations.is applied.TLCs have been calibrated,replicating the same optic conditions of the real test:the peak value of the green intensity was found at42.3◦C,so it has been used in the data reduction procedure.2.2.GeometriesFour different pinfin configurations are investigated in this paper.In Figure2,a sketch of the two elliptic configurations is shown.In thefirst one(G2.1),the major axis of the ellipse is oriented in the airflow direction(i.e.,streamwise), while in the other configuration(G2.2),the ellipse is rotated 90degrees,so in spanwise direction.Both the arrays arefitted in a10-degree wedge-shaped duct(L1region),replicating the typical trailing edge shape.Ahead of that region,the test article starts with a settling chamber,a grid,and then a smooth constant height duct(L0region).L1region is 200mm wide and5S x=72.75mm long.Height varies from H L0=19.65mm to H L2=H=6.72mm.Each pinfin row is composed of12or11pinfins with diameter D= H.Spanwise pitch is S/D=2.5and the array is made byequilateral triangles,so S x/D=2.17.The L2region consistsof a constant height duct with a single row of circular pin fin withfillet radius r=H/2and the minimum diameter being equal to the L1pins diameter.Thefillet radius was introduced because it represents with more accuracy a typical configuration used in the outlet of trailing edge cooling systems of high-pressure stages.The two other configurations are composed by circular pinfins(Figure3).The geometry G2.5consists of7rows of staggered pinfins with diameter D=H=5.6mm,spanwise pitch S/D=2.3and streamwise pitch S x/D=1.86.Endwall dimensions are the same of the elliptic geometries while the height is different(H L0=18.51mm−H L2=H=5.6mm). Each row presents15pins,thus over the whole L1region,2.52.6TCPTFigure3:Circular pinfin geometries with staggered(G2.5)and pentagonal arrangement(G2.6).there are105pedestals.In the G2.6configuration,there are 106pinfins arranged in a pentagonal scheme.The design of such innovative geometry starts from the idea to develop a repeatable pinfin array capable of good heat transfer performance in presence of mixed axial-radial coolantflows as well.As a matter of fact,the standard staggered array works very well once the airflow is orthogonal to the array, while in presence of inclined airflow,the array works as an inline configuration,and cooling performance decreases. Results reported in this paper intend to verify the behavior of the pentagonal scheme considering an axial coolantflow in comparison with the standard staggered scheme,keeping practically constant the overall pinfin density ratio(105or 106pinfins over the L1region).In the L2region,there are no pinfins because G2.5and G2.6configurations represent a real cooling system where along the L2region a cutback is present.As required by the transient technique,models are made of transparent PMMA,and the TLC were applied over the whole endwall from L0to L2.On the contrary,pinfins are made of aluminum and their temperature was measured with a small thermocouple inside one pin for each row. Air temperature is also measured at the inlet with two miniaturized thermocouples that allow a fast response for the transient test.The inlet temperature profile was verified dur-ing the commissioning of the test article and it is uniform in4International Journal of Rotating Machinery the whole test section.As regarding pressure measurements,static pressure is measured in various sections from L0toL2.In Figures2and3,the position of thermocouples andpressure taps for each model is depicted with white and blackcircles(G2.1instrumentation is exactly in the same positionof G2.2geometry).2.3.Experimental procedureHeat transfer tests were performed using a combinedtransient technique that allows the measurement of HTC onboth endwall and pinfin surfaces with a single transient test.During the warm up of the rig,the test model is kept atconstant temperature.When air temperature reaches about70–80◦C in the bypass circuit,the3-way valve is switchedmaking the air passing through the test model;automaticallyair temperature,aluminum pinfin temperature,and airpressure values are recorded and the camcorder startsacquiring frames of the TLC-coated surface.The transienttest isfinished when the liquid crystal reaches the blue colorover the whole surface.Pressure losses are evaluated with a cold test.3.DATA REDUCTION3.1.Reynolds and Nusselt numbers definitionReynolds and Nusselt numbers for data reduction are definedin two different ways:thefirst is based on the inlet section(L0)hydraulic diameter,the second on the pinfin diameterD.In both the elliptic configurations,the minor axis lengthis used as reference diameter:Re L0=˙mD L0A L0μ,Nu L0=hD L0k,(1)Re d=˙mDmin,Nu d=hD.(2)D L0is the hydraulic diameter of the inlet duct with cross-section area A L0;μand k are evaluated at the total temper-ature measured in the L0region;and A min is the minimum passage area between two pins and it is variable row by row. In order to compare directly the two elliptic configurations, the minimum passage area of the streamwise configuration (G2.1)is used in the data reduction of the spanwise(G2.2) too.Similarly,the pentagonal geometry(G2.6)results were postprocessed using the minimum passage area of the staggered configuration(G2.5).The overall average HTC h is defined as follows:h=Ni=1h EW i·A EW i+h PIN i·A PIN iEW i PIN i,(3)where A EW takes into account the lower and the upper endwall surfaces.In the definition of the row by row Nusselt number(2),the average HTC is based on single-row data.3.2.Heat transfer coefficient evaluationDetailed heat transfer coefficient distribution on the endwall surface is obtained assuming one-dimensional conduction over a semi-infinite solid[17,18].The“series of steps”method[19]is used to take into account the air temperature time history.Because of the high heat transfer coefficients achieved during the test and the quite high wet surface,the main-stream temperature decreases between the inlet and the outlet section is not negligible;thus the use of the inlet temperature measured in L0as reference temperature leads to underestimate the HTC.Solving such a problem makes necessary to take into account the variation of the local bulk mean temperature in time and space.Reference[20]evaluate four different approaches and their theoretical background for determining the local bulk mean temperature and the sensible local heat transfer coefficient.These authors assert that the invariant local heatflux method is the best choice as it produces very accurate results,with a very little processing time and implementation effort;so,such method was applied in the data reduction procedure.Pinfin heat transfer coefficients are evaluated by means of an inverse data reduction method.Such method is based on a full3D transient FEM simulation of the experiment and an iterative procedure.The HTC of each pinfin is updated using the Newton convergence criterion,iterating until the temperature history evaluated with the FEM code matches the measured temperature history inside each pin.A more-detailed description of this procedure was reported by[15].3.3.Pressure drops evaluationPressure drops were measured across the duct in adiabatic conditions(mainstreamflow at ambient temperature).Static pressure was measured in various points,starting from the inlet,until the end of the L2region(Figures2and3). The pressure values at the end of each region were used to evaluate the friction factor defined asf=Δp0(1/2)ρv2,(4)whereΔp0is the total pressure difference between the beginning and the end of the L1region;the total pressure is calculated summing up the dynamic pressure to the average static pressure of each section.ρand v are average values measured in the L0region.3.4.Experimental uncertaintyThe uncertainty analysis was performed following the stan-dard PTC19.1[21]based on the Kline and McClintock method[22].Typical uncertainties of the most important parameters are HTC=12.2%,Re=2.8%,f= 5.4%.More details about the individual contributions to the uncertainties of the single parameters for each of the measured physical properties are reported by[15].4.RESULTS4.1.Elliptic pinfin configurationsFor each configuration,five tests were performed at different Reynolds numbers(9000<Re d5<27000),keeping constantL.Tarchi et al.510.50−0.5−1x /S y−x/S x50100150200250300350400(a)10.50−0.5−1x /S y−x/S x50100150200250300350400(b)Figure 4:HTC [W /m 2K]map of elliptic configurations—Re d 5=18000.Figure 5:Surface flow visualization of G 2.2.the Mach number at 0.3.Both Ma and Re d are evaluated in the minimum passage area between two pins of the fifth row (i.e.,in the throat section).Figure 4shows a detailed map of the heat transfer coe fficient of the two elliptic configurations at Re d 5=18000.The colors inside the pins correspond to the average HTC measured over the pin fin surface with the inverse data reduction.As the local HTC peak values show,a stagnation area is present in both configurations ahead of each pin fin,while the recirculation zone presents slight di fferences especially in the first row:in G 2.1,the recirculation area is small and does not lead to a large increase of HTC,whereas,in G 2.2,the larger recirculation generated by the wake of the first pin enhances the heat transfer.For a deeper insight into the surface flow structure,a surface flow visualization of this configuration was done using the oil and dye technique.The endwall flow pattern in Figure 5shows a large stagnation region ahead of the first pin,with the saddle point located at 1D upstream the pin.The two counter-rotating vortexes in the recirculation downstream the first pin cover a quite large area and they spread up to second row,interacting with the stagnation region of such row that is not present on the endwall.As from the following rows,the flow pattern becomes moreperiodic,501001000H T C (W /m 2K )−10123456x/S xEWPinG 2.1G 2.2Figure 6:Endwall spanwise averaged and pin fin HTC—Re d 5=18000.the recirculation is smaller,and the saddle point is always located at about D/2upstream the pin leading edge.Figure 6reports the spanwise-averaged values of HTC together with the pin fin surface average values.First of all,it is evident how the spanwise-oriented pin fins (G 2.2)generate a more turbulent flow and then higher heat transfer rates over the whole endwall.Moreover,the increase in streamwise direction due to the combined e ffect of pin fin and convergence is clearly visible for both configurations in the L 1region (0<x/S x <5),while endwall values are quite constant over the L 2region (x/S x >5).About this region,we have to point out that HTC values are very similar for both configuration,showing that the high turbulence generated by the streamwise pin fins quickly vanishes.A final important issue to be discussed concerns with the di fferent contribution to heat transfer of pin fins and endwall.Looking at Figures 4and 6,it is noticeable that pin fin HTC is always higher than the surrounding endwall one,and always very close to the peak value located upstream each pin.For the first row pin fin,HTC are about twice than the endwall ones;according to the authors,this trend can be explained thinking over the flow field of such region.Only a portion of the endwall is covered by the horseshoe vortex generated by the pin,while between the pins,specially in the streamwise configuration (G 2.1),there are some areas with the same HTC of the upstream flow.On the contrary,the pin fin surface is fully covered by flow structures with high heat transfer:a stagnation region over the leading edge and a recirculation over the back side.In the following rows,the di fferences between pin fin HTC and endwall is slightly lower as the first are 50–90%higher than the latter.This behavior was reported by various researchers that investigated the separate contribution to heat transfer of pin fin and endwall.Reference [3]reported that,for a staggered array,the HTC on the pin surface is 35%higher than the endwall values.Reference [11]found that the ratio h PIN /h EW varies from 1.8to 2.1,depending on steamwise pitch (S x ).Reference [13],using the naphthalane sublimation technique,measured that HTC over the pin fin surfece is 10–20%higher than the endwall values.Finally,[15],using the same combined data6International Journal of RotatingMachinery1020406080100200N u dRe dPin 1Pin 2Pin 3Pin 4Pin 5Pin 6G 2.1G 2.2Metzger (10rows average)Figure 7:Row by row heat transfer data.10204060801002004006008001000N u L 090135180225270315360×102Re L 0L0L1L2Configuration G 2.1G 2.2Figure 8:G 2.1and G 2.2data—Nu L 0versus Re L 0.reduction method reported in this paper,showed that the pin HTC is always higher than the endwall.Recently,[16],using a “lumped heat capacity method”for the pin fins,reported an inverse result;they mesured a higher HTC over the endwall by about 3–40%than that on the corresponding pin fin of the same row.Figures 7and 8present all the experimental data in the two di fferent definitions of Reynolds and Nusselt number reported in (1)and (2).The general trend of the experimental data confirms the results of the already discussed Re d 5=18000test,so the spanwise configuration (G 2.2)reveals higher heat transfer values at the same mass flow rate.Moreover,data scatteringof such configuration is higher;such behavior is mainly due to the steep increase of heat transfer capability between the first and the third rows ,while values are quite constant between the third and the fifth rows.Such trend is present in the G 2.1configuration too,even if it is hardly visible.Reference [4]in a 10row-staggered pin fin configuration with constant height found that the average heat transfer increases up to the 4th-5th row,then decreases up to the 10th row.In the present results,the general trend is the same measured by [4],but taking also into account the row by row increasing Re d ,the local maximum is reached at the 3rd row and is much more enhanced in the spanwise-oriented geometry.L 2region values (PIN 6)of both configurations are in line with the G 2.1data,showing that the very high turbulence levels generated by the spanwise-oriented elliptic fins decrease very quickly without a ffecting the heat transfer behavior of the L 2region.The comparison with the correlation proposed by [4](Figure 7)for a 10-row-staggered array with 1.5<S x /D <5.0,S/D <2.5and H/D =1.0shows the e ffect of the elliptic pin fins on heat transfer.This correlation showed also a good agreement with a circular pin fin array inserted in a wedge-shape duct similar to the present work [15].Looking at the graph,it is clearly visible that the streamwise-oriented pin fins experience lower heat transfer coe fficients than the circular ones.Such result,as also described by other authors [23,24],is mainly due to the di fferent wake behavior of the two devices:while circular pin fins produce a wake with two large counter-rotating vortexes,for the elliptic pin fin configurations,such vortexes usually are not present.Hence,streamwise elliptic pin fins produce less turbulence and then lower HTC values.On the contrary,in the spanwise-oriented configuration,the wakes cover a large part of the endwall surface (see Figure 5),and then the heat transfer is highly enhanced.In order to have a general overview about the cooling performance of the two elliptic geometries,Figure 8shows the experimental data of the whole L 1region,together with L 0and L 2values.As expected,the entrance region (L 0)is not a ffected by the pin fin orientation,while in the L 1region,the higher Nusselt number values of the spanwise configuration are evident.As already highlighted in the row by row data reduction (Figure 7),in the constant height region (L 2)with circular filleted pin fins,the elliptic pin orientation does not have a large e ffect on the heat transfer behavior.4.2.Staggered and pentagonal scheme configurationsFor each configuration,five tests were performed at di fferent Reynolds numbers (9000<Re d 7<27000),once again keeping the Mach number at 0.3.Both Ma and Re d evaluated in the minimum passage are between two pins of the seventh row (i.e.,in the throat section).Figure 9depicts a detailed map of the heat transfer coe fficient of the standard staggered configuration and of the innovative configuration with pentagonal arrangement at Re d 7=18000.The colors inside the pins correspond to the average HTC measuredL.Tarchi et al.710.50−0.5−1x /S yx/S x0100200300400500(a)1.510.50−0.5−1−1.5x /S y(b)Figure 9:G 2.5and G 2.6endwall HTC [W /m 2K]map—Re d 7=18000.Figure 10:Surface flow visualization of G 2.6.over the pin fin surface with the inverse data reduction,in the G 2.6geometry,such measurement was performed in only 8of the 29pins that make up a repeatable array.The two HTC maps in Figure 9clearly show the di fferent flowfield induced by the di fferent pin fin arrangements .As expected,the HTC distribution is symmetric in the staggered configuration (G2.5),a stagnation region is present in front of each pin fin and the spanwise averaged HTC increases row by row.The pentagonal configuration shows a nonuniform development of the HTC map,actually there are noticeable di fferences in the spanwise direction.Due to pin fin distribution,in some areas they work as an inline array,while in other areas as staggered.For instance,for y/S y =0.9−1,there are no pin fins over the endwall and then the HTC are lower.On the contrary,for −1<y/S y <0,pin fins arrangement is similar to a staggered configuration and then heat transfer in that area ishigher.501001000H T C (W /m 2K )x/S xEWPinG 2.5G 2.6Figure 11:G 2.5and G 2.6endwall spanwise averaged and pin fin HTC—Re d 7=18000.The surface flow visualization in Figure 10confirms the nonuniform flowfield.Anyway,the stagnation point and the recirculation ahead and behind each pin are almost always in line with the mainstream direction,while when two pin are in line,they are not clearly distinguishable.In this visualization,the low HTC area present at y/S y =0.9−1is depicted by a single streamline that runs along the streamwise direction.The spanwise-averaged endwall HTC values presented in Figure 11show the heat transfer enhancement in the streamwise direction of both configurations.In the staggered array (G 2.5),the stagnation ahead each pin fin row is visible,while for the pentagonal arrangement,it is noticeable only for x/S x =0.4where there are three aligned pin fins.Finally,looking at the spanwise-averaged endwall values,the G 2.6configuration always shows higher HTC values,especially for x/S x >5.On the other hand,the pin fin HTC values are always slightly higher in the staggered configuration (G 2.5),with the consequence that the overall heat transfer performance of both geometries is the same (Figure 12).As for the elliptic configurations,in Figure 12,the overall Nusselt number of the L 1region of both configurations is compared to the L 0values.The entrance region values are,as expected,the same for both configurations,while it is surprising that the two pin fin arrangements generate an equal heat transfer enhancement too.Some interesting considerations can be drawn looking at the row by row Nusselt values of the staggered configuration reported in Figure 13(having a nonuniform arrangement,the definition of row by row values is not possible for the pentagonal array).Due to the higher number of rows,the aforesaid behavior for the spanwise elliptic geometry G 2.2is now more evident.The heat transfer capability of each row increases quickly up to the third row,then it is quite constant up to the fifth,increasing once again in the last two rows.Finally,the comparison with the correlation proposed by [4]for a constant height duct shows a general good agreement even if the flow acceleration due to the wedge-shaped duct leads to a lower dependence on the Reynold number,as was already reported once again by [4].。
Damages of wind turbine blade trailing edge Forms, location, and root causes
Damages of wind turbine blade trailing edge:Forms,location,and rootcausesSabbah Ataya ⇑,Mohamed M.Z.AhmedDepartment of Metallurgical and Materials Engineering,Faculty of Petroleum and Mining Engineering,Suez University,Salah Nasim Street,Suez 43721,Egypt a r t i c l e i n f o Article history:Available online 7June 2013Keywords:Wind turbine blades Trailing edge Damages Cracks Fiberglass reinforced polymer (FGRP)a b s t r a c tThe geometrical form and the manufacturing technique make the trailing edge of the windturbine blade more susceptible to damage.In this study the trailing edge in a number of81blades of 100kW wind turbines and 18blades of 300kW wind turbines of workinglife ranging between 6.5Â107and 1.1Â108cycles were completely visually scanned.The different damages were classified and allocated in their exact position relative to theblade length.Cracks in different orientations with the blade length were the frequent typesof damages which found on the trailing edge.First,longitudinal cracks (LCs)that foundalong the blade trailing edge from the blade root to the tip were in lengths that varied froma few centimeters up to around 1.35m.Second,transverse cracks (TCs)were found ineither simple TCs which growing on one shell at the trailing edge or round TCs which grow-ing across the two shells.TCs lengths were ranging from 20to 50mm.Third,edge damageswere detected in the form of edge cuts or crushing.The possible root causes of the differenttypes of cracks have been discussed.Ó2013Elsevier Ltd.All rights reserved.1.IntroductionTrailing edge of the wind turbine blade is the region of the two half shell bonding which include a long line of adhesive joints.The trailing edge is subjected to changeable complex state of stress through the cycle,while the adhesive joining material at this edge can be subjected to shear stresses.Although,the designed fatigue life of the wind turbine blade should be 20years [1].Failure of wind turbines due to failure of the blades represents 19.4%of a total of 1028wind turbine failure cases [2]and the main failure root cause are mostly due to the operation and environmental conditions.There are no available much data about the various forms of damages in the trailing edge of the wind turbine blades.Thus the aim of the current work was to present the most frequent forms of damages of the wind turbine blade trailing edge and the locations of their occurrence.This has been carried out through the full visual scanning inspection of a considerable num-ber of wind turbine blades,those were working at the boundaries of their proposed life.2.Inspection procedureIn this study 18blades of 300KW wind turbines and 81blades of 100KW wind turbines were full visually inspected (VT).The blade lengths are 9.5m and 14.2m for the 100KW and 300KW power,respectively.Before the visual inspection of the wind turbine blades,the blades have been washed and cleaned thoroughly.The VT inspection is started by giving a designation name for the blade under investigation followed by attaching a scale tape to the blade side under inspection 1350-6307/$-see front matter Ó2013Elsevier Ltd.All rights reserved./10.1016/j.engfailanal.2013.05.011⇑Corresponding author.Tel.:+20(0)1222467606;fax:+20(0)623360268.E-mail addresses:sabbah.ataya@.eg (S.Ataya),mohamed.zaky@.eg (M.M.Z.Ahmed).S.Ataya,M.M.Z.Ahmed/Engineering Failure Analysis35(2013)480–488481 to determine the location of any discontinuity or damage.The inspection was carried out thoroughly from the tip up to the root hub on the trailing edge of the blade.The different discontinuities on the blade were documented using a high resolu-tion digital camera.3.Results and discussion3.1.Estimation of the actual working lifeThe inspected wind turbines were installed in different dates,so that their lives were ranging between17and22years. The actual working life(in cycles)of each wind turbine was calculated based on the operational data using Eq.(1): Actual working life¼RPMÂAgeðMinutesÞÂCapacity factorð1Þwhere,RPM is the average number of cycles per minutes of each turbine model,the age is based on the date of start working date after installation of each turbine and the capacity factor describes the net time fraction of working excluding the times when the wind speed is under the cut-in speed.The availability factor of these turbines is ranging between0.95and0.98. The capacity factor is0.22and0.25and the RPM is33and38for the100kW and300kW turbines,respectively.The actual turbines working lives were calculated in number of cycles till the time of inspection and found between6.5Â107and 1.1Â108cycles which are illustrated against the different turbines in Fig.1.The calculated working number of cycles was consistent with published information[3]which confirmed that the working life of20years delivered a number of cycles in the order of108cycles.3.2.Trailing edge damage formsExtensive analysis of the documented pictures has been carried out to determine the type,size and location of the differ-ent forms of damages.It should be mentioned here that a number of other damage forms exist in the blade shells were not included in this context.The trailing edge damages were categorized as follows:-(1)Longitudinal cracks along the trailing edge through the bonding materials.(2)Transverse cracks.(3)Edge cuts or crushing.Table1indicates the number of each type of damages in the inspected wind turbine blades.Because the inspected wind turbines were of different types(100kW and300kW)some normalization was made to relate the location of the damage to the blade length.For the wind turbines100kW and300kW power,the number of inspected blades B was81and18and the blade lengths R0were9.5m and14.2m respectively.The number of discontinuities(N)is normalized and expressed in term of number per blade unit length(n)using Eq.(2).Fig.1.Actual working lives(in cycles)against the turbine number.482S.Ataya,M.M.Z.Ahmed/Engineering Failure Analysis35(2013)480–488Table1damage per blade unit length in the total inspected100kWand300kWThe inspected blades were assembled from two half shells manufactured by the hand lay-up technique and then glued together afterwards.The blade is protected from ultraviolet degradation and water penetration by a gelcoat.A carrying spar made fromfiberglass reinforced resin is supporting the two shells and strengthening the whole structure.Fig.3illustrates a cross section of a100kW wind turbine blade.Understanding the production method of the wind turbine blades[4–7]and the working conditions will enable the deter-mination of the mutual effect of the different production defects and working conditions on the formation of different dam-ages.Because,it is impossible to have samples of the different defects of these working turbine blades for further laboratory failure analysis,the failure root causes will be determined based on the background of the production techniques,the work-ing conditions,the possible defect formation at certain positions and the comparison with similar published damage forms. During this long lifetime,the rotor blades are exposed to extreme temperatures(from5to50°C),humidity,rain,sandy storms,solar radiation and salinity.This severe working and aging conditions along the working life(17to22years)have a great contribution in the damage formation.In the following sections,some examples for each type of damages are illustrated and discussed,the damage size as well as their allocation on the rotor radius is presented and the possible root causes of failure are explained.those cracks oriented with the blade length.Fig.4a–cRelatively long LCs were observed at the root or in theshown in Fig.4a that was found in the transition zoneconcentrator[8]takes place.Fig.4b shows an LC located at2.85mFig.3.Cross section of a100kW rotor blades.longitudinal cracks that found in the trailing edge of100kW(a)and300kW(b)and growing in the bonding layer of the two shell halves.While the LC in Fig.4c is accompanied with some damages and removal of the gel coat on both sides of the crack.Fig.5illustrates the distribution of the different LCs sizes on the blade length.In thisfigure the blade length has been normalized to represent the data obtained from both types of wind turbine blades(100kW and300kW).The normalized rotor radius is obtained by dividing the location of the crack(R)by the blade length(R0)either9.5m or14.2m.From Fig.5it can be observed that in the100kW wind turbine blades the majority of LCs was found near to the hub in the root of the blade and on the cover of the aerodynamic zone.In contrast,in the300KW wind turbine blades,the majority of the LCs was found near to the tip of the blade(Fig.5).The number of LCs per blade unit length was higher in the blades of 300KW turbines(Fig.2).The length of the cracks is varied from a few centimeters to about40cm.One crack with a length of 135cm was found in a300KW blade.The depth of the LCs was examined using a thinfiller sheet of a0.05mm thick.Some of the cracks were as deep as the thinfiller has been inserted up to a depth of10mm in the middle of the long LCs,while on the rear thirds of the crack thefiller was inserted with difficulty to a depth of just5mm.which detected at the trailing edge of both100KW300KW blades5)into edge LCs and root LCs.The edge LCs are the LCs locatingedge LCs shown in Fig.5were separate re-plotted in Fig.6.Linearwhere most of this crack type is occurring.The linearfitting showsradius,near to the tip.cracks which locating on the root and on aerodynamic cover of theFig.7includes a focusing on the root LCs which presented in Fig.upper and lower end of the crack indicates the crack length.Fig.5.Longitudinal cracks LCs on the trailing edge of the wind turbine blades.Estimation of the edge LCs position on the trailing edge of wind turbineDistribution and length of the root LCs on the trailing edge of wind turbineThe blade is made out of two half shells that joined together with a joining material thickness of about1cm at the trailing edge.The thickness of the shell is decreasing from the root to the tip.A thickness change from17to27mm was found near the root of an equivalent300KW rotor blade[9].Also,the shell thickness decreases gradually toward the tip.This leads to a decreased rigidity towards the tip,which is needed,but the drawback of this low rigidity of the rear third of the blade is the increased deflection leading to high shear stresses at the interface between the rotor shell and the bonding materials,this can lead to decohesion or cracks at the trailing edge joints.This is mostly the reason of the LCs found near to the tip(Fig.4b).Also during the joining of the two shell halves two types of defects might occur.One can be called‘‘overbite’’which is the existence of excess bonding material and the second can be called‘‘underbite’’which is the existence of unfilled spaces be-tween the two shell halves.Overbite at the shell edges are treated by grinding and underbite arefilled with bonding mate-rials.The abrupt change of the material thickness at the root and the aerodynamic cover of the blade were led to similar damages in a300kW turbine blade as analyzed by Martin et al.[9],who related the cause to the fatigue loading.So that the reason for the existence of the LCs at the root and cover of the aerodynamic zone(Fig.4a)mainly due to the interaction of the fatigue loading and the geometric change of the blade at these regions which increases the severity of the stresses affecting these areas[8].3.2.2.Transverse cracksTransverse cracks(TCs)are aligned perpendicular to the blade length.TCs were observed on the trailing edge of the 100KW and300KW wind turbine blades with higher number per blade length in the100KW turbines.Fig.8a–c shows some examples of the transverse cracks which observed in the100kW and300kW penetrates the trailing edge with a length up to4cm.TCs are divided into four types each of which will be discussed separately below.3.2.2.1.Simple TCs.Simple TCs are those cracks existing only in one side of the blade i.e.,only in one half shell at the trailing edge and stops at the edge of the blade.An example of the simple TCs that found in the100kW wind turbine blades and is shown in Fig.8a.On the assembly of the two shell halves some misalignment could occur.To correct this misalignment and have a straight trailing edge,some grinding should be done on one side of the trailing edge.This can lead to a reduction in thereinforcingfiberglass which weakens the edge under high loading condition making it subjected to such cracks.The straight end of the simple crack(Fig.8a)indicates that it could grow further through the thickness of the blade edge.3.2.2.2.Round TCs.Round TCs are those TCs which extended on both sides of the trailing edge of the blade i.e.,growing through the two shell halves of the blade.An example of the round TCs that found on the300kW wind turbine blades is shown in(Fig.8b–c).This round TC has a branched river form due to the obstacles formed from thefiber layers to its growth path.The round TCs could be started initially as simple TCs then grow further crossing the trailing edge to the other side of the edge,this is mainly due to the reduction of the of the loading capacity in this region.The possible cause of the round TCs is the weakest reinforcement at this region,as mentioned above in the discussion of the simple TCs,which makes this region incapable of resisting the high load at this region.This round transverse crack is considered an example of the most danger-ous cracks due to cutting the whole edge of a highly loaded region of the blade.So that,it was decided to make a follow-updifferent time span to monitor the progress of such crack until it is repaired.TCs.Short root TCs are another form of TCs(locating between the black line marks in(from1.5up to2.5cm long).Those cracks are found in the root of the100KW wind turbinefound as individual crack or as a group of up to8neighboring cracks with inter-crackrepeated short TCs is possibly occurring due to an excessive cosmetic bonding material tosimple TCs.Repeated simple TCs on one side of the trailing edge are another form of the transverseThis type of tax is found in only one blade of the300KW wind turbines.The depth of thesethe simple and round transverse cracks found in the300kW and100kW wind turbine blades.(a)Simple TC at0.64(b)Round TC at0.82of a300kW rotor radius and(c)other side of the round TC in(b).Fig.9.Short repeated root TCs at the aerodynamic cover of a100kW wind turbine blades.was examined using a fine smooth tool and found that they are extended only through the coating layer.This type of re-peated cracks is due to the stall of the blade.Wind turbine blade stalling (Fig.11)is an edgewise vibration [10]due to increasing the angle at which the wind strikes the blades (angle of attack),and it reduces the induced drag (drag associated with lift).Stalling can happen when the winds speed highly increased.A fully stalled turbine blade when stopped if the flat side of the blade facing direct the wind current.This type of cracking could be due to external force impacting the other side of the trailing edge.3.2.2.5.Transverse cracks on 45°.Transverse cracks on 45o with the trailing edge (Fig.10b)This crack type has been found in the turbine where the repeated TCs (Fig.10b)exist.From the production information,the outer layer (under the gelcoat)is usually randomly oriented fibers,while the next layers are mostly arranged at 45°and À45°with the blade length.Cosmetic finishing (grinding)led mostly to some removal till reaching the subsequent layers (45°and À45°).With the vibrations (due to turbine stall)or fatigue loading,the fiber getting easily loosen from the matrix [1,3,13,14]leading to the appearance of such short cracks which aligned with the fiber orientation.The distribution of the different TCs sizes on the blade length in terms of normalized rotor radius is shown in Fig.12.It is clear that the short root cracks are mainly found in the 100kW blades.Some TCs with a crack length of 5cm are detected in 300kW blades (see Fig.13).3.2.3.Edge damagesEdge damages in the form of edge cuts or crushing were observed at various positions along the trailing edge of theexample image of the edge cuts in the trailing edge of the 300kW from the tip with a length of 10cm.Edge crushing (Fig.14b)is another form trailing edge of both 100kW and 300kW rotor blades.The trailing edge of any mechanical interaction with a hard body can result in such type of from the impact of the crane lifting basket during transportation,maintenance repeated TCs in the 300kW and 100kW wind turbine blades.(a)Repeated simple TCs at 0.7945°to the edge of a 100kW .the wind turbine blade relative to the wind current (a)attached flowFig.12.Trailing edge transverse cracks TC(100and300kW).edge transverse crack TC length on the rotor radius of100and300kWFig.14.(a)Edge cuts in a300kW rotor blade and(b)crushing of the trailing edge of a100kW rotor blade.Allocation of the edge cuts relative to the normalized rotor radius is presented in Fig.15.The edge damage sizes are rang-ing between1cm and13cm.It can be observed that the edge cuts on the trailing edge of the300kW blades areconcentrated in the lower third of the blade length where the edge is sharp which makes it easy to be crushed by the impact with any external force.4.ConclusionsFor the current study,the following conclusions can be drawn:-(1)Various damages found in trailing edge of 81blades of the 100kW and 18blades of the 300kW wind turbines whichhave a working life ranging between 17and 22years were reported and allocated on the blade length.(2)Longitudinal cracks were detected with lengths up to 0.59m are extending from the blade root to the region of geo-metric change (cover of the aerodynamic zone)and debonding of lengths up to 1.35m on the blade trailing edge.(3)Linear fitting of the location of the edge longitudinal cracks shows that they are mostly occurring at $0.73of relativerotor length.(4)Transverse cracks (TCs)were classified into:-simple (one side)TCs,round TCs,repeated short root TCs,simple TCs andtrailing edge cracks at 45°to the blade length.(5)Transverse cracks are concentrated in the highly fatigue loaded region on the trailing edge.(6)Edge damages in the form of edge cuts or crushing are concentrated in the rear third of the blade toward the tip.AcknowledgementsScience and Technology Development Fund (STDF)of Egypt is deeply acknowledged for the financial support of Grant No.1795of the call TC/1/Energy/2009/Renewable (Wind Energy).The authors express their great thanks and appreciation for the Egyptian New and Renewable Energy Authority (NREA)Eng.Osama Noman,Eng.Ashour Moussa,Eng.El-Sayed Mansour,and the technicians at the inspected site for their help and support to access and reach the inspected wind turbines.The authors thank Prof.Dr.Eng.Rashad Ramadan,Faculty of Petro-leum and Mining Engineering,Egypt,and Mr.Otto Lutz,Authorized Expert on Fibre Composite Materials,Bundorf,Germany,for the helpful discussion.References[1]Kong C,Kim T,Han D,Sugiyama Y.Investigation of fatigue life for a medium scale composite wind turbine blade.Int J Fatigue 2006;28(10):1382–8.[2]Chou J-S,Chiu C-K,Huang IK,Chi K-N.Failure analysis of wind turbine blade under critical wind loads,Eng Failure Anal 2013;27:99–118.[3]Kensche CW.Fatigue of composites for wind turbines.Int J Fatigue 2006;28(10):1363–74.[4]Manwell JF,MecGowan JG,Rogers AL.Wind energy explained:theory design and application.2nd ed.John Wiley and Sons Ltd.;2009.p.276–304.[5]Piggott H.How to build a wind generator –the axial flux alternator windmill :University of Loughborough;May 2003.[6]Ancona,D,McVeigh,J.Wind turbine –materials and manufacturing fact sheet,a report prepared by Princeton energy resources in international,LLC for the office of industrial technologies; Department of Energy.[7]Jüngert A.Damage detection in wind turbine blades using two different acoustic techniques.The e-J Nondestruct Test 2008.[8]Cripps D.The future of blade repair.Reinf pl 2011;55(1):28–32.[9]Martin JC,Barroso A,Parıs F,Canas J.Study of damage and repair of blades of a 300kW wind turbine.Energy 2008;33:1068–83.[10]Guidelines for design of wind turbines.2002,Denmark:Centraltrykkeri.[11]Hu D,Hua O,Du Z.A study on stall-delay for horizontal axis,wind turbine.Renew Energ 2006;31:821–36.[12]Larsen JW,Nielsen SRK,Krenk S.Dynamic stall model for wind turbine airfoils.J Fluid Struct 2007;23:959–82.[13]Costa J,Turon A,Trias D,Blanco N,Mayugo JA.A progressive damage model for unidirectional fibre-reinforced composites based on fibre fragmentation.Part II:stiffness reduction in environment sensitive fibres under pos Sci Technol 2005;65(14):2269–75.[14]Boerstra GK.The multislope model:a new description for the fatigue strength of glass fibre reinforced plastic.Int J Fatigue 2007;29(8):1571–6.cuts on the normalized rotor radius in 81and 18blades of 100and 300。
游艇专业英语词汇(T3)
游艇专业英语词汇(T3)叶端[线]速 tip speed工具钢 tool steel上桅帆 topgallant (or topgallant sail)上桅帆桁吊索 topgallant lift俯仰顶索滑车 topping lift block转矩系数 torque coefficient扭转临界转速 torsional critical[扭转]马力计 torsion meter总排水量 total displacement总落差 total head全围蔽救生艇 totally enclosed lifeboat拖航钢索 towing wire拖缆阻力 tow rope resistance回旋横距,传递 transfer输送泵 transfer pump瞬时,过渡状态 transient state瞬时反应测试技术 transient test technique横向舱壁 transverse bulkhead拖网 trawl拖网绞车 trawl winch踏板,轮具,龙骨长 tread俯仰水泵 trimming pump三螺桨船 triple screw ship三缸泵 triplex pump激紊线(阻力试验) trip wire刮管器 tube scraper管撑 tube stay水管锅炉,火管锅炉 tubular (or water tube) boiler鲔钓母船 tuna mothership涡轮机叶轮 turbine wheel回转时间 turn-around time (tat)旋转力 turning force双绞 twin twisted二节点振动 two-node vibration二[段螺]距螺桨 two pitch propeller二位置动作型 two position action type双通旋塞 two-way cockt-y型接头 t-y joint (or connection)双层甲板船 twin deck vessel舷侧水柜 topside (or gunwale) tank洗舱泵 tank cleaning pump槽[货]柜 tank container舱侧肋骨 tank side frame焦油 tar靶船,目标船 target ship[套筒]伸缩接合 telescopic joint电传打字 telex悬吊罗经 telltale compass温度校正 temperature correction榫臼 tenon and mortise拉应力 tensile stress张力脚式钻油台 tension leg platform (tlp) 终点,端,货柜码头,线端,终端机(电算) terminal 接线盒 terminal box试验 test试验旋塞 test cock涡轮发电机 t/g (= turbo generator)热试验 thermal test推力马力 thp (= thrust horsepower)三段空[气]压[缩]机 three stage air compressor 推力[轴]承环 thrust block ring系紧螺栓 tie bolt肋顶延长部(木船) timber head肘节开关 toggle switch吨 ton减吨舱口 tonnage hatch工具箱 tool box齿轮 toothed wheel (or gear)中帆(四节桅时) topsail水线漆 topside black过转矩 torque rich扭转角度位 torsional deflection扭转常数 torsion constant有毒烟雾 toxic fume轨道,航迹 track火车渡船 train ferry横波 transverse wave三段膨胀引擎 triple expansion engine三脚桅 tripod mast曳绳钓渔船 troller桅顶信号灯,[接近受补船]艏灯 truck light箱舱甲板船 trunk vessel塞入水下(气垫船) tuck-under转轴机 turning engine甲板间[空间],中甲板 tween deck扭矩 twisting moment二相 two phase摆线波 trochoidal wave扭转导波管 twist wave guidet形导波管 tee wave guide遥测仪 telemeter温控替续器 temperature relay试验水头 test head试验样品 test sample试样,试件 test specimen温度测定 thermometry曲柄半径 throw of crank shaft紧[密]性 tightness木材,木料 timber甲板积载木材 timber deck cargo蒂氏梁 timoshenko beam焊接缝突趾 toe of weld公差 tolerance每吋吃水吨数 tons per inch immersion 工具工场 tool shop工具试验器 tool tester顶部柜角装具(货柜) top corner fitting 顶灯 top light中桅(四节桅时) topmast上部壳板 top plating转矩计 torquemeter扭力偶 torsional couple总损失 total loss总阻力 total resistance韧度,韧性 toughness拖曳船速 towing speed拉型拖船 tractor瞬时反应 transient response艉肋板 transom floor电铃线圈 trembler coil架柱,架台 trestle平衡水(潜艇) trim water防挠肘板 tripping bracket摆线泵 trochoid pump运兵船 troopship真滑流 true (or real) slip小艇底部通索孔 trunk hole海啸 tsunami轴道凹部 tunnel recess[中间]轴承 tunnel shaft bearing (or plumber, or plumber block) 转轮 turning wheel捻转开关 turn switch甲板间 tween decks双层甲板船 twin deck vessel扭转导波管 twist wave guide箱舱甲板船 trunk vessel发热焊接 thermit welding厚度规,测隙规 thickness gauge咽喉螺栓 threat bolt三元给水调节 three elements feed water三段变速齿轮 three speed gear三连曲柄轴 three throw crank-shaft三通阀 three way valve帆前上角 throat推力计 thrust meter潮汐表 tide table倒头销 toggle pin夹刀柱 tool post长顶游艇 top open yacht[前桅]顶帆[式帆]船 topsail schooner扭矩限制器 torque limiter转矩记录计 torsiongraph全封可携式货灯 totally enclossed portable type cargo light 韧性试验机 toughness tester拖船 tow (or towing) boat (or tug)描图 tracing plan牵引 traction拖曳车组 tractor-trailer combination收发报机 transceiver横向构系 transverse system梯形定则,梯形积分法 trapezoidal rule移动齿杆 travelling rack俯仰船况 trimming condition跳凸挫曲 tripping buckling绝对风速 true wind velocity钨焊条 tungsten electrode烟囱,轴道,管道 tunnel涡轮机消压轮 turbine dummy涡轮效率 turbine efficiency涡轮机船 turbine ship (ts)涡轮鼓风机 turbo-blower斜纹织 twill weave双舵 twin rudder二冲程引擎 two stroke engine尾阀 tail valve拖船 towing vessel上桅桁 topgalent yard摇变性 thixotropy喉深(焊接) throat depth直接联结 through coupling推力[轴]承座 thrust block seating延时电驿 time delay relay艉骤降(下水) tipping顶部轴衬 top brass上桅桁 topgalent yard[翼]肩舱topside (or gunwale, or corner, or cantilever, or shoulder) tank最高速[率] top speed鱼雷艇 torpedo boat鱼雷艇 torpedo motorboat扭转柔度 torsional flexibility全封式扇冷马达 totally enclosed-fancooled motor拖曳阻力 towing resistance拖车拉系组件 trailer lashing units瞬时电流 transient current瞬间偏差 transient deviation横定倾中心 transverse metacenter横向环肋 transverse ring艏俯下航(潜艇) trimming down箱道通风筒 trunk ventilator管箍 tube furrule管扳钳 tube wrench圆管柱 tubular pillar艉凸部下方,船底后端 tuck齿轮换向器,颠动筒,滚筒 tumbler气体遮蔽钨弧焊 tungsten inert gas arc welding (tig)涡轮机壳 turbine cylinder二凸轮轴型(反转装置) twin cam shaft type二滚子型(反转装置) twin roller type双额定点泵 two rated points pump二速泵 two speed pump双拐曲柄轴 two (or double) throw crank-shaft 螺纹 thread节流,节流阀 throttle小艇帆布天遮 tilt定时燃油泵 timed fuel pump端,梢,倾斜,倾卸 tip叶端泄漏损失 tip clearance leakage loss骤降力矩(下水) tipping moment陶氏青铜 tobin bronze肘节,接根,套环 toggle钳,铗,货柜夹架 tongs工具规 tool gauge艏艛 topgallant forecastle高速齿轮 top gear鱼雷柜(潜艇) torpedo tank转矩常数 torque constant描绘,描迹 tracing拖车 trailer艉梁 transom beam运输舰 transport行程 travel拖网渔船 trawler三行铆接 treble riveting桅支架 trestle tree水平撑杆 triatic stay吊索 tricing line俯仰力矩 trimming moment热带区域 tropical zone筒[形活]塞引擎 trunk engine耳轴,炮耳,空枢 trunnion船舷内倾 tumblehome (or falling home, or fall in) 轴道甲板 tunnel flat紊流,扰流 turbulent flow双绞电缆 twin cable帆布线 twine双[胴]体船 twin hull基型船 type ship圆舷甲板船 turret vessel趾 toe榫,舌 tongue槽榫接合 tongue and groove joint吨位丈量 tonnage measurement顶端横材(货柜) top and rail上桅支索帆 topgallant staysail上部用材 top member[桅顶]俯仰滑车座 topping bracket中桅桁 topsail yard防雷网桁 torpedo net boom扭转惯性矩 torsional moment of inertia补漆 touch up拖缆拱架 towing arch曳航灯 tow steering light转脆温度 transition temperature横向构件 transverse member拖网(渔网) trawl net渔网拖索 trawl warp三孔滑阀 treble ported slide valve试,试航 trial三轴[向]压缩试验 triaxial compression test摆线波 trochoidal wave摆线运动 trochoid motion丁字尺 t square管 tube中间轴 tunnel (or intermediate) shaft涡轮机减速齿轮 turbine reduction gear匝,转数 turn鲸背甲板 turtle (or whale) back deck双重复滑车组 two fold purchase双向无线电话设备 two-way radiotelephone apparatus 土耳其国家标准 ts (= turk standardlari, turkey)工具工场 tool maker shop吹把,火炬,喷灯,手电筒 torch鱼雷 torpedo总压力 total pressure拖索,拖缆 tow line (or rope)高传滑车 transfer head瞬时阻抗 transient impedance经纬仪,子午仪 transit穿透损失,传动损失 transmission loss艉俯 trim by stern自由跳脱空气断路器 trip free air circuit breaker转迹线,摆线 trochoid导管,筒,箱道,箱舱 trunk围堰甲板,箱舱甲板 trunk deck扩管器 tube expander刷管器 tube scaler涡轮往复组合机 turbine and reciprocation combined涡轮压缩机 turbo-compressor涡轮电力推进 turbo-electric propulsion紊流边界层 turbulent boundary layer匝[数]比 turn ratio双叶螺桨 two bladed propeller二冲程油机 two stroke oil engine横波 transverse wave热传递 transmission of heat横肋骨 transverse frame滑阀行程 travel of slide valve三色灯 tri-color light跳脱线圈,脱扣线圈 trip coil热带载重线 tropical loadline (t)波谷,集水槽(窗框) trough净管器 tube cleaner截管器 tube cutter管塞 tube drift (or plug)管板 tube plate拖船 tug boat (or tug)涡轮机转子 turbine rotor涡轮发电机 turbo generator (t/g)二冲程循环 two-stroke cycle (or two cycle)双线系统 two wire system轴道污水井 tunnel well中桅桁 topsail yard透过电子显微镜 transmission electron microscope (tem) 横向定倾高 transverse metacentric height整平(散装货),修整 trimming俯仰表 trimming table跳脱装置 trip gear桅顶,卡车 truck桁架 truss桁架梁 truss girder管刷 tube brush管插件(热交换器) tube insert管柱 tube pillar鲔[延绳]钓渔船 tuna long liner (or tuna clipper) 隧道型艉 tunnel stern涡轮送风机 turbo-fan[松紧]螺旋扣 turnbuckle回旋速[率] turning speed扭曲叶片 twisted blade扭转锁定器 twist lock[容许]二舱区浸水船 two-compartment ship二冲程引擎 two cycle (or stroke) engine跳脱阀 trip valve真应力 true stress箱型舱口 trunk hetchway筒状活塞 trunk piston槽座,桶框 tub管塞 tube stopper管钳 tube vice涡轮增压机 turbo-charger转矩 turning moment回旋半径 turning radius回旋试验 turning trial圆舷甲板船 turret vessel双[胴]船体 twin bull (or catamaran)双脚螺桨支架 two-leg propeller strut型式认可 type approval定时阀 timing valve[套筒]伸缩通气管 telescopic vent干道通风筒 trunk ventilator扭转振动 torsional vibration渔索拖索 trawl warp节流阀 throttle valvet形导波管 tee wave guide转轮 turning wheel定位焊接 tack welding涡轮机叶轮 turbine wheel齿轮 toothed wheel美国造纸工业技术协会tappi (= technical association of the pulp and paper industry, u.s.a.)美国轮胎协会 tra (= tire and rim association, u.s.a.)美国管式交换器制造商协会tema (= tubular exchanger manufacturers association, u.s.a.)。
维斯塔斯V90-3.0MW

3×44 metres of leading edgeIn our quest to boost the efficiency of the V90, wemade sweeping improvements to two aspects ofour turbine blades: their material composition andtheir structure.We at Vestas have long enjoyed a reputation formaking some of the lightest blades on the market,and with the V90 we have once again raised the bar.We began by introducing several new lightweightmaterials, most notably carbon fibre for the load-bearing spars. Not only is carbon fibre intrinsicallylighter than the fibre glass it replaces, but itsstrength and rigidity also reduce the quantity ofmater i a l needed – thus cutting overall weight evenfurther. So that even though the V90 has a sweptarea that is 27 per cent more than the V80, the newblades actually weigh about the same.The new profile of the V90 blades also represents asig n i fi cant aerodynamic advance. In collaborationwith Risø National Laboratory in Denmark, Vestasengineers worked on optimising the relationshipbetween the overall load impact on the turbine andthe volume of energy generated annually. Their finalblade design features an entirely new plane shapeand a curved back edge.The resulting airfoil improves energy production,while making the blade profile less sensitive to dirton the leading edge and maintaining a favourablegeometrical relationship between successive airfoilthicknesses. This translates into an increase inoutput combined with a decrease in load transfers– as well as improvements on the bottom line.Reduced need for service and maintenanceA series of improvements to the V90 have madeservice and maintenance calls less demanding– and less frequent. Turbine access has beensimplified and working areas expanded, while thearrangement of tower and nacelle components hasbeen optimised to facilitate service pro c ed u res. Moreover, a variety of new features, ranging from automatic blade-bearing lubrication to an oil-lubricated yaw system, have made it possible to reduce the number of preventive maintenance visits to one a year. This means considerable savings in turbine downtime and personnel costs, and is a particularly welcome development in the context of hard-to-reach off s hore installations. Proven Performance Wind power plants require substantial investments, and the process can be very complex. To assist in the evaluation and purchasing process, Vestas has identified three factors that are critical to wind turbine quality: energy production, power quality and sound level.We spend months testing and documenting these perform a nce areas for all Vestas turbines. When we are finally satisfied, we ask an independent testing organisation to verify the results – a practice we call Proven Performance. At Vestas we do not just talk about quality. We prove it.Innovations in blade technologyg h b d e c f 6789a 132453,5003,2503,0002,7502,5002,2502,0001,7501,5001,2501,000750500250051015202512345 6789a b c d e f g hOil coolerWater cooler for generatorHigh voltage transformerUltrasonic wind sensors VMP-Top controller with converter Service crane OptiSpeed® generator Composite disc coupling Yaw gearsGearbox Mechanical disc brake Machine foundation Blade bearing Blade hub Blade Pitch cylinder Hub controller Technical specificationsPower curve V90-3.0 MWWind speed (m/s)P o w e r (k W )30252015103025201510501,9001,7001,5001,3001,1009003,5003,0002,5002,0001,5001,000OptiSpeed ® allows the rotor speed to vary within a range of approximately 60 percent in relation to nominal rpm. Thus with OptiSpeed ®, the rotor speed can varyby as much as 30 per cent above and below synchronous speed. This minimises bothunwanted fluctuations in the output to the grid supply and the loads on the vitalparts of the construction.*Vestas OptiSpeed ® is not available in the USA and Canada.WindS peed (m /s)TimePitchA ng le(de g ree s)TimeGeneratorS peed(rpm )TimeOutputP o w e r(k W )TimeWhen Vestas set out to establish a new benchmark for e fficiency with its development of the V90-3.0 MW turbine, high priority was given to keeping weight down. That is because wind turbines are heavy, and the heavier the turbine, the greater the costs – for production, material, transport and installation.Our engineers therefore rethought every aspect of turbine design – from foundations to blade tip – seeking ways to minimise the cost per kWh over the design lifetime of the V90. The result is a showcase of innovative engineering – particularly as regards weight saved. In fact, despite a larger rotor and generator, the new V90 actually weighs less than the V80-2.0 MW.The biggest reduction has come from strengthening the tower. To increase fatigue strength, we have pioneered the use of magnets to fasten internal components to the tower walls. In addition, using a stronger steel means less is needed. The decreased weight lets us construct the new towers in fewer sections, with significant savings in material, transport, and installation costs.The most radical redesign centred on the new nacelle. Even though the 3 MW generator is 50 per cent larger than the corres p onding generator in the 2 MW wind turbine, we kept overall nacelle weight almost the same. We did this by integra t ing the hub bedplate directly into the gearbox, eliminating the main shaft and thus shortening nacelle length. The result is a nacelle that can generate much more power without any appreciable increase in size, w eight or tower load.Together with new low-weight blades, these breakthroughs have made the V90 remarkably light for a turbine of its size – and remarkably efficient for a turbine of any dimension.An efficient way to more power01/08 U K。
Turbine blade, more particularly turbine nozzle va
专利名称:Turbine blade, more particularly turbine nozzle vane, for gas turbine engines发明人:Alfred Hueber申请号:US06/357629申请日:19820312公开号:US04396349A公开日:19830802专利内容由知识产权出版社提供摘要:A turbine blade, more particularly a turbine nozzle vane, for a gas turbine engine, consisting of a structural metallic core enveloped at a distance by a ceramic blade jacket. Through provision a primarily highly heat-resistant, ceramic metal compound structure of the blade, the blade jacket is compressively prestressed spanwise between the blade shrouds in the inoperative condition of the turbine and where said compressive prestressing of the blade jacket, produced during assembly and which exists in the inoperative condition, is at least maintained during the operation condition by selecting for the metallic core of the blade, a material of average coefficient of thermal expansion and for the metallic inner and outer shrouds of the blade, and for the inner and outer metallic, sleeve-like components producing the axial prestress, materials of higher coefficients of thermal expansion, and for the highly thermally stressed ceramic blade jacket, a material of average coefficient of thermal expansion.申请人:MOTOREN-UND TURBINEN-UNION MUNCHEN GMBH代理机构:Scully, Scott, Murphy & Presser更多信息请下载全文后查看。
Turbine Blade Cooling: The Blade Temperature Distribution
Turbine blade cooling:the blade temperature distributionJ H Horlock1and L Torbidoni2Ã1Whittle Laboratory,Cambridge University,Cambridge,UK2Ansaldo Energia,Genoa,ItalyThe manuscript was received on29March2005and was accepted after revision for publication on6January2006. DOI:10.1243/09576509JPE177Abstract:Air cooling of high-temperature gas turbines is a standard practice;the airfirst coolsthe blading by internal convection and then by externalfilm cooling,after ejection throughholes and slots in the blade surface.In some‘conventional’analyses of turbine blade cooling,a‘standard blade’is invoked,which has a uniform blade temperature equal to the average temp-erature of the real blade,and estimates are made of the coolingflow required to hold the stan-dard blade temperature to a limit set by material considerations.However,early analytical workby Ainley(for convective cooling of thin-walled blades)showed that both the coolant and bladetemperatures should increase along the blade span.The current paper develops Ainley’s originalanalysis to allow forfinite blade wall thickness and thermal barrier coatings,film cooling,andvariation in the mainstream gas temperature along the span.This new analysis should enablemore accurate estimates to be made of cooling airflow requirements.Keywords:turbine cooling,blade temperature,coolantflow1INTRODUCTIONIn some‘conventional’analyses of turbine blade cooling,a‘standard blade’is invoked,which has a uniform blade temperature equal to the average temperature of the real blade;it being implied that the blade fails at this uniform,and average,temp-erature[1].Here,the original work of Ainley[2]is re-examined analytically;he suggested that the blade metal temperature T b(y)increases with span-wise distance from the root,(y),not attaining a maximum until the end of the blade(y¼H).The current work may be regarded as an initial step towards more general computerized solutions to the problem[3],in which attempts are made to over-come some of the limitations of Ainley’s work that Halls pointed out.It appears that the conventional approach,with T b constant,leads to under-estimates of the coolant flows required to keep the blade temperature below a prescribed level.This may be one reason for the high-safety factors that then have to be used in such analyses.2AINLEY’S ANALYSISIn his seminal paper,Ainley presented a basic analysis for convectively cooled,thin-walled blades of constant section,subject to a uniform inlet gas temperature T g.His work leads to the distributions of blade tempe-rature T b(y)and coolant temperature T cl(y)along the span.The important parameters used by Ainley are the following.1.X¼h cl S cl=h g S g,where h cl and h g are the surfaceheat transfer coefficients on the coolant and gas sides,respectively,and S cl and S g are the corre-sponding surface perimeters.2.wþ¼m cl c p,cl=h g A g,s,the familiar non-dimensionalmassflow parameter relating the coolant heat capacity,m cl c p,cl,to h g A g,s,whereA g,s¼S g H is the total gas surface area along ablade length H.ÃCorresponding author:Piazza Santa Maria in Via Lata8-14,Genova,Italy.email:leonardo.torbidoni@aen.ansaldo.it343Ainley stated the basic equations for the heat transferred from gas to coolant per unit span(q)asq¼l met A met d2T bd yþh g S g(T gÀT b)¼h cl S cl(T bÀT cl)(1) andq¼m cl c p,cl d T cldy¼h cl S cl(T bÀT cl)(2)Here,l met is the metal conductivity and A met is the metal area in a blade cross-section.With the assumption of constant T g in the radial direction and neglecting the conductivity term in equation(1),Ainley obtained approximate solutions for the span-wise distributions of T b and T clT gÀT b T gÀT cl,in ¼X1þ XeÀk(y=H)(3)T gÀT clT gÀT cl,in¼eÀk(y=H)(4)where k¼ X=½(1þ X)wþ .Here,the over-bar indi-cates a span-wise mean value of X but in what follows,the over-bar is dropped,and f¼X=(1þX) and k¼f=wþ.These equations show that both T b and T cl increase with the span-wise distance y,as illustrated diagram-matically in Fig.1and that the maximum values of T b and T cl are reached at the blade tip,y¼H.The differ-ences(T gÀT b)and(T bÀT cl)are proportional to X(T gÀT cl)=(1þX)and(T gÀT cl)=(1þX),respec-tively,at all locations along the span,a relationship which will be used subsequently.f is less than unity and wþis generally in the range from3to5[4],so that k¼f=wþmay be quite small.If so, then the exponential term eÀk(y=H)can be taken as ½1À(f=wþ)(y=H) ,the terms in(f=wþ)2,etc.being neglected.T b and T cl then increase linearly along the span.The corresponding temperatures for the conven-tional analysis are shown diagrammatically in Fig.2,with the assumption of a standard blade of constant T b;equations(3)and(4)are not then satis-fied at all stations along the blade.The purpose of the analyses and illustrative calcu-lations given below is to investigate the differences in the estimation of the coolantflow m cl obtained from the conventional and Ainley-type approaches, initially for the conditions that Ainley studied,i.e. for convectively cooled blades with thin metal walls.The effects offinite thickness,for both metal and thermal barrier coatings(TBCs),and offilm cooling are introduced subsequently.It is of interest to note Consonni’s[5]approach to the integration of Ainley’s basic equations(1)and(2). Essentially,he treated the whole heat transfer pro-cess as one in a heat exchanger with uniform external temperature T g,but not constant T b,and an overall heat transfer coefficient U,for whichUS cl¼1h g S gþ1h cl S clÀ1¼fh g S gHe was then able to integrate directly to obtain equation(4),as detailed in references[5,3].3THE‘STANDARD BLADE’,CONDUCTIVITY, AND OTHER ASSUMPTIONSThe concept of a standard blade of uniform blade temperature was developed in a wide-ranging and authoritative paper by Halls[1]andused Fig.1The Ainley/Consonniapproach344J H Horlock and L Torbidonisubsequently by Holland and Thake[6].Ainley’s approach was considered,but rejected by most manufacturers because:(a)it was based on a single pass of coolant;(b)it could not be used to compare different enginesystems;(c)it assumed uniform chord-wise temperatures,anassumption not borne out in practice.Ainley’s approach was then replaced by that out-lined by Halls,of the standard blade operating at a uniform surface temperature equal to the average temperature of the real blade,and failure was assumed to occur at this blade temperature.It is tempting to say that Halls made an assumption of infinite conductivity for justifying the blade metal temperature uniformity,but this was not used specifically in his argument.It may also be noted that a uniform blade temperature can result from Ainley’s equations,but not from infinite conduc-tivity.In fact,T b becomes uniform only when the non-dimensional coolantflow wþis allowed to become infinite.Here,Ainley’s work is re-examined,as a parallel analytical step towards the development of compu-terized solutions to overcome Halls’original objec-tions.The computer code described in reference[3] allows for chord-wise variations of coolantflow, blade temperature,gas and coolant temperatures, and heat transfer coefficients.It also allows for finite blade wall thickness,TBC,multi-pass chan-nels,andfilm cooling.Ainley did originally include a conductivity term, l met A met d2T b=d y2,in equation(1)for the heatflux through the blade metal,but then he neglected this first term in comparison with the other heatflux terms,in order to obtain his solutions for T b(y)and T cl(y).He did not justify this assumption other than to say that it was valid for turbine blading made of heat resistant material and of aspect ratios of2or more. However,it is possible to work back from Ainley’s solution for T b(y)to test his assumption.From equation(3)d2T b d y ¼À(T gÀT cl,in)kH2f eÀk(y=H)Thus,the ratio of thefirst and second terms in equation(1)may be shown to beÀl met A met k2 h g S g H ¼Àl met A meth g S g Hfw2If the(small)blade wall thickness is t,then the area A met of the metal in the cross-section of a blade of chord c is approximately2ct;the perimeter of the blade is approximately S gffi2c,so that A met=S gffit. Further,if the Biot number of the thin metal wall is expressed as Bi met¼h g t=l met,then the ratio istH2(f=wþ)2Bi metTypical values obtained from the computer-code solutions of Torbidoni and Horlock[3]are of the order X¼4,f¼0:8,and wþ¼3,and if t¼2mm and H¼50mm,with Bi met¼0:25,then the ratio is approximately4:5Â10À4.Ainley was therefore entirely justified in neglecting thefirst term in equation(1),for the gradient of heat conducted span-wise in the metal.Further,the ratio of the(almost constant)heat conducted along the blade span l met A met d T b=d y to the heat transferred to the coolant h cl S cl(T bÀT cl)H is approximatelyt2(f=wþ)metwhich,for the example calculated above,is equal to 1:7Â10À3and is also small.The conclusion is that for normal values of metal conductivity,the variable blade temperature T b(y) predicted by Ainley does not lead to sufficient heat being conducted along the span to equalize T b and create a constant blade temperature.4REQUIRED FLOWRATE:CONVENTIONAL ANALYSES WITH CONSTANT BLADETEMPERATUREIn the conventional analyses,the definition of cool-ing efficiency is usually taken as(h c)CON¼T cl,outÀT cl,inT bÀT cl,inwith T b assumed uniform.From the same assump-tion,it is then possible to derive from the second of Ainley’s equations an expression for(h c)CON of the form(h c)CON¼1ÀexpÀXwþ(5)However,it is more usual to write(ÀX=wþ)in terms of the internal Stanton number St cl,so that(h c)CON¼1ÀexpÀSt cl A cl,sA clTurbine blade cooling345As the Stanton number varies relatively little with the Reynolds number,it is conventional to assume a constant value for the cooling efficiency defined as (h c)CON,usually on the basis of practical experience. For a constant blade temperature T b,the non-dimensional coolant massflow(wþ)CON is conven-tionally written in terms of the cooling efficiency and the cooling effectiveness[6]as(wþ)CON¼10c CON0(6) where10is the cooling effectiveness10¼T gÀT b(T gÀT cl,in)(7)With the cooling efficiency written in the form of equation(5),equation(6)becomes(wþ)CON¼101Àexp½ÀX=(w)CON(1À10)(8)If the external gas temperature T g and the coolant inlet temperature T cl,in(usually the compressor outlet temperature)are known and the(assumed constant)blade temperature T b is interpreted as the maximum allowable temperature,then the cooling effectiveness10can be obtained from equation(7). If X is also known,equation(8)is then an equation for the non-dimensional coolantflowrate(wþ)CON. However,it is more usual to use a constant value of h c on the basis of the experimental data to obtain (wþ)CON directly from equation(6).It should be emphasized that as equation(6),a fre-quently used relationship for(wþ)CON,is based on the blade and gas temperatures being uniform,it implies that the heat transferred per unit span from the hot gas to the blade is then constant along the span.Thus,equation(6)cannot be applied with Ainley’s equations,for which T b may vary.5REQUIRED FLOWRATE:AINLEY’S ANALYSIS WITH VARIABLE BLADE TEMPERATUREA cooling efficiency can also be obtained using Ainley’s results,equations(3)and(4),and by setting the blade temperature at y¼H as the maximum, T b,out¼T b,max.The cooling efficiency would then become(h c)AIN¼T cl,outÀT cl,inT b,maxÀT cl,in¼1ÀeÀk1À½X=(1þX) eÀkHowever,the required non-dimensionalflowrate, say(wþ)AIN,can be obtained directly from Ainley’s equations without using a cooling efficiency,which becomes redundant and therefore of less significance.In fact,(wþ)AIN follows directly by interpreting T b within the expression for10as the maximum allow-able temperature T b,max,equal to the temperature T b,out at y¼H,and obtained from Ainley’s expression for the(variable)blade temperature, equation(3).Thus(10)AIN¼T gÀT b,maxT gÀT cl,in¼f eÀkandk¼f(wþ)AIN¼lnf(10)AINso that(wþ)AIN¼fln½=(10)AIN(9)Clearly,this expression is valid only if10,f.In the limit10¼f,(wþ)AIN goes to infinity and k to zero. Equation(4)then shows that the coolant tempe-rature rise also goes to zero and T cl¼T cl,in becomes constant,as well as T b.6NUMERICAL COMPARISONS OF COOLANT FLOWRATEThere are thus alternative expressions available for the non-dimensionalflowrate wþ,one obtained from the conventional approach,assuming that the blade temperature is constant along the span,and one from use of Ainley’s analysis leading to variable T b along the span.With wþdetermined either way, the ratio of the required coolantflow to the main-stream gasflow then follows asc¼m clm g¼K cool wþwhere K cool¼St g(c p,g=c p,cl)(A g,s=A g),as described in reference[4].To compare estimates of wþand c,typical values of various parameters from the literature are taken as follows:T g¼1700K,T cl,in¼700K, T b,max¼1100K,X¼4,and K cool¼0:045;it follows from these values that f¼X=(1þX)¼0:8and that 10¼0:6,10=(1À10)¼1:5.Then equation(8)for the conventional approach with T b constant gives(wþ)CON¼1:64(by iteration), h c¼0:912,c CON¼0:074,and D T cl¼365K.346J H Horlock and L TorbidoniEquation(9)for the alternative Ainley approach gives(wþ)AIN¼0:8=ln(0:8=0:6)¼2:78,c AIN¼0:125, and D T cl¼250K.The resulting temperatures for the Ainley approach are illustrated in Fig.3,where it is assumed that T cl and T b increase linearly,i.e.(f=wþ)2,etc., being neglected within the Taylor approximation.If the allowable blade temperature is lowered to 1000K,then the above estimates of the required cool-ingflows are about doubled:to(wþ)CON¼3:345,with h c¼0:697,and to(wþ)AIN¼5:99.This illustrates the strong coupling between the allowable blade tempera-ture and the required coolingflow.In general,the conventional approach predicts a small coolantflow with a high temperature rise;the Ainley approach suggests a high coolantflowrate with a low temperature rise,but a higher overall heat transfer from the hot gas stream(because the mean blade temperature is lower).7THE EFFECT OF METAL THICKNESS AND TBCs The analyses presented above were for convectively cooled blades with thin metal walls and no TBCs.If finite thickness is introduced,then the temperature distributions are as indicated in Fig.4.The equations governing the heatflow are modified to allow for the heat being conducted through the metal wall and the TBC;the new‘proportionalities’X,XB tbc,XB met,and1, for the temperature differences,are illustrated in Fig.4.Solution to these equations is straightforward and the modified expression for the external blade temperature T be isT gÀT beT gÀT cl,in¼f0eÀk0(y=H)where nowf0¼X(1þBi tbc)1þX(1þBi tbcþBi met)andk0¼X=(wþ)01þX(1þBi tbcþBi met)where the primes indicate the current analysis,with non-zero values of the Biot numbers Bi met¼h g t met=l met and Bi tbc¼h g t tbc l ibc.Hencek0¼lnf010from which(wþ)0may be determined.However,it is important to note that the cooling effectiveness is now given by10¼T gÀT be,maxT gÀT cl,inwhere T be,max is the temperature on the external metal face of the blade at the tip section.Three examples for comparison with the calcu-lations of section6for the thin-walled blade are con-sidered,all again for T g¼1700K,T cl,in¼700K, T be,max¼1100K,and X¼4.1.Withfinite thickness of the metal,such thatBi met¼0:25,but with no thermal barrier coating, the coolant massflow is increased to wþ¼6:34 (cf.wþ¼2:78for the thin-walled blade)and the coolant temperature rise D T cl is only100K(Fig.5).2.Withfinite thickness of the metal,Bi met¼0:25,and with additional thermal barrier coating, Bi tbc¼0:2,the coolantflow is decreased to wþ¼3:62and the coolant temperature rise D T cl increased to150K(Fig.6).Fig.4Effect of metal and TBC thicknessesTurbine blade cooling3473.With the conditions of (b),i.e.both finite metal thickness and thermal barrier coating,but with the higher coolant flowrate of (a),w þ¼6:34,the condition on the maximum blade temperature can be made more severe.T be,max now drops from 1100to 1057K,the TBC being responsible for this drop.The coolant temperature rise is only 89K (Fig.7).8THE EFFECT OF FILM COOLING8.1Constant adiabatic wall temperature T awIf film cooling is introduced,the gas temperature T g is effectively replaced by an adiabatic wall tempera-ture T aw in the heat transfer equations,with T aw to be determined.Much work has been done on the effects of film cooling,and it has become common practice to define a film effectiveness ash ad ¼T g ÀT awT g ÀT cl,out(10)where T cl,out is the temperature leaving the blade sur-face to create the film.If it is supposed that all thecoolant is convectively heated over the whole length of the blade before it is ejected for film cooling,then T cl,out is the (constant)value at y ¼H ,to be used in equation (10).Further,although Goldstein and Haji.Sheikh [7]have given a complex correlation of the film cooling effectiveness as a function of many variables,it is common practice to assume that h ad takes a constant value in the determination of the required coolant flow.Intro-duction of a known value of h ad then enables T aw to be replaced in equation (10),so that if T g is constant,T aw also takes a constant value.The temperatures become as illustrated diagrammatically in Fig.8,in which Bi met ¼Bi tbc ¼0.The analysis to determine T b and T cl is straight-forward but again algebraically complex,so the results are given here without detailed derivation,but now for finite Bi met and Bi tbc .Indicating this form of analysis with a double prime (00),it may be shown that T aw ÀT be,max T aw ÀT cl,in ¼T g ÀT be,max Q (T g ÀT cl,in )¼10QFig.5Thick-walled metalbladeFig.6Thick-walled metal blade withTBC348J H Horlock and L Torbidoniwhere Q 00¼1þ(1À10)h ad (1Àh ad )f 00and in which,as in section 7f 00¼X (1þBi tbc )1þX (1þBi tbc þBi met )k 00¼X =(w þ)001þX (1þBi tbc þBi met )and10¼T g ÀT be,maxT g ÀT cl,inThe non-dimensional coolant flow (w þ)00may then be determined from 10¼Q 00f 00e Àk 00andk 00¼X =(w þ)001þX (1þBi tbc þBi met )¼ln Q 00f0010A calculation for a thin-walled film-cooled blade,with h ad ¼0:4and Bi met ¼Bi tbc ¼0,now yields the non-dimensional mass flow as (w þ)00¼1:39and D T cl ¼318K,as shown in Fig.9.(This compares with the original thin-walled blade example of Fig.3,where w þ¼2:78and D T cl ¼250K,also for zero Biot numbers).Including Bi met ¼0:25and Bi tbc ¼0:2in the film-cooled calculation gives a reduced coolant flow,(w þ)00¼1:22,and D T cl ¼271K,as shown in the temperature distributions of Fig.10.8.2Variable adiabatic wall temperature T aw (y )However,if the coolant is discharged continuously along the blade,at the temperature of the coolant locally T cl (y ),then even with the assumption of a constant film effectiveness h ad and a constant gas temperature T g ,T aw will also become a function of (y ).The coolant flow locally will now be assumed of the form m cl ¼m cl,in1Àr fcy Hhi where r fc is the fraction of the entering coolant flow that is used in total for film cooling.It may be shown that the gradient of the coolant temperature along the blade now becomes d T cld(y =H )¼Q 000(T g ÀT cl )1À(r fc y =H )where Q 000¼X (1Àh ad )½1þX (1þBi tbc þBi met ) (w )000and the analysis now carries a triple prime (000).This equation may be integrated to give the coolant temperature distribution T g ÀT cl T g ÀT cl,in¼1Àr fcy H h i q 000and the blade temperature distribution may also beobtained asT g ÀT be T g ÀT cl,in¼R 1Àr fcy H h i q 000(11)Fig.9Effect of filmcoolingFig.10Effect of metal thickness,TBC,and film coolingTurbine blade cooling 349where q000¼Q000=r fc andR¼h ad(1þXBi met)þX(1þBi tbc)1þX(1þBi metþBi tbc)Putting T be at y¼H equal to the maximum allow-able metal temperature in equation(11)then yields q000,Q000,and the non-dimensional coolantflow, (wþ)000.A calculation for a thin-walledfilm-cooled blade,with h ad¼0:4,Bi met¼Bi tbc¼0,and r fc¼0:5, now yields the non-dimensional massflow as (wþ)000¼1:74;the coolant massflow is increased when compared with the case of section8.1,that of constant adiabatic wall temperature,for which (wþ)00was found to be1.39.9THE EFFECT OF GAS TEMPERATURE VARYING ALONG THE BLADE SPAN9.1Analysis for the blade temperaturedistribution T b(y)In practice,the stagnation temperature of the hot gas delivered from the combustion chamber varies along the blade span.It has become customary to allow for this with an empirical expression of the formT g,maxÀT g,in¼K comb(T g,inÀT comp)where T g,max is the maximum gas temperature, T g,in¼T g,out the gas temperature at the root(and also the tip)of the blade,K comb an empirical con-stant,and T comp the compressor delivery tempera-ture.For thefirst,cooled turbine row T cl,in may be taken as the same as T comp,neglecting any changes in temperature in the cooling supply ducts and across the turbine disc.It is assumed that the distri-bution of inlet gas temperature is parabolic,of the formT g¼aþbyHþcyH2where a¼T g,in¼T g,out and b¼Àc¼4(T g,maxÀT g,in)¼4K comb(T g,inÀT cl,in).In general,K comb is of the order of0.1.It is taken as small for the purpose of the following illustrative analysis,coupling this with the assumption that k is also small(which,as explained in section2,leads to linear distributions of T b and T cl when T g is constant).For simplicity,the effect of the variation of T g with y on the Ainley-type solution is obtained here for convective cooling and for Bi met¼Bi tbc¼0.It may easily be extended to allow forfinite h ad and non-zero values of Bi met,and Bi tbc.The coolant temperature along the span is assumed to be given by a power seriesT cl¼dþeyHþfyH2þgyH3þÁÁÁwhere d¼T cl,in.The heat transfer equation is then written in the formwþd T cld(y=H)¼X(T bÀT cl)¼f(T gÀT cl)so thatfwþaþbyHþcyH2ÀT cl,inþeyHþfyH2þgyH3þÁÁÁ¼eþ2fyþ3gy2þÁÁÁIt follows that e¼(f=wþ)(aÀd),f¼(f=2wþ) (bÀe),g¼(f=3wþ)(cÀf),etc.After some algebraic calculations,and ignoring terms in(f=wþ)2,etc.,it may be shown that the (non-dimensional)coolant temperature is given byT clÀT cl,inT g,inÀT cl,in¼fwþyHþK combfwþÂ2yH2À43yH3(12) and the(non-dimensional)blade temperature byT bÀT cl,inT g,inÀT cl,in¼(1Àf)þf2wþyHþ4K comb(1Àf)yHnþf22wþÀ(1Àf)ÂyH2Àf23wyH3(13)The blade outlet temperature at y¼H may then be written in the formT g,inÀT b,outT g,inÀT cl,in¼fÀf2wþ1þ23K comb(14)However,if T b,out is assumed here to be the highest allowable temperature T b,max,then equation(14)is an expression for the cooling effectiveness10,and350J H Horlock and L Torbidoniso the non-dimensional coolantflowrate iswþ¼½1þ(2=3))K comb f2fÀ10(15)Plots of the non-dimensional blade temperature (T bÀT cl,in)=(T g,inÀT cl,in)are shown in Fig.11,for various values of K comb¼(T g,maxÀT g,in)=T g,inÀT cl,in); generally,T b is increased by K comb as is the rate at which it increases along the span,up to about y=H¼0:5.However,the slope d T b=d y begins to decrease more rapidly at higher y=H(the cubic terms in equations(12)and(13)become important). For the purpose of these illustrative calculations, made for the‘bare’thin-walled blade with convective cooling,the maximum blade temperature was low-ered to T b¼1000K,with T g and T cl being held at their previous values of1700and700K,respectively. The required non-dimensional massflow is increased from wþ¼6:4for K comb¼0(i.e.constant T g)to wþ¼6:83for K comb¼0:1.9.2The maximum value of the blade temperature In the analysis of the last section,it has been implied in the definition of10used within equation(15)that the maximum value of the blade temperature T b occurs at y¼H,as is the case when the gas tempera-ture T g is constant as in the earlier cases considered. The validity of this assumption when K comb is non-zero is now investigated.From equation(13)for T b(y),the slope d T b=d(y=H) may be obtained asd T b d(y=H)¼f2wþ(T g,inÀT cl,in)þ4(T g,maxÀT g,in)(1Àf)1À2yHh inþf2wþyHÀf2wþyH2For this slope to be zero at y¼H,i.e.for T b to be amaximum there,4(T g,maxÀT g,in)¼f2(T g,inÀT cl,in)(1Àf)wthat is4K comb¼f2(1Àf)wþand inserting the expression for wþobtained above,equation(15),it follows that the critical value ofK comb isK comb¼341þ23(fÀ10)(1Àf)0:5À1()For the values of f¼0:8and10¼0:7used in theexample of section9.1,it follows that K comb shouldbe equal to0.116for d T b=d(y=H)to be zero at theend of the blade(y¼H),and this is illustrated inFig.11.For lower values of K comb,the highest valueof T b is reached at y¼H.For values of K comb greaterthan the critical value,maximum values of T b occurwithin the blade length.10SUMMARY OF THE CALCULATIONSA summary of the calculations using the method ofthis paper,as described in the preceding sections,is given in Table1.Thefirst three calculations show that allowing forfinite conductivity in the blade walls,firstly bythickening the metal wall and secondly by adding aTBC,is to increase the resistance to heat transferand reduce the amount of heat transferred to thecoolant(wþD T cl,as given in the last column ofTable1).Thickening the metal increases the requiredcoolantflow,but the addition of TBC then reduceswþ.However,the fourth calculation shows thata Fig.11Effect of variable entry gas temperatureTable1Summary of the calculationsB met B tbc h adT b,outorT be,out(K)wþD T cl(K)Heattransferredas wþD T cl(K)Notes0001100 2.782506950.25001100 6.341006340.250.201100 3.621505430.250.201057 6.3489564000.41100 1.39318442T aw constant0.250.20.41100 1.22271331T aw constant000.41100 1.74318553T aw(y)Turbine blade cooling351。
Turbine rotor blade tip
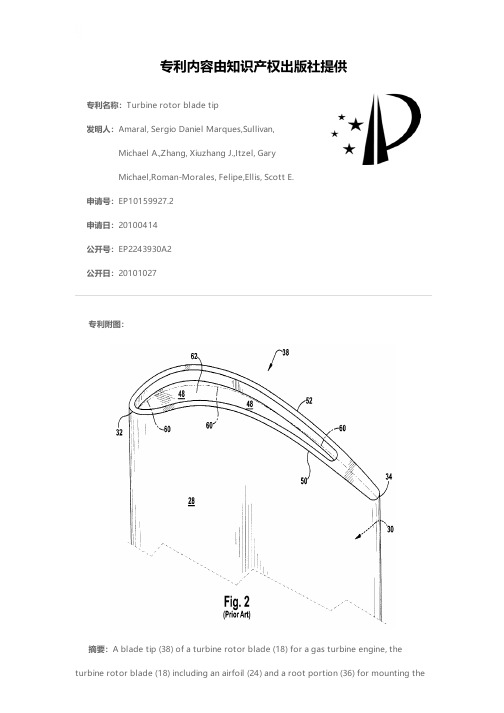
专利名称:Turbine rotor blade tip发明人:Amaral, Sergio Daniel Marques,Sullivan,Michael A.,Zhang, Xiuzhang J.,Itzel, GaryMichael,Roman-Morales, Felipe,Ellis, Scott E.申请号:EP10159927.2申请日:20100414公开号:EP2243930A2公开日:20101027专利内容由知识产权出版社提供专利附图:摘要:A blade tip (38) of a turbine rotor blade (18) for a gas turbine engine, theturbine rotor blade (18) including an airfoil (24) and a root portion (36) for mounting theairfoil (24) along a radial axis to a rotor disk (16) inboard of a turbine shroud (20), a pressure sidewall (28) and a suction sidewall (30) that join together at a leading edge (32) and a trailing edge (34), the pressure sidewall (28) and suction sidewall (30) extending from the root portion (36) to the blade tip (38), and a squealer tip cavity (62) formed at the blade tip (38), the blade tip (38) including a trailing edge trench (72) originating at an aft end of the squealer tip cavity (62), wherein the trailing edge trench (72) generally extends toward the trailing edge (34) of the blade tip (38).申请人:General Electric Company地址:1 River Road Schenectady, NY 12345 US国籍:US代理机构:Gray, Thomas更多信息请下载全文后查看。
A TURBINE BLADE OR A TURBINE VANE FOR A GAS TURBIN
专利名称:A TURBINE BLADE OR A TURBINE VANE FORA GAS TURBINE发明人:GOSSILIN, Ralph,HESELHAUS, Andreas申请号:EP18702067.2申请日:20180108公开号:EP3545171B1公开日:20201104专利内容由知识产权出版社提供摘要:The invention relates to a turbine blade (10) or turbine vane (20) for a gas turbine, comprising successively along a radial direction of said gas turbine, a root (12) for attaching the turbine blade (10) or turbine vane (20) to a carrier, a platform (14), an aerodynamically shaped hollow airfoil (15) comprising a suction side wall and a pressure side wall extending with respect to the direction of a hot gas flow (16) from a common leading edge (18) to common a trailing edge (22) and extending transversely thereof from said platform (14) to an airfoil tip (24), wherein the airfoil (15) comprises at least one cooling cavity (30) extending in accordance to a cooling fluid flow direction from a platform level (17) to said airfoil tip, said at least one cooling cavity (30) being in fluid connection with a number of cooling fluid outlets (38) distributed along the trailing edge (22) through an array (34) of impingement cooling features located there between. To provide a turbine blade or turbine vane which is easy to manufacture and which enables sufficient cooling of the fillet in the vicinity of the airfoil trailing edge it is proposed that, said array (34) extends into a region (37) which is located radially outside the airfoil (15) within the platform (14) comprising also said impingement cooling features.更多信息请下载全文后查看。
风力发电机叶片研究的英语PPT演讲

02
Types of Wind Turbine Blades
Composite Blades
Made from a combination of materials such as glass fiber, carbon fiber, and epoxy resin
Have a longer lifespan compared to metal blades
Have a high strength to weight ratio, which allows them to stand high windows and produce more energy
Are more expenses to produce but have lower maintenance costs
Wind energy has been used for centers to pump water and grind grain, but modern wind turbines were developed in the 20th century Since then, wind turbine technology has advanced significantly, leading to increased power output, improved efficiency, and reduced cost
01
Introduction
Background of Wind Energy
Wind energy is a renewable energy source that harmesses the power of the wind to generate electricity It has the potential to provide a significant share of the world's energy needs while reducing greenhouse gas emissions and other environmental impacts
turbine blade strength analysis report

turbine blade strength analysis reportI. IntroductionTurbine blades are critical components in modern power generation systems. Their performance and durability are directly related to the strength of the blades. This report aims to analyze the strength of a specific turbine bladeusing various computational methods and provide recommendations for improving its strength.II. Materials and MethodsA. Blade DescriptionThe turbine blade under analysis is a 3-stage axial compressor blade with a diameter of 200 mm and a length of 250 mm. It is made of high-strength superalloy and has a complex shape with numerous airfoil sections.B. Strength Analysis Methods1. Finite Element Method (FEM)Using FEM software, we created a 3D model of the blade and analyzed its strength under various loads, including bending, shear, and fatigue. We also simulated the impact of thermal cycling and analyzed its effect on the blade strength.2. Strength of Materials TheoryUsing strength of materials theory, we conducted static analysis to determine the maximum load that the blade couldwithstand before failure. We also performed fatigue crack propagation analysis to assess the lifespan of the blade.3. Experimental TestingWe conducted static and fatigue testing on a physical mockup of the blade to verify the computational results andto identify any potential weaknesses in the blade design.III. ResultsA. FEM ResultsUnder static loading, the blade showed good resistance to bending and shear, with a maximum stress of 85% of the material's ultimate strength. However, under fatigue loading, the blade showed signs of stress corrosion, which could lead to premature failure.B. Strength of Materials Theory ResultsBased on strength of materials theory, the blade could withstand a maximum load of approximately 150 kN before failure under static loading conditions. However, due to the presence of fatigue cracks, the lifespan of the blade was expected to be significantly reduced.C. Experimental ResultsThe experimental testing confirmed the computational results and identified several areas where the blade design could be improved, including reducing stress concentrationsat certain locations and improving fatigue resistance through modifications to the airfoil section.IV. ConclusionBased on the analysis conducted, it can be concluded that the turbine blade under analysis has good static strength but exhibits poor fatigue resistance, which could lead to premature failure. To improve its durability, modifications need to be made to the blade design, including reducingstress concentrations and improving fatigue resistance. Additionally, it is recommended to conduct further testing to verify the effectiveness of these modifications and ensure the safety of the turbine system as a whole.V. Recommendations1. Perform further testing on the modified blade design to verify its strength and durability.2. Consider using alternative materials or manufacturing techniques to improve the fatigue resistance of the blade.3. Implement measures to reduce stress concentrations in critical areas of the blade design.。