24 ColorChecker value
色彩亮度计

色彩亮度计CS-200色彩亮度计CS-200色度计可测量大尺寸等离子显示器、小型LCD和LED、户外屏幕、高压灯和仪表盘等各种发光产品的辉度和色度。
06年春季推出的新产品上将配备可以高精度测量低辉度的新型自动模式。
这种新推出的自动测量模式,可以根据测量物的辉度自动选择测量速度。
该功能特别适用于测量低辉度物体,可有效避免因测量速度导致测量精度不理想的现象。
采用这种自动测量模式,可以自动选择最佳测量速度以便最大限度地发挥CS-200所拥有的测量功能,轻松获得高精度的测量结果。
类型测量辉度、色度和相关色彩,用于研发和检查。
主要用途各种光学设备(如LCD、PDP、有机EL和FED),以及光源(如LED和灯)。
色彩亮度计- 通过传感器测量肉眼所见颜色色彩亮度计CS-200特征使用分光功能可对灯、显示器等测量物实施高精度的辉度、色度、相关色温方面的测量。
用途为了完成对LED、LCD、PDP、灯和新一代显示器的有机EL、FED方面的R&D或检查,可使用本品进行辉度、色度、相关色的测量。
产品介绍精确度近似分光辐射度计的光源入射色度计CS-200可以实现堪比分光镜型仪器的高精确度辉度和色度测量,同时保留了三刺激型仪器简单、易用和实惠的特点。
CS-200配备40个传感器,并使用与肉眼灵敏度相符的光谱灵敏度特性曲线(等色函数)进行计算。
通过这种最新开发的光谱拟合方法,可以获取较传统三刺激式色度计更为准确的三刺激值(红、绿、蓝的XYZ),实现卓越的精确度。
可以对大范围的辉度级别(从0.01 cd/m2的低辉度到20,000,000cd/m2的高辉度,测量角度为0.1°)进行测量。
可选择三种测量角度:1°、0.2°和0.1°。
可根据被测目标(从显示设备或其它需测量大面积的物体到汽车音频控制面板、汽车仪表盘和小型LCD等需测量小面积的物体)切换测量角度。
应用领域所有类型的光源都可使用CS-200进行测量,例如信号灯、红绿灯、机场照明、灯、LED、显像管、LCD、PDP等几乎所有发光的物体。
摄像头图像测试(以Imatest等为主要工具)项目及简介

高规 四角解析度最大差异
CIF
VGA
50
1.3M
100
2M
150
3M
150
5M
边缘
中心 边缘
1000
1500 1200
1100
1600 1400
200
8M
200
Colorcheck
• • 色彩还原测试 将24色色卡置于灯箱正面中心,色卡中心与边缘照度不大于10%。调节摄像 模组位置,使摄像模组正对色卡中心,并使标板占据模组预览画面75%以上, 待图像稳定后拍照。
•
• •
测试摄像模组Camera的噪点情况,4个数值R,G,B,Y都必须小于1,以D65色温 作分析即可,D65光源下,0.3M~2M要求<1.5%,3M以上<1% 由下面的图片可知R:0.40,G:0.37,B:0.59,Y:0.32 RGBY Noise数值很小表示摄像头模组的噪点小
Colorcheck
SFR
• MTF50
解析度判断标准:
解析度(lw/ph)
像素
区域 中心 边缘 中心 边缘 中心 边缘 中心 边缘 中心 边缘 中心 常规 200 150 300 200 600 500 800 600 950 800 1200 200 150 350 250 650 550 850 650 1000 850 1400
Stepchart选择区 域
Stepchart
• • • 对比度:(最高亮度-最低亮度)/255 例如(240.3-4.3)/255=0.93(93%) 最好是大于80%
Stepchart
• 平均亮度:有两种表示,一是将所 有亮度相加除以20;另一种是取中 间阶亮度再加上前后阶亮度做平均 ;这两个值越接近越好。 灰阶分辨率:前一灰阶亮度减下一 灰阶亮度必须大于8,并且有任一 阶小于0,如:240.3221.2=19.1>8,计算出所有大于8 的个数,所取得的个数就是可区分 级数。 判定标准如右图 像素
24色色卡及imatest个测试项说明
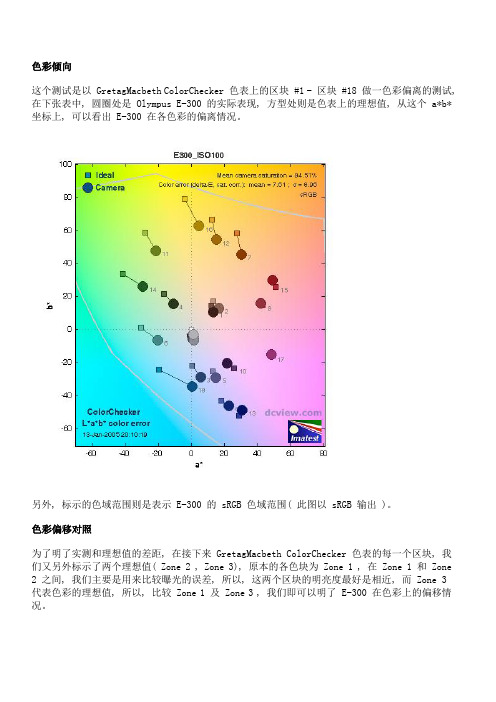
色彩倾向这个测试是以 GretagMacbeth ColorChecker 色表上的区块 #1 - 区块 #18 做一色彩偏离的测试, 在下张表中, 圆圈处是 Olympus E-300 的实际表现, 方型处则是色表上的理想值, 从这个 a*b* 坐标上, 可以看出 E-300 在各色彩的偏离情况。
另外, 标示的色域范围则是表示 E-300 的 sRGB 色域范围( 此图以 sRGB 输出 )。
色彩偏移对照为了明了实测和理想值的差距, 在接下来 GretagMacbeth ColorChecker 色表的每一个区块, 我们又另外标示了两个理想值( Zone 2 , Zone 3), 原本的各色块为 Zone 1 , 在 Zone 1 和 Zone 2 之间, 我们主要是用来比较曝光的误差, 所以, 这两个区块的明亮度最好是相近, 而 Zone 3 代表色彩的理想值, 所以, 比较 Zone 1 及 Zone 3 , 我们即可以明了 E-300 在色彩上的偏移情况。
另外, 在白平衡的误差上, 我们主要是 HSV 色彩模式中的彩度值( 上图褐色数值 ), 以及Kelvin 的色温值 ( 上图蓝色数值 ) 以及 Mireds( Mireds = 10^6 /(Degrees Kelvin) ) 表示。
噪声测试接下来, 我们分别来看 E-300 在 ISO 100 - ISO 800 的噪声表现, 这个图表请网友先阅读左下的区块, 这是我们取GretagMacbeth ColorChecker色表上最后一排的灰阶区块来测试( 共有 6 个区块 ), 分别代表从相片的亮部、中间调及暗部, 在 R、G、B、Y 的噪声表现。
( E-300未开启噪声抑制, 从右下区块可知, 噪声抑制开启时, 曲线会很陡、下降的很快;左上是色表最后一排的灰阶区块明度位置校正, 蓝色圈圈是理想值, 绿色叉叉是我们拍摄的实际值;右上角则是浓度的校正 )E300 @ISO 100噪声细节下列的图表只做为噪声测试上的一个参考, 因为上列我们已经做了 GretagMacbeth ColorChecker 第四排的灰阶测试了, 一般的网站也只有做到上述的部份, 以下, 我们是取GretagMacbeth ColorChecker色表第三排的 BGRYMC 六个主要颜色, 分别观察, RGB 色频及 Y 明度的噪声表现, 结果如下:E300 @ISO 100R/B 色频的噪声较高从 RGB 三个色频来看,E-300 的 R、B 色频的噪声往往高于 G 色频,在各 DSLR 中,像是 Canon 的 20D 亦有此情况发生,倒是 Nikon 的 D70 ,在 ISO 200, ISO 400 时,相对而言,R、G、B 色频的噪声表现较一致化。
著名的24色色卡
调整后
调整前
通过图像对比可以看出,对爱色丽ColorChecker24色色卡作人工的调整,修正了图像石膏的发灰和比较暗淡的状态,使石膏更有层次了,同时,水果更加饱和一些了。可见,用简单直接对比和修正的方法,就可以使图像好很多。
一张照片,我们可以完全凭借眼睛的观察和个人的好恶去调整,但作为需要精确还原物体本来颜色的要求时,能用爱色丽ColorChecker24色色卡作为参照可以调整的颜色标准,无疑对调整工作是有很大帮助的。
6.
bluish green
1.719
-33.397
-0.199
2.5BG
7 / 6
7.
Orange
214
126
44
62.661
36.067
57.096
5YR
6 / 11
8.
Purplish blue
80
91
166
40.02
10.41
-45.964
7.5PB
4 / 10.7
9.
Moderate red
测试环境:
物品:标准灰背景静物等
相机:canon 1D mark3
镜头:TS-E 90-28mm
灯光:布朗broncolor minicom-80闪灯+柔光罩及反射伞三组
拍摄格式:RAW
Raw软件:adobe photoshop lightroom2
对比软件:adobe photoshop CS4
DNG制作软件:DNG Profile Editor
193
90
99
51.124
48.239
16.248
2.5R
5 / 10
ColorCalculator_User_Guide
ColorCalculator User GuidebyOSRAM Sylvania, Inc.ContentsI. Overview (3)II. Installation and Program Files (3)1. Windows Version (3)2. Mac OS X Version (5)III. Main Modes of Operation (6)1. General Photometry (6)2. Design Optimization (8)3. Total Combinations (9)IV. Other Functionality (10)1. Filters (10)2. Color Quality Scale (CQS) (11)3. Colors (11)4. Delta(uv) (12)5. R-Values Plots (12)6. Subtract Blue Peak (13)7. Other Plot Types (15)a. Spectrum Plots (15)b. CIE Plots (15)c. Matching Plots (15)d. CIELa*b* Plots (16)e. Color Rendering Plots (16)8. Other Features (17)a. Generic Pure Color LEDs (17)b. Gaussian Peak (18)ColorCalculator User GuideI. OverviewThe ColorCalculator software was developed by Osram Sylvania, Inc to help users design color mixing LED lighting solutions. The software has three main modes of operation along with several other useful features. The main start-up window is shown in Figure 1.The three main modes of operation are:1)General photometry.-The user either selects the intensity of several LEDs or inputs a spectrum and the program calculates several photometric quantities.2)Design optimization.- A set of desired photometric values are specified by the user and the program calculates the intensity of the LEDs required to obtain the design.3)Total combinations.-The user specifies a set of LEDs and the program calculates all of the designs possible based on this selection.The photometric quantities are derived from equations given in CIE documents 13.3 and 15.2II. Installation and Program FilesThe program is completely self-contained in the ColorCalculator.exe file, no other files or dll’s are needed. The executable can be moved to any directory or copied to any computer without having to be installed. The program will create several file when run. These files have names such as: ColorCalculator.ini, userSpectra.spec, userFilters.fils, photometry.txt. All of the files created by this program are in plain text can be viewed in a standard text editor but should not be changed by the user. Other files may be created but with user defined names.1.Windows VersionThe downloaded file is a self-extracting zip file. Save it you your hard drive and double-click. Select the folder you want to save the program in. Two files will be saved: ColorCalculator.exe and ColorCalculator_User_Guide.pdf (a copy of this document).The files the program writes are written to the directory where the ColorCalculator.exe is located. You may want to put the ColorCalculator.exe in a central location and create Windows shortcuts to this exe in other folders. Then you can edit the “Start in:” directory of the shortcut so that all files will be written to the directory where the shortcut is located. In the example below the shortcut name is ColorCalc. You can put shortcuts in several directories and edit each shortcut so the “Start in” points to the local directory where the shortcut is. This is helpful if you are working on several different projects with different design requirements. See Windows help for more information on working with shortcuts.2.Mac OS X VersionThe Mac version runs in X Windows (X11). You may need to install the X11 libraries if they are not already installed. X Windows (X11) can be installed using the MacOS installation DVD. Double-click on “Install Mac OS X”, click on Utilities button, choose X11; or one can download it as a standalone installer from (/downloads/macosx/apple/macosx_updates/x11formacosx.html).The download file is ColorCalculator.dmg. Open this file and save the two files within, ColorCalculator (the executable) and ColorCalculator_User_Guide.pdf (a copy of this document). You start the program by double-clicking the executable in Finder.If you save the executable to any directory, all of files the programs writes will be written to your home directory. This is probably not the most desirable method. If you create a folder called ColorCalculator_OSI in your home directory then all of the files the program writes will be written to this folder. This if the preferred method since it will keep the ColorCalculator files separate from all other files. You can also launch the program from a terminal prompt. If you launch it from a terminal prompt you can specify a directory where all of the files will be written. The command would be:> ColorCalculator /jhs1/cc_runsThis will run the ColorCalculator program and write all of the files to the /jhs1/cc_runs directory. This method is the only one that allows you to control which directory the files will be written to. You can make a script file that you can run by double-clicking in the following way.1)Open a text editor and type the following two lines into it and save it as a .command file(something like mand) in your home directory.#!/bin/sh/Users/jhs1/ColorCalculator/ColorCalculator cc_runswhere “/Users/jhs1/ColorCalculator/”is the full path to the ColorCalculatorexecutable and“cc_runs” is the directory you want the program to run in.2)Open Finder and create an alias to this file (mand)3)From a terminal window change the permissions of the .command file file (mand) so itcan be executed.>chmod 777 mandIII. Main Modes of OperationNot all of the available menu commands will be discussed in details here. Most of them should be fairly obvious to the experienced designer or may be best understood by trying them. Also, if you let your mouse pointer hover over an input box many of the input boxes have a small pop-up help description.Figure 1. Main window at start-up.1.General PhotometryThe user selects the LEDs to include in the design (by checking them), enters the dominate wavelengths and the intensities. The intensity can be entered as watts or lumens and these can be mixed. Once the design is entered the “Calculate” button is clicked and the results are displayed in the window and the resultant spectrum is displayed in the table. The spectra from the individual LEDs are combined together additively to give the spectrum of the mix. By default, the photometry results are also written to a text file called “photometry.txt” in the directory where the ColorCalculator.exe is located.The user can also enter a spectrum directly into the table. This is done by first selecting the “Direct spectrum input” as the “Analysis type” and pasting the spectrum into the table. You can enter thespectrum at predefined wavelength intervals or in a free format. The wavelength intervals can be selected from the menu item “Data->Spectrum from….”. If the “Data->Free format spectrum” is used then the program will interpolate the entered data to the calculation points. The free format spectrum is useful when importing data from photometric sphere measurements where the data is not measured at regular intervals.Once a design has been entered it can be saved for later use. To save a spectrum first perform a calculation then click the menu item “User Spectra->save as user spectrum”. You will be prompted to enter a name and a LPW. Entering the LPW is optional, you may leave this blank. All of the user spectra you save are written to a file called “userSpectra.spec” in the directory where the ColorCalculator.exe file is located. The “userSpectra.spec” file is in plain text and can be viewed in any standard text editor. Under the “User Spectra” menu item are several other functions useful in maintaining and manipulating your saved spectra.The program can read certain file formats directly without the user having to cut-and-paste the data by hand. The program can read data files from the SpecWin and SpectraSuite software packages. You can encode the drive current and forward voltage in the filename and the program will parse these out and calculate the LPW and include this information in the photometry.xls file. Example files names are “test_led_3.1V_50mA.isd”, “test led 3.1V 50mA.isd” and “test led 50mA 3.1V.isd”. The important feature is that you must use ”V” to indicate the forward voltage and “mA” to indicate the drive current, with no space between the number and the symbol. Both must be surrounded by ether underscores or spaces or be at the beginning or end of the file name for this feature to work.2.Design OptimizationThe user selects several LEDs to include in a design, specifies a set of photometric targets and the program adjusts the intensity of the LEDs to reach the target design. It is best to first find a design that is reasonably close to your target, as described in the previous section. In Figure 2 the optimization method is “Target a CRI”. The target CRI is defined as 80 with a CCT within 50K of 3000K and a Delta(uv) of 0.002. Also, a minimum R9 of 40 is specified. Only some of these parameters need to be specified. If an input box is left blank it will not be constrained. Once you click the “Calculate” button the program will prompt you to enter any required values that you left blank. In order to optimize for the LPW, the LPW of all of the LEDs included in the design must be specified. You will be prompted if any are missing.If your optimization is successful the new intensity values will be copied to the correct input boxes for you to run a complete calculation. If you do not like the design you may return to the original intensity values by clicking the “Reset values” button. If the optimization is not successful you may need to relax some of the optimization constraints, begin with a better design or add more LEDs to the design.While design optimization is a very powerful tool it may not be the best approach to find a desirable design. One of the drawbacks is that it gives you only one “best” design. There may be a design that is very close to the “best” but has some advantages that would lead you to select it over the “best” design if you were aware of it.Figure 2. Portion of the main window used to define the optimization targets.3.Total CombinationsThis method is a brute force method. Instead of finding the one “best” design that meets a set of user-defined parameters it finds all designs that meet the parameters. It calculates all of the possible combinations of the selected LEDs over a given intensity range and a very loose set of photometric parameters. It writes all of the designs to a text file for the user to manually scan through. The file is tab delimited and can be opened in Excel or other database programs. Once the designs have been run through the user can view all of the designs and make trade-offs that a strict optimization process does not allow.This method is started with the “Other options->Run combinations” menu item. A new window, Figure 3, is opened and the details of the combination run can be specified here.Figure 3. Combination run window.The user checks the LEDs to include, the minimum and maximum number of LEDs to include in a given design and some basic photometric values. In the window shown in Figure 3 the run will include a total of 5 LEDs but only consider designs with between 2 and 4 LEDs. The intensity of each LED will be varied in steps of 2% and all designs with a CCT between 2500K and 5000K, and CRI above 80, any R9 and a delta(uv) less than 0.0020 will be written to a file. The total number of designs to calculate is35,178,525. This set of parameters ran in less than 1 minute on a standard Windows PC and only 187 designs were found that met the photometric parameters. The user can then open the result file in Excel and evaluate the designs. If a very large number of designs are found there is a basic filtering function built into the program. Click the “Filter” button and you can specify a CCT range, CRI, R9 and delta(uv) to create a new file with your refined selection criteria. The original file is not effected by this and can be re-filtered as many times as desired.IV. Other Functionality1.FiltersA filter is used in some applications to control some aspect of the light. You can enter and save a filter much in the same way as a spectrum can be saved. To enter a filter select the “Filter input” “Analysis type” and paste your transmission data directly into the table, click the “Calculate” button to have the program check the data. You can then use the “User Filters” menu item to save or manipulate your userfilters as you would your user spectra. The transmission is defined as between 0.0 and 1.0 not as a percent. The saved filters are saved to a plain text file called “userFilters.fils”.If you use filters it is helpful to create a user spectrum that has a value of 1.0 for the intensity at all wavelengths. This can be used to check your filters by selecting the constant spectrum and a filter. The resultant plot will be a plot of the transmission of the filter.2.Color Quality Scale (CQS)The Color Quality Scale is being developed by NIST (National Institute of Science and Technology) as a possible replacement for the Color Rendering Index (CRI) for use with LED light sources. A full description of the CQS is given in W. Davis, Y. Ohno, Optical Engineering, v49(3), 033602 (March 2010). The user can switch back-and-forth between the CRI and CQS using the radio buttons towards the bottom of the main window as highlighted below.3.ColorsThe individual values in the CRI and CQS scales (R1-R14 and Q1-Q15) give a measure as to how well the test source will render a color as compared to the reference source (a black body at the same CCT). The individual colors in the CRI and CQS scales were chosen for their general applicability. However, in some cases, you may want to see how a different color will be rendered. To do this you can define a “user color”. A user color is defined by entering the spectral reflectance representing the color. The measure of how well this color will be rendered compared to the reference source will be calculated using the CQS formulation and written to the “photometry.txt” file for each user color checked. The user colors can be managed in the same manner as the user filters. The reflectance is defined as between 0.0 and 1.0 not as a percent. The saved colors are saved to a plain text file called “userColors.cols”.4.Delta(uv)The delta(uv) is a measure of the distance an x,y point is from the black body locus in u-v space. For “white” light you generally want delta(uv) to be below 0.0020. If you have x,y data and want to plot it on a CIE diagram or calculate the CCT or delta(uv) values you can click the “D(uv)” button near the top of the main window. A new window will open where you can enter your data and have the program plot your points and calculate the desired values. This can also be used to plot more than one point on the CIE diagram.If you have several spectra you want to plot at the same time you can take the following steps. After a calculation click the “x,y” button near the top of the main window. This will save the x,y data for the spectrum that was just calculated. Repeat this for as many spectra as you wish, click the “D(uv)” button, and in the new window that opens click the “x,y” button. The saved x,y pairs will be written into the table. Then click the “calculate” button to plot the data.You can clear the saved x,y pairs by clicking the “Data->Clear all saved x,y values” menu item on the main window or by restarting the program.5.R-Values PlotsYou can make a plot of the R-values or Q-values, depending on which metric is selected. After a calculation click the button circled in red below.You will see a plot similar to the one below (Figure 4).Figure 4. R-value plot.You can plot the R-values from several spectra on the same plot by saving the R-values by clicking the button circled in red below. You can clear the saved R-values by clicking the “Data->Clear all saved R-values” menu item on the main window or by restarting the program.6.Subtract Blue PeakThe “Subtract blue peak” option will automatically fit the blue peak and subtract it from the spectrum. The amount of watts in the fitted blue peak and the remaining peak (called the phosphor peak) will be reported in the output. The spectrum without the blue peak will be plotted as a solid black line so theuser can see the fit and evaluate if it is reasonable. The calculated watts in each peak are usually good to within 10%. These values only are meaningful for LED sources.Figure 5. Spectrum with the blue peak fit.7.Other Plot Typesa.Spectrum PlotsYou can save the plot of a spectrum to a file as a bitmap image. To save the spectrum click the button circled in red below. A window will open with only the spectrum plot in it. You can resize the plot and save it to a file.b.CIE PlotsYou can save the plots of the CIE diagram to a file as a bitmap image. To save the CIE diagram click the button circled in red below. A window will open with only the CIE diagram plot in it. You can resize the plot and save it to a file. There are several options in the menu of this window that allow you to tailor the plot in many ways. The display of the MacAdam ellipses can also be controlled in this window.c.Matching PlotsIf you check the “Matching->Matching mode” menu item a new column will be added to the table. You can paste a spectrum into the column labeled “Matching”. When you calculate the spectrum this “matching” plot will also be plotted. You can also select to use the photopic curve as the matching spectrum by checking the appropriate box in the “Matching” menu item.d.CIELa*b* PlotsYou can make and save CIELa*b*plots of either the CRI or CQS colors to a file as a bitmap image. To save the CIELa*b*plot click the button circled in red below. A window will open with only theCIELa*b*plot in it. You can resize the plot and save it to a file.Figure 6. CIELa*b* plot of the 14 R-values for the reference and test light source.e.Color Rendering PlotsHow well each color is rendered can be seen using the “color patch” plot, Figure 7. The plot can be seen using the “Other plots->Show color patches of R, Q or user colors” menu item. You can also show user colors using the “Plot type” menu item. Note the colors are only approximate and are rendered as sRBG assuming a gamma of 2.2 and normalized to 100 lumens.Figure 7. Color patch plot of the 15 Q-values for the reference and test light source.8.Other Featuresa.Generic Pure Color LEDsYou can also display what are called “generic pure color LEDs“ in additional to the standard packaged LEDs shown by default. You can control what types of LEDs are displayed with the “Other options” menu item. By default the generic pure color LEDs are hidden. These are mainly of interest to designers using the “Total combinations” method previously described. These LEDs have their peak shapes defined by Gaussian fits. Each peak is represented by a fit of three individual Gaussians which were derived by fitting to experimental data. The peak shapes change with the dominate wavelength. When these LEDs are shown the “Total combinations” window looks as shown below. In addition to the standard LEDs you can chose these generic LEDs and include the wavelength variation in a combinations run.Black Body SpectraYou can display the spectrum of a black body. This can then be saved as a user spectrum or used as a matching plot.b.Gaussian PeakYou can have the program generate a simple Gaussian peak to represent an LED. Click the “User Spectra->Generate Gaussian based user spectrum” menu item. You can then enter the peak center, the peak width (FWHM) and a name and the program will generate the spectrum and add it to your userspectra.。
各种颜色的rgb值

常用颜色的RGB值及中英文名称枫叶留言系统——首页#FFB6C1 LightPink 浅粉红#FFC0CB Pink 粉红#DC143C Crimson 深红/猩红#FFF0F5 LavenderBlush 淡紫红#DB7093 PaleVioletRed 弱紫罗兰红#FF69B4 HotPink 热情的粉红#FF1493 DeepPink 深粉红#C71585 MediumVioletRed 中紫罗兰红#DA70D6 Orchid 暗紫色/兰花紫#D8BFD8 Thistle 蓟色#DDA0DD Plum 洋李色/李子紫#EE82EE Violet 紫罗兰#FF00FF Magenta 洋红/玫瑰红#FF00FF Fuchsia 紫红/灯笼海棠#8B008B DarkMagenta 深洋红#800080 Purple 紫色#BA55D3 MediumOrchid 中兰花紫#9400D3 DarkViolet 暗紫罗兰#9932CC DarkOrchid 暗兰花紫#4B0082 Indigo 靛青/紫兰色#8A2BE2 BlueViolet 蓝紫罗兰#9370DB MediumPurple 中紫色#7B68EE MediumSlateBlue 中暗蓝色/中板岩蓝#6A5ACD SlateBlue 石蓝色/板岩蓝#483D8B DarkSlateBlue 暗灰蓝色/暗板岩蓝#E6E6FA Lavender 淡紫色/熏衣草淡紫#F8F8FF GhostWhite 幽灵白#0000FF Blue 纯蓝#0000CD MediumBlue 中蓝色#191970 MidnightBlue 午夜蓝#00008B DarkBlue 暗蓝色#000080 Navy 海军蓝#4169E1 RoyalBlue 皇家蓝/宝蓝#6495ED CornflowerBlue 矢车菊蓝#B0C4DE LightSteelBlue 亮钢蓝#778899 LightSlateGray 亮蓝灰/亮石板灰#708090 SlateGray 灰石色/石板灰#1E90FF DodgerBlue 闪兰色/道奇蓝#F0F8FF AliceBlue 爱丽丝蓝#4682B4 SteelBlue 钢蓝/铁青#87CEFA LightSkyBlue 亮天蓝色#87CEEB SkyBlue 天蓝色#00BFFF DeepSkyBlue 深天蓝#ADD8E6 LightBlue 亮蓝#B0E0E6 PowderBlue 粉蓝色/火药青#5F9EA0 CadetBlue 军兰色/军服蓝#F0FFFF Azure 蔚蓝色#E0FFFF LightCyan 淡青色#AFEEEE PaleTurquoise 弱绿宝石#00FFFF Cyan 青色#00FFFF Aqua 浅绿色/水色#00CED1 DarkTurquoise 暗绿宝石#2F4F4F DarkSlateGray 暗瓦灰色/暗石板灰#008B8B DarkCyan 暗青色#008080 Teal 水鸭色#48D1CC MediumTurquoise 中绿宝石#20B2AA LightSeaGreen 浅海洋绿#40E0D0 Turquoise 绿宝石#7FFFD4 Aquamarine 宝石碧绿#66CDAA MediumAquamarine 中宝石碧绿#00FA9A MediumSpringGreen 中春绿色#F5FFFA MintCream 薄荷奶油#00FF7F SpringGreen 春绿色#3CB371 MediumSeaGreen 中海洋绿#2E8B57 SeaGreen 海洋绿#F0FFF0 Honeydew 蜜色/蜜瓜色#90EE90 LightGreen 淡绿色#98FB98 PaleGreen 弱绿色#8FBC8F DarkSeaGreen 暗海洋绿#32CD32 LimeGreen 闪光深绿#00FF00 Lime 闪光绿#228B22 ForestGreen 森林绿#008000 Green 纯绿#006400 DarkGreen 暗绿色#7FFF00 Chartreuse 黄绿色/查特酒绿#7CFC00 LawnGreen 草绿色/草坪绿#ADFF2F GreenYellow 绿黄色#556B2F DarkOliveGreen 暗橄榄绿#9ACD32 YellowGreen 黄绿色#6B8E23 OliveDrab 橄榄褐色#F5F5DC Beige 米色/灰棕色#FAFAD2 LightGoldenrodYellow 亮菊黄#FFFFF0 Ivory 象牙色#FFFFE0 LightYellow 浅黄色#FFFF00 Yellow 纯黄#808000 Olive 橄榄#BDB76B DarkKhaki 暗黄褐色/深卡叽布#FFFACD LemonChiffon 柠檬绸#EEE8AA PaleGoldenrod 灰菊黄/苍麒麟色#F0E68C Khaki 黄褐色/卡叽布#FFD700 Gold 金色#FFF8DC Cornsilk 玉米丝色#DAA520 Goldenrod 金菊黄#B8860B DarkGoldenrod 暗金菊黄#FFFAF0 FloralWhite 花的白色#FDF5E6 OldLace 老花色/旧蕾丝#F5DEB3 Wheat 浅黄色/小麦色#FFE4B5 Moccasin 鹿皮色/鹿皮靴#FFA500 Orange 橙色#FFEFD5 PapayaWhip 番木色/番木瓜#FFEBCD BlanchedAlmond 白杏色#FFDEAD NavajoWhite 纳瓦白/土著白#FAEBD7 AntiqueWhite 古董白#D2B48C Tan 茶色#DEB887 BurlyWood 硬木色#FFE4C4 Bisque 陶坯黄#FF8C00 DarkOrange 深橙色#FAF0E6 Linen 亚麻布#CD853F Peru 秘鲁色#FFDAB9 PeachPuff 桃肉色#F4A460 SandyBrown 沙棕色#D2691E Chocolate 巧克力色#8B4513 SaddleBrown 重褐色/马鞍棕色#FFF5EE Seashell 海贝壳#A0522D Sienna 黄土赭色#FFA07A LightSalmon 浅鲑鱼肉色#FF7F50 Coral 珊瑚#FF4500 OrangeRed 橙红色#E9967A DarkSalmon 深鲜肉/鲑鱼色#FF6347 Tomato 番茄红#FFE4E1 MistyRose 浅玫瑰色/薄雾玫瑰#FA8072 Salmon 鲜肉/鲑鱼色#FFFAFA Snow 雪白色#F08080 LightCoral 淡珊瑚色#BC8F8F RosyBrown 玫瑰棕色#CD5C5C IndianRed 印度红#FF0000 Red 纯红#A52A2A Brown 棕色#B22222 FireBrick 火砖色/耐火砖#8B0000 DarkRed 深红色#800000 Maroon 栗色#FFFFFF White 纯白#F5F5F5 WhiteSmoke 白烟#DCDCDC Gainsboro 淡灰色#D3D3D3 LightGrey 浅灰色#C0C0C0 Silver 银灰色#A9A9A9 DarkGray 深灰色#808080 Gray 灰色#696969 DimGray 暗淡灰#000000 Black 纯黑。
各种颜色的rgb值
常用颜色的RGB值及中英文名称枫叶留言系统——首页#FFB6C1 LightPink 浅粉红#FFC0CB Pink 粉红#DC143C Crimson 深红/猩红#FFF0F5 LavenderBlush 淡紫红#DB7093 PaleVioletRed 弱紫罗兰红#FF69B4 HotPink 热情的粉红#FF1493 DeepPink 深粉红#C71585 MediumVioletRed 中紫罗兰红#DA70D6 Orchid 暗紫色/兰花紫#D8BFD8 Thistle 蓟色#DDA0DD Plum 洋李色/李子紫#EE82EE Violet 紫罗兰#FF00FF Magenta 洋红/玫瑰红#FF00FF Fuchsia 紫红/灯笼海棠#8B008B DarkMagenta 深洋红#800080 Purple 紫色#BA55D3 MediumOrchid 中兰花紫#9400D3 DarkViolet 暗紫罗兰#9932CC DarkOrchid 暗兰花紫#4B0082 Indigo 靛青/紫兰色#8A2BE2 BlueViolet 蓝紫罗兰#9370DB MediumPurple 中紫色#7B68EE MediumSlateBlue 中暗蓝色/中板岩蓝#6A5ACD SlateBlue 石蓝色/板岩蓝#483D8B DarkSlateBlue 暗灰蓝色/暗板岩蓝#E6E6FA Lavender 淡紫色/熏衣草淡紫#F8F8FF GhostWhite 幽灵白#0000FF Blue 纯蓝#0000CD MediumBlue 中蓝色#191970 MidnightBlue 午夜蓝#00008B DarkBlue 暗蓝色#000080 Navy 海军蓝#4169E1 RoyalBlue 皇家蓝/宝蓝#6495ED CornflowerBlue 矢车菊蓝#B0C4DE LightSteelBlue 亮钢蓝#778899 LightSlateGray 亮蓝灰/亮石板灰#708090 SlateGray 灰石色/石板灰#1E90FF DodgerBlue 闪兰色/道奇蓝#F0F8FF AliceBlue 爱丽丝蓝#4682B4 SteelBlue 钢蓝/铁青#87CEFA LightSkyBlue 亮天蓝色#87CEEB SkyBlue 天蓝色#00BFFF DeepSkyBlue 深天蓝#ADD8E6 LightBlue 亮蓝#B0E0E6 PowderBlue 粉蓝色/火药青#5F9EA0 CadetBlue 军兰色/军服蓝#F0FFFF Azure 蔚蓝色#E0FFFF LightCyan 淡青色#AFEEEE PaleTurquoise 弱绿宝石#00FFFF Cyan 青色#00FFFF Aqua 浅绿色/水色#00CED1 DarkTurquoise 暗绿宝石#2F4F4F DarkSlateGray 暗瓦灰色/暗石板灰#008B8B DarkCyan 暗青色#008080 Teal 水鸭色#48D1CC MediumTurquoise 中绿宝石#20B2AA LightSeaGreen 浅海洋绿#40E0D0 Turquoise 绿宝石#7FFFD4 Aquamarine 宝石碧绿#66CDAA MediumAquamarine 中宝石碧绿#00FA9A MediumSpringGreen 中春绿色#F5FFFA MintCream 薄荷奶油#00FF7F SpringGreen 春绿色#3CB371 MediumSeaGreen 中海洋绿#2E8B57 SeaGreen 海洋绿#F0FFF0 Honeydew 蜜色/蜜瓜色#90EE90 LightGreen 淡绿色#98FB98 PaleGreen 弱绿色#8FBC8F DarkSeaGreen 暗海洋绿#32CD32 LimeGreen 闪光深绿#00FF00 Lime 闪光绿#228B22 ForestGreen 森林绿#008000 Green 纯绿#006400 DarkGreen 暗绿色#7FFF00 Chartreuse 黄绿色/查特酒绿#7CFC00 LawnGreen 草绿色/草坪绿#ADFF2F GreenYellow 绿黄色#556B2F DarkOliveGreen 暗橄榄绿#9ACD32 YellowGreen 黄绿色#6B8E23 OliveDrab 橄榄褐色#F5F5DC Beige 米色/灰棕色#FAFAD2 LightGoldenrodYellow 亮菊黄#FFFFF0 Ivory 象牙色#FFFFE0 LightYellow 浅黄色#FFFF00 Yellow 纯黄#808000 Olive 橄榄#BDB76B DarkKhaki 暗黄褐色/深卡叽布#FFFACD LemonChiffon 柠檬绸#EEE8AA PaleGoldenrod 灰菊黄/苍麒麟色#F0E68C Khaki 黄褐色/卡叽布#FFD700 Gold 金色#FFF8DC Cornsilk 玉米丝色#DAA520 Goldenrod 金菊黄#B8860B DarkGoldenrod 暗金菊黄#FFFAF0 FloralWhite 花的白色#FDF5E6 OldLace 老花色/旧蕾丝#F5DEB3 Wheat 浅黄色/小麦色#FFE4B5 Moccasin 鹿皮色/鹿皮靴#FFA500 Orange 橙色#FFEFD5 PapayaWhip 番木色/番木瓜#FFEBCD BlanchedAlmond 白杏色#FFDEAD NavajoWhite 纳瓦白/土著白#FAEBD7 AntiqueWhite 古董白#D2B48C Tan 茶色#DEB887 BurlyWood 硬木色#FFE4C4 Bisque 陶坯黄#FF8C00 DarkOrange 深橙色#FAF0E6 Linen 亚麻布#CD853F Peru 秘鲁色#FFDAB9 PeachPuff 桃肉色#F4A460 SandyBrown 沙棕色#D2691E Chocolate 巧克力色#8B4513 SaddleBrown 重褐色/马鞍棕色#FFF5EE Seashell 海贝壳#A0522D Sienna 黄土赭色#FFA07A LightSalmon 浅鲑鱼肉色#FF7F50 Coral 珊瑚#FF4500 OrangeRed 橙红色#E9967A DarkSalmon 深鲜肉/鲑鱼色#FF6347 Tomato 番茄红#FFE4E1 MistyRose 浅玫瑰色/薄雾玫瑰#FA8072 Salmon 鲜肉/鲑鱼色#FFFAFA Snow 雪白色#F08080 LightCoral 淡珊瑚色#BC8F8F RosyBrown 玫瑰棕色#CD5C5C IndianRed 印度红#FF0000 Red 纯红#A52A2A Brown 棕色#B22222 FireBrick 火砖色/耐火砖#8B0000 DarkRed 深红色#800000 Maroon 栗色#FFFFFF White 纯白#F5F5F5 WhiteSmoke 白烟#DCDCDC Gainsboro 淡灰色#D3D3D3 LightGrey 浅灰色#C0C0C0 Silver 银灰色#A9A9A9 DarkGray 深灰色#808080 Gray 灰色#696969 DimGray 暗淡灰#000000 Black 纯黑。
显色指数 re rf rg
显色指数 re rf rg
显色指数是指一种用来评价光源对物体颜色外貌影响的指标。
它是用来描述光源对物体颜色还原能力的一个重要参数。
在国际上,显色指数一般用CRI(Color Rendering Index)来表示,它是用来
描述光源对物体颜色还原能力的一个重要参数。
CRI的取值范围是0
到100,数值越大表示光源对物体颜色的还原能力越好。
一般来说,CRI大于80的光源可以较好地还原物体的颜色,而CRI大于90的
光源则可以实现较高的颜色还原能力。
而re、rf和rg则是CIE(国际照明委员会)制定的一种标准
光源的参数。
re代表了光源的颜色偏差,rf代表了光源的饱和度偏差,rg代表了光源的颜色偏差。
这些参数可以帮助我们更全面地了
解光源的颜色还原能力,从而选择适合的光源来满足不同场景下的
需求。
总的来说,显色指数re、rf和rg是用来描述光源对物体颜色
还原能力的重要参数,通过这些参数我们可以更好地选择合适的光
源来满足不同场景下的需求。
希望这些信息能够帮助你更好地理解
显色指数及其相关参数。
edid color characteristics 运算 -回复
edid color characteristics 运算-回复EDID(扩展显示识别数据)是一种在计算机系统中用于传输显示器信息的标准协议。
其中一个重要方面是色彩特性。
本文将详细介绍EDID色彩特性的计算过程,包括相关术语和公式,以及如何使用这些数据来优化显示效果。
第一步:了解基本概念和术语在计算EDID色彩特性之前,我们需要了解一些基本概念和术语。
1. RGB (红绿蓝) 三原色: 这是一种通过混合红色、绿色和蓝色来创建各种颜色的方式。
在EDID中,我们处理的是RGB色彩空间。
2. 白平衡: 这是一种调整显示器颜色以确保准确显示中性颜色的过程。
它涉及调整红色、绿色和蓝色的强度和比例。
3. 色温: 色温是显示器发出的光的颜色。
它以开尔文(K)为单位表示,其中较低的色温(如2700K)表示较暖的颜色,而较高的色温(如6500K)表示较冷的颜色。
第二步:获取EDID色彩数据了解基本概念后,我们需要获取显示器的EDID色彩数据。
这些数据通常由操作系统提供或通过显示器设置菜单中的高级选项查看。
第三步:解析EDID色彩数据一旦获取了EDID色彩数据,我们需要解析这些数据以提取有关显示器色彩特性的信息。
EDID数据是以十六进制格式表示的,所以我们需要将其转换为十进制以进行进一步的计算。
第四步:计算白平衡和色温在解析EDID色彩数据之后,我们可以计算显示器的白平衡和色温。
下面是计算白平衡的步骤:1. 获取EDID数据中的红色、绿色和蓝色亮度数据,通常以8位数字表示(范围为0-255)。
2. 将这些数字转换为百分比形式(范围为0-100)。
3. 根据白平衡公式,计算红色、绿色和蓝色的白平衡系数。
白平衡公式示例:白平衡系数= (色彩值/ 最大色彩值) * 100根据相同的概念,我们可以计算色温。
以下是计算色温的步骤:1. 获取EDID数据中的色温数据,通常以10位数字表示(范围为2500-10000)。
2. 使用以下公式将色温转换为开尔文:开尔文= (色温数据/ 100) + 2.5第五步:优化显示效果在得到白平衡和色温数据之后,我们可以使用这些数据来优化显示器的显示效果。
led视觉效应参数显色指数

led视觉效应参数显色指数
LED视觉效应参数中的显色指数是指CRI(Color Rendering Index),也称为色彩再现指数。
CRI是评价光源对物体颜色再现能
力的指标,它描述了光源照射下物体的颜色与在自然光下的颜色之
间的差异程度。
CRI的取值范围是0到100,数值越高表示光源对物体颜色的再
现能力越好,即颜色更真实。
一般来说,CRI大于80的光源被认为
能够满足大部分室内照明需求,而CRI大于90的光源则能够提供非
常高质量的颜色再现。
然而,CRI并不是完全全面的评价标准,它主要关注光源对一
组标准颜色样本的再现能力,而忽略了对非标准颜色的表现。
因此,在一些特殊应用场景中,还需要考虑其他的颜色指标,如TLCI (Television Lighting Consistency Index)等。
此外,LED视觉效应参数还包括光通量、色温、色坐标等。
光
通量是指光源发出的总光功率,单位是流明(lm),表示光源的亮度。
色温是指光源的颜色特性,常用单位是开尔文(K),表示光源
的冷暖程度,如暖白光(2700K-3000K)、自然白光(4000K-4500K)
和冷白光(6000K-6500K)等。
色坐标是用来描述光源颜色的数值,常用的色坐标系统有CIE 1931和CIE 1976等。
综上所述,LED视觉效应参数中的显色指数是指CRI,它是评价光源对物体颜色再现能力的指标。
除了CRI,还有其他参数如光通量、色温和色坐标等也是重要的视觉效应参数,它们共同决定了LED光源的视觉效果。
led检测 彩色 原理

led检测彩色原理
LED检测彩色的原理基于RGB颜色模型,即通过调整红(R)、绿(G)和蓝(B)三种颜色LED的亮度,可以混合成不同的颜色。
具体来说,每种颜色由特定的波长范围表示,红、绿、蓝三种颜色的波长范围分别为纳米、纳米和纳米。
通过调整这三种颜色的比例,可以创造出几乎任何所需的颜色。
例如,当红、绿、蓝三种颜色的亮度相同,混合后就会得到白色。
LED检测彩色时,通常使用色度计来测量颜色的色坐标或色温、亮度等参数。
色坐标是描述颜色的两个维度,通常用x和y来表示,其值在CIE色度图上表示。
色温则描述了LED的颜色质量,与黑体辐射相比,描述了光源发出
的光的颜色。
在检测LED彩色时,需要注意色彩一致性和色彩还原性。
色彩一致性是指
在不同时间点或不同生产批次中,相同规格的LED发出光的颜色的一致性。
色彩还原性是指LED发光的颜色能够真实地反映被照明物体的颜色。
此外,为了确保检测结果的准确性,需要注意色度计的校准和准确使用。
同时,也需要了解不同LED生产工艺、材料等对检测结果的影响。
edid color characteristics 运算 -回复
edid color characteristics 运算-回复edid color characteristics 运算是指通过计算机软件对EDID(扩展显示标识数据)中的颜色特性进行分析和处理的过程。
EDID是一种包含有关显示器的基本信息的数据结构,其中包括分辨率、刷新率和色彩空间等参数。
运算EDID颜色特性可以帮助用户了解显示器的颜色性能,提高图像质量,并在进行图像处理和校准时提供准确的参考。
首先,了解EDID的组成可以帮助我们理解运算EDID颜色特性的相关过程。
EDID是通过显示器和计算机之间的DVI、HDMI或DisplayPort等接口传输的一个128字节的数据块。
其中包含了关于该显示器的各种信息,例如厂商ID、产品ID和支持的分辨率和刷新率。
此外,EDID还包括了有关颜色特性的详细信息,如色彩空间和色温。
在进行EDID颜色特性运算之前,我们首先需要获取EDID数据。
这可以通过在计算机上运行一个EDID读取软件来完成,该软件可以从显示器接口读取EDID信息并保存为一个二进制文件。
接下来,我们需要使用专门的软件来分析和处理EDID中的颜色特性数据。
运算EDID颜色特性的第一步是解析EDID数据并提取有关颜色性能的信息。
这可以通过读取EDID中的特定字节来完成,例如字节86至89保存了红、绿、蓝和白色点的色度坐标。
根据这些数据,软件可以计算出显示器的色彩空间范围和准确度。
接下来,我们可以使用这些信息来评估显示器的颜色性能。
这可以通过与标准色彩空间(例如sRGB或Adobe RGB)进行比较来完成。
通过计算色彩空间重叠的百分比,我们可以了解显示器在各种颜色模式下的表现。
此外,我们还可以通过计算显示器的色度误差来评估其颜色准确度。
通过与预定的色度坐标进行比较,我们可以计算出显示器对每种颜色的偏差。
除了评估显示器的颜色性能外,运算EDID颜色特性还可以用于校准显示器。
通过分析EDID数据,软件可以生成校准配置文件,以调整显示器的颜色设置。
自然光led灯显色指数

自然光led灯显色指数
自然光LED灯的显色指数是指LED灯具产生的光线对物体颜色
的还原能力。
常见的衡量指标是使用CRI(Color Rendering Index)或者R9等指标来表示。
CRI是一种用来衡量光源对物体颜色还原能
力的指标,其数值范围在0到100之间,数值越高代表光源对物体
颜色的还原能力越好。
一般来说,自然光LED灯的CRI值在80以上
被认为是比较好的,能够比较准确地还原物体的颜色。
此外,R9指标是CRI中的一个重要参数,它表示对鲜红色的还
原能力。
对于一些需要准确还原鲜红色的场合,比如美容、医疗等
行业,R9的数值也是非常重要的。
自然光LED灯的R9数值越高,
代表其对鲜红色的还原能力越好。
除了CRI和R9外,还有一些其他的指标用来评价自然光LED灯
的显色性能,比如色温、光谱分布等。
色温是指光源的冷暖程度,
一般用单位K(开尔文)来表示,自然光LED灯的色温一般在4000K
到5000K之间,这个范围的光线被认为是比较接近自然光的。
光谱
分布则是指光源发出的光线在不同波长上的强度分布情况,光谱分
布均匀且包含丰富的波长成分的光源往往具有较好的显色性能。
总的来说,自然光LED灯的显色指数是通过一系列的指标来评价的,包括CRI、R9、色温、光谱分布等。
一个优质的自然光LED 灯应当在这些指标上表现出色彩还原能力强、色温适宜、光谱分布均匀等特点。
选择LED灯时,可以参考这些指标来判断其显色性能是否符合需求。
led视觉效应参数显色指数 -回复

led视觉效应参数显色指数-回复什么是LED视觉效应参数显色指数?LED视觉效应参数显色指数,又称为色彩还原指数或者显色指数(Color Rendering Index,简称CRI),是评价灯光对物体真实颜色呈现能力的重要指标。
它用来衡量光源对照明对象颜色的还原度,即灯光照射物体后与自然光照射物体的颜色差异程度。
CRI的范围是从0到100,数值越高表示光源对物体颜色的还原能力越强。
为什么LED视觉效应参数显色指数很重要?在我们的日常生活中,色彩起着重要的作用。
好的照明条件能够使人们更舒适地工作、学习和生活,而LED照明作为新一代照明技术,具有高效节能、长寿命和可调光等优点,因此被广泛应用在各种照明场景中。
然而,由于LED发光的特性,不同的LED灯具在对颜色还原上会存在较大差异。
灯光的颜色质量对于保证物体颜色的真实还原以及人眼的舒适感都非常重要。
因此,了解和评价LED视觉效应参数显色指数是选择合适的LED照明产品非常重要的一步。
如何确定LED视觉效应参数显色指数?确定LED视觉效应参数显色指数有两种常用的方法:通过实验测量和通过光谱分析。
实验测量是通过人眼感知不同光源下物体颜色的差异来确定显色指数。
对一系列已知颜色的标准样品,使用被测试的LED光源照射,并与标准光源照射下的样品颜色进行比较。
根据比较结果,计算出显色指数。
这种方法比较直观,能够准确地反映灯光对物体颜色的还原能力。
光谱分析则通过测量光源辐射的光谱信息,利用数学模型计算出显色指数。
这种方法更多地依赖于光谱仪等仪器设备,操作复杂、繁琐。
但它对人眼感知的不同颜色有较高的准确性和稳定性。
因此,从理论上来说,光谱分析方法可以更准确地评估LED照明产品的显色能力。
LED视觉效应参数显色指数的影响因素是什么?LED视觉效应参数显色指数受到多种因素的影响,其中最主要的因素包括光源的光谱分布、光源的颜色温度、照明环境以及物体的表面反射特性等。
光源的光谱分布是影响显色指数的关键因素。
显色指数原理和基本计算
显色指数原理和基本计算显色指数(Color Rendering Index,CRI)是评价光源对人眼感官颜色还原能力的指标,是衡量光源对各种颜色还原度的一个重要参数。
显色指数的核心原理是通过将光源照射在一系列实验颜色样本上,与标准光源照射的结果进行比较,得出颜色还原能力的数值。
下面将对显色指数的原理和基本计算方法进行详细介绍。
在显色指数的计算中,会选取一组标准光源,也称为试验光源,来模拟自然光。
这些试验光源中,R1到R8代表着光源对颜色还原的影响。
R1代表显著饱和的深红色,R2代表肤色,R3代表浅黄色,R4代表饱和的黄色,R5代表浅蓝色,R6代表浅绿色,R7代表饱和的蓝色,R8代表白色。
通过将试验光源照射在这些颜色样本上,然后与标准光源照射的结果进行比较,得出各个颜色样本的相对亮度。
显色指数的计算方法基于颜色均匀度指标(Color Gamut Index,CGI)和颜色偏差指标(Color Fidelity Index,CFI)。
CGI是通过计算试验光源和标准光源在色彩空间的距离来表示颜色饱和度的指标。
具体计算方法如下:首先,计算试验光源和标准光源在Lab颜色空间中的距离。
Lab颜色空间是一种以人眼感知为基础的三维色彩模型,其中L表示亮度,a表示红绿色度,b表示黄蓝色度。
然后,根据距离计算CGI值。
距离越小,颜色饱和度越高,CGI值越大。
CFI是通过计算试验光源和标准光源在色彩空间的颜色偏差来表示颜色还原精度的指标。
具体计算方法如下:首先,计算试验光源和标准光源在Lab颜色空间中的颜色偏差。
颜色偏差是指试验光源和标准光源产生的颜色在颜色空间中的差异程度。
然后,根据颜色偏差计算CFI值。
颜色偏差越小,颜色还原精度越高,CFI值越大。
最后,根据CGI和CFI的结果,综合计算出显色指数。
显色指数的计算公式如下:CRI=(R1+R2+R3+R4+R5+R6+R7+R8)/8其中,R1到R8代表试验光源对各个颜色样本的相对亮度。
一种基于LASSO回归模型的彩色相机颜色校正方法
一种基于LASSO回归模型的彩色相机颜色校正方法郭越;高昆;朱钧;豆泽阳;黄亚东;冯云鹏【摘要】Color correction is the essential safeguard method to keep the image color constancy for a color camera.In traditional color correction methods,the color calibration coefficients are mostly obtained by the polynomial regression model,whose correction accuracy is often insufficient.So a high order polynomial fitting method based on LASSO (Least Absolute Shrinkage and Selection Operator) regression model is proposed,considering that LASSO can compress the polynomial coefficients efficiently to guarantee the model complexity and improve the correction precision as well.The experiments are conducted using D65 standard light source and ColorChecker 24 as the imaging object.The results characterized by CIELAB color difference function show that compared with traditional linear regression and quadratic polynomial regression methods,the images corrected by LASSO method has a better effect,with the mean color difference value about 5.%彩色相机的颜色校正是实现成像色彩一致性的必要保障手段.传统的相机颜色校正中,对测量数据多采用多项式回归分析来确定颜色定标系数,存在着精度不高的缺点,因此,本文对测量数据提出了基于LASSO的高阶多项式回归拟合方法,利用LASSO压缩系数的特点,在保证计算复杂度的前提下,有效提高了回归模型的校正精度.在D65标准光源下对Color-Checker 24色卡进行了实际成像实验,并用CIELAB色差公式表征了校正效果,实验结果表明,新方法的校正效果明显优于传统的线性回归、二次多项式回归方法,平均色差指标可以达到5个CIELAB色差单位.【期刊名称】《影像科学与光化学》【年(卷),期】2017(035)002【总页数】9页(P153-161)【关键词】颜色校正;LASSO回归;多项式回归【作者】郭越;高昆;朱钧;豆泽阳;黄亚东;冯云鹏【作者单位】北京理工大学光电成像技术与系统教育部重点实验室,北京100081;北京理工大学光电成像技术与系统教育部重点实验室,北京100081;清华大学精密仪器与机械学系,北京100084;北京理工大学光电成像技术与系统教育部重点实验室,北京100081;北京理工大学光电成像技术与系统教育部重点实验室,北京100081;北京理工大学深圳研究院,广东深圳518057【正文语种】中文人类的颜色感知主要由物体反射率决定,在不同光照条件下观察到的物体颜色是恒定不变的,即具有色恒定性[1]。
色彩测试标板24色卡colorchecker卡
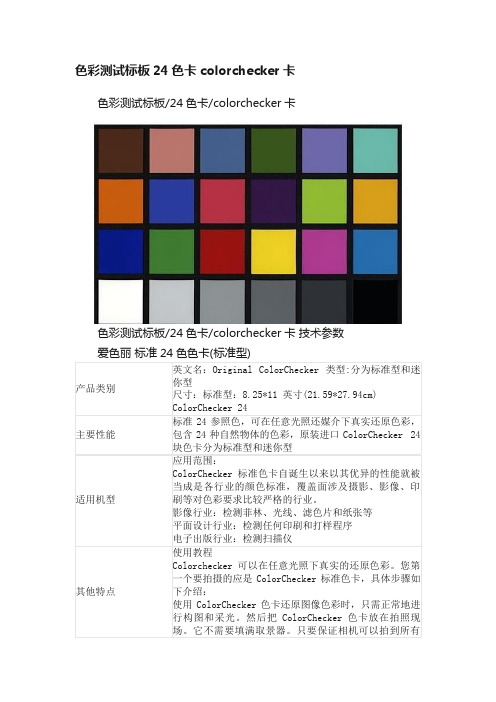
色彩测试标板24色卡colorchecker卡色彩测试标板/24色卡/colorchecker卡色彩测试标板/24色卡/colorchecker卡技术参数爱色丽标准24色色卡(标准型)的色块。
并且它位于构图中有代表性的部分而不是处于阴影中或是在曝光过度的高光位置,就可以另外要检查其它物体反射的颜色没有投到色卡上,然后,进行拍照,当此图像在Photoshop中被打开时,会有一个内置式的参照点。
用取色器对其中的黑色块取样。
红.绿.蓝色彼此间差值应在7个单位内,并且色值应约为50。
尽管黑色色块很深,由于它是退光色,因而不会被认做纯黑色。
对白色块进行同样程序,白色块应是很淡,但不是纯白色,其红.绿.蓝色值各应约为245。
工作完成得差不多了,最后,我们要检查色偏,选择中间灰色色块。
红.绿.蓝色值应约为128。
相互之间差不应超过7点。
如果读数十分偏离,应用水平或曲线调回上述状态。
然后保存更改的设定,以便应用于以此设置拍摄的其它图像。
进一步的视觉色彩匹配可用其余色块进行。
注意:应使用经过校正的显示器,并且ColorChecker色卡应置于可控制照明条件的标准光源下。
ColorChecker 可以搭配PM5等专业软件可以生成属于相机本身的ICC文件。
具体步骤参照相关的资料。
下面仅提供PM5的的部分要求。
§在自然跟可控制光线下拍摄色卡的时候,注意调整好适当的角度,不要让让光线直接通过色卡反射到镜头当中,也不要让其他物体反射的颜色投到色卡上,这样有可能造成比较大的偏差,并且让PM5在计算icc的时候出现较大的错误;§尽可能采用手动精确白平衡进行白平衡的锁定,可以采用灰平衡卡、白平衡卡等等。
§曝光要控制好,可以打开直方图观察,并调整曝光补偿,注意让白色块的色值达到210 –245之间方为理想。
而对于黑色块的要求,可以不必理会,因为对于宽容度比较大的机型来说,当白色块达到210-245的量度的时候,黑色块已经不太可能小于23了,反而对于宽容度较小的机子却容易做到。
24色卡的标准值 -回复
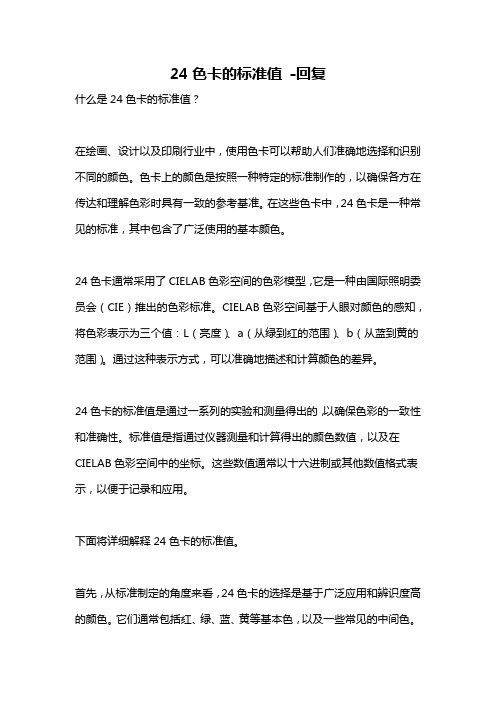
24色卡的标准值-回复什么是24色卡的标准值?在绘画、设计以及印刷行业中,使用色卡可以帮助人们准确地选择和识别不同的颜色。
色卡上的颜色是按照一种特定的标准制作的,以确保各方在传达和理解色彩时具有一致的参考基准。
在这些色卡中,24色卡是一种常见的标准,其中包含了广泛使用的基本颜色。
24色卡通常采用了CIELAB色彩空间的色彩模型,它是一种由国际照明委员会(CIE)推出的色彩标准。
CIELAB色彩空间基于人眼对颜色的感知,将色彩表示为三个值:L(亮度)、a(从绿到红的范围)、b(从蓝到黄的范围)。
通过这种表示方式,可以准确地描述和计算颜色的差异。
24色卡的标准值是通过一系列的实验和测量得出的,以确保色彩的一致性和准确性。
标准值是指通过仪器测量和计算得出的颜色数值,以及在CIELAB色彩空间中的坐标。
这些数值通常以十六进制或其他数值格式表示,以便于记录和应用。
下面将详细解释24色卡的标准值。
首先,从标准制定的角度来看,24色卡的选择是基于广泛应用和辨识度高的颜色。
它们通常包括红、绿、蓝、黄等基本色,以及一些常见的中间色。
这些颜色被认为在各种应用中普遍存在,例如印刷品、电子设备、产品包装和广告设计等。
其次,为了得到准确的标准值,制作24色卡需要使用高精度的色彩测量仪器。
这些仪器可以测量并记录色彩的光谱反射率,然后将其转化为CIELAB色彩空间中的数值。
测量过程中还会考虑光线和观察角度的影响,以提供尽可能准确的结果。
在使用24色卡时,人们可以通过比较物体上的颜色和色卡上对应颜色的标准值,来判断和选择最匹配的颜色。
这在设计和印刷领域非常重要,因为它能够帮助人们在不同环境下保持一致的色彩呈现。
此外,24色卡的标准值还被广泛应用于色彩配方和校色过程中。
通过比较样品和标准值,可以计算出它们的颜色差异,并作出相应的调整。
这种精确的颜色管理可以确保在不同批次生产中产生一致的色彩效果,从而提高产品质量的稳定性和可靠性。
色差lab值测试标准 -回复

色差lab值测试标准-回复Lab色彩空间是一种常用的色彩空间,用于量化和描述物体颜色。
Lab是一个三维空间,其中包含亮度(L)和两个色度轴:绿-红(a)和蓝-黄(b)。
这种色彩空间提供了一种精确的方法来测量颜色,并用于许多应用领域,例如颜色匹配、图像处理和显示器校准。
本文将详细介绍Lab色彩空间的测量标准和相关知识。
首先,我们需要了解Lab色彩空间的测量标准。
Lab色彩空间的测量标准由国际标准化组织(ISO)规定,即ISO 7719。
该标准定义了用于测量物体颜色的工具和设备的要求,以确保颜色测量的准确性和一致性。
在Lab色彩空间中,亮度(L)轴表示物体的明暗程度,取值范围从0到100,其中0表示黑色,100表示白色。
色度轴(a和b)表示物体在绿-红和蓝-黄方向的偏移程度。
色度值(a和b)的取值范围从负无穷大到正无穷大。
要测量物体的Lab值,我们需要使用特定的设备,如色彩测量仪(colorimeter)或光谱仪(spectrophotometer)。
这些设备能够测量物体反射或透射的光谱,并将其转换为Lab色彩空间中的数值。
在进行颜色测量之前,我们需要校准测量设备。
校准是一项重要的步骤,用于确保测量结果的准确性和一致性。
校准通常涉及使用已知Lab值的标准样品进行比对,并调整设备的设置以匹配标准。
这样可以消除设备和环境因素对测量结果的影响,确保测量的准确性。
测量过程中,我们将测量设备放置在待测物体的表面,并记录测量结果。
测量结果以Lab值的形式呈现,其中L代表亮度,a代表绿-红轴上的偏移,b代表蓝-黄轴上的偏移。
通过比对不同物体的Lab值,我们可以准确地描述它们之间的色差。
色差是指两个或多个物体之间颜色差异的度量。
在Lab色彩空间中,色差可以通过计算待测物体Lab值与参考物体Lab值之间的欧氏距离来确定。
欧氏距离表示两个颜色之间的空间距离,可用于量化颜色之间的差异。
计算色差的方法有多种,常见的有欧式距离法和CIEDE2000(CIE Delta E 2000)方法。
