Sele
SELE_SQL练习
SELE_SQL
根据要求,写出完整的SELECT-SQL命令(注意:各题中所涉及的数据表均与书本一致)
1. 显示学生表中学号以“04”开头的学生情况。
2、查询CJ表中每门课的课程代号和最高分。
3、显示成绩表中及格的学生的学号、课程代号和成绩,按学号排序。
4、基于XS表,查询各系的男女人数,要求输出系代号、性别和人数, 并按人数排序。
5、基于XS表,CJ表查询各个学生的总成绩,要求输出XH,XM,平均成绩,总成绩, 总成绩不低于480分,结果按总成绩降序排序。
6、基于XS表,CJ表查询03级学生总成绩前3名的学生。
要求输出字段为:xh,xm,xb,总成绩,查询结果按总成绩降序排序。
7、基于XS表、CJ表、KC表查询学生成绩情况,要求输出XH,XM,KCDH,KCM,CJ,查询结果按成绩降序排列。
8、查询教师表中各系的男女教师人数,输出:XDH,XB,人数
9、查询教师表中各系的男女教师人数,输出:XDH,男教师数,女教师数
10、基于教师表查询没有担任课程的教师情况,输出:GH,XM(子查询)。
SELE操作指南

SELECTRA-E 全自动生化仪操作指南一.仪器起动前的准备打开位于生化仪主机背面和制冷单元前面板上的电源开关,顺便检查蒸馏水是否充足?废液桶是否要倒空?打印机是否准备好?打开计算机电源进入WINDOWS 界面,双击生化仪图标,自动建立仪器通讯设置和打印机设置窗口,启动分析仪控制软件,屏幕进入主菜单,当自检后屏幕上显示:分析仪状态:STAND-BY (待机状态) 测量方式:MONO 试剂盘:标准 申请样品数/测定样品数 :***/*** 日期/时间主菜单特殊功能比色盘/仪器VITALAB SELECTRA-E 安装编程维护保养质量控制评估样品申请样品装载样品在主菜单中按ALT+F10,仪器将紧急停车。
这种情况常见于仪器运转失常、样品或试剂准备不足以及仪器台面上有障碍物等情况。
仪器停机后运行复位(RESET )操作即可继续工作。
复位操作的方法如下:主菜单下按F5,F1,回车,F1,仪器进入复位状态,约两分钟后仪器恢复“STAND-BY (待机)”。
在主菜单中按CTRL+F10,仪器将退出主菜单,返回到WINDOWS 界面。
为方便用户正确使用这台仪器,下面将仪器常见的六种状态(ANALYZER STATUS )予以介绍:STAND-BY :待机状态,此时仪器准备就绪,随时开始工作或进行其它。
RESETTING :复位状态,即仪器进行复位操作时的状态。
BLANKING :测空白状态,当仪器进行比色盘空白测定时所处的状态。
ACTIVE :工作状态,当仪器接到“开始工作”的命令后所处的状态。
INACTIVE :非工作状态,由于仪器或人为原因使机器处于不能工作的状态。
HALTED :停机状态,当由于紧急情况而在主菜单下同时按下ALT+F10键时仪器所处的状态。
本仪器可完成的测定方式有:MONO ,单试剂方式;DUAL ,双试剂方式。
二.常规操作1.应用F8,F9和F7三个功能键即可进行常规样品的测定。
2.在主菜单中按F9,F5, 检查试剂量,如不够用应添加足够的试剂并按F2(CONFIRM REFILL)向仪器确认重新充满试剂。
结构化查询语言(SQL)
结构化查询语言〔SQL〕SQL概述SQL的内容在笔试和上机考试中均占到大约30%的比例,此外它还是查询和视图的根底,因此是学习的重点也是难点。
SQL是结构化查询语言Structure Query Language的缩写。
SQL包含了查询功能、数据定义、数据操纵和数据控制功能,在VFP中没有提供数据控制功能。
SQL主要特点1.SQL是一种一体化语言。
2.SQL是一种高度非过程化的语言。
3.SQL语言非常简洁。
4.SQL语言可直接以命令方式交互使用,也可嵌入到程序设计语言中以程序方式使用。
查询功能SELECT命令的特点:1.可以自动翻开数据库、表文件加以查询,而不需要事先用OPEN DATABASE或USE命令翻开。
2.可以直接选取数据表中的数据,而不需要事先用SET RELATION命令建立关联。
3.当需要的索引文件不存在时,会自动建立暂存索引文件,以支持快速搜索技术〔Rushmore〕来查询。
4.其查询结果可输出到文件、表、屏幕或报表上,还可以转换成统计图表。
命令格式:SELECT ——FROM ——WHERE可与LIST FIELDS——FOR ——对照学习。
关系操作:投影,选择,联接。
说明:功能强大,语法灵活;要处理的数据表无须事先翻开,通过FROM子句指明并翻开。
1.SELECT 短语:说明要查询的数据;对应的关系操作为投影,类似于FIELDS子句。
2.FROM 短语:说明要查询的数据来自哪个或哪些表,可对单个表或多个表进行查询;3.WHERE 短语:说明查询条件;对应的关系操作为选择,类似于FOR子句。
如是多表查询还可能过该子句指明联接条件,进行联接。
4.GROUP BY 短语:用于对查询结果进行分组,可利用它进行分组汇总;类似于TOTAL命令。
5.HA VING 短语:跟随GROUP BY 使用,它用来限定分组必须满足的条件;6.ORDER BY 短语:用于对查询的结果进行排序;类似于SORT 命令。
随机突变文库构建与筛选研究进展

随机突变文库构建与筛选研究进展随机突变文库的构建是通过对目标基因或蛋白质进行随机突变,从而产生一个具有广泛多样性的突变体文库。
该文库可用于进一步筛选和研究目标基因或蛋白质的功能和特性。
化学诱变法:通过化学诱变剂处理DNA,使其发生随机突变。
转座子法:利用转座子在基因组中插入、删除或替换序列,从而产生随机突变。
同源重组法:利用同源重组原理,将外源基因随机插入细胞基因组中,从而产生随机突变。
高通量测序法:通过对大量基因组进行测序,发现基因中的随机突变,从而构建突变文库。
筛选是通过对随机突变文库中的突变体进行筛选,找出影响目标基因或蛋白质功能的关键突变体,从而研究其功能和特性。
含量测定法:通过检测突变体中目标蛋白质的含量,筛选出具有高表达量的突变体。
活细胞筛选法:通过对细胞生长、存活和代谢等指标进行检测,筛选出具有特定生物学表型的突变体。
测序法:通过对突变体进行测序,找出影响目标基因或蛋白质功能的关键突变序列。
功能筛选法:根据实验设计要求,通过特定筛选方法检测突变体的生物学功能,从而确定影响目标基因或蛋白质功能的关键突变体。
例如,利用双荧光杂交实验检测细胞因子的活性、利用表型筛选法检测抗药性突变等。
近年来,随着分子生物学和基因组学的快速发展,随机突变文库的构建和筛选已成为研究基因和蛋白质功能的重要工具。
尤其是以高通量测序技术为代表的技术手段,使得研究人员能够在短时间内对大量基因组进行测序和分析,快速发现基因中的随机突变。
新的筛选方法和技术也不断涌现,为随机突变文库的筛选提供了更多选择和可能性。
随机突变文库的构建和筛选是研究基因和蛋白质功能的重要工具。
随着技术的不断更新和发展,该领域的研究也将不断取得新的进展。
未来,随着更多技术和方法的涌现,相信研究人员将能够更加深入地了解基因和蛋白质的功能和特性,为解决人类面临的生物学问题提供更多思路和方法。
金黄色葡萄球菌是一种常见的病原菌,具有较强的抗药性和适应能力。
sql查询练习

1.查询全体学生的学号和姓名.select 学号,姓名from 学生2.查询全体学生的姓名,学号,所在系.select 学号,姓名,系from 学生3.查询全体学生的详细记录select * from 学生4.查询全体学生的姓名及其出生年份select 姓名,2006-年龄from 学生[意思是2008减年龄]5.查询选修了课程的学生学号select distinct学号from 选课6.查询2系全体学生的名单.select 姓名from 学生where 系=”2”7.查询所有年龄在20岁以下的学生姓名及年龄.select 姓名,年龄from 学生where 年龄<=208.查询考试成绩有不及格的学生的学号.select distinct 学号from 选课where 成绩<609.查询年龄在20~~23岁(包括20和23岁)之间的的学生的姓名,系别,年龄.select 姓名,系,年龄from 学生where 年龄between 20 and 2310.查询1系,2系,3系的学生的姓名和性别select 姓名,性别from 学生where 系别in (“1”,”2”,”3”) [in 实际上是多个or 运算符的缩写]。
我们也可以写成这样:select 姓名,性别from 学生where 系=’1’or 系=’2’or 系=’3’11.查询既不是1系,2系也不是3系的学生的姓名和性别.select 姓名,性别from 学生where 系not in (“1”,”2”,”3”)12.查询学号为s3的学生的详细情况.select * from 学生where 学号like “s3”)或者(select * from 学生where 学号=”s3”13.查询所有的姓刘的学生的姓名,学号和性别.select 姓名,学号,性别from 学生where 姓名like ‘刘%’14.查询姓”欧阳”且全名为三个字的学生的姓名.select 姓名from 学生where 姓名like “欧阳_ ”15.查询名字中第二个字为”阳”字的学生的姓名和学号.select 姓名,学号from 学生where 姓名like “ _阳%”16.某些学生选修课程后没有参加考试,所以有选课记录,但是没有考试成绩.查询缺少成绩的学生的学号和相应的课程号select 学号,课程号from 选课where 成绩is null17.查询所有有成绩的学生学号和课程号.select 学号,课程号from 选课where 成绩is not null18.(多重条件查询)查询1系年龄在20岁以下的学生姓名.select 姓名from 学生where 系=’1’and 年龄<2019.(对查询结果进行排序)查询选修了3号课程的学生的学号及其成绩,查询结果按分数的降序排列.select 学号,成绩,from 选课where 课程号=’3’ order by 成绩desc20.查询全体学生情况,查询结果按所在系的系号升序排列,同一个系的学生按年龄降序排列.select * from 学生order by 系, 年龄desc21.(使用集函数)查询学生总人数.select count(*) from 学生[count的功能是计数]22.查询选修了课程的学生的总人数.select count (distinct 学号) from 选课23.计算1号课程的学生的平均成绩.select avg(成绩) from 选课where 课程号=’1’24.查询选修1号课程的学生最高分数.select max(成绩) from 选课where 课程号=’1’25.求各个课程号及相应的选课人数.select 课程号,count(学号) from 选课group by 课程号26. 查询选修了3门以上课程的学生的学号.select 学号from 选课group by 学号having count(*)>3[这里先用group by 子句按学号分组,再用集函数count 对每一组计数.having 短语指定选择组的条件,只有满足条件(即元组的个数>3,表示此学生选修的课程超过3门)的组才会被选出来.where 子句与having 短语的区别在于作用的对象不同.where子句作用于基本表或视图,从中选择满足条件的元组.having 短语作用于组,从中选择满足条件的组.]27. 查询每个学生及其选修课程的情况。
jquery操作select

很多朋友对jq uery select的操作很有兴趣,但网上的东西太多,所以脚本之家特别将Jque ry Select操作方法整理下,方便大家查找。
需要注意的是,这里的代码好多是针对jqu ery 1.32以前的版本(以后的版本已经不支持@),所以替换为空测试下即可。
jQuery获取Selec t选择的Te xt和Val ue:语法解释:1. $("#select_id").change(functio n(){//code...}); //为Select添加事件,当选择其中一项时触发2. var checkTe xt=$("#select_id").find("option:selecte d").text(); //获取Selec t选择的Te x t3. var checkVa lue=$("#select_id").val(); //获取Selec t选择的Va lue4. var checkIn dex=$("#select_id ").get(0).selecte dIndex; //获取Selec t选择的索引值5. var maxInde x=$("#select_id option:last").attr("index"); //获取Selec t最大的索引值jQuery设置Selec t选择的Te xt和Val ue:语法解释:1. $("#select_id ").get(0).selecte dIndex=1; //设置Selec t索引值为1的项选中2. $("#select_id ").val(4); //设置Selec t的Valu e值为4的项选中3. $("#select_id option[text='jQuery']").attr("selecte d", true); //设置Selec t的Text值为jQue ry的项选中jQuery添加/删除Selec t的Opti on项:语法解释:1. $("#select_id").append("<optionvalue='Value'>Text</option>"); //为Select追加一个Op tion(下拉项)2. $("#select_id").prepend("<optionvalue='0'>请选择</option>"); //为Select插入一个Op tion(第一个位置)3. $("#select_id option:last").remove(); //删除Selec t中索引值最大Optio n(最后一个)4. $("#select_id option[index='0']").remove(); //删除Selec t中索引值为0的Opti on(第一个)5. $("#select_id option[value='3']").remove(); //删除Selec t中Valu e='3'的Option5. $("#select_id option[text='4']").remove(); //删除Selec t中Text='4'的Option//遍历optio n和添加、移除optio nfunctio n changeS hipMet hod(shippin g){var len = $("select[@name=ISHIPTY PE] option").lengthif(shippin g.value != "CA"){$("select[@name=ISHIPTY PE] option").each(functio n(){if($(this).val() == 111){$(this).remove();}});}else{$("<optionvalue='111'>UPS Ground</option>").appendT o($("select[@name=ISHIPTY P E]"));}}//取得下拉选单的选取值$(#testSel ect option:selecte d').text();或$("#testSel ect").find('option:selecte d').text();或$("#testSel ect").val();//////////////////////////////////////////////////////////////////记性不好的可以收藏下:1,下拉框:var cc1 = $(".formc select[@name='country'] option[@selecte d]").text(); //得到下拉菜单的选中项的文本(注意中间有空格)var cc2 = $('.formc select[@name="country"]').val(); //得到下拉菜单的选中项的值var cc3 = $('.formc select[@name="country"]').attr("id"); //得到下拉菜单的选中项的ID 属性值$("#select").empty();//清空下拉框//$("#select").html('');$("<optionvalue='1'>1111</option>").appendT o("#select")//添加下拉框的o ption稍微解释一下:1.select[@name='country'] option[@selecte d] 表示具有nam e 属性,并且该属性值为'country' 的select元素里面的具有se lected属性的opti on 元素;可以看出有@开头的就表示后面跟的是属性。
SeleMix 选择性编辑通过混合模型说明书
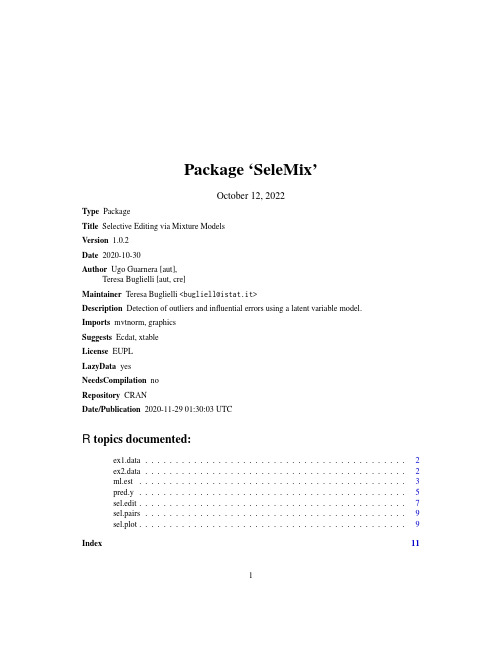
Package‘SeleMix’October12,2022Type PackageTitle Selective Editing via Mixture ModelsVersion1.0.2Date2020-10-30Author Ugo Guarnera[aut],Teresa Buglielli[aut,cre]Maintainer Teresa Buglielli<*****************>Description Detection of outliers and influential errors using a latent variable model.Imports mvtnorm,graphicsSuggests Ecdat,xtableLicense EUPLLazyData yesNeedsCompilation noRepository CRANDate/Publication2020-11-2901:30:03UTCR topics documented:ex1.data (2)ex2.data (2)ml.est (3)pred.y (5)sel.edit (7)sel.pairs (9)sel.plot (9)Index1112ex2.data ex1.data Example data frameDescriptionSimulated data from a Gaussian contamination modelUsagedata(ex1.data)FormatA data frame with500observations and2variables(X1,Y1).X1error-free variable(numeric)Y1contaminated variable(numeric)DetailsData have been generated by a Gaussian model.The variable Y1has been contaminated with parameters B=(-0.26,1.26),sigma=1.21,w=0.05,lambda=10.Examplesdata(ex1.data)ex2.data Example Data for package SeleMixDescriptionSimulated data from a Gaussian contaminated modelUsagedata(ex2.data)FormatA data frame with500observations on the following2variables.Y1first numeric contaminated variableY2second numeric contaminated variableDetailsData have been simulated by Gaussian contamination model with two contaminated variables(Y1,Y2) with parameters B=(1.03,0.96),sigma=matrix(c(1.22,1.42,1.42,2.89),2,2),w=0.05,lambda=10.Examplesdata(ex2.data)ml.est Fitting Contamination ModelDescriptionProvides ML estimates of a Gaussian contamination model.Usageml.est(y,x=NULL,model="LN",lambda=3,w=0.05,lambda.fix=FALSE,w.fix=FALSE,eps=1e-7,max.iter=500,t.outl=0.5,graph=FALSE)Argumentsy matrix or data frame containing the response variablesx optional matrix or data frame containing the error free covariatesmodel data distribution:LN=lognormal(default),N=normallambda starting value for the variance inflation factor(default=3)w starting value for the proportion of contaminated data(default=0.05)lambda.fix logical.TRUE if lambda is knownw.fix logical.TRUE if w is knowneps epsilon:tolerance parameter for the log-likelihood convergence(default=1e-7) max.iter maximum number of EM iterations(default=500)t.outl threshold value for posterior probabilities of identifying outliers(default=0.5) graph logical.TRUE to display graphics(default=FALSE)DetailsThis function provides the parameter estimates of a contamination model where a set of y variables is assumed to depend on a(possibly empty)set of covariates(x variables)through a mixture of two linear regressions with Gaussian residuals.The covariance matrices of the two mixture components are assumed to be proportional(the proportionality constant being lambda).In case of no x variablesa mixture of two Gaussian distribution is estimated.BIC and AIC scores(bic.aic)are returnedcorresponding to both standard Gaussian model and contamination model in order to help the user to avoid possible over-parametrisation.According to the estimated model parameters,a matrix of predictions of‘true’y values(ypred)is computed.To each unit in the dataset,aflag(outlier)is assigned taking value0or1depending on whether the posterior probability of being erroneous(tau)is greater than the user specified threshold(t.outl).The model is estimated using complete observations.Missing values in the x variables are not al-lowed.However,y variables can be partly observed.Robust predictions of y variables are provided even when they are not observed.A vector of missing pattern(pattern)indicates which item is observed and which is missing.In case the option‘model=LN’is specified,each zero value is changed in1e-7and a warning is returned.In order to graphically monitor EM algorithm,a scatter plot is showed where outliers are depicted as long as they are identified.The trajectory of the lambda parameter is also showed until convergence. Valueml.est returns a list containing the following components:ypred matrix of predicted values for y variablesB matrix of estimated regression coefficientssigma estimated covariance matrixlambda estimated variance inflation factorw estimated proportion of erroneous datatau vector of posterior probabilities of being contaminatedoutlier1if the observation is classified as an outlier,0otherwisen.outlier total of outlier observationspattern vector of non-response patterns for y variables:0=missing,1=present value is.conv logical value:TRUE if the EM algorithm has convergedn.iter number of iterations of EM algorithmsing if TRUE iteration are stopped because there is an almost perfectfitbic.aic Bayesian Information Criterion and Akaike Information Criterion for contami-nated and non contaminated Gaussian modelsAuthor(s)M.Teresa Buglielli<*****************>,Ugo Guarnera<*****************>ReferencesDi Zio,M.,Guarnera,U.(2013)"A Contamination Model for Selective Editing",Journal of Official Statistics.V olume29,Issue4,Pages539-555(https:///10.2478/jos-2013-0039).Buglielli,M.T.,Di Zio,M.,Guarnera,U.(2010)"Use of Contamination Models for Selective Edit-ing",European Conference on Quality in Survey Statistics Q2010,Helsinki,4-6May2010 Examples#Parameter estimation with one contaminated variable and one covariatedata(ex1.data)ml.par<-ml.est(y=ex1.data[,"Y1"],x=ex1.data[,"X1"],graph=TRUE)str(ml.par)sum(ml.par$outlier)#number of outliers#Parameter estimation with two contaminated variables and no covariates##Not run:data(ex2.data)par.joint<-ml.est(y=ex2.data,x=NULL,graph=TRUE)sum(par.joint$outlier)#number of outliers##End(Not run)pred.y Prediction of y variablesDescriptionProvides predictions of y variables according to a Gaussian contamination modelUsagepred.y(y,x=NULL,B,sigma,lambda,w,model="LN",t.outl=0.5)Argumentsy matrix or data frame containing the response variablesx optional matrix or data frame containing the error free covariatesB matrix of regression coefficientssigma covariance matrixlambda variance inflation factorw proportion of erroneous datamodel data distribution:LN=lognormal(default),N=normalt.outl threshold value for posterior probabilities of identifying outliers(default=0.5)DetailsThis function provides expected values of a set of variables(y1.p,y2.p,...)according to a mix-ture of two regression models with Gaussian residuals(see ml.est).If no covariates are available(x variables),a two component Gaussian mixture is used.Expected values(predictions)are computed on the base of a set of parameters of appropriate dimensions(B,sigma,lambda,w)and(possibly)a matrix(or data frame)containing the error-free x variables.Missing values in the x variables are not allowed.However,robust predictions of y variables are also provided when these variables are not observed.A vector of missing pattern(pattern)indicates which item is observed and which is missing.For each unit in the data set the posterior probability of being erroneous(tau)is computed and a flag(outlier)is provided taking value0or1depending on whether tau is greater than the user specified threshold(t.outl).Valuepred.y returns a data frame containing the following columns:y1.p,y2.p,...predicted values for y variablestau posterior probabilities of being contaminatedoutlier1if the observation is classified as an outlier,0otherwisepattern non-response patterns for y variables:0=missing,1=present valueAuthor(s)M.Teresa Buglielli<*****************>,Ugo Guarnera<*****************>ReferencesBuglielli,M.T.,Di Zio,M.,Guarnera,U.(2010)"Use of Contamination Models for Selective Edit-ing",European Conference on Quality in Survey Statistics Q2010,Helsinki,4-6May2010 Examples#Parameter estimation with one contaminated variable and one covariatedata(ex1.data)#Parameters estimated applying ml.est to\code{ex1.data}B1<-as.matrix(c(-0.152,1.215))sigma1<-as.matrix(1.25)lambda1<-15.5w1<-0.0479#Variable predictionypred<-pred.y(y=ex1.data[,"Y1"],x=ex1.data[,"X1"],B=B1,sigma=sigma1,lambda=lambda1,w=w1,model="LN",t.outl=0.5) #Plot ypred vs Y1sel.pairs(cbind(ypred[,1,drop=FALSE],ex1.data[,"Y1",drop=FALSE]),outl=ypred[,"outlier"])sel.edit Influential Error DetectionDescriptionComputes the score function and identifies influential errorsUsagesel.edit(y,ypred,wgt=rep(1,nrow(as.matrix(y))),tot=colSums(ypred*wgt),t.sel=0.01)Argumentsy matrix or data frame containing the response variablesypred matrix of predicted values for y variableswgt optional vector of sampling weights(default=1)tot optional vector containing reference estimates of totals for the y variables.If omitted,it is computed as the(possibly weighted)sum of predicted values t.sel optional vector of threshold values,one for each variable,for selective editing (default=0.01)DetailsThis function ranks observations(rank)according to the importance of their potential errors.The order is made with respect to the global score function values(global.score).The function also selects the units to be edited(sel)so that the expected residual error of all variables is below a prefixed level of accuracy(t.sel).The global score(global.score)is the maximum of the local scores computed for each variable(y1.score,y2.score,...).The local scores are defined as a weighted(weights)absolute difference between the observed(y1,y2,...)and the predicted val-ues(y1.p,y2.p,...)standardised with respect to the reference total estimates(tot).The selection of the units to be edited because affected by an influential error(sel=1)is made ac-cording to a two-step algorithm:1)order the observations with respect to the global.score(decreasing order);2)select thefirst k units such that,from the(k+1)th to the last observation,all the residual errors(y1.reserr,y2.reserr,...)for each variable are below t.sel.The function provides also an indicator function(y1.sel,y2.sel,...)reporting which variables contain an influential errors in a unit selected for the revision.Valuesel.edit returns a data matrix containing the following columns:y1,y2,...observed variablesy1.p,y2.p,...predictions of y variablesweights sampling weightsy1.score,y2.score,...local scoresglobal.score global scorey1.reserr,y2.reserr,...residual errorsy1.sel,y2.sel,...influential errorflagsrank rank according to global scoresel1if the observation contains an influential error,0otherwiseAuthor(s)M.Teresa Buglielli<*****************>,Ugo Guarnera<*****************>ReferencesDi Zio,M.,Guarnera,U.(2013)"A Contamination Model for Selective Editing",Journal of Official Statistics.V olume29,Issue4,Pages539-555(/10.2478/jos-2013-0039).Buglielli,M.T.,Di Zio,M.,Guarnera,U.(2010)"Use of Contamination Models for Selective Edit-ing",European Conference on Quality in Survey Statistics Q2010,Helsinki,4-6May2010. Examples#Example1#Parameter estimation with one contaminated variable and one covariatedata(ex1.data)ml.par<-ml.est(y=ex1.data[,"Y1"],x=ex1.data[,"X1"])#Detection of influential errorssel<-sel.edit(y=ex1.data[,"Y1"],ypred=ml.par$ypred)head(sel)sum(sel[,"sel"])#orders results for decreasing importance of scoresel.ord<-sel[order(sel[,"rank"]),]#adds columns to dataex1.data<-cbind(ex1.data,tau=ml.par$tau,outlier=ml.par$outlier,sel[,c("rank","sel")])#plot of data with outliers and influential errorssel.pairs(ex1.data[,c("X1","Y1")],outl=ml.par$outlier,sel=sel[,"sel"]) #Example2data(ex2.data)sel.pairs9 par.joint<-ml.est(y=ex2.data)sel<-sel.edit(y=ex2.data,ypred=par.joint$ypred)sel.pairs(ex2.data,outl=par.joint$outlier,sel=sel[,"sel"])sel.pairs Scatterplot MatrixDescriptionA scatterplot matrix with outlier and influential errors is produced.Usagesel.pairs(x,outl=rep(0,nrow(x)),sel=rep(0,nrow(x)),labs=NULL,log=TRUE,legend=TRUE,title=NULL)Argumentsx matrix or data frame of the coordinates of pointsoutl vector identifying outliers(1or TRUE means outlier)sel vector identifying influential errors(1or TRUE means influential error)labs names of the variableslog if TRUE logarithm of x are plottedlegend if TRUE a legend is added tofirst boxplottitle an overall title for the plotDetailsThe ijth scatterplot contains x[,i]plotted against x[,j].Outliers are represented as blue circles, influential errors as red circles and points that are both outlier and influential error as cyan circles.sel.plot Scatterplot with information about outliers and influential errorsDescriptionIn addition to a standard scatterplot,outliers and influential errors are highlighted.Usagesel.plot(data,vars=1:2,outl=rep(0,nrow(data)),sel=rep(0,nrow(data)), log=TRUE,n.identify=0,file=NULL,title=NULL)10sel.plotArgumentsdata named matrix or data frame containing at least the coordinates of pointsvars vector with the names or column numbers of the two variables to plotoutl vector identifying outliers(1or TRUE means outlier)sel vector identifying influential errors(1or TRUE means influential error)log if TRUE logarithm of data[,vars]are plottedn.identify number of points to be identified on the scattrerplot.Corresponding data areprinted on console orfile(if afile name is specified)file name of the outputfile.If n.identify is equal0the graphic is saved in a jpegfile.If n.identify is greater than0data rows corresponding selected points aresaved in a csvfiletitle an overall title for the plotDetailsThe scatterplot contains thefirst varaible plotted against the second.Outliers are represented as blue circles,influential errors as red circles and points that are both outlier and influential error as cyan circles.Examplesdata(ex2.data)par.joint<-ml.est(y=ex2.data)sel<-sel.edit(y=ex2.data,ypred=par.joint$ypred)sel.plot(ex2.data,outl=par.joint$outlier,sel=sel[,"sel"],title="EXAMPLE2")##Not run:sel.plot(ex2.data,outl=par.joint$outlier,sel=sel[,"sel"],title="EXAMPLE2",n.identify=3)##End(Not run)Index∗datasetsex1.data,2ex2.data,2ex1.data,2ex2.data,2ml.est,3,6pred.y,5sel.edit,7sel.pairs,9sel.plot,911。
赢在单词必知:德语中星期名称的词源初探

赢在单词必知:德语中星期名称的词源初探一周七天的这种安排最初源于古巴比伦,后来由犹太人把这种安排传播到了希腊人和罗马人那里。
在希腊人和罗马人那里,星期(Wochentage)是根据七位古老的行星(Planeten)之神来命名的,他们分别是:Sonne(太阳—太阳神), Mond(月亮—月亮神), Mars(火星—战神), Merkur(水星—主神的信使、商业的保护神), Jupiter(木星—主神), Venus(金星—美丽与性爱女神), Saturn(土星—农神)。
当然,从现代天文学的角度来看,古人在这里犯了一些错误,因为现代天文学认为太阳是恒星,而月亮只是一个卫星。
德语中星期(Wochentage)的名称都是借译词汇(Lehnübersetzungen)。
这种说法,乍一听来有些令人难以置信,但是事实如此。
我们就先从星期天(Sonntag)说起, 因为一周事实上是从星期天开始的。
Sonntag借译自拉丁语的diēs Sōlis(Tag der Sonne)。
在现代德语中存在很多包含“solar”的词汇:Solarenergie, Solarheizung, Solarium, Solarbatterie等等,它们都和太阳有关。
拉丁语的这一名称diēs Sōlis又借译自希腊语的hēmérāHēlíou。
在现代德语中,Helios就指的是希腊太阳神。
如今德语中还保留了许多以“helio-”为其组成部分的合成词:Heliobiologie(太阳生物学),Helioskop(太阳望远镜),Heliotherapie(日光疗法),heliozentrisch(以太阳为中心的)等等。
Montag借译自拉丁语的diēs Lūnae(Tag des Mondes)。
在拉丁语中L ūna就是月亮的意思。
在这里,我们稍微关注一下Laune的词源也许是有趣味的,Laune就源自于拉丁语的Lūna,因为根据中世纪时候的星相学,人类的心情在很大的程度上取决于月亮的圆缺变化,很能让人联想起苏轼的辞句:人有悲欢离合,月有阴晴圆缺。
sql语句

min 最小值
16.找出供应商所在地的数目
select count(distinct 地址)
from 供应商
17.求支付的工资总数
sele sum(工资) from 职工
SELECT 职工.职工号, 仓库.城市;
FROM 订货管理数据库!仓库 INNER JOIN 订货管理数据库!职工 ;
ON 仓库.仓库号 = 职工.仓库号;
WHERE 职工.工资 > 1230
7.找出工作面积大于400的仓库的职工号以及这些职工工作所在地。
select 职工.职工号,仓库.城市 from 职工,仓库;
select avg(面积) from 仓库 where 仓库号 not in;
(select 仓库号 from 职工 where 工资<=1210);
and 仓库号 in(sele 仓库号 from 职工)
20.求最小值min(面积)
sele min(面积) from 仓库
21.求每个仓库的职工的平均工资。分组
14.按职工的工资值升序检索出全部职工信息。
select * from 职工 order by 工资
15.先按仓库号排序,再按工资排序并输出全部职工信息。
select * from 职工 order by 仓库号,工资
简单的计算查询
count 计算数量
sum 计算总和
avg 平均值
sele 仓库号from 职工where 工资>=;
(sele min(工资) from 职工 where 仓库号="WH1")
VF 关系数据库标准语言S Q L
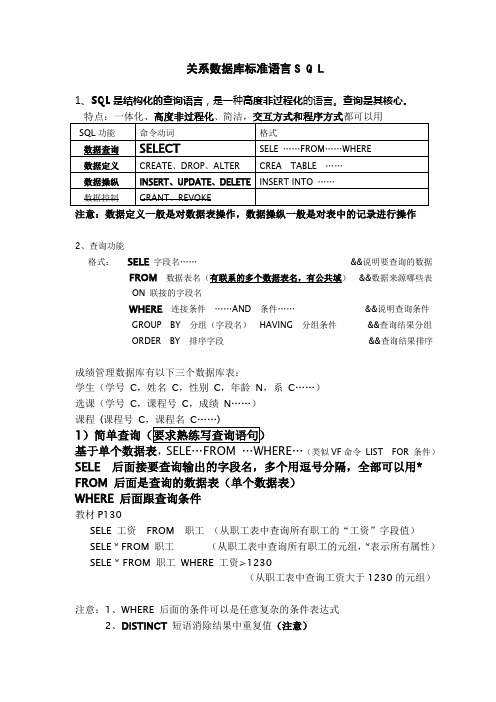
关系数据库标准语言S Q L1、SQL是结构化的查询语言,是一种高度非过程化的语言。
查询是其核心。
注意:数据定义一般是对数据表操作,数据操纵一般是对表中的记录进行操作2、查询功能格式:SELE字段名……&&说明要查询的数据FROM数据表名(有联系的多个数据表名,有公共域)&&数据来源哪些表ON 联接的字段名WHERE连接条件……AND 条件……&&说明查询条件GROUP BY 分组(字段名)HAVING 分组条件&&查询结果分组ORDER BY 排序字段&&查询结果排序成绩管理数据库有以下三个数据库表:学生(学号C,姓名C,性别C,年龄N,系C……)选课(学号C,课程号C,成绩N……)课程(课程号C,课程名C……)1基于单个数据表,SELE…FROM …WHERE…(类似VF命令LIST FOR 条件)SELE 后面接要查询输出的字段名,多个用逗号分隔,全部可以用* FROM 后面是查询的数据表(单个数据表)WHERE 后面跟查询条件教材P130SELE 工资FROM 职工(从职工表中查询所有职工的“工资”字段值)SELE * FROM 职工(从职工表中查询所有职工的元组,*表示所有属性)SELE * FROM 职工WHERE 工资>1230(从职工表中查询工资大于1230的元组)注意:1、WHERE 后面的条件可以是任意复杂的条件表达式2、DISTINCT 短语消除结果中重复值(注意)列:查询成绩大于等于60分的学生的学号、课程号、成绩(学号,课程号,成绩都在选课表中)SELE 学号,课程号,成绩FROM 选课WHERE 成绩>=60相当于VF命令:LIST FIELDS 学号,课程号,成绩FOR 成绩>=60查询有考试成绩的学生的学号SELE DIST 学号FROM 选课(DIST 去掉重复)列:在学生表中查询2系年龄小于25的女同学的学号,姓名在学生表中查询2系或6系年龄小于25的男同学的学号,姓名分析条件:性别='女' AND 年龄<25 AND (系='6' OR 系='2')等于条件:性别='男' AND 年龄<25 AND 系='6' OR性别='男' AND 年龄<25 AND 系='2'-----------------------------------------------------------------------2)基于多个数据表(两个或三个),这些数据表肯定有联系(有公用字段),而且查询输出的字段可能在几个(两个或以上有联系)数据表中。
VF必做复习资料(最新整理)
A.表单设计采用了面向对象的程序设计方法
B.表单可用于数据库信息的显示、输入和编辑
C.表单的设计是可视化的
D.表单中程序的执行是有一定顺序的
32、在表单的常用方法中,将表单从内存中释放的方法是( B )
A、SHOW B、 RELEASE
C、HIDE
D、REFRESH
33、关于数据库表与自由表的候选索引,正确的是( D )
go top
replace 职称 with "副教授",工资 with 820
set index to wk
go bottom
skip -1
replace 职称 with "副教授",工资 with 910
reindex
go bottom
?姓名,工资
Use
Retu
(1)变量 a1、b1 的值分别为(2000 870)
B. GROUP BY 和 DISTINCT
C. ORDER BY 和 DISTINCT D. ORDER BY 和 GROUP BY
26、在 DO WHILE...ENDDO 循环结构中,EXIT 命令的作用是( B )
A.退出过程,返回程序开始处台戏
B.终止循环,将控制转移到本循环结构 ENDDO 后面的第一条语句继续执行
A)
A. THSFORM.TEXT1.READONLY=.T.
B. THISPORM.TEXT1.READONLY=.F.
C. THISFORM.TEXT1.VISIBLE=.T.
D. THISFORM.TEXT1.VISIBLE=.F.
35、让控件获得焦点,使其成为活动对象的方法是( SETFOCUS )
SELE中文手册
目录1. 序言1-11.1 安全注意事项1-21.2 安装1-41.3 系统介绍1-51.3.1分析仪1-61.3.2 计算机控制1-101.3.3 制冷单元1-111.3.4 条码读取器(任选)1-121.3.5 操作条件1-131.3.6 移动仪器1-141.4 工作的准备1-151.4.1 手册结构和使用1-151.4.2 系统操作1-171.4.3 操作说明和键盘功能1-191.5 系统的启动1-211.5.1 分析仪的准备1-211.5.2 分析仪的启动1-221.5.3 系统参数的设置1-241.5.4 设置测量方式1-271.5.5 系统参数,测量方式的设置1-281.5.6 制冷单元的安装1-311.5.7 系统液的充满和排空1-321.5.8 操作条件1-341.5.9 常规操作一览表1-362. 常规工作2-12.1 输入样品信息和实验申请单2-22.1.1样品申请单的功能2-22.1.2手工输入样品实验申请单2-62.1.3 用重复方式申请连续的实验2-82.1.4 申请实验组合2-92.1.5 用条码输急诊样品2-102.1.6 申请微量(儿科)样品2-112.1.7 申请质控、定标和试剂空白样品2-122.1.8 清除实验申请单2-142.1.9 打印工作列表2-142.2 样品盘装载,实验的起动和停止2-152.2.1 样品装载功能2-152.2.2 样品盘的装载2-182.2.3 用条码读取器装样品2-192.2.4 检查和重新充满试剂2-202.2.5 启动测量和更新显示2-2212.3 检查和确认结果2-232.3.1 样品评估功能2-232.3.2 自动打印结果2-412.3.3确认一个结果2-423. 扩展的常规功能3- 13.1质量控制3- 23.1.1 质量控制功能3- 23.1.2 质量控制的图示3- 43.2 质控编程3- 83.2.1质控编程的功能3- 83.2.2 质控编程举例3-103.2.3 westgard 规则3-113.3 定标液编程3-123.3.1 定标液编程3-133.4 实验参数编程3-143.4.1 实验参数的功能3-143.4.2 动力学实验功能3-163.4.3 两点法实验功能3-293.4.4 终点法实验功能3-313.5 定义定标液参数3-343.5.1定标液编程功能3-343.5.2 两点定标3-363.5.3 临界值实验参数3-373.5.4 定标曲线3-393.6 探针/比色皿不兼容性3-413.6.1 探针/比色皿不兼容性3-413.6.2 实验不兼容性的显示3-423.6.3 实验不兼容性的定义3-443.7 组合实验的编程3-463.7.1 组合实验的功能3-463.7.2 组合实验的显示3-473.7.3 组合实验的编程3-483.8 试剂位置3-493.8.1 试剂位置的功能3-493.8.2 试剂位置的显示3-523.8.3 试剂在盘上的定位3-543.9 计算结果3-563.9.1计算结果的功能3-573.10 保养3-613.10.1 用户保养3-623.10.2 更换比色皿3-633.10.3 手工测量比色皿空白值3-653.10.4 更换灯泡3-673.10.5 更换注射器密封头3-6923.10.6 冲洗探针和比色盘3-713.11 常见故障信息3-723.11.1 出错标志3-744. 特殊功能4- 14.1打印机和主机的连接4- 24.2 实验报告的设置4- 34.2.1 实验报告设置功能4- 34.2.2 报告设置举例4- 54.3 故障的排除4- 64.3.1 搅拌轮皮带失效4- 64.3.2 样品针堵塞4- 64.3.3 更换比色盘4- 74.3.4 出错记录4- 74.3.5 错码一览表4- 95. 安装5- 15.1 硬件的安装5- 25.2 软件的安装5- 25.2.1 简介5- 25.2.2 计算机的准备5- 35.2.3 第一次分步安装5- 65.2.4 安装文件5- 95.3 设置打印机和通讯处理器5-105.3.1 分析仪打印处理器的设置5-105.3.2 分析仪通讯处理器设置5-115.3.3 主计算机通讯处理器设置5-135.4 备份操作方法5-14 附录A- 1A.1 接口描述A- 2A.1.1 RS-232接口描述A- 2A.2 “988- VS”ISE(任选)A-18A.2.1 ISE单元A-18A.2.2 操作前的准备A-20A.2.3 ISE参数的设置A-21A.2.4 ISE常规操作检查表A-22A.2.5 ISE的保养A-23A.2.6 ISE单元的定标A-28A.2.7 ISE出错一览表A-30A.2.8 ISE单元的安装和关机A-31 索引I 手册中的关键词II31.1安全事项该分析仪和ISE单元按照现行标准设计与制造,适合国际安全规则,即对于在生产时已知的所有可能的危险因素将尽量予以避免或降低。
万博电脑培训中心vf笔试命令总结
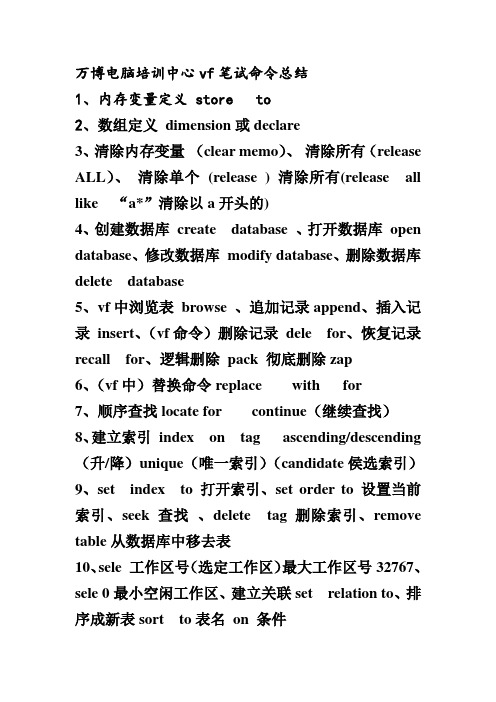
万博电脑培训中心vf笔试命令总结1、内存变量定义store to2、数组定义dimension或declare3、清除内存变量(clear memo)、清除所有(release ALL)、清除单个(release ) 清除所有(release all like “a*”清除以a开头的)4、创建数据库create database 、打开数据库open database、修改数据库modify database、删除数据库delete database5、vf中浏览表browse 、追加记录append、插入记录insert、(vf命令)删除记录dele for、恢复记录recall for、逻辑删除pack 彻底删除zap6、(vf中)替换命令replace with for7、顺序查找locate for continue(继续查找)8、建立索引index on tag ascending/descending (升/降)unique(唯一索引)(candidate侯选索引)9、set index to 打开索引、set order to 设置当前索引、seek 查找、delete tag 删除索引、remove table从数据库中移去表10、sele 工作区号(选定工作区)最大工作区号32767、sele 0最小空闲工作区、建立关联set relation to、排序成新表sort to表名on 条件11、查询sele distinct(去掉重复记录)* from where(筛选)group by(分组)having(分组条件)order by(排序)12、查询去向into table (dbf)表、into cursor 临时表、into array 数组、to file 文本文件.txt13查询嵌套select * from 表名where 关建字(not)in(select 关建字from 表名)14、特殊运算符between and 两者之间、like %/_ sql中的通配符15、量词any(some)表示部分、例如(sele distinct 仓库号from 职工whre 工资>=any(sele 工资from 职工where 仓库号=’wh1’) 对应的是取最小值(min)16、量词all表示全部、例如(sele distinct 仓库号from 职工where 工资>=all(sele 工资from 职工where 仓库号=’wh1’) 对应的是取最小值(max) 17、普通联接inne join 左联接left join、右联接right join、全联接full join例:sele * from aa inne join bb on aa.aa=bb.aa18、union 集合并运算19、取最大n条sele * top n from 表名order by 工资desc降序(取最小为asce 升序)20、vf中命令(modify structure 修改表结构、copy structure 复制表结构)21、sql语句中、插入记录inset into 表名value(“值1“、值2)、更新命令update 表名set 字段名=值where 条件、删除记录delete from 表名wh ere 条件22、创建表create table 表名(仓库号c(5)primary key (主索引),面积i check 面积>0 default (默认值) error “dd”错误信息,职工号c(5),foreign key 仓库号tag 仓库号references 职工1)(建普通索引及联系)23、修改表命令alter table、追加字段(alter table 表名add 字段名check 规则error 信息)、修改字段规则(alter table 表名alter 字段名set check 规则error 信息)、删除规则(alter table 表名alter 字段名drop check)、字段改名(alter table 表名rename column 旧字段名to 新字段名)、删除字段(alter table 表名drop column 字段名)、建立侯选索引(alter table 表名add unique 职工号+供应商号tag emp)、删除侯选索引(alter table 表名drop unique tag 候选索引名)24、创建视图(create view 视图名as sele * from 表名)、删除视图drop view 名字25、创建查询create query26、建立程序文件modify command 程序文件名27、调用程序文件do 名.prg、调用查询文件do 名.qpr、调用菜单文件do 名.mpr、调用表单do form 名.scx28、外部输入命令input to (输入字符、数值、逻辑、日期)、accept to (只能输入字符串)、wait to (只能输入单个字符)29、选择结构is else endif 、分支语句do case case endcase、循环结构do while enddo 、for endfor、scan endscan30、循环出口语句exit 转跳语句loop31、定义过程procedure、打开过程set procedure to、关闭过程release procedure、返回过程return默认返回.t.值32、定义形参parameters或lparameters33、参数传递、按值传递(set udfparms to value、形参变化实参不变)、按引用传递(set udfparms toreference、形参变化实参变化)34、变量作用域:公共变量public 、局部变量定义local、私有变量定义例:a=100(公共上、中、下都可用、局部:本身能用、私有本身下级能用)35、创建对象:createobject 对象名36、常用事件(加载load、创建init、释放destroy、卸载unload、出错error、焦点gotfocus、单击click、双击dblclick、右击right click、键盘交互interactivechange37、常用方法(表单关闭release、表单重绘refresh、表单显示show、表单隐藏hide、控件获焦点setfocus 38、常用属性:标题caption、确认default、取消cancel、可用不可用enabled、可见不可见visible、按钮个数buttoncount、按钮选定value、文本框数据源controlsource、文本框返回值value、设置占位符(*)passwordchar、设置输入文本类型inputmask、编辑框只读(readonly)、编辑返回文本seltext、(选项组数目buttoncount、选中选项value)、(列表框数据源rowsource、类型rowsourcetype、列表条数listcount、列数columncount、选定条目selected、多重选定multiselect、组合框下拉列表、组合属性style、表格控件数据源(recordsource)类型(recordsourcetype)、表格列数columncount、面框页数pagecount)、表单窗口居中autocenter39、恢复系统菜单set sysmenu to default、允许访问系统菜单set sysmenu on、禁止访问set sysmenu off、建立和修改菜单(打开菜单设计器)modify menu40、创建报表create report 、预览报表reprot form41、连编应用程序build app 文件名.app from 项目名连编可执行文件build exe 文件名.exe from 项目名43、常用文件扩展名:数据库dbc、数据库备注文件dct、数据库索引文件dcx、表dbf、查询qpr、文本txt、表单scx、表单备注文件sct、菜单文件mnx、菜单应用程序文件mpr、项目文件pjx、单索引文件idx、复合索引文件cdx、应用程序文件app、可执行文件exe、报表文件frx、程序文件prg44、sql的数据查询功能(select)、定义功能(create、drop、alter)、数据操纵功能(inset、update、delete)、数据控制功能(grant、revoke)45、常用函数:取整int、求平方sqrt、取正负sign (1/-1)、四舍五入round、求余数mod或%、最大值max、最小值min、平均值avg、求和sum()、统计个数count()、测试字符串长度len、小写转大写upper、生成空格space()、去掉首尾空格alltrim、取左子串left、取右子串right、从某个位置截取substr (x,3,2)、求子串位置at(返回数值)、求年year、数值转字符str、字符转数值val、字符转日期ctod、日期转字符dtoc、宏替换&(把字符定界符去掉)、空值null用isnull测试、空值empty测试字符(空串、空格为真、数值0为真)、文件首bof为真、文件尾eof()为真、0记录时recno()值为1、1记录是recno ()为146、er图中“矩形”表示实体集、“椭圆”表示属性、“菱形”表示联系。
ELSCINTSELE螺旋CT(标准版本)
ELSCINT SELE螺旋CT
一、操作常规:
1、本机可为全身各部位进行扫描检查。
2、开机前,先开启各房间空调、去湿机,使房内温、湿度保持在允许范围内。
3、接通电源,配电柜电源及稳压装置,并使电压指示在380V±1%。
4、开机顺序:稳压器主闸→床上START→UPS→监视器电源→计算机电源。
5、根据监视器的对话,输入开机指令,并校准机器。
6、放置病人在扫描床上,摆好体位。
7、输入扫描程序,进行扫描。
8、扫描完毕,退回扫描床,送走病人。
二、注意事项:
1、机房内温度不得超过20℃以上,湿度在60%左右。
2、当机器故障时,应做好错误信息记录。
3、在扫描中如有异常现象,应及时按紧急停止按钮。
4、关机时应注意先后顺序。
flutter seletabletext详解
flutter seletabletext详解全文共四篇示例,供读者参考第一篇示例:Flutter是一种跨平台的移动应用开发框架,它使用Dart语言编写,可以让开发者快速构建美观而且功能强大的移动应用。
在Flutter中,SelectableText组件是一个非常有用的小部件,它可以让用户选择并复制文本内容。
本文将详细介绍Flutter中SelectableText的使用方法和相关属性。
一、SelectableText的基本用法在Flutter中,SelectableText组件用于显示可以选择并复制的文本内容。
要使用SelectableText,只需在Widget树中添加一个SelectableText小部件即可。
以下是一个基本示例:```dartSelectableText('Hello, Flutter!',)```在上面的示例中,SelectableText显示的是"Hello, Flutter!"这段文本内容。
用户可以长按文本内容,然后选择复制或者剪切操作。
SelectableText还支持文本样式属性,例如字体大小、颜色等。
二、SelectableText的属性介绍SelectableText组件有许多属性可以调整文本的样式和行为。
以下是SelectableText可能用到的一些常见属性:1. text:显示的文本内容。
2. style:文本的样式,例如字体大小、颜色、字重等。
3. textAlign:文本的对齐方式,例如左对齐、居中对齐、右对齐等。
4. toolbarOptions: 设置文字长按响应菜单选项5. enableInteractiveSelection: 是否启用用户交互式选择控制。
这是一个布尔值,默认为true。
6. onTap: 文本内容被轻按时的回调函数。
除了上面列出的属性外,SelectableText还有其他一些属性可以帮助开发者自定义文本内容的显示效果。
flutter seletabletext详解
flutter seletabletext详解Flutter中的SelectableText控件允许用户选择和复制文本。
下面是对SelectableText的详细解释:1. 功能:SelectableText提供了文本选择的功能,使用户能够复制、剪切选中的文本。
2. 用法:DartSelectableText('老孟,一枚有态度的程序员',showCursor: true, // 显示光标autofocus: true, // 自动聚焦cursorColor: Colors.red, // 光标颜色)3. 特点:•用户可以双击文本进行选择。
提供了设置光标位置、颜色等功能。
与其他控件的结合:可以与其他Flutter控件(如Text, Image, Icon等)结合使用,创建复杂的UI界面。
例如,可以在Container内部与Radio、Checkbox等组合,以满足更丰富的交互需求。
4. 示例:结合其他控件构建UI界面(这里只是示例,实际使用时可能需要根据具体需求调整):Dartclass MyWidget extends StatefulWidget {@override_MyWidgetState createState() => _MyWidgetState();}class _MyWidgetState extends State<MyWidget> {bool isChecked = false;@overrideWidget build(BuildContext context) {return Scaffold(appBar: AppBar(title: Text("Flutter Widgets Demo"),),body: Container(child: Row(children: <Widget>[Text("男"),Radio(value: 1, groupValue: isChecked ? 1 : 0), // isChecked表示是否被选中SelectableText('老孟,一名有态度的程序员。
- 1、下载文档前请自行甄别文档内容的完整性,平台不提供额外的编辑、内容补充、找答案等附加服务。
- 2、"仅部分预览"的文档,不可在线预览部分如存在完整性等问题,可反馈申请退款(可完整预览的文档不适用该条件!)。
- 3、如文档侵犯您的权益,请联系客服反馈,我们会尽快为您处理(人工客服工作时间:9:00-18:30)。
Vitor Borba Ferreira
Ronaldinho Gaúcho
the world cup
The Brazil team has not missed a World Cup finals match, and in 1958, 1962, 1970, 1994 and 2002 five time champion title number, ranking first in the world.
Tips
Brazil is not always is the world cup team. In fact, the head of Brazil two World Cup trip is out and out of the disaster. In 1930, a nationwide political infighting destroyed the national team's chance of winning. Later in 1934, went to Italy for two weeks of traveling by sea allows the players to be tired out. Until 1958, Brazil team can become a real team Brazil.
Brazilian players
Brazil many international famous football players started their career from The National League and the Brazil cup competition . Brazil has about 22000 national football player
the world cup in Brazil
recent condition
In 2012 July the Brazil football team fell out of the top 10 in the world In fact, for FIFA world rankings released, the Brazil Football Association is not overly concerned,but compared with Spain, Germany, Argentina and other world powers, Brazil football in recent years setback is very obvious.
Seleção Brasileira de Futebol
football culture of Brazil
football+samba=Brazil
short introduction
Brazilian football is the mainstream cultural life. For Brazilians, football is a sport, but also culture. Whenever the league or major domestic and international competitions, the Brazwatch the battle, the whole city The whole town turns out to. Brazilian football is called "mass movement", whether it is on the beach, or in the streets and lanes of the city, there were playing. Even in the slums, children from poor families also barefoot when the ball socks filled with paper.
origin
Brazil football, originated in the United kingdom. In 1863, the British football association was established. Later, the youth in Brazil to learn English, back to back two and a code of football, creating the brand of football light. Soon, the sport has spread in Brazil.