AAPL苹果公司财务报表分析
苹果公司审计报告
苹果公司审计报告1. 引言本文将对苹果公司进行一份审计报告,通过对其财务状况、业务运营和风险管理等方面的分析,为读者提供关于苹果公司的全面了解。
2. 公司概况苹果公司成立于1976年,总部位于美国加利福尼亚州库比蒂诺市。
该公司是全球知名的科技公司,主要经营电子产品、软件和在线服务等领域。
苹果公司以其创新的产品设计和卓越的用户体验而闻名,其主要产品包括iPhone、iPad、Mac和Apple Watch等。
3. 财务状况苹果公司目前是世界上市值最高的公司之一。
根据最新的财务报告,截至2021年第三季度,苹果公司的净利润达到了XX亿美元,同比增长XX%。
公司的总资产为XX亿美元,总负债为XX亿美元。
苹果公司在过去几年中保持了稳定的收入增长和健康的财务状况。
4. 业务运营苹果公司的主要业务包括销售硬件设备和提供在线服务。
硬件设备销售占据了公司总收入的大部分比例,其中最重要的产品是iPhone。
根据数据显示,截至2021年第三季度,苹果公司的iPhone销售额占据了总收入的XX%。
此外,iPad、Mac和Apple Watch等产品也取得了可观的销售业绩。
在线服务是苹果公司日益重要的业务领域之一。
公司提供的在线服务包括App Store、Apple Music和iCloud等,这些服务为用户提供了便利和增值服务。
在线服务的收入在近年来稳步增长,为公司的业绩做出了重要贡献。
5. 风险管理苹果公司在面对风险时采取了一系列的措施来保护公司的利益。
首先,公司进行了全面的市场分析和竞争对手调研,以确保产品能够适应不断变化的市场需求。
其次,苹果公司在供应链管理方面非常重视,以确保稳定的物流和供应。
此外,公司还加强了知识产权保护,防止侵权行为对公司品牌形象和利润造成损害。
6. 结论通过对苹果公司的审计,我们可以得出以下结论:苹果公司在过去几年中取得了显著的财务成果,其稳定的收入和健康的财务状况为其持续发展提供了坚实的基础。
Financial Analysis on Apple(对苹果公司的财务分析)

XXXXX大学XXX学院本科生课程论文(设计)课程名称:会计英语论文题目:Financial Analysis on Apple Company 姓名:学号:专业:会计学年级:班级:任课教师:年月ABSTRACTThe Company designs, manufactures, and markets mobile communication and media devices, personal computers, and portable digital music players, and sells a variety of related software, services, peripherals, networking solutions, and third-party digital content and applications. The Company sells its products worldwide through its retail stores, online stores, and direct sales force, as well as through third-party cellular network carriers, wholesalers, retailers, and value-added resellers.The Company’s customers ar e primarily in the consumer, education, enterprise and government markets. The Company sells its products and resells third-party products in most of its major markets directly to consumers through its retail and online stores and its direct sales force. The Company also employs a variety of indirect distribution channels, such as third-party cellular network carriers, wholesalers, retailers, and value-added resellers. During 2013, the Company’s net sales through its direct and indirect distribution channels accounted for 30% and 70%, respectively, of total net sales.I will introduce about the financial status with two aspects in 2013, and the financial analysis is my importance in my following contents.Key words: Financial Status; Net Sales; Gross MarginContent1、Fiscal 2013 Highlights (4)2、Financial Status and Analysis (5)(1)Product Performance (5)(2)Segment Operating Performance (6)3、View on Gross Margin (7)4、Conclusion (8)Reference (9)Financial Analysis on Apple Company1、Fiscal 2013 HighlightsNet sales rose 9% or $14.4 billion during 2013 compared to 2012. This resulted from growth in net sales of iPhone; iTunes, software, and services; and iPad. Growth in 2013 reflects strong sales of iPhone 5, strong continuing sales of iPhone 4 and 4s, the introduction of iPhone 5c and 5s, strong performance of the iPad Mini and fourth generation iPad, and continued growth in the Company’s online sales of apps, digital content, and services. Growth in these areas was partially offset by declines in net sales of Mac and iPod. All of the Company’s operating segments experienced increased net sales in 2013, with net sales growth being particularly strong in the Americas, Greater China and Japan operating segments. Similar to 2012, growth in total net sales was higher during the first half of 2013, rising $12.6 billion or 14.7% over the same period in 2012. First half growth in 2013 was driven by iPhone and iPad introductions at or near the beginning of 2013.In April 2013 the Company announced a significant increase to its program to return capital to shareholders by raising the total amount it expected to utilize for the program through December 2015 to $100 billion. This included increasing its share repurchase authorization to $60 billion and raising its quarterly dividend to $3.05 per common share beginning in May 2013. During 2013, the Company utilized $23.0 billion to repurchase common shares and paid dividends of $10.5 billion or $11.40 per common share. In conjunction with its capital return program, in May 2013 the Company issued $17.0 billion of notes with varying maturities through 2043.2、Financial Status and Analysis(1)Product PerformanceWhen it comes to the iPhone, the growth in iPhone net sales and unit sales during 2013 resulted from increased demand for iPhone in all of the Company’s operating segments primarily due to the launch of iPhone 5 beginning in September 2012 and strong ongoing demand for iPhone 4 and 4s. All of the Company’s operating segments experienced increases in net sales and unit sales of iPhone during 2013 compared to 2012. The year-over-year impact of higher iPhone unit sales in 2013 was partially offset by a 3% decline in iPhone average selling prices in 2013 compared to 2012 primarily as a result of a shift in product mix towards lower-priced iPhone models, particularly iPhone 4. All of the Company’s geographic o perating segments experienced a decline in iPhone ASPs during 2013.Of course, the growth in net sales and unit sales of iPad during 2013 resulted from growth in iPad unit sales in all of the Company’s operating segments. This growth was driven by the launch of iPad mini and the fourth generation iPad beginning in the first quarter of 2013. The year-over-year growth rate of total iPad unit sales was significantly higher than the growth rate of total iPad net sales for 2013 due to a reduction in iPad ASPs of 15% in 2013 compared to 2012. This decline resulted primarily from introduction of the lower priced iPad mini and the full year impact of the price reduction on iPad 2 made in 2012. The decline in iPad ASPs was experienced to various degrees by all of the Company’s operating segments.In addition, the increase in net sales of iTunes, software and services in 2013 compared to 2012 was primarily due to growth in net sales from the iTunes Store and so on. The iTunes Store generated a total of $9.3 billion in net sales during 2013, a 24% increase from 2012. Growth in the iTunes Store, which includes the App Store, the Mac App Store and the iBooks Store, reflectscontinued growth in the installed base of iOS devices, expanded offerings of iOS apps and related in-App purchases, and expanded offerings of iTunes digital content.But for Apple, there is no great advantage with Mac. During 2013, Mac net sales and unit sales were down or relatively flat in all of the Company’s operating segments. Mac ASPs increased slightly partially offsetting the impact of lower unit sales on net sales. The decline in Mac unit sales and net sales reflects the overall weakness in the market for personal computers.(2)Segment Operating PerformanceThe Company manages its business primarily on a geographic basis. Accordingly, the Company determined its reportable operating segments, which are generally based on the nature and location of its customers, to be the Americas, Europe, Greater China, Japan, Rest of Asia Pacific and Retail. The Americas segment includes both North and South America. The Europe segment includes European countries, as well as India, the Middle East and Africa. The Greater China segment includes China, Hong Kong and Taiwan. The Rest of Asia Pacific segment includes Australia and Asian countries, other than those countries included in the Company’s other operating segments. The Retail segment operates Apple retail stores in 13 countries, including the U.S. The results of the Company’s geographic segments do not includ e results of the Retail segment. Each operating segment provides similar hardware and software products and similar services. No matter how many the segments are, we can see that they all keep the increasing trend for the net sales.Here, we just see the result of the Greater China. The growth in net sales in the Greater China segment during 2013 resulted from two major iPhone introductions during the year, iPhone 5 in December 2012 and iPhone 5c and iPhone 5s in September 2013. Further contributing to the growth in 2013 was the introduction of the fourth generation iPad and iPad mini during the secondquarter of 2013 and an increase in iPhone channel inventory as of the end of 2013 compared to the end of 2012. While net sales in the China segment were up 13% for all of 2013, net sales for the second half of 2013 declined 4% compared to the second half of 2012.3、View on Gross MarginThe gross margin percentage in 2013 was 37.6% compared to 43.9% in 2012. The year-over-year decrease in gross margin in 2013 compared to 2012 was driven by multiple factors including introduction of new versions of existing products with higher cost structures and flat or reduced pricing; a shift in sales mix to products with lower margins; introduction of iPad mini with gross mar gin significantly below the Company’s average product margins; higher expenses associated with changes to certain of the Company’s service policies and other 32warranty costs; price reductions on certain products, including iPad 2 and iPhone 4; and unfavorable impact from foreign exchange fluctuations.The Company anticipates gross margin during the first quarter of 2014 to be between 36.5% and 37.5%. The foregoing statement regarding the Company’s expected gross margin percentage in the first quarter of 2014 is forward-looking and could differ from actual results. The Company’s future gross margin can be impacted by multiple factors including, but not limited to those set forth above in Part I, Item 1A of this Form 10-K under the heading “Risk Factors” and those described in this paragraph. In general, gross margins and margins on individual products will remain under downward pressure due to a variety of factors, including continued industry wide global product pricing pressures, increased competition, compressed product life cycles, product transitions, potential increases in the cost of components, and potential strengthening of the U.S. dollar, as well as potential increases in the costs ofoutside manufacturing services and a potential shift in the Company’s sales mix towards products with lower gross margins. In response to competitive pressures, the Company expects it will continue to take product pricing actions, which would adversely affect gross margins. Gross margins could also be affected by the Company’s ability to manage product quality and warranty costs effectively and to stimulate demand for certain of its products. Due to the Company’s signi ficant international operations, financial results can be significantly affected in the short-term by fluctuations in exchange rates.4、Conclusion, In short-term solvency, whether it's, current ratio, quick ratio, cash ratio is superior to other electronic products industry for the company. In asset operational efficiency index, from inventory turnover, the company turnover is fastest. From this aspect we can see it also reflects the apple products widely recognized by the market, and achieves good sales performance. In the profitability, the company's gross margin and operation profit is the best in the same industry.There is no doubt that in the capital market or on the sales, Apple has become the measure of the mobile Internet era. Now, its iPad and iPhone 5s is popular in public. The company also plans to launch a series of mid-range apple mobile phones. Results in the above financial reports showed that Apple acquires revenue of $54.5 billion from this quarter, $13.81 earnings per share and net profit of $13.1 billion. Apple take innovation as the core, whether apple's past performance, and future growth, I think we can hold for a long time.Reference[1] The Analysis of Financial Reports on Apple, 2013</view/6391a713fc4ffe473268ab03.html>. [2]2013 10-K Annual Reports, 2013</>.[3] Xu Shujuan. Discussing with Enterprise financial analysis method, 2005</Article/CJFDTotal-JJSY200903028.htm>.。
苹果公司近三年财务报表Word版
8067.00
折旧/摊销
0.00
0.00
0.00
0.00
净运营利息支出(收入)
0.00
0.00
0.00
0.00
非常规支出(收入)
0.00
0.00
0.00
0.00
其他运营开支总额
0.00
0.00
0.00
0.00
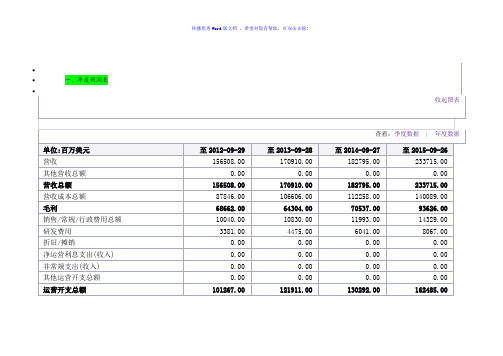
运营开支总额
101267.00
121911.00
130292.00
162485.00
0.00
0.00
0.00
0.00
非经常项目
0.00
0.00
0.00
0.00
净利润
41733.00
34.00
优先股息
0.00
0.00
0.00
0.00
归属普通股东收益(不计非经常项目)
41733.00
37037.00
39510.00
53394.00
归属普通股东收益(包括非经常项目)
-56274.00
-22579.00
-33774.00
-48227.00
融资现金流项目
749.00
739.00
701.00
1351.00
现金支付股息总额
-11561.00
-11126.00
-10564.00
-2488.00
净发行(赎回)股票
-36209.00
-45428.00
-23412.00
-561.00
7637.00
5554.00
3612.00
10669.00
短期投资
18383.00
美国苹果公司财务报表分析报告

Apple 产品系列--iPhone
2007年,发布了iPhone
Apple 产品系列--Mac
2008年,发布了MacBook Air,这是当时最薄的笔记本电脑
Apple 产品系列--iPad
2010年,1月27日苹果公司平板电脑iPad正式发布
1) 总资产变化分析 :2008年的总 资产361.71亿美元,比2007年增加了 111.24亿美元,增长43.89%;2009年的总 资产475.01亿美元,比2008年增加了 113.30亿美元,增长31.32%;2010的总资 产751.83亿美元,比2009年增加了276.82 亿美元,增长58.27%。
截至 200709-29 的 52 周
主营业务收入 主营业务成本 毛利总额 销售费用及管理费用 研发费用 营业费用合计 营业利润 税前利润 净利润
65,225.00 39,541.00 25,684.00 5,517.00 1,782.00 46,840.00 18,385.00 18,540.00 14,013.00
30,006.00
截至 2007-0929 的 52周21,956.00非流动资产总额 33,505.00
15,946.00
6,165.00
3,391.00
资产合计
75,183.00 47,501.00
36,171.00
25,347.00
流动负债总额 20,722.00
11,506.00
11,361.00
15,129.00
9,101.00
其他权益(合计) -46.00
77.00
-9.00
63.00
AAPL苹果公司财务报表分析

2014年
68531.00 2111.00
流动负债
速动比率
27970.00
1.58
38542.00
1.48
43658.00
1.64
63448.00
1.05
苹果与谷歌、微软速动比率对比
公司 2012年 2013年 2014年
苹果
1.48
1.64
1.05
谷歌
4.18
4.55
4.80
微软
2.57
2.66
苹果公司 财务报表分析
公司介绍
苹果公司(Apple Inc. )是美国的一家高科技公司。由史蒂夫·乔布斯、斯蒂 夫·沃兹尼亚克和罗·韦恩(Ron Wayne)等三人于1976年4月1日创立,并命名为 美国苹果电脑公司(Apple Computer Inc. ), 2007年1月9日更名为苹果公 司,总部位于加利福尼亚州的库比蒂诺。
流动资产周转率
单位:百万美元
项目 营业收入 流动资产平均余额 2011年 108249.00 44988.00 2012年 156508.00 57653.00 2.71 135 2013年 170910.00 73286.00 2.33 157 2014年 182795 .00 68531.00 2.67 137
股东权益比率及权益乘数分析
• 股东权益比率是股东权益总额与资产总额之比,表明该公司全部 资产中有多少是由投资者投资所形成的。是公司长期偿债能力保 证程度的重要指标。该指标越高,说明该公司资产中由投资人投 资所形成的资产越多,偿还债务的保证程度越高。从股东权益比 率=1-资产负债率看,该指标越大,资产负债程度越小,公司财务 风险就越小。 • 权益乘数,该指标表示公司的股东权益支撑着多大规模的投资, 是常用的财务杠杆计量方法。该乘数越大,说明公司对负债经营 利用的越充分,财务风险越大,债权人受保护程度越低。 • 从2011年到2014年,苹果公司的股东权益比率逐年下降,表明该 公司债务负担逐年增加,另外,该公司的权益乘数呈逐年上升趋 势,说明公司资产对负债的依赖程度提高,承担的风险有所增加 ,偿债保证程度有所减弱,债权人利益的保证程度有所降低。
苹果财务分析 PPT课件

二、苹果的企业文化
乔布斯理念
1、偏执创新:乔布斯将他的旧式战略真正贯彻于新的数字世界中,
采用的是高度聚焦的产品战略、严格的过程控制、突破式的创新和持 续的市场营销。这是一种病态的完美主义品质。美中联合商会会长 《苹果风暴》一书的作者林志共说,苹果产品的最大特点是如同精益 求精的艺术品,而且把科技的元素融入商业的产品,并非让科技复杂 性难倒用户。
Page 4
乔布斯说:
慈善事业等到我们盈利再 说!
--史蒂夫 ·乔布斯
➢ 等苹果盈利了,坐拥400 亿现金,却仍未参与慈善 性项目。
Page 5
三、苹果的营销策略
1、拉式营销
2、推式营销
3、病毒营销
4、饥饿营销
Page 6
1、拉式推销
iTunes iPod iPod iTunes 5 iTunes 82%
﹒苹果最知名的产品是其出品的Apple II、Macintosh电脑、iPod音乐播放器、 iTunes商店、iPhone手机和iPad平板电脑等。在高科技企业中以创新而闻名。
﹒苹果已连续三年成为全球市值最大公司,在2012年曾经创下6235亿美元记 录,2013年后企业市值缩水24%为4779亿美元,但仍然是全球市值最大的公 司。2014年苹果公司已连续第二年超越谷歌(Google),成为世界最具价 值品牌。
Technologies,以便帮助该公司进一步完善Siri个人数字助理服务。
收购Beats 据《金融时报》报道,苹果很快将要敲定对耳机生产商Beats的收购
案,这一收购意义重大,可以说Beats改变了下载音乐服务。这一高 达32亿美元的收购将赋予苹果一个强大的品牌控制权,且将是苹果史 上最大的收购动作。
苹果公司近三年财务报表

64462.00
递延所得税
13847.00
16489.00
20259.00
24062.00
少数权益
0.00
0.00
0.00
0.00
其他债务总额
5465.00
6344.00
7598.00
12989.00
债务总额
57854.00
83451.00
120292.00
171124.00
可赎回优先股总计
57653.00
73286.00
68531.00
89378.00
物业/厂房/设备总计(毛额)
21887.00
28519.00
39015.00
49257.00
累计折旧总额
-6435.00
-11922.00
-18391.00
-26786.00
商誉净额
1135.00
1577.00
4616.00
5116.00
-22579.00
-33774.00
-48227.00
融资现金流项目
749.00
739.00
701.00
1351.00
现金支付股息总额
-11561.00
-11126.00
-10564.00
-2488.00
净发行(赎回)股票
-36209.00
-45428.00
-23412.00
-561.00
净发行(赎回)债务
0.00
0.00
0.00
0.00
其他权益总额
731.00
-191.00
-40.00
-464.00
财务管理案例分析3篇:分享财务管理的成功案例与经验
财务管理案例分析3篇:分享财务管理的成功案例与经验一、苹果公司的成功财务管理案例分析苹果公司是一家全球知名的科技公司,其成功的背后离不开其精细的财务管理。
苹果公司拥有庞大的资产和收入,每年都能够创造出令人咂舌的利润,这都离不开其财务管理的精细和卓越。
首先,苹果公司的财务管理始终倡导简洁、高效和透明的原则,确保公司财务数据的及时准确和公开透明。
其次,苹果公司在利润和现金管理上也做得非常出色,不但能够稳定的提供股东回报,还能为公司未来的投资和扩张提供充足的资金支持。
另外,苹果公司还通过有效的成本控制和管理,保持了高效的生产和运营效率,并在市场竞争中赢得了更多的优势。
最后,苹果公司在财务管理上注重风险管理和规避,以确保公司经营的稳定和持续性。
总之,苹果公司成功的财务管理经验值得其他企业借鉴和学习。
苹果公司在财务管理上始终坚持高效、透明、规范的原则,不断优化和改进财务管理体系,保持了公司经营的稳健性和可持续性。
二、亚马逊公司的成功财务管理案例分析亚马逊公司是全球最大的电商公司之一,其成功的财务管理是其发展的重要支撑。
亚马逊公司始终坚持的财务管理原则是高效、透明、规范和创新,这些原则体现在公司财务管理的各个方面。
首先,亚马逊公司在现金和资产管理方面做得非常出色。
公司会定期对资产进行评估和管理,从而保证公司的投资和股东回报。
其次,亚马逊公司不断创新财务管理模式和技术,借助数字化技术来提高财务管理的效率和准确性。
另外,亚马逊公司在风险管理和规避方面也做得非常出色,通过建立风险管理体系,对可能的风险进行及时识别,规避和应对。
最后,亚马逊公司注重员工的财务素养和培训,提高员工的财务意识和管理能力。
总之,亚马逊公司的成功财务管理经验体现在其高效、透明、规范和创新的财务管理模式和原则。
同时,亚马逊公司不断优化和完善其财务管理体系,以保持公司的竞争优势和可持续发展。
三、耐克公司的成功财务管理案例分析耐克公司是一家全球知名的鞋类和运动装备生产商,其成功的财务管理为公司发展提供了稳定的资金支持和经营保障。
- 1、下载文档前请自行甄别文档内容的完整性,平台不提供额外的编辑、内容补充、找答案等附加服务。
- 2、"仅部分预览"的文档,不可在线预览部分如存在完整性等问题,可反馈申请退款(可完整预览的文档不适用该条件!)。
- 3、如文档侵犯您的权益,请联系客服反馈,我们会尽快为您处理(人工客服工作时间:9:00-18:30)。
2.45
现金比率
单位:百万美元
项目 现金类资产
2011年
2012年
2013年
2014年
9815.00
10746.00
14259.00
13844.00
流动负债
27970.00
38542.00
43658.00
63448.00
现金比率
0.35
0.28
0.33
0.22
长期偿债能力分析
资产负债率
项目 负债总额 资产总额 2011年 39756.00 116371.00 2012年 57854.00 176064.00 2013年 83451.00 207000.00
目录
1 2 3 3
短期偿债能力分析
长期偿债能力分析
营运能力分析
盈利能力与盈利质量分析
短期偿债能力分析
营运资本
项目 流动资产 流动负债 营运资本 2011年 44988.00 27970.00 17018.00 2012年 57653.00 38542.00 19001.00
单位:百万美元
2013年 73286.00 43658.00 29628.00
苹果公司1980年12月12日公开招股上市,2012年创下6235亿美元的市值记
录,截至2014年6月,苹果公司已经连续三年成为全球市值最大公司。苹果公 司在2014年世界500强排行榜中排名第15名。2013年9月30日,在宏盟集团 的“全球最佳品牌”报告中,苹果公司超过可口可乐成为世界最有价值品牌。 2014年,苹果品牌超越谷歌(Google),成为世界最具价值品牌。
股东权益比率及权益乘数分析
• 股东权益比率是股东权益总额与资产总额之比,表明该公司全部 资产中有多少是由投资者投资所形成的。是公司长期偿债能力保 证程度的重要指标。该指标越高,说明该公司资产中由投资人投 资所形成的资产越多,偿还债务的保证程度越高。从股东权益比 率=1-资产负债率看,该指标越大,资产负债程度越小,公司财务 风险就越小。 • 权益乘数,该指标表示公司的股东权益支撑着多大规模的投资, 是常用的财务杠杆计量方法。该乘数越大,说明公司对负债经营 利用的越充分,财务风险越大,债权人受保护程度越低。 • 从2011年到2014年,苹果公司的股东权益比率逐年下降,表明该 公司债务负担逐年增加,另外,该公司的权益乘数呈逐年上升趋 势,说明公司资产对负债的依赖程度提高,承担的风险有所增加 ,偿债保证程度有所减弱,债权人利益的保证程度有所降低。
单位:百万美元
2014年 1ห้องสมุดไป่ตู้0292.00 231839.00
资产负债率
34.16%
32.86%
40.31%
51.89%
资产负债率分析
• 资产负债率是最常用的资本结果衡量指标,也是长期偿债能力分 析的核心指标。从2011年到2014年,苹果公司的资产负债率呈上 升趋势。资产负债率越高,说明该公司在获取资产时更倾向于依 赖负债,公司的长期偿债能力较弱,财物风险较高。
2014年
68531.00 2111.00
流动负债
速动比率
27970.00
1.58
38542.00
1.48
43658.00
1.64
63448.00
1.05
苹果与谷歌、微软速动比率对比
公司 2012年 2013年 2014年
苹果
1.48
1.64
1.05
谷歌
4.18
4.55
4.80
微软
2.57
2.66
2014年 68531.00 63448.00 5083.00
流动比率
单位:百万美元
项目
2011年
2012年
2013年
2014年
流动资产
44988.00
57653.00
73286.00
68531.00
流动负债
27970.00
38542.00
43658.00
63448.00
流动比率
1.60
1.50
1.68
1.08
苹果与谷歌、微软流动比率对比
公司 2012年 2013年 2014年
苹果
1.50
1.68
1.08
谷歌
4.42
4.58
4.80
微软
2.60
2.71
2.50
速动比率
单位:百万美元
项目
流动资产 存货
2011年
44988.00 776.00
2012年
57653.00 791.00
2013年
73286.00 1764.00
单位:百万美元
2014年 120292.00 111547.00 4142.00
有形净资产债 54.40% 务率
50.76%
69.91%
111.99%
有形净值债务率分析 有形净值债务率是公司负债总额与有形资产净值的百分比。有形净资产是股东权益减去无 形资产后的净值。因为无形资产的价值具有很大的不确定性,往往不能用于偿债,因此, 在公司陷入财务危机或面临清算等特殊情况下,运用该指标更能反映债权人利益的保障程 度,比率越低,保障程度越高,公司有效偿债能力强,
苹果公司 财务报表分析
公司介绍
苹果公司(Apple Inc. )是美国的一家高科技公司。由史蒂夫·乔布斯、斯蒂 夫·沃兹尼亚克和罗·韦恩(Ron Wayne)等三人于1976年4月1日创立,并命名为 美国苹果电脑公司(Apple Computer Inc. ), 2007年1月9日更名为苹果公 司,总部位于加利福尼亚州的库比蒂诺。
• 产权比率越低,表明公司长期长期偿债能力越强,债权人承担的 风险越小,2011年与2014年相比,该公司的产权比率呈逐年增加 趋势,说明该公司财务结构风险进一步提高,股东权益对偿债分 险的承受能力减弱,对债务的保障程度低,公司的长期偿债能力 降低。
有形净值债务率
项目 负债总额 股东权益 无形资产 2011年 39756.00 76615.00 3536.00 2012年 57854.00 118210.00 4224.00 2013年 83451.00 123549.00 4179.00
产权比率
项目 负债总额 2011年 39756.00 2012年 57854.00
单位:百万美元
2013年 83451.00
2014年 120292.00
股东权益
产权比率
76615.00
51.89%
118210.00
48.94%
123549.00
67.54%
111547.00
107.84%
产权比率分析
股东权益比率
单位:百万美元 项目 股东权益 资产总额 股东权益比率 权益乘数 2011年 76615.00 116371.00 65.84% 1.52 2012年 118210.00 176064.00 67.14% 1.49 2013年 123549.00 207000.00 59.69% 1.68 2014年 111547.00 231839.00 48.11% 2.08