外文文献及译文封皮
毕业论文(设计)外文文献翻译及原文

金融体制、融资约束与投资——来自OECD的实证分析R.SemenovDepartment of Economics,University of Nijmegen,Nijmegen(荷兰内梅亨大学,经济学院)这篇论文考查了OECD的11个国家中现金流量对企业投资的影响.我们发现不同国家之间投资对企业内部可获取资金的敏感性具有显著差异,并且银企之间具有明显的紧密关系的国家的敏感性比银企之间具有公平关系的国家的低.同时,我们发现融资约束与整体金融发展指标不存在关系.我们的结论与资本市场信息和激励问题对企业投资具有重要作用这种观点一致,并且紧密的银企关系会减少这些问题从而增加企业获取外部融资的渠道。
一、引言各个国家的企业在显著不同的金融体制下运行。
金融发展水平的差别(例如,相对GDP的信用额度和相对GDP的相应股票市场的资本化程度),在所有者和管理者关系、企业和债权人的模式中,企业控制的市场活动水平可以很好地被记录.在完美资本市场,对于具有正的净现值投资机会的企业将一直获得资金。
然而,经济理论表明市场摩擦,诸如信息不对称和激励问题会使获得外部资本更加昂贵,并且具有盈利投资机会的企业不一定能够获取所需资本.这表明融资要素,例如内部产生资金数量、新债务和权益的可得性,共同决定了企业的投资决策.现今已经有大量考查外部资金可得性对投资决策的影响的实证资料(可参考,例如Fazzari(1998)、 Hoshi(1991)、 Chapman(1996)、Samuel(1998)).大多数研究结果表明金融变量例如现金流量有助于解释企业的投资水平。
这项研究结果解释表明企业投资受限于外部资金的可得性。
很多模型强调运行正常的金融中介和金融市场有助于改善信息不对称和交易成本,减缓不对称问题,从而促使储蓄资金投着长期和高回报的项目,并且提高资源的有效配置(参看Levine(1997)的评论文章)。
因而我们预期用于更加发达的金融体制的国家的企业将更容易获得外部融资.几位学者已经指出建立企业和金融中介机构可进一步缓解金融市场摩擦。
毕业设计外文文献格式

本科毕业论文外文文献及译文Current situation of energy consumption and measures taken for energy saving in the iron and steel industry in China文献来源:期刊发表日期:2009.5.17学院:资源与冶金学院专业:冶金工程班级:冶金121姓名:孔博文学号:1206300131指导教师:梁铎强翻译日期:2016.6.23外文文献:Current situation of energy consumption and measures taken for energy saving in the iron and steel industry in China abstractA survey of the key issues associated with the development in the Chinese iron and steel industry and current situations of energy consumption are described in this paper. The apparent production of crude steel in China expanded to 418.78 million tonnes in 2006, which was about 34% share of the world steel production. The iron and steel industry in China is still one of the major high energy consumption and high pollution industries, which accounts for the consumption of about 15.2% of the national total energy, and generation of 14% of the national total waste water and waste gas and 6% of the total solid waste materials. The average energy consumption per unit of steel is about 20% higher than that of other advanced countries due to its low energy utilization efficiency. However, the energy efficiency of the iron and steel industry in China has made significant improvement in the past few years and significant energy savings will be achieved in the future by optimizing end-use energy utilization. Finally, some measures for the industry in terms of the economic policy of China’s 11th five-year plan are also presented.1.IntroductionThe steel industry has for long played an important role in the development of China’s economy. Over the past decades, China’s steel industry has grown rapidly, overtaken Japan, and become the world’s largest steel producer in 1996. In 2006, China’s production of crude steel amounted to 418.78 million tonnes (Mt) [1] and, continued to remain first in rank. The share of output of crude steel of about 335.17 Mt of the key producers accounted for 80% of the aggregate national production and 83.61 Mt of local producers for 20% [2]. In this paper, these key producers are the main subjects of our study.Despite these achievements, China remains a steel producer whose energy efficiency is the lowest among the major steel-producing countries, although the overall technical level of its industry has been greatly improved in line with the developments in science and technology. One typical example is the rapid adop-tion of continuous casting technology. The share of continuous casting output has increased from about 30% of all steel produced in 1992 to 95.8% in 2004. In the meantime, many large firms replaced aging blast furnaces, open-hearth furnaces, and ingot casters with large-scale, modern blast furnaces, and casting and rolling facilities. Iron making may take place either through the blast furnace process or by direct reduction and the subsequent transformation of iron into steel may be carried out either in an oxygen-blown converter or in an electric arc furnace.With improvement of the overall technical level in the steel industry, the production of iron and steel has greatly expanded in the past decade, as shown in Fig. 1 [1–4]. The apparent production of crude steel in China grew from 95 million tonnes in 1995 to 418.78 million tonnes in 2006, which is about 4.5 times that in 1995 and more than three times that in 2000 [3]. As a result, China’s share of world steel production leaped from 13% in 1995 to 34% in 2006. This growth is expected to be sustained over the next few years due to the continued growth in domestic demand.As is well known, the iron and steel industry is the industry with the largest energy consumption in the world. Having become the world’s largest steel producer since 1996 China’s steel industry has grown rapidly following huge growth in domestic demand. This increase is consistent with the trend in the increase in its energy consumption.Iron and steel production consumes large quantities of energy, especially in developing countries and countries with economies in transition where outdated and inefficient technologies are often still used. Steel production in developing countries has grown at an average annual rate of 6.6% in recent years [5] and is expected to continue to grow at similar levels due to the current low per capita steel consumption levels in these countries. In industrialized countries, steel consumption averages over 425 kg/capita, whereas even key steel-producing developing countries have extremely low average per capita consumption levels of 80 kg/capita (in 1995).Fig. 1. Crude steel production of China and share of the world from 1995 to 2006.Most of China’s steel industry developed through a system of state-owned ‘enterprises’, in which an entire community was devoted to the production of steel. As a result, the data collected relating to the energy consumed to produce steel in China also contain energy used at the enterprise level for a variety of other functional departments, both directly and indirectly related to the production of steel. In addition, part of China’s steel is produced by small steel mills that do not report energy consumption data to government statistical sources. It is important to differentiate these data so that the consumption values of China’s energy can be fairly evaluated, especially when we compare the energy consumption and energy intensity of the Chinese steel industry to those of other countries or to particular ‘best practice’examples. We note that even with these adjustments, it is possible that the data still include inaccuracies due to the issues of statistical reports.The objective of this paper is to present a survey of some of the key issues associated withthe development in the Chinese steel industry, and describes the status of its energy consumption. The differences in steel consumption in major processes and China’s role in the scene of the international steel industry are analyzed, and the outlook and the measures to be instituted for China’s iron and steel industry are also presented in the paper. It is important for the world to better understand China’s energy consumption and the use of raw materials and for China to better understand the approaches that have been developed or are being developed in other countries for more efficient use of energy and raw materials. The authors hope this paper contributes to the improved under-standing of these aspects of the industry.2.Energy consumption structure of the iron and steel industry in ChinaIt is well known that electricity production in China mainly depends on coal, and coal is also the most important fuel used in China’s iron and steel industry. In 2004, the energy consumption mix of the Chinese steel industry consisted of 69.90% coal, 26.40% electricity, 3.2% fuel oil, and 0.5% natural gas, as shown in Fig. 2 [4]. Coal is not only the most widely used fuel but is also as necessary as raw material in the iron and steel industry as most of the rest is electricity. Such a fuel structure raises the energy consumption per unit of production and is unlikely to change greatly in the near future.Fig. 2. Energy consumption mix of the steel industry of China in 2004.3. Energy consumption situation in the steel industryThe key iron and steel producers in China play an important role in its manufacture of steel and in the consumption of energy. In 2003, China’s 10 largest steel firms produced more than a third of China’s steel output, with the top four firms producing more than 20% [6]. This implies that many advanced technologies have earlier existed in China’s steel industry, but the current industry’s concentration limits the application of these technologies lowering energy efficiency in general [7]. Therefore, the iron and steel industry remains one of the highest energy consumersand pollu-tion producers accounting for about 15.2% of the national total energy consumption, 14% of the national total waste water and waste gas, and 6% of the total solid waste materials generated.Fig. 3 shows the variations in energy consumption of the key enterprises in China from 1995 to 2006 [3,8–10]. The total energy consumption of the iron and steel industry rose rapidly along with rising steel production in the past decades. In the year 2004, the total steel production of China was 274.7 Mt, rising by 107.7% compared to 2000 and by 184.2% compared to 1995 [10]. The total energy consumption of the key enterprises in China soared from 96.30 Mtce in 2000 to 197.79 Mtce in 2006, which was over twice that for 2000. However, the rising trend in energy consumption weakened in 2006, when it was 8.8% lower than that of the year before.With the application of many new technologies and equipment, the index of energy consumption per tonne of steel decreased remarkably in the past decades. The overall energy consumption for China’s large and medium producers in 2005 was 741 kgce per tonne of steel, which was 20.3% lower than that in 2000 of 930 kgce per tonne. In 2006, the overall energy consumption per tonne of steel continued to decrease to 645 kgce per tonne of steel. The comparable energy consumption also took on a decreasing trend.Fig. 3. Variation of energy consumption of the key enterprises in China from 1995 to 2006.Fig. 4. Fresh water consumption per tonne of steel from 2000 to 2005.The variations in fresh water consumption per tonne of steel from 2000 to 2006 are shown in Fig. 4 [3,10]. The total quantity of fresh water used per tonne of steel in 2006 was 6.56 m3, which is 14.9% lower than that in 2005. Other data comparing energy saving, water saving, and environmental protection between 2000 and 2005 are presented in Table 1 [10]. It can be seen that the energy efficiency of China’s iron and steel industry has made significant improvement in the past few years.4.Energy consumption situation of several main processes in the steel industryFig. 5 shows the variations in energy consumption of several major processes in the steel industry from 1995 to 2005 [3,10]. The energy consumption of the blast furnace, electric furnace and steel rolling processes has decreased remarkably since 1995, and the corresponding values for the coking, sintering, and converter furnaces have also shown minor decreases. In contrast to the years before 2001, the current energy consumption of the blast furnace process presents an increasing trend that is attributed to cost increases since 2001 in raw materials for iron making, such as coke and coal.Fig. 5. Variation of energy consumption of several main processes in the steel industry in1995–2005.Among several major processes, the energy consumption of the iron making process is markedly higher than that of other processes. Taking the example of 2004 as shown in Fig. 6, the total energy consumption of the iron making system accounted for about 70% of the total process energy consumption, including 39% for the blast furnace, 11.9% for coking, 3.51% for balling and 5.55% for sin-tering. The remaining processes accounted for a small part of about 30%, which is comprised of 12.5% for power, 7.77% for rolling steel, 17.5% for the electric furnace, and 2.22% for the converter furnace. This means that the iron making system is a key part of any energy conservation effort in the steel industry.parisons of energy consumption of the steel industry in China with international levelsEnergy consumption per tonne of steel in China is higher than that of most advanced countries. One of the reasons for this is that the energy utilization efficiency in China is low. The average energy consumption per unit of steel is about 20% higher than that of other advanced countries. Compared with Japan, for example, energy consumption for China’s large and medium firms in 2004 was 705 kgce per tonne of steel, 7.5% higher than that in Japan, which was 656 kgce per tonne. However, the energy consumption level of the small production units in Chinawas as high as 1045 kgce per tonne of steel.Fig. 6. Energy consumption structure of several main processes in the steel industry in 2004.Z.C. Guo, Z.X. Fu / Energy 35 (2010) 4356–4360The general energy efficiency of China’s steel industry is still relatively low. One of the important reasons is the existence of these small units. Table 2 shows that there is a vast difference in energy consumption between the advanced and small plants [8]. Only a few large-scale steel-makers have attained or have even exceeded the international levels. Since the output of these advanced plants cannot achieve market dominance, the average energy consumption level of China’s iron and steel industry is still embarrassing.The second reason is the existence of small-scale and decen-tralized industry in China. There are 18 plants with production capacities exceeding 5 Mt of crude steel, which accounted for 46.36% of the total national crude steel production in 2005. In Japan, the crude steel production of four largest plants accounted for 73.22% of the total national crude steel production in 2004, three of which accounted for 61.09%. Except for a few of the large-scale steel plants, China’s steel industry lags behind in technology, equipment, energy saving, environmental protection, etc. The third reason is that the low recovery and recycling efficiency of the secondary energy resources results in higher energy consumption.6.Measures and policy recommendations for the iron and steel industries of China6.1. To expand coke dry quenching technologyTraditionally, the sensible heat of hot coke, pushed from the coking chamber at the temperature of 950–1050 C, is almost equal to 35%–40% of the total amount of heat consumed in the coking process. Adopting coke dry quenching technology can enable recovery of about 80% of the sensible heat from hot coke. Besides, during dry quenching 1 tonne of hot coke can generate 0.45–0.60 tonne of steam at a pressure of about 3.9 MPa. The coke dry quenching process belongs to a technology that is energy saving, environmentally protective, and pollution-free. By using coke dry quenching, it is estimated that the rotary drum strength (M40) of coke increases by 3%–8% and the coke strength after CO2 reaction by 3%–4%. In addition, the quantity of weak binding coal input can be increased by 10% saving about 0.38 tonne of water for every tonne of coke.At the end of 2005, the proportion of coke dry quenching technology usage in China’s iron and steel industry was less than 30%. At the end of 2007, with the spread of this technology rein-forced by an independent innovation in the past two years, the proportion of usage rose to 45%. Now 34 sets of the coke dry quenching unit are under construction and the output share of coke of about 101.58 Mt produced by the coke dry quenching technology accounts for one-third of the total national production.6.2. To expand top gas pressure recovery turbine (TRT) technologyPower can be generated with the energy of pressure from the top of a blast furnace using a turbine generator group. Theoretically,the power generated from TRT equipment is equal to the power energy consumed when the coal gas pressure at the top of the blast furnace is 80 kPa. Economic returns may be obtained when the pressure of the coal gas reaches 100 kPa and even higher economic returns can be achieved, especially, if the coal gas pressure is greater than 120 kPa. In steel production by the blast furnace route, increasing the pressure at the top of the blast furnace is advanta-geous as it leads to recovery of energy resources. The amount of power generated increases by 30% if dry dust is removed at the coal gas purification stage and theturbine capacity by about 3% if the temperature of coal gas is raised by 10 C. If TRT equipment is adopted, it is estimated that 30% of energy can be recovered from the air blast for the furnace and the energy consumption in the steel making processes reduced by l l kgce/t.At the end of 2007, the blast furnaces of capacity greater than 2000 m3 in China that were equipped with TRT technology numbered 49. In future, the use of TRT technology large-scale blast furnaces in China will be widespread and vigorous.6.3. To expand the technology of pulverized coal injection for the blast furnaceUse of pulverized coal injection for blast furnaces is an impor-tant innovation for optimizing steel making systems using the blast furnace route. In addition, it is a powerful incentive to prompt the iron–steel industry to progress in many aspects such as optimizing energy structure, energy saving, reducing consumption of mate-rials, cost reduction, etc. Replacing coke by coal can ease the problem of coking coal shortage caused by energy saving measures. Besides, it can reduce environmental pollution from the coking process while also producing considerable economic returns resulting from the price difference between coal and coke.In 2007, the average quantity of pulverized coal injection employed for the blast furnace route by China’s large and medium producers was 137 kg per tonne of iron, which in 2000 was 118 kg per tonne of iron. The average quantity of injection has exceeded 200 kg per tonne of iron in some large-scale blast furnaces of China. The 4350 m3 capacity blast furnace in Bao-steel is an example. It is estimated that in 2010 the average pulverized coal injection quantity realized in China’s blast furnaces iron will be 160 kg per tonne.6.4. To eliminate low-level equipment and introduce and develop new technologyOver the past few years, the government of China made a strong effort to eliminate low-level equipment. The energy consumption of China’s small iron and steel units was 1.5 times higher than that of the large and medium producers. When China implemented its 11th five-year plan’s policy of energy saving and reducing discharge of pollutants the steel industry was restructured, its equipment capacities enhanced, and pace of modernization accelerated all ofwhich produced an enormous effect.In 2007, the number of blast furnaces with a capacity of 2000 m3 in China was 63, 17 more than that in 2005, and production capacity increased by 35%. The number of converters with a capacity of 100 tonnes was 98 in 2007, eight more than that in 2005, and production capacity increased by 8%. In 2007, the overall energy consumption, the fresh water consumption, the total emission of SO2, the total soot emission, and the total mill dust emission per tonne of steel declined by about 8%, 24%, 4.5%, 3% and 4.5%, respectively, when compared with that in 2005.In addition, China’s iron and steel industries introduced and developed actively new technologies, such as COREX and C300 melted-deoxidize technology.6.5. To create the recycling economy chain within the iron–steel industryIt is believed that three recycling economy chains could be developed in the iron–steel production process aiming at zero emission. First is recycling flue gas, which means that not only coal or coke but also flue gas will be recycled from blast furnaces, converters, or coke ovens to realize zero flue gas emission. The second is recycling industrial waste water, which means that the consumption of fresh water will be minimized and industrial waste water will be recycled using some treating equipment. The third is recycling solid waste materials. It is a comprehensive reuse process for some raw materials such as iron ores left over from the production process.China’s traditional development pattern such as large invest-ment, regardless of serious pollution and lower value-added products resulted in China’s location at the low end of the value chain of the worldwide industrial structure. It is the most impor-tant reason for China’s high consumption of energy. Compared with developed countries, China’s use of poorer quality equipment and ineffective use of process energy led to lower energy utilization efficiency.7.ProspectsWith the improvement of the overall technical level in the steel industry, the production of iron and steel has greatly expanded in the past decade. However, the iron and steel industry is still one of the major high energy consumption and high polluting industries in China. Although the energy efficiency of the iron and steel industry in China has made significant improvement in the past few years, the average energy consumption per unit of steel is about 20% higher than that of other advanced countries owing to low energy utilization efficiency, the existence of somesmall-scale and decentralized industries and low recovery and recycling efficiency of the secondary energy resources. During 2006–2010, the period of China’s 11th five-year plan, based on existing policies, measures and standards, China will promulgate and implement some new policies with more ambitious objectives of sustainable develop-ment and restructuring in the steel industry. One objective of this plan is to build a society committed to energy conservation and a pollution-free environment and to develop the recycling economy chain in the iron and steel industry. Successful implementation of current sustainable development policies and measures will result in considerable energy saving.According to this plan, China’s energy consumption per GDP in ‘China’s 11th five-year plan’will decrease by 20%, the water consumption per unit of industrial added value will decrease by 30% and the total emission of main pollutants will decrease by 10%. Some major tasks will be undertaken for some high energy consumption industries such as the iron and steel industry, nonferrous metal industry, coal industry, power sector, and chemical industry. Therefore, a new industrial path leading to the use of technology-intensive products, optimal economic efficien-cies, lower resource consumption, and less environmental pollu-tion should be forged. There will be significant energy savings by optimizing end-use energy utilization.References[1]Xie QH. The operational aspects of iron and steel industry of China in 2006 and the prospects in 2007. China Steel 2007;2:6–11 (in Chinese).[2]/cyfz/hxfx/t20070126_113627.htm[3]/economic/txt/2007-02/22/content_7852832.htm[4]Wang K, Wang C, Lu XD, Chen JN. Scenario analysis on CO2 emissions reduction potential in China’s iron and steel industry. Energy Policy 2007;35: 2320–35.[5]The Editorial Board of China steel yearbook China steel yearbook. Beijing: China Statistical Publishing House; 2004.[6]Heane A, Heste S, Gurney A, Fairhead L, Beare S, Me´lanie S, et al. New energy technologies: measuring potential impacts in APEC. APEC Energy Working Group, Report no. APEC#205–RE–01.1. Published by ABARE as Research Report 05.1, Canberra. /apec/publications/free_downloads/2005.Medialib Download.v1.html?url=/et c/medialib/apec_media_library/ downloads/workinggroups/ewg/pubs/2005.Par.0001.File.v1.1. [7]Weng YQ. Current status and prospect of energy saving and environment protection of Chinese steel industry. China Metallurgy 2003;11:1–6 (in Chinese).[8]/Info_Show.aspx?Mess_Id¼1659[9]Wang WX. Iron and steel enterprises’process energy consumption and energy saving potential. Metallurgy Management 2005;6:32–4 (in Chinese).[10]Cai JJ, He JH, Lu ZW, Li GT, Wang WX, Kong LH. Analysis of energy saving and energy consumption in Chinese steel industry for last 20 years and next 5 years. Iron and Steel 2002;37:68–73 (in Chinese).中文译文:我国钢铁工业能源消耗现状及节能对策摘要本文介绍了我国钢铁工业发展中的关键问题和能源消耗现状。
外文文献原稿和译文

外文文献原稿和译文原稿MechanicalandRegenerativeBrakingIntegrationforaHybridElectricVehicleAbstract,namelyanelectricmotorandinternalcombustionengine,whichallowtheelimina tionofidling,,theaddedcostofthehybridelectricsystemhashinderedthesalesofth esevehicles.JapanNorth America automotive companieshavedevelopedandreleasedforsaletheirownhybridelectric unpredictablegasprices,thesalesofhybridelectricvehicleshaveincreaseddramat ically inrecentyears.2.1.1HybridConfigurationsForthepast100yearstheobjectiveofthehybridhasbeentoextendtherangeofelec tricvehiclesandtoovercometheproblemoflongrechargingtimes35.Therearethree ,par allelhybridsandseries/parallelhybrids.Eachconfigurationhasitsadvantagesanddisadvantageswhichwillbediscussedi nthefollowingsections.SeriesHybridsInserieshybridsthemechanicaloutputfromtheinternalcombustionengineisuse dto driveageneratorwhichproduceselectricalpowerthatcanbestoredinthebatteriesor highpowersystemssuchaslargetrucksorlocomotivesbutcanalsobeusedforlowerpowe rpassengervehicles18.2.1.2‘degreeofhybridization’toquantifytheelectrica lpowerpotentialofthesevehicles.ThedegreeofhybridizationrangesfromDOH=0foraconventionalvehicletoDOH=1f oranallelectricvehicle25.Asthedegreeofhybridizationincreases,asmallerICEcanbeusedandoperatedclosertoitsoptimumefficiencyforagreaterproportionoftheti me,.MicroHybrid MicrohybridshavethesmallestdegreeofhybridizationandusuallyconsistofanintegratedstartergeneratorISG2.1.31500 kg100 km/h0 km/h0 km/h50 km/h2.1.42.1.5译文混合动力电动汽车机械和再生制动的整合摘要为了减少对环境的污染和车辆的燃油消耗,混合动力电动汽车已经成为汽车工业的首选方法;混合动力电动汽车通过使用由电动马达和内燃发动机组成的混合动力系统来达到减少环境污染和燃油消耗的目的;混合动力系统消除了怠速,使发动机以一种更有效的方式运行,增加了再生制动的使用;但是,混合动力的成本的增加阻碍了这些车辆的销售;在这里提出一个更具成本效益的电液制动系统的设计;该系统使用电控机械结合的控制方式控制制动助力器产生的推动力,并有足够的时间反应;这个系统使驾驶员清楚地了解机械和再生制动力矩的混合,使再生制动力系统得到有效的控制;一个系统化的设计过程是其次,重点在于展示概念设计方案的可行性和使用虚拟和实物模型的初步设计功用;虚拟和实物模型的结合使用成为验证和开发系统的强大工具,本文将介绍和讨论在设计过程中模型所起到的作用;因为在设计过程中设计者可以获得相关的经验,提倡学生设计实物模型,以提高学生的学习经验;很明显,这正是本文所要提出的;现代混合动力电动汽车随着油价的上涨和环境保护意识的提高,消费者和政府迫使汽车行业开始生产省油和对环境污染小的汽车;一个有前景的方法就是现在实行的混合动力电动汽车;混合动力汽车指的是有两个或两个以上动力来源的车辆;混合动力汽车动力的来源可能有很多的不同,但是现在混合动力汽车最常见的布局是由内燃发动机和电动马达,能量储存系统共同输出动力,这样的车辆就叫混合动力电动汽车;汽车可以同时使用发动机和电动马达输出的动力,从而可以提高汽车的使用性能和效率,进而又可以提高燃油经济性,减少废气的排放,同时还能满足消费者对汽车性能的要求;1997年,丰田成普瑞斯为了第一款混合动力电动汽车,在日本进行了批量生产;本田公司花费了三年的时间进行混合动力电动车的生产,然后进军北美市场;丰田普瑞斯在北美发行几个月后,本田Insight紧随其后也在北美进行发行;混合动力电动车具有再生制动系统的独特优势;在制动过程,通常用于动力输出的电动马达,可以起到发电机的功用,把汽车的动能转化为蓄电池的电能,而不会转化为热能浪费掉;转换的电能可以储存到蓄电池中,然后可以作为电动马达驱动汽车使用的能量;考虑到蓄电池能量密度时,动能转换为电能这个过程就更加重要了;能量密度是指单位体积或质量下能量储存系统所储存的能量;为了说明这一点,我们可以做个对比,4.5公升的汽油通常可以维持一辆汽车行驶50千米;而要把相同的能量储存到蓄电池中,则需要一个质量约为270千克的铅酸蓄电池;这就说明了在汽车行驶过程中能够有效地储存再生制动系统产生的能量的重要性,从而可以保证在提高混合动力电能车性能的前提下,不至使能量储存系统所占体积过大;再生制动系统研究范围本文所提出的再生系统的研究范围是研究再生制动系统和机械制动系统之间相互作用的关系,目的是设计开发出一个低成本的再生制动系统,从而可以应用到未来经济型的混合动力电动汽车上;这个系统可以根据驾驶员的需要进而控制再生制动系统和机械制动系统产生的制动力矩的结合,还应该保证这个过程的平顺性和安全性;再生制动力矩是通过使用的异步电动机的矢量控制算法进行控制的;但是,独立地控制制动踏板产生的机械制动力矩,同时又要保持机械制动系在再生制动系统失效后起到备用作用,这是一个很大的难题;为了解决这个问题,需要研究一个通过减少制动主缸内制动液压来来控制机械制动系统产生的制动力矩的制动系统;混合电动汽车概述混合动力电动车已经成为了可以在短时间内减少汽车污染排放和提高燃油经济型的解决方法之一;在过去的10年几乎所有的主要汽车公司都已经向公众发行销售自己的混合动力电动汽车,混合动力电动汽车的普及和销售在这个世纪有了很明显的增长,随着不可预测的汽油价格的增长和对环境保护的关注,混合动力电动汽车的销售将在最近几年内急剧增长;2.1.1混合动力装置在过去100年来混合动力的研究目标是延长电动汽车的使用寿命,解决蓄电池的长期充电问题;在目前市场,现在主要有三种混合动力装置,这些混合动力装置为串联混合动力,并联混合动力,串并联混合动力;每一种动力装置都有其优点和缺点,这将在以后的章节进行讨论;串联混合动力串联混合动力汽车使用发动机输出的动力来驱动发电机产生电能,这些电能可以储存在蓄电池中,也可以用来驱动电动马达来驱动汽车;在串联混合动力汽车上,发动机和驱动轮之间没有直接的机械连接,串联混合动力往往在高功率系统中使用,如大型货车或火车,也可以应用到低功率的客运车辆上;发动机输出的机械能和蓄电池输出的电能可以通过电子控制器进行控制接合,然后这个电子控制器通过比较驾驶员所需的动力和汽车车速,电动马达输出的转矩,从而决定每个动力源驱动汽车行驶所要输出的能量;在制动过程中,这个电子控制装置可以使电能输出模式转换为再生模式,直接把再生制动系统产生的电能储存在蓄电池内;按照这种布置方式进行设计有很多的优点;发动机可以保持高效率的运行,使发动机产生的电能在蓄电池和驱动马达之间得到分配;发动机在其最高效率的工况下运行,排放可以大大降低,燃烧每体积的燃料可以产生更多的电能;因为串联动力装置结构简单且成本低,这种动力装置很容在汽车上落实;并联混合动力在并联混合动力汽车中,发动机输出的机械功传到变速箱中;发动机输出的机械功和电动马达输出的功在变速箱内进行机械式的接合,混合的机械功用于驱动汽车行驶;在这种混合动力装置结构中,发动机和驱动轮之间有直接的机械连接;在串联混合动力装置中,电子控制器通过比较驾驶员所需的动力和汽车车速,电动马达输出的转矩,从而决定每个动力源驱动汽车行驶所要输出的能量,以满足汽车行驶性能,获得最佳的效率;正如串联混合装置一样,并联混合动力也以相似的方法控制再生制动;并联混合动力装置通常应用到低功率的电动车中,这两种驱动力可以同时使用,提供更高的行驶性能;与串联混合动力系统相比,并联混合动力系统有很多优势;其中最重要的一项优势是效率高,因为在并联混合动力中,电能和机械能只需转换一次,而在串联混合动力中,电能和机械能需要两次转换;由于并联混合动力可以使发动机和电动马大产生的动力同时结合起来,在不损失汽车行驶性能的前提下,可以使用体积小的电动马达,同时也降低了油耗和排放;最后,并联混合动力汽车在行驶过程中只需使发动机运行,而不需要另一个发电机为蓄电池充电;串、并联混合动力串并联混合动力装置结合了串联和并联动力装置的特点;这种混合方式汽车通过使用动力分配装置来控制双动力源电动马达输出动力,发动机输出动力或者两者同时输出驱动汽车行驶;虽然这种装置形式可以获得串联混合动力装置和并联混合动力装置的优点,因为考虑到汽车实际行驶可能性,这种装置的控制算法会变得非常复杂; 2.1.2混合度现在道路上行驶的混合动力电动汽车大多是串联混合动力,并联混合动力,或者串并联混合动力,因此定义一个‘混合度’变量来评价混合动力电动汽车的电能潜能是非常有意义的;混合度变从传统车辆DOH=0到所有电动车DOH=1之间变化,随着混合度的增加,在汽车上可以使用一个比较小的发动机,同时发动机可以在最接近最佳效率的工况下运行很长的时间,这样就可以减少燃油的消耗和废气的排放;电动马达输出的功用P表emP表示;示,发动机输出的功用ice微混合动力微混合指的是最小混合度,通常是由一个连接到发动机曲轴的综合起动发电机组成;在加速和怠速过程中,综合起动发电机使发动机处于关闭状态,从而节约燃油;加速时,在燃油喷入汽缸之前,综合起动发电机使发动机的曲轴加速旋转;在加速过程中,综合起动发电机对发动机起动协助的作用,在制动过程中,综合起动发电机还可以作为发电机向蓄电池充电;和非混合动力汽车相比,微混合动力汽车的燃油经济性可以提高10%左右;轻混合动力轻混合动力和微混合动力结构相似,有一点不同的是其综合起动发电机是经过改进的,其输出的动力可以超过20KW;但是,轻混合动力的能量储存系统只能储存1KWh左右的能量;轻混合动力汽车只有一个很短的纯电动续航能力,但是可以在加速过程中给发动机提供很大的辅助作用;轻混合动力中的电子元件要比微混合动力中的电子元件复杂的多,且在汽车行驶过程中发挥着更大的作用;和非混合动力的汽车相比,轻混合动力汽车的燃油经济性可以提高20%-25%左右;全混合动力在全混合动力汽车上不再使用综合起动发电机,取代它的是一个独立的电动马达和交流发电机、起动机,这些装置也可以起到综合起动发电机的作用;电动马达可以独立驱动汽车行驶,尤其是在城市道路上走走停停的行驶;能量储存系统也得到了改进,这样就提高了汽车纯电动续航能力,减少了发动机的体积,从而提高燃油经济性和减少排放;与非混合动力汽车相比,全混合动力汽车的燃油消耗量可以减少40%-50%;插电式混合动力插电式混合动力汽车在结构上和全混合动力汽车相似,不同的是插电式混合动力汽车有一个比较大的能量储存系统,可以通过与外部电源连接进行充电;在蓄电池储存能量范围内,可以通过电动马达来驱动汽车行驶,但是当蓄电池的能量降到一定水平后,其运行形势就和全混合动力一样了;2.1.3再生制动原理混合动力电动汽车最重要的特点是可以回收大量的制动能量;在制动过程中,电动马达可以作为发电机来运行操作,将制动过程中的动能转换为电能储存到蓄电池中,这些电能就可以被汽车重复使用;但是,车辆的制动性能就将影响到汽车的安全性;在紧急制动状态下,汽车的制动距离要尽可能的短,还要保证制动时汽车有较好的方向稳定性;汽车具有较好的方向稳定性,就需要控制车轮的制动力分配;一般来说,制动时所需的制动力矩比电动马达产生的制动力矩大得多;因此,机械制动系统需要和电子再生制动系统同时存在,这就需要适当的设计以保证制动时的操作稳定性,不至于影响到汽车的安全性;制动时能量消耗由公式可得,一个质量为1500Kg的汽车以100km/h初速度制动到完全停止,需要消耗的动能;如果这些能量的25%可以通过再生制动系统进行回收,当忽略制动和加速过程中的空气阻力,机械摩擦和滚动阻力,假设电动马达的工作效率100%,利用公式可以估算出,这些能量可以使汽车从0km/h加速到50km/h.这就表明,当汽车行驶在城市道路上,汽车不停加速和制动,混合动力电动车的燃油经济性可以大大增加;需要注意的是,制动能量的回收量受到马达的型号和能量转换率的限制;2.1.4再生制动系统目前,通常使用的有两种再生制动方法;这些方法通常称为串联再生制动和并联制动,每种制动策略都有其优点和缺点,本文对此将进行具体讨论;并联再生制动在并联再生制动系统中,电动马达和机械制动系统同时工作,从而使汽车减速;因为机械制动系统不能独立的控制制动力,使制动时的能量转换为热能而不是电能,因此这不是最有效地再生制动方法;但是并联再生制动结构简单成本低,这就成为其一大优势;并联再生制动的机械制动系统只需要稍加修改,而且电动马达的控制算法也可以很容易在汽车上实现;这种制动方法还有一个额外的优势,当再生制动系统发生故障时,机械制动系统可以起到备用的作用;串联再生制动在串联再生制动中,电动马达只有在制动时才起作用;只有当电动马达和能量储存系统无法接受更多制动时所需的能量时,再生制动系统才起作用;串联再生制动需要独立的控制制动力矩,串联再生制动可以高效率的把动能转换为电能,这是其一项优势;但是它的不足之处在于,制动系统结构复杂,成本高;这种制动方式需要制动踏板模拟器,制动系统也需要重新设计,这都会增加其制造成本;因为制动系统需要装有传感器和信息处理器,这就会增加了结构的复杂度;2.1.5目前的再生制动系统目前大多数混合动力电动汽车的再生制动系统都是比较昂贵的电液制动系统;再生制动系统使用制动踏板模拟器来建立驾驶者的制动需求,这个制动踏板模拟器与液压制动电路独立分开;这样再将制动需求按照一定比例转换为再生制动和机械制动需求,然后将机械制动需求发送到由高压液压泵,蓄能器和比例控制阀的系统;比例控制阀根据制动需求,控制制动液以一定的预定值流到每个车轮的制动轮缸中;。
外文参考文献译文及原文【范本模板】

广东工业大学华立学院本科毕业设计(论文)外文参考文献译文及原文系部城建学部专业土木工程年级 2011级班级名称 11土木工程9班学号 23031109000学生姓名刘林指导教师卢集富2015 年5 月目录一、项目成本管理与控制 0二、Project Budget Monitor and Control (1)三、施工阶段承包商在控制施工成本方面所扮演的作用 (2)四、The Contractor’s Role in Building Cost Reduction After Design (4)一、外文文献译文(1)项目成本管理与控制随着市场竞争的激烈性越来越大,在每一个项目中,进行成本控制越发重要。
本文论述了在施工阶段,项目经理如何成功地控制项目预算成本。
本文讨论了很多方法。
它表明,要取得成功,项目经理必须关注这些成功的方法.1。
简介调查显示,大多数项目会碰到超出预算的问……功控制预算成本.2.项目控制和监测的概念和目的Erel and Raz (2000)指出项目控制周期包括测量成……原因以及决定纠偏措施并采取行动。
监控的目的就是纠偏措施的。
.。
标范围内。
3.建立一个有效的控制体系为了实现预算成本的目标,项目管理者需要建立一……被监测和控制是非常有帮助的。
项目成功与良好的沟通密。
决( Diallo and Thuillier, 2005).4.成本费用的检测和控制4.1对检测的优先顺序进行排序在施工阶段,很多施工活动是基于原来的计……用完了。
第四,项目管理者应该检测高风险活动,高风险活动最有。
..重要(Cotterell and Hughes, 1995)。
4.2成本控制的方法一个项目的主要费用包括员工成本、材料成本以及工期延误的成本。
为了控制这些成本费用,项目管理者首先应该建立一个成本控制系统:a)为财务数据的管理和分析工作落实责任人员b)确保按照项目的结构来合理分配所有的……它的变化-—在成本控制线上准确地记录所有恰..。
毕业设计(论文)外文资料及译文(模板)

大连东软信息学院
毕业设计(论文)外文资料及译文
系所:
专业:
班级:
姓名:
学号:
大连东软信息学院
Dalian Neusoft University of Information
外文资料和译文格式要求
一、装订要求
1、外文资料原文(复印或打印)在前、译文在后、最后为指导教师评定成绩。
2、译文必须采用计算机输入、打印。
3、A4幅面打印,于左侧装订。
二、撰写要求
1、外文文献内容与所选课题相关。
2、本科学生译文汉字字数不少于4000字,高职学生译文汉字字数不少于2000字。
三、格式要求
1、译文字号:中文小四号宋体,英文小四号“Times New Roman”字型,全文统一,首行缩进2个中文字符,1.5倍行距。
2、译文页码:页码用阿拉伯数字连续编页,字体采用“Times New Roman”字体,字号小五,页底居中。
3、译文页眉:眉体使用单线,页眉说明五号宋体,居中“大连东软信息学院本科毕业设计(论文)译文”。
外文参考文献译文及原文
目录1介绍 (1)在这一章对NS2的引入提供。
尤其是,关于NS2的安装信息是在第2章。
第3章介绍了NS2的目录和公约。
第4章介绍了在NS2仿真的主要步骤。
一个简单的仿真例子在第5章。
最后,在第.8章作总结。
2安装 (1)该组件的想法是明智的做法,以获取上述件和安装他们的个人。
此选项保存downloadingtime和大量内存空间。
但是,它可能是麻烦的初学者,因此只对有经验的用户推荐。
(2)安装一套ns2的all-in-one在unix-based系统 (2)安装一套ns2的all-in-one在Windows系统 (3)3目录和公约 (4)目录 (4)4运行ns2模拟 (6)ns2程序调用 (6)ns2模拟的主要步骤 (6)5一个仿真例子 (8)6总结 (12)1 Introduction (13)2 Installation (15)Installing an All-In-One NS2 Suite on Unix-Based Systems (15)Installing an All-In-One NS2 Suite on Windows-Based Systems (16)3 Directories and Convention (17)Directories and Convention (17)Convention (17)4 Running NS2 Simulation (20)NS2 Program Invocation (20)Main NS2 Simulation Steps (20)5 A Simulation Example (22)6 Summary (27)1介绍网络模拟器(一般叫作NS2)的版本,是证明了有用在学习通讯网络的动态本质的一个事件驱动的模仿工具。
模仿架线并且无线网络作用和协议(即寻址算法,TCP,UDP)使用NS2,可以完成。
一般来说,NS2提供用户以指定这样网络协议和模仿他们对应的行为方式。
外文文献翻译要求及封面

根据《普通高等学校本科毕业设计(论文)指导》地内容,特对外文文献翻译提出以下要求:
一、翻译地外文文献一般为~篇,外文字符要求不少于万(或翻译成中文后至少在字以上).
二、翻译地外文文献应主要选自学术期刊、学术会议地文章、有关著作及其他相关材料,应与毕业论文(设计)主题相关,并作为外文参考文献列入毕业论文(设计)地参考文献.并在每篇中文译文首页用“脚注”形式注明原文作者及出处,中文译文后应附外文原文.个人收集整理勿做商业用途
三、中文译文地基本撰写格式为题目采用小三号黑体字居中打印,正文采用宋体小四号字,行间距一般为固定值磅,标准字符间距.页边距为左,右,上下各,页面统一采用纸.个人收集整理勿做商业用途
四、封面格式由学校统一制作(注:封面上地“翻译题目”指中文译文地题目,附件为一篇外文翻译地封面格式,附件二为两篇外文翻译地封面格式),若有两篇外文文献,请按“封面、译文一、外文原文一、译文二、外文原文二”地顺序统一装订.个人收集整理勿做商业用途
信息工程学院教科办
年月日
杭州电子科技大学信息工程学院
毕业设计(论文)外文文献翻译
毕业设计(论文)题
目
翻译题目
系
专业
姓名
班级
学号
指导教师
杭州电子科技大学信息工程学院毕业设计(论文)外文文献翻译
毕业设计(论文)题
目
翻译()题目
翻译()题目
系
专业
姓名
班级
学号
指导教师。
外文文献翻译——参考格式

广东工业大学华立学院本科毕业设计(论文)外文参考文献译文及原文系部经济学部专业经济学年级 2007级班级名称 07经济学6班学号 16020706001学生姓名张瑜琴指导教师陈锶2011 年05月目录1挑战:小额贷款中的进入和商业银行的长期承诺 (1)2什么商业银行带给小额贷款和什么把他们留在外 (2)3 商业银行的四个模型进入小额贷款之内 (4)3.1内在的单位 (4)3.2财务子公司 (5)3.3策略的同盟 (5)3.4服务公司模型 (6)4 合法的形式和操作的结构比较 (8)5 服务的个案研究公司模型:厄瓜多尔和Haiti5 (9)1 挑战:小额贷款中的进入和商业银行的长期承诺商业银行已经是逐渐重要的运动员在拉丁美洲中的小额贷款服务的发展2到小额贷款市场是小额贷款的好消息客户因为银行能提供他们一完整类型的财务的服务,包括信用,储蓄和以费用为基础的服务。
整体而言,它也对小额贷款重要,因为与他们广泛的身体、财务的和人类。
如果商业银行变成重的运动员在小额贷款,他们能提供非常强烈的竞争到传统的小额贷款机构。
资源,银行能廉宜地发射而且扩张小额贷款服务rela tively。
如果商业广告银行在小额贷款中成为严重的运动员,他们能提出非常强烈的竞争给传统的小额贷款机构。
然而,小额贷款社区里面有知觉哪一商业银行进入进入小额贷款将会是短命或浅的。
举例来说,有知觉哪一商业银行首先可能不搬进小额贷款因为时候建立小额贷款操作到一个有利润的水平超过银行的标准投资时间地平线。
或,在进入小额贷款,银行之后可能移动在-上面藉由增加贷款数量销售取利润最大值-或者更坏的事,退出如果他们是不满意与小额贷款的收益性的水平。
这些知觉已经被特性加燃料商业银行的情形进入小额贷款和后来的出口之内。
在最极端的,一些开业者已经甚至宣布,”降低尺度死!”而且抛弃了与主意合作的商业银行。
在最 signific 看得到的地方,蚂蚁利益商业银行可能带给小额贷款,国际的ACCION 发展发射而且扩张的和一些商业银行的关系小额贷款操作。
外文文献原稿和译文

(空一行)原□□稿(空一行) IntroductionThe "jumping off" point for this paper is Reengineering the Corporation, by Michael Hammer and James Champy . The paper goes on to review the literature on BPR. It explores the principles and assumptions behind reengineering, looks for commonfactors behind its successes or failures, examines case studies, and presents alternatives to "classical" reengineering theory . The paper pays particular attention to the role of information technology in BPR. In conclusion, the paper offers somespecific recommendations regarding reengineering. Old Wine in New BottlesThe concept of reengineering traces its origins back to management theories developedas early as the nineteenth century . The purpose of reengineering is to "make all your processes the best-in-class." Frederick Taylor suggested in the 1880's that managers use process reengineering methods to discover the best processes for performing work, and that these processes be reengineered to optimize productivity. BPR echoes the classical belief that there is one best way to conduct tasks. In Taylor's time, technology did not allow large companies to design processes in across-functional or cross-departmental manner. Specialization was the state-of-theart method to improve efficiency given the technology of the time.(下略)正文内容:新罗马“TimesNewRoman ”字体,小四号字。
外文参考文献译文及原文

广东工业大学华立学院本科毕业设计(论文)外文参考文献译文及原文系部城建学部专业土木工程年级 2011级班级名称 11土木工程9班学号 23031109000学生姓名刘林指导教师卢集富2015 年5 月目录一、项目成本管理与控制 0二、Project Budget Monitor and Control (1)三、施工阶段承包商在控制施工成本方面所扮演的作用 (2)四、The Contractor's Role in Building Cost Reduction After Design (4)一、外文文献译文(1)项目成本管理与控制随着市场竞争的激烈性越来越大,在每一个项目中,进行成本控制越发重要。
本文论述了在施工阶段,项目经理如何成功地控制项目预算成本。
本文讨论了很多方法。
它表明,要取得成功,项目经理必须关注这些成功的方法。
1.简介调查显示,大多数项目会碰到超出预算的问……功控制预算成本。
2.项目控制和监测的概念和目的Erel and Raz (2000)指出项目控制周期包括测量成……原因以及决定纠偏措施并采取行动。
监控的目的就是纠偏措施的...标范围内。
3.建立一个有效的控制体系为了实现预算成本的目标,项目管理者需要建立一……被监测和控制是非常有帮助的。
项目成功与良好的沟通密...决( Diallo and Thuillier, 2005)。
4.成本费用的检测和控制4.1对检测的优先顺序进行排序在施工阶段,很多施工活动是基于原来的计……用完了。
第四,项目管理者应该检测高风险活动,高风险活动最有...重要(Cotterell and Hughes, 1995)。
4.2成本控制的方法一个项目的主要费用包括员工成本、材料成本以及工期延误的成本。
为了控制这些成本费用,项目管理者首先应该建立一个成本控制系统:a)为财务数据的管理和分析工作落实责任人员b)确保按照项目的结构来合理分配所有的……它的变化--在成本控制线上准确地记录所有恰...围、变更、进度、质量)相结合由于一个工程项目......虑时间价值影响后的结果。
外文翻译与文献综述模板格式以及要求说明

杭州电子科技大学信息工程学院毕业论文外文文献翻译要求根据《普通高等学校本科毕业设计(论文)指导》的内容,特对外文文献翻译提出以下要求:一、翻译的外文文献可以是一篇,也可以是两篇,但总字符要求不少于1.5万(或翻译成中文后至少在3000字以上)。
二、翻译的外文文献应主要选自学术期刊、学术会议的文章、有关著作及其他相关材料,应与毕业论文(设计)主题相关,并作为外文参考文献列入毕业论文(设计)的参考文献。
并在每篇中文译文首页用“脚注”形式注明原文作者及出处,中文译文后应附外文原文。
三、中文译文的基本撰写格式为:1.题目:采用小三号、黑体字、居中打印;2.正文:采用小四号、宋体字,行间距一般为固定值20磅,标准字符间距。
页边距为左3cm,右2.5cm,上下各2.5cm,页面统一采用A4纸。
四、封面格式由学校统一制作(注:封面上的“翻译题目”指中文译文的题目),并按“封面、译文一、外文原文一、译文二、外文原文二、考核表”的顺序统一装订。
五、忌自行更改表格样式。
毕业论文外文文献翻译毕业设计(论文)题目Xxx翻译(1)题目指翻译后的中文译文的题目翻译(2)题目指翻译后的中文译文的题目系会计系以本模板为准)专业XXXXXX(以本模板为准)姓名XXXXXX(以本模板为准)班级XXXXXX(以本模板为准)学号XXXXXX(以本模板为准)指导教师XXXXXX(以本模板为准)正文指导教师对外文翻译的评语:指导教师(签名)年月日建议成绩(百分制)评阅小组或评阅人对外文翻译的评语:评阅小组负责人或评阅人(签名)年月日建议成绩(百分制)杭州电子科技大学信息工程学院本科毕业论文文献综述的写作要求为了促使学生熟悉更多的专业文献资料,进一步强化学生搜集文献资料的能力,提高对文献资料的归纳、分析、综合运用能力及独立开展科研活动的能力,现对本科学生的毕业设计(论文)提出文献综述的写作要求,具体要求如下:一、文献综述的概念文献综述是针对某一研究领域或专题搜集大量文献资料的基础上,就国内外在该领域或专题的主要研究成果、最新进展、研究动态、前沿问题等进行综合分析而写成的、能比较全面地反映相关领域或专题历史背景、前人工作、争论焦点、研究现状和发展前景等内容的综述性文章。
厦门理工学院-外文文献翻译封面格式样本

宋体三号居中15倍行距即所翻译文献英文名称三号宋体字15倍行距若标题较长写分两行写较短则将后一空行删除
毕业设计(论文)外文文献翻译
宋体三号,加粗,1.5 倍行距 宋体三号,居中,1.5 倍行距
院
系:
年级专业: 姓 学 附 名: 号: 件:
即所翻译文献英文名称,三 号宋体字, 1.5 倍行距, 若标 题较长,写分两行写,较短, 则将后一空行删除。
宋体五号字,单倍行距
ቤተ መጻሕፍቲ ባይዱ
指导老师评语:
指导教师签名: 年 月 日
备注: 1.从所引用的与毕业设计(论文)内容相近的外文文献中选择一篇 或一部分进行翻译(不少于 3000 实词) ; 2.外文文献翻译的装订分两部分,第一部分为外文文献的中文翻 译,第二部分为外文文献原文(原文打印、复印均可) ; 3.外文文献正文按毕业设计(论文)格式排版,两部分内容不能联 排,用分页符分页,英文部分页码从“1”开始计数,不续前节。
外文文献翻译译文

环境管理会计(EMA)是管理会计发展的趋势Christine Jasch摘要:组织机构和会计师们为什么应该关心环境问题?来自供应链、资金提供商、监管机构以及其他利益相关者对于环境绩效及其信息披露的压力,导致组织机构的与环境相关的成本不断增加。
但同时提高环境绩效能够带来潜在的货币利益这一观点也逐渐得到人们的认同,传统的会计实务不能充分提供对于环境管理和与之相关的战略决策所需要的信息。
由于联合国可持续发展事务署下的环境管理会计工作组的成立,以及由它主办的出版物的发行,环境管理会计得到了促进和提升。
最近,国际会计师联合会发行了一份关于环境管理会计的指导性文件,这将进一步推动环境管理会计在会计师中的应用。
这期《清洁生产》杂志的关于环境管理会计的这个特别问题,侧重于它的方法论背景,以及来自澳大利亚、奥地利、阿根廷、加拿大、日本和立陶宛的案例研究经验。
正文:环境问题伴随者相关费用,收入和利益,正被世界上大多数国家的公民,政府组织,合作型领导人给予越来越多的关注.但是,有一个越来越广泛的共识,那就是,传统的会计不能为合理的支持在环境管理责任方面的决策制定提供准确的信息.为了填补这个差距,目前,EMA的新兴领域已经受到持续增加的关注.在19世纪九十年代早期,美国环保署是第一个成立了正式的项目去促进EMA的采纳的国家机构.从那时起,在30个国家的组织已经开始推动和落实EMA的许多不同类型的与环保相关的管理措施. 对于EMA的广泛关注是由于联合国可持续发展事务司对EMA的提倡以及其对EMA书籍的委托出版。
国际会计师联合会决定授权在由联合国科学发展司EMA工作组发表的最早的关于EMA 两本出版物的基础上发展一个关于EMA的指导性文件以整合关于EMA的最好的信息并与此同时进行必要的更新和添加.这个文件既不是有规定的要求的标准,也不是个描述性研究报告.它意在成为一个提供指导性信息的文件,作为监管要求,标准和纯粹信息的中间地带.这样, 它的目标是提供了一个总体框架和EMA的定义是相当全面,这是一致的可能与其他现有的,广泛应用于环境会计框架与EMA必须通力合作,以减少一些就这一重要议题的国际混乱功能。
建筑学毕业设计的外文文献及译文

建筑学毕业设计的外文文献及译文文献、资料题目:《Advanced Encryption Standard》文献、资料发表(出版)日期:2004.10.25系(部):建筑工程系生:陆总LYY外文文献:Modern ArchitectureModern architecture, not to be confused with Contemporary architecture1, is a term given to a number of building styles with similar characteristics, primarily the simplification of form and the elimination of ornament. While the style was conceived early in the 20th century and heavily promoted by a few architects, architectural educators and exhibits, very few Modern buildings were built in the first half of the century. For three decades after the Second World War, however, it became the dominant architectural style for institutional and corporate building.1. OriginsSome historians see the evolution of Modern architecture as a social matter, closely tied to the project of Modernity and hence to the Enlightenment, a result of social and political revolutions.Others see Modern architecture as primarily driven by technological and engineering developments, and it is true that the availability of new building materials such as iron, steel, concrete and glass drove the invention of new building techniques as part of the Industrial Revolution. In 1796, Shrewsbury mill owner Charles Bage first used his "fireproof design, which relied on cast iron and brick with flag stone floors. Such construction greatly strengthened the structure of mills, which enabled them to accommodate much bigger machines. Due to poor knowledge of iron's properties as a construction material, a number of early mills collapsed. It was not until the early 1830s that Eaton Hodgkinson introduced the section beam, leading to widespread use of iron construction, this kind of austere industrial architecture utterly transformed the landscape of northern Britain, leading to the description, πDark satanic millsπof places like Manchester and parts of West Yorkshire. The Crystal Palace by Joseph Paxton at the Great Exhibition of 1851 was an early example of iron and glass construction; possibly the best example is the development of the tall steel skyscraper in Chicago around 1890 by William Le Baron Jenney and Louis Sullivan∙ Early structures to employ concrete as the chief means of architectural expression (rather than for purely utilitarian structure) include Frank Lloyd Wright,s Unity Temple, built in 1906 near Chicago, and Rudolf Steiner,s Second Goetheanum, built from1926 near Basel, Switzerland.Other historians regard Modernism as a matter of taste, a reaction against eclecticism and the lavish stylistic excesses of Victorian Era and Edwardian Art Nouveau.Whatever the cause, around 1900 a number of architects around the world began developing new architectural solutions to integrate traditional precedents (Gothic, for instance) with new technological possibilities- The work of Louis Sullivan and Frank Lloyd Wright in Chicago, Victor Horta in Brussels, Antoni Gaudi in Barcelona, Otto Wagner in Vienna and Charles Rennie Mackintosh in Glasgow, among many others, can be seen as a common struggle between old and new.2. Modernism as Dominant StyleBy the 1920s the most important figures in Modern architecture had established their reputations. The big three are commonly recognized as Le Corbusier in France, and Ludwig Mies van der Rohe and Walter Gropius in Germany. Mies van der Rohe and Gropius were both directors of the Bauhaus, one of a number of European schools and associations concerned with reconciling craft tradition and industrial technology.Frank Lloyd Wright r s career parallels and influences the work of the European modernists, particularly via the Wasmuth Portfolio, but he refused to be categorized with them. Wright was a major influence on both Gropius and van der Rohe, however, as well as on the whole of organic architecture.In 1932 came the important MOMA exhibition, the International Exhibition of Modem Architecture, curated by Philip Johnson. Johnson and collaborator Henry-Russell Hitchcock drew together many distinct threads and trends, identified them as stylistically similar and having a common purpose, and consolidated them into the International Style.This was an important turning point. With World War II the important figures of the Bauhaus fled to the United States, to Chicago, to the Harvard Graduate School of Design, and to Black Mountain College. While Modern architectural design never became a dominant style in single-dwelling residential buildings, in institutional and commercial architecture Modernism became the pre-eminent, and in the schools (for leaders of the profession) the only acceptable, design solution from about 1932 to about 1984.Architects who worked in the international style wanted to break with architectural tradition and design simple, unornamented buildings. The most commonly used materials are glass for the facade, steel for exterior support, and concrete for the floors and interior supports; floor plans were functional and logical. The style became most evident in the design of skyscrapers. Perhaps its most famous manifestations include the United Nations headquarters (Le Corbusier, Oscar Niemeyer, Sir Howard Robertson), the Seagram Building (Ludwig Mies van der Rohe), and Lever House (Skidmore, Owings, and Merrill), all in New York. A prominent residential example is the Lovell House (Richard Neutra) in Los Angeles.Detractors of the international style claim that its stark, uncompromisingly rectangular geometry is dehumanising. Le Corbusier once described buildings as πmachines for living,∖but people are not machines and it was suggested that they do not want to live in machines- Even Philip Johnson admitted he was πbored with the box∕,Since the early 1980s many architects have deliberately sought to move away from rectilinear designs, towards more eclectic styles. During the middle of the century, some architects began experimenting in organic forms that they felt were more human and accessible. Mid-century modernism, or organic modernism, was very popular, due to its democratic and playful nature. Alvar Aalto and Eero Saarinen were two of the most prolific architects and designers in this movement, which has influenced contemporary modernism.Although there is debate as to when and why the decline of the modern movement occurred, criticism of Modern architecture began in the 1960s on the grounds that it was universal, sterile, elitist and lacked meaning. Its approach had become ossified in a πstyleπthat threatened to degenerate into a set of mannerisms. Siegfried Giedion in the 1961 introduction to his evolving text, Space, Time and Architecture (first written in 1941), could begin ,,At the moment a certain confusion exists in contemporary architecture, as in painting; a kind of pause, even a kind of exhaustion/1At the Metropolitan Museum of Art, a 1961 symposium discussed the question πModern Architecture: Death or Metamorphosis?11In New York, the coup d r etat appeared to materialize in controversy around the Pan Am Building that loomed over Grand Central Station, taking advantage of the modernist real estate concept of πair rights,∖[l] In criticism by Ada Louise Huxtable and Douglas Haskell it was seen to ,,severπthe Park Avenue streetscape and πtarnishπthe reputations of its consortium of architects: Walter Gropius, Pietro Belluschi and thebuilders Emery Roth & Sons. The rise of postmodernism was attributed to disenchantment with Modern architecture. By the 1980s, postmodern architecture appeared triumphant over modernism, including the temple of the Light of the World, a futuristic design for its time Guadalajara Jalisco La Luz del Mundo Sede International; however, postmodern aesthetics lacked traction and by the mid-1990s, a neo-modern (or hypermodern) architecture had once again established international pre-eminence. As part of this revival, much of the criticism of the modernists has been revisited, refuted, and re-evaluated; and a modernistic idiom once again dominates in institutional and commercial contemporary practice, but must now compete with the revival of traditional architectural design in commercial and institutional architecture; residential design continues to be dominated by a traditional aesthetic.中文译文:现代建筑现代建筑,不被混淆与‘当代建筑’,是一个词给了一些建筑风格有类似的特点,主要的简化形式,消除装饰等.虽然风格的设想早在20世纪,并大量造就了一些建筑师、建筑教育家和展品,很少有现代的建筑物,建于20世纪上半叶.第二次大战后的三十年,但最终却成为主导建筑风格的机构和公司建设.1起源一些历史学家认为进化的现代建筑作为一个社会问题,息息相关的工程中的现代性, 从而影响了启蒙运动,导致社会和政治革命.另一些人认为现代建筑主要是靠技术和工程学的发展,那就是获得新的建筑材料,如钢铁,混凝土和玻璃驱车发明新的建筑技术,它作为工业革命的一部分.1796年,Shrewsbury查尔斯bage首先用他的‘火’的设计,后者则依靠铸铁及砖与石材地板.这些建设大大加强了结构,使它们能够容纳更大的机器.由于作为建筑材料特性知识缺乏,一些早期建筑失败.直到1830年初,伊顿Hodgkinson预计推出了型钢梁,导致广泛使用钢架建设,工业结构完全改变了这种窘迫的面貌,英国北部领导的描述,〃黑暗魔鬼作坊〃的地方如曼彻斯特和西约克郡.水晶宫由约瑟夫paxton的重大展览,1851年,是一个早期的例子, 钢铁及玻璃施工;可能是一个最好的例子,就是1890年由William乐男爵延长和路易沙利文在芝加哥附近发展的高层钢结构摩天楼.早期结构采用混凝土作为行政手段的建筑表达(而非纯粹功利结构),包括建于1906年在芝加哥附近,劳埃德赖特的统一宫,建于1926 年瑞士巴塞尔附近的鲁道夫斯坦纳的第二哥特堂,.但无论原因为何,约有1900多位建筑师,在世界各地开始制定新的建筑方法,将传统的先例(比如哥特式)与新的技术相结合的可能性.路易沙利文和赖特在芝加哥工作,维克多奥尔塔在布鲁塞尔,安东尼高迪在巴塞罗那,奥托瓦格纳和查尔斯景mackintosh格拉斯哥在维也纳,其中之一可以看作是一个新与旧的共同斗争.2现代主义风格由1920年代的最重要人物,在现代建筑里确立了自己的名声.三个是公认的柯布西耶在法国,密斯范德尔德罗和瓦尔特格罗皮乌斯在德国.密斯范德尔德罗和格罗皮乌斯为董事的包豪斯,其中欧洲有不少学校和有关团体学习调和工艺和传统工业技术.赖特的建筑生涯中,也影响了欧洲建筑的现代艺术,特别是通过瓦斯穆特组合但他拒绝被归类与他们.赖特与格罗皮乌斯和Van der德罗对整个有机体系有重大的影响.在1932年来到的重要moma展览,是现代建筑艺术的国际展览,艺术家菲利普约翰逊. 约翰逊和合作者亨利-罗素阁纠集许多鲜明的线索和趋势,内容相似,有一个共同的目的, 巩固了他们融入国际化风格这是一个重要的转折点.在二战的时间包豪斯的代表人物逃到美国,芝加哥,到哈佛大学设计黑山书院.当现代建筑设计从未成为主导风格单一的住宅楼,在成为现代卓越的体制和商业建筑,是学校(专业领导)的唯一可接受的,设计解决方案,从约1932年至约1984 年.那些从事国际风格的建筑师想要打破传统建筑和简单的没有装饰的建筑物。
在线图书管理系统外文文献原文及译文

毕业设计说明书英文文献及中文翻译班姓 名:学 院:专指导教师:2014 年 6 月软件学院 软件工程An Introduction to JavaThe first release of Java in 1996 generated an incredible amount of excitement, not just in the computer press, but in mainstream media such as The New York Times, The Washington Post, and Business Week. Java has the distinction of being the first and only programming language that had a ten-minute story on National Public Radio. A $100,000,000 venture capital fund was set up solely for products produced by use of a specific computer language. It is rather amusing to revisit those heady times, and we give you a brief history of Java in this chapter.In the first edition of this book, we had this to write about Java: “As a computer language, Java’s hype is overdone: Java is certainly a good program-ming language. There is no doubt that it is one of the better languages available to serious programmers. We think it could potentially have been a great programming language, but it is probably too late for that. Once a language is out in the field, the ugly reality of compatibility with existing code sets in.”Our editor got a lot of flack for this paragraph from someone very high up at Sun Micro- systems who shall remain unnamed. But, in hindsight, our prognosis seems accurate. Java has a lot of nice language features—we examine them in detail later in this chapter. It has its share of warts, and newer additions to the language are not as elegant as the original ones because of the ugly reality of compatibility.But, as we already said in the first edition, Java was never just a language. There are lots of programming languages out there, and few of them make much of a splash. Java is a whole platform, with a huge library, containing lots of reusable code, and an execution environment that provides services such as security, portability across operating sys-tems, and automatic garbage collection.As a programmer, you will want a language with a pleasant syntax and comprehensible semantics (i.e., not C++). Java fits the bill, as do dozens of other fine languages. Some languages give you portability, garbage collection, and the like, but they don’t have much of a library, forcing you to roll your own if you want fancy graphics or network- ing or database access. Well, Java has everything—a good language, a high-quality exe- cution environment, and a vast library. That combination is what makes Java an irresistible proposition to so many programmers.SimpleWe wanted to build a system that could be programmed easily without a lot of eso- teric training and which leveraged t oday’s standard practice. So even though wefound that C++ was unsuitable, we designed Java as closely to C++ as possible in order to make the system more comprehensible. Java omits many rarely used, poorly understood, confusing features of C++ that, in our experience, bring more grief than benefit.The syntax for Java is, indeed, a cleaned-up version of the syntax for C++. There is no need for header files, pointer arithmetic (or even a pointer syntax), structures, unions, operator overloading, virtual base classes, and so on. (See the C++ notes interspersed throughout the text for more on the differences between Java and C++.) The designers did not, however, attempt to fix all of the clumsy features of C++. For example, the syn- tax of the switch statement is unchanged in Java. If you know C++, you will find the tran- sition to the Java syntax easy. If you are used to a visual programming environment (such as Visual Basic), you will not find Java simple. There is much strange syntax (though it does not take long to get the hang of it). More important, you must do a lot more programming in Java. The beauty of Visual Basic is that its visual design environment almost automatically pro- vides a lot of the infrastructure for an application. The equivalent functionality must be programmed manually, usually with a fair bit of code, in Java. There are, however, third-party development environments that provide “drag-and-drop”-style program development.Another aspect of being simple is being small. One of the goals of Java is to enable the construction of software that can run stand-alone in small machines. The size of the basic interpreter and class support is about 40K bytes; adding the basic stan- dard libraries and thread support (essentially a self-contained microkernel) adds an additional 175K.This was a great achievement at the time. Of course, the library has since grown to huge proportions. There is now a separate Java Micro Edition with a smaller library, suitable for embedded devices.Object OrientedSimply stated, object-oriented design is a technique for programming that focuses on the data (= objects) and on the interfaces to that object. To make an analogy with carpentry, an “object-oriented” carpenter would be mostly concerned with the chair he was building, and secondari ly with the tools used to make it; a “non-object- oriented” carpenter would think primarily of his tools. The object-oriented facilities of Java are essentially those of C++.Object orientation has proven its worth in the last 30 years, and it is inconceivable that a modern programming language would not use it. Indeed, the object-oriented features of Java are comparable to those of C++. The major difference between Java and C++ lies in multiple inheritance, which Java has replaced with the simpler concept of interfaces, and in the Java metaclass model (which we discuss in Chapter 5). NOTE: If you have no experience with object-oriented programming languages, you will want to carefully read Chapters 4 through 6. These chapters explain what object-oriented programming is and why it is more useful for programming sophisticated projects than are traditional, procedure-oriented languages like C or Basic.Network-SavvyJava has an extensive library of routines for coping with TCP/IP protocols like HTTP and FTP. Java applications can open and access objects across the Net via URLs with the same ease as when accessing a local file system.We have found the networking capabilities of Java to be both strong and easy to use. Anyone who has tried to do Internet programming using another language will revel in how simple Java makes onerous tasks like opening a socket connection. (We cover net- working in V olume II of this book.) The remote method invocation mechanism enables communication between distributed objects (also covered in V olume II).RobustJava is intended for writing programs that must be reliable in a variety of ways.Java puts a lot of emphasis on early checking for possible problems, later dynamic (runtime) checking, and eliminating situations that are error-prone. The single biggest difference between Java and C/C++ is that Java has a pointer model that eliminates the possibility of overwriting memory and corrupting data.This feature is also very useful. The Java compiler detects many problems that, in other languages, would show up only at runtime. As for the second point, anyone who has spent hours chasing memory corruption caused by a pointer bug will be very happy with this feature of Java.If you are coming from a language like Visual Basic that doesn’t explicitly use pointers, you are probably wondering why this is so important. C programmers are not so lucky. They need pointers to access strings, arrays, objects, and even files. In Visual Basic, you do not use pointers for any of these entities, nor do you need to worry about memory allocation for them. On the other hand, many data structures are difficult to implementin a pointerless language. Java gives you the best of both worlds. You do not need point- ers for everyday constructs like strings and arrays. You have the power of pointers if you need it, for example, for linked lists. And you always have complete safety, because you can never access a bad pointer, make memory allocation errors, or have to protect against memory leaking away.Architecture NeutralThe compiler generates an architecture-neutral object file format—the compiled code is executable on many processors, given the presence of the Java runtime sys- tem. The Java compiler does this by generating bytecode instructions which have nothing to do with a particular computer architecture. Rather, they are designed to be both easy to interpret on any machine and easily translated into native machine code on the fly.This is not a new idea. More than 30 years ago, both Niklaus Wirth’s original implemen- tation of Pascal and the UCSD Pascal system used the same technique.Of course, interpreting bytecodes is necessarily slower than running machine instruc- tions at full speed, so it isn’t clear that this is even a good idea. However, virtual machines have the option of translating the most frequently executed bytecode sequences into machine code, a process called just-in-time compilation. This strategy has proven so effective that even Microsoft’s .NET platform relies on a virt ual machine.The virtual machine has other advantages. It increases security because the virtual machine can check the behavior of instruction sequences. Some programs even produce bytecodes on the fly, dynamically enhancing the capabilities of a running program.PortableUnlike C and C++, there are no “implementation-dependent” aspects of the specifi- cation. The sizes of the primitive data types are specified, as is the behavior of arith- metic on them.For example, an int in Java is always a 32-bit integer. In C/C++, int can mean a 16-bit integer, a 32-bit integer, or any other size that the compiler vendor likes. The only restriction is that the int type must have at least as many bytes as a short int and cannot have more bytes than a long int. Having a fixed size for number types eliminates a major porting headache. Binary data is stored and transmitted in a fixed format, eliminating confusion about byte ordering. Strings are saved in a standard Unicode format. The libraries that are a part of the system define portable interfaces. For example,there is an abstract Window class and implementations of it for UNIX, Windows, and the Macintosh.As anyone who has ever tried knows, it is an effort of heroic proportions to write a pro- gram that looks good on Windows, the Macintosh, and ten flavors of UNIX. Java 1.0 made the heroic effort, delivering a simple toolkit that mapped common user interface elements to a number of platforms. Unfortunately, the result was a library that, with a lot of work, could give barely acceptable results on different systems. (And there were often different bugs on the different platform graphics implementations.) But it was a start. There are many applications in which portability is more important than user interface slickness, and these applications did benefit from early versions of Java. By now, the user interface toolkit has been completely rewritten so that it no longer relies on the host user interface. The result is far more consistent and, we think, more attrac- tive than in earlier versions of Java.InterpretedThe Java interpreter can execute Java bytecodes directly on any machine to which the interpreter has been ported. Since linking is a more incremental and lightweight process, the development process can be much more rapid and exploratory.Incremental linking has advantages, but its benefit for the development process is clearly overstated. Early Java development tools were, in fact, quite slow. Today, the bytecodes are translated into machine code by the just-in-time compiler.MultithreadedThe benefits of multithreading are better interactive responsiveness and real-time behavior.If you have ever tried to do multithreading in another language, you will be pleasantly surprised at how easy it is in Java. Threads in Java also can take advantage of multi- processor systems if the base operating system does so. On the downside, thread imple- mentations on the major platforms differ widely, and Java makes no effort to be platform independent in this regard. Only the code for calling multithreading remains the same across machines; Java offloads the implementation of multithreading to the underlying operating system or a thread library. Nonetheless, the ease of multithread- ing is one of the main reasons why Java is such an appealing language for server-side development.Java程序设计概述1996年Java第一次发布就引起了人们的极大兴趣。
外文文献翻译原文+译文
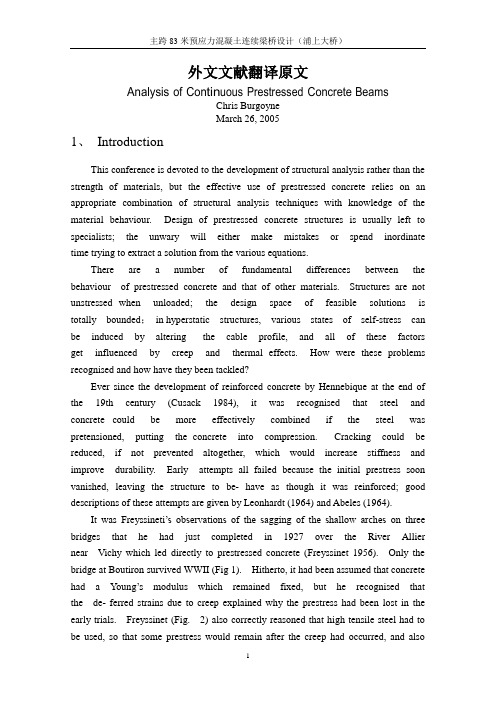
外文文献翻译原文Analysis of Con tin uous Prestressed Concrete BeamsChris BurgoyneMarch 26, 20051、IntroductionThis conference is devoted to the development of structural analysis rather than the strength of materials, but the effective use of prestressed concrete relies on an appropriate combination of structural analysis techniques with knowledge of the material behaviour. Design of prestressed concrete structures is usually left to specialists; the unwary will either make mistakes or spend inordinate time trying to extract a solution from the various equations.There are a number of fundamental differences between the behaviour of prestressed concrete and that of other materials. Structures are not unstressed when unloaded; the design space of feasible solutions is totally bounded;in hyperstatic structures, various states of self-stress can be induced by altering the cable profile, and all of these factors get influenced by creep and thermal effects. How were these problems recognised and how have they been tackled?Ever since the development of reinforced concrete by Hennebique at the end of the 19th century (Cusack 1984), it was recognised that steel and concrete could be more effectively combined if the steel was pretensioned, putting the concrete into compression. Cracking could be reduced, if not prevented altogether, which would increase stiffness and improve durability. Early attempts all failed because the initial prestress soon vanished, leaving the structure to be- have as though it was reinforced; good descriptions of these attempts are given by Leonhardt (1964) and Abeles (1964).It was Freyssineti’s observations of the sagging of the shallow arches on three bridges that he had just completed in 1927 over the River Allier near Vichy which led directly to prestressed concrete (Freyssinet 1956). Only the bridge at Boutiron survived WWII (Fig 1). Hitherto, it had been assumed that concrete had a Young’s modulus which remained fixed, but he recognised that the de- ferred strains due to creep explained why the prestress had been lost in the early trials. Freyssinet (Fig. 2) also correctly reasoned that high tensile steel had to be used, so that some prestress would remain after the creep had occurred, and alsothat high quality concrete should be used, since this minimised the total amount of creep. The history of Freyssineti’s early prestressed concrete work is written elsewhereFigure1:Boutiron Bridge,Vic h yFigure 2: Eugen FreyssinetAt about the same time work was underway on creep at the BRE laboratory in England ((Glanville 1930) and (1933)). It is debatable which man should be given credit for the discovery of creep but Freyssinet clearly gets the credit for successfully using the knowledge to prestress concrete.There are still problems associated with understanding how prestressed concrete works, partly because there is more than one way of thinking about it. These different philosophies are to some extent contradictory, and certainly confusing to the young engineer. It is also reflected, to a certain extent, in the various codes of practice.Permissible stress design philosophy sees prestressed concrete as a way of avoiding cracking by eliminating tensile stresses; the objective is for sufficient compression to remain after creep losses. Untensionedreinforcement, which attracts prestress due to creep, is anathema. This philosophy derives directly from Freyssinet’s logic and is primarily a working stress concept.Ultimate strength philosophy sees prestressing as a way of utilising high tensile steel as reinforcement. High strength steels have high elastic strain capacity, which could not be utilised when used as reinforcement; if the steel is pretensioned, much of that strain capacity is taken out before bonding the steel to the concrete. Structures designed this way are normally designed to be in compression everywhere under permanent loads, but allowed to crack under high live load. The idea derives directly from the work of Dischinger (1936) and his work on the bridge at Aue in 1939 (Schonberg and Fichter 1939), as well as that of Finsterwalder (1939). It is primarily an ultimate load concept. The idea of partial prestressing derives from these ideas.The Load-Balancing philosophy, introduced by T.Y. Lin, uses prestressing to counter the effect of the permanent loads (Lin 1963). The sag of the cables causes an upward force on the beam, which counteracts the load on the beam. Clearly, only one load can be balanced, but if this is taken as the total dead weight, then under that load the beam will perceive only the net axial prestress and will have no tendency to creep up or down.These three philosophies all have their champions, and heated debates take place between them as to which is the most fundamental.2、Section designFrom the outset it was recognised that prestressed concrete has to be checked at both the working load and the ultimate load. For steel structures, and those made from reinforced concrete, there is a fairly direct relationship between the load capacity under an allowable stress design, and that at the ultimate load under an ultimate strength design. Older codes were based on permissible stresses at the working load; new codes use moment capacities at the ultimate load. Different load factors are used in the two codes, but a structure which passes one code is likely to be acceptable under the other.For prestressed concrete, those ideas do not hold, since the structure is highly stressed, even when unloaded. A small increase of load can cause some stress limits to be breached, while a large increase in load might be needed to cross other limits. The designer has considerable freedom to vary both the working load and ultimate load capacities independently; both need to be checked.A designer normally has to check the tensile and compressive stresses, in both the top and bottom fibre of the section, for every load case. The critical sections are normally, but not always, the mid-span and the sections over piers but other sections may become critical ,when the cable profile has to be determined.The stresses at any position are made up of three components, one of which normally has a different sign from the other two; consistency of sign convention is essential.If P is the prestressing force and e its eccentricity, A and Z are the area of the cross-section and its elastic section modulus, while M is the applied moment, then where ft and fc are the permissible stresses in tension and compression.c e t f ZM Z P A P f ≤-+≤Thus, for any combination of P and M , the designer already has four in- equalities to deal with.The prestressing force differs over time, due to creep losses, and a designer isusually faced with at least three combinations of prestressing force and moment;• the applied moment at the time the prestress is first applied, before creep losses occur,• the maximum applied moment after creep losses, and• the minimum applied moment after creep losses.Figure 4: Gustave MagnelOther combinations may be needed in more complex cases. There are at least twelve inequalities that have to be satisfied at any cross-section, but since an I-section can be defined by six variables, and two are needed to define the prestress, the problem is over-specified and it is not immediately obvious which conditions are superfluous. In the hands of inexperienced engineers, the design process can be very long-winded. However, it is possible to separate out the design of the cross-section from the design of the prestress. By considering pairs of stress limits on the same fibre, but for different load cases, the effects of the prestress can be eliminated, leaving expressions of the form:rangestress e Perm issibl Range Mom entZ These inequalities, which can be evaluated exhaustively with little difficulty, allow the minimum size of the cross-section to be determined.Once a suitable cross-section has been found, the prestress can be designed using a construction due to Magnel (Fig.4). The stress limits can all be rearranged into the form:()M fZ PA Z e ++-≤1 By plotting these on a diagram of eccentricity versus the reciprocal of the prestressing force, a series of bound lines will be formed. Provided the inequalities (2) are satisfied, these bound lines will always leave a zone showing all feasible combinations of P and e. The most economical design, using the minimum prestress, usually lies on the right hand side of the diagram, where the design is limited by the permissible tensile stresses.Plotting the eccentricity on the vertical axis allows direct comparison with the crosssection, as shown in Fig. 5. Inequalities (3) make no reference to the physical dimensions of the structure, but these practical cover limits can be shown as wellA good designer knows how changes to the design and the loadings alter the Magnel diagram. Changing both the maximum andminimum bending moments, but keeping the range the same, raises and lowers the feasible region. If the moments become more sagging the feasible region gets lower in the beam.In general, as spans increase, the dead load moments increase in proportion to the live load. A stage will be reached where the economic point (A on Fig.5) moves outside the physical limits of the beam; Guyon (1951a) denoted the limiting condition as the critical span. Shorter spans will be governed by tensile stresses in the two extreme fibres, while longer spans will be governed by the limiting eccentricity and tensile stresses in the bottom fibre. However, it does not take a large increase in moment ,at which point compressive stresses will govern in the bottom fibre under maximum moment.Only when much longer spans are required, and the feasible region moves as far down as possible, does the structure become governed by compressive stresses in both fibres.3、Continuous beamsThe design of statically determinate beams is relatively straightforward; the engineer can work on the basis of the design of individual cross-sections, as outlined above. A number of complications arise when the structure is indeterminate which means that the designer has to consider, not only a critical section,but also the behaviour of the beam as a whole. These are due to the interaction of a number of factors, such as Creep, Temperature effects and Construction Sequence effects. It is the development of these ideas whichforms the core of this paper. The problems of continuity were addressed at a conference in London (Andrew and Witt 1951). The basic principles, and nomenclature, were already in use, but to modern eyes concentration on hand analysis techniques was unusual, and one of the principle concerns seems to have been the difficulty of estimating losses of prestressing force.3.1 Secondary MomentsA prestressing cable in a beam causes the structure to deflect. Unlike the statically determinate beam, where this motion is unrestrained, the movement causes a redistribution of the support reactions which in turn induces additional moments. These are often termed Secondary Moments, but they are not always small, or Parasitic Moments, but they are not always bad.Freyssinet’s bridge across the Marne at Luzancy, started in 1941 but not completed until 1946, is often thought of as a simply supported beam, but it was actually built as a two-hinged arch (Harris 1986), with support reactions adjusted by means of flat jacks and wedges which were later grouted-in (Fig.6). The same principles were applied in the later and larger beams built over the same river.Magnel built the first indeterminate beam bridge at Sclayn, in Belgium (Fig.7) in 1946. The cables are virtually straight, but he adjusted the deck profile so that the cables were close to the soffit near mid-span. Even with straight cables the sagging secondary momentsare large; about 50% of the hogging moment at the central support caused by dead and live load.The secondary moments cannot be found until the profile is known but the cablecannot be designed until the secondary moments are known. Guyon (1951b) introduced the concept of the concordant profile, which is a profile that causes no secondary moments; es and ep thus coincide. Any line of thrust is itself a concordant profile.The designer is then faced with a slightly simpler problem; a cable profile has to be chosen which not only satisfies the eccentricity limits (3) but is also concordant. That in itself is not a trivial operation, but is helped by the fact that the bending moment diagram that results from any load applied to a beam will itself be a concordant profile for a cable of constant force. Such loads are termed notional loads to distinguish them from the real loads on the structure. Superposition can be used to progressively build up a set of notional loads whose bending moment diagram gives the desired concordant profile.3.2 Temperature effectsTemperature variations apply to all structures but the effect on prestressed concrete beams can be more pronounced than in other structures. The temperature profile through the depth of a beam (Emerson 1973) can be split into three components for the purposes of calculation (Hambly 1991). The first causes a longitudinal expansion, which is normally released by the articulation of the structure; the second causes curvature which leads to deflection in all beams and reactant moments in continuous beams, while the third causes a set of self-equilibrating set of stresses across the cross-section.The reactant moments can be calculated and allowed-for, but it is the self- equilibrating stresses that cause the main problems for prestressed concrete beams. These beams normally have high thermal mass which means that daily temperature variations do not penetrate to the core of the structure. The result is a very non-uniform temperature distribution across the depth which in turn leads to significant self-equilibrating stresses. If the core of the structure is warm, while the surface is cool, such as at night, then quite large tensile stresses can be developed on the top and bottom surfaces. However, they only penetrate a very short distance into the concrete and the potential crack width is very small. It can be very expensive to overcome the tensile stress by changing the section or the prestress。
建筑外文文献(含中文翻译)

中文译文:建筑业的竞争及竞争策略美国的工程建筑公司几十年来一直控制着国际建筑市场,但近来世界上发生的事件改变了它的主导地位。
为了调查今后十年对工程建筑竞争产生影响的推动力及趋势,由建筑工业研究院的"2000年建筑特别工作组:发起一项称为“2000年建筑市场竞争分析”的研究项目。
该研究项目考察了一些影响竞争的因素,包括下列方面:企业能力塑造:采用纵向联合,横向发展的方法,提高企业的综合能力。
扩大市场领地,这种做法包括被海外的联合企业收购或被其合并,或是由美国公司收购外国公司。
筹措资金的选择方法:私有化作用,建筑权力转让项目,未来市场中工程筹资特征。
管理、组织及结构:未来的经营管理及组织方法、组织结构、组织技巧要有利于引导职员在世界竞争环境中发挥作用。
劳力特征:未来具有专业水平和技工水平的工程建筑工人的供求情况技术问题:技术将如何影响竞争,如何用来弥补劳力不足的缺陷。
研究目标及范围这一研究项目的目标是收集信息,使之为适应2000年及以后的工程建筑业在调整、制定策略方面的需要提供真知灼见,并制定出2000年工程建筑业的可能的发展计划。
这项研究回顾了工程建筑业的历史过程,审视了当前的发展趋势,以确定影响该工业未来的推动力,与该工业相关的有重塑企业能力,私有化及筹措资金方法的潜在作用以及经营管理、组织方法、公司结构方面的未来发展方向。
研究范围包括选定一些公司,采访这些公司有专业特长的人员。
这些人员的专业涉及面很广,包括商业建筑,重工业建筑,公共事业设施建设,基础建设.轻工业建筑,电力,生产程序以及航天科学。
工程建筑业竞争特性工程建筑业的竞争特征由于下列原因在变动:80年代发生的事件,以及计划在90年代实施的项目,正在引导建筑业摆脱相互对立的局面,转向相互合作。
应该以积极的眼光看待新的公司进入国际工程建筑市场,因为它增加了全球合作的机遇。
合作关系会使所有的伙伴受益,这是因为美国公司可以在合作伙伴的国家找到机遇,同样,外国公司也会打入美国市场。
本科毕业设计外文文献及译文1

本科毕业设计外文文献及译文文献、资料题目:Transit Route Network Design Problem:Review文献、资料来源:网络文献、资料发表(出版)日期:2007.1院(部):xxx专业:xxx班级:xxx姓名:xxx学号:xxx指导教师:xxx翻译日期:xxx外文文献:Transit Route Network Design Problem:Review Abstract:Efficient design of public transportation networks has attracted much interest in the transport literature and practice,with manymodels and approaches for formulating the associated transit route network design problem _TRNDP_having been developed.The presentpaper systematically presents and reviews research on the TRNDP based on the three distinctive parts of the TRNDP setup:designobjectives,operating environment parameters and solution approach.IntroductionPublic transportation is largely considered as a viable option for sustainable transportation in urban areas,offering advantages such as mobility enhancement,traffic congestion and air pollution reduction,and energy conservation while still preserving social equity considerations. Nevertheless,in the past decades,factors such as socioeconomic growth,the need for personalized mobility,the increase in private vehicle ownership and urban sprawl have led to a shift towards private vehicles and a decrease in public transportation’s share in daily commuting (Sinha2003;TRB2001;EMTA2004;ECMT2002;Pucher et al.2007).Efforts for encouraging public transportation use focuses on improving provided services such as line capacity,service frequency,coverage,reliability,comfort and service quality which are among the most important parameters for an efficient public transportation system(Sinha2003;Vuchic2004.) In this context,planning and designing a cost and service efficientpublic transportation network is necessary for improving its competitiveness and market share. The problem that formally describes the design of such a public transportation network is referred to as the transit route network design problem(TRNDP);it focuses on the optimization of a number of objectives representing the efficiency of public transportation networks under operational and resource constraints such as the number and length of public transportation routes, allowable service frequencies,and number of available buses(Chakroborty2003;Fan and Machemehl2006a,b).The practical importance of designing public transportation networks has attractedconsiderable interest in the research community which has developed a variety of approaches and modelsfor the TRNDP including different levels of design detail and complexity as well as interesting algorithmic innovations.In thispaper we offer a structured review of approaches for the TRNDP;researchers will obtain a basis for evaluating existing research and identifying future research paths for further improving TRNDP models.Moreover,practitioners will acquire a detailed presentation of both the process and potential tools for automating the design of public transportation networks,their characteristics,capabilities,and strengths.Design of Public Transportation NetworksNetwork design is an important part of the public transportation operational planning process_Ceder2001_.It includes the design of route layouts and the determination of associated operational characteristics such as frequencies,rolling stock types,and so on As noted by Ceder and Wilson_1986_,network design elements are part of the overall operational planning process for public transportation networks;the process includes five steps:_1_design of routes;_2_ setting frequencies;_3_developing timetables;_4_scheduling buses;and_5_scheduling drivers. Route layout design is guided by passenger flows:routes are established to provide direct or indirect connection between locations and areas that generate and attract demand for transit travel, such as residential and activity related centers_Levinson1992_.For example,passenger flows between a central business district_CBD_and suburbs dictate the design of radial routes while demand for trips between different neighborhoods may lead to the selection of a circular route connecting them.Anticipated service coverage,transfers,desirable route shapes,and available resources usually determine the structure of the route network.Route shapes areusually constrained by their length and directness_route directness implies that route shapes are as straight as possible between connected points_,the usage of given roads,and the overlapping with other transit routes.The desirable outcome is a set of routesconnecting locations within a service area,conforming to given design criteria.For each route, frequencies and bus types are the operational characteristics typically determined through design. Calculations are based on expected passenger volumes along routes that are estimated empirically or by applying transit assignmenttechniques,under frequency requirement constraints_minimum and maximum allowedfrequencies guaranteeing safety and tolerable waiting times,respectively_,desired load factors, fleet size,and availability.These steps as well as the overall design.process have been largely based upon practical guidelines,the expert judgment of transit planners,and operators experience_Baaj and Mahmassani1991_.Two handbooks by Black _1995_and Vuchic_2004_outline frameworks to be followed by planners when designing a public transportation network that include:_1_establishing the objectives for the network;_2_ defining the operational environment of the network_road structure,demand patterns,and characteristics_;_3_developing;and_4_evaluating alternative public transportation networks.Despite the extensive use of practical guidelines and experience for designing transit networks,researchers have argued that empirical rules may not be sufficient for designing an efficient transit network and improvements may lead to better quality and more efficient services. For example,Fan and Machemehl_2004_noted that researchers and practitioners have been realizing that systematic and integrated approaches are essential for designing economically and operationally efficient transit networks.A systematic design process implies clear and consistent steps and associated techniques for designing a public transportation network,which is the scope of the TRNDP.TRNDP:OverviewResearch has extensively examined the TRNDP since the late1960s.In1979,Newell discussed previous research on the optimal design of bus routes and Hasselström_1981_ analyzed relevant studies and identified the major features of the TRNDP as demand characteristics,objective functions,constraints,passengerbehavior,solution techniques,and computational time for solving the problem.An extensive review of existing work on transit network design was provided by Chua_1984_who reported five types of transit system planning:_1_manual;_2_marketanalysis;_3_systems analysis;_4_systems analysis with interactive graphics;and_5_ mathematical optimization approach.Axhausemm and Smith_1984_analyzed existing heuristic algorithms for formulating the TRNDP in Europe,tested them,anddiscussed their potential implementation in the United States.Ceder and Wilson_1986_reportedprior work on the TRNDP and distinguished studies into those that deal with idealized networks and to those that focus on actual routes,suggesting that the main features of the TRNDP include demand characteristics,objectivesand constraints,and solution methods.At the same period,Van Nes et al._1988_grouped TRNDP models into six categories:_1_ analytical models for relating parameters of the public transportation system;_2_models determining the links to be used for public transportation route construction;_3_models determining routes only;_4_models assigning frequencies to a set of routes;_5_two-stage models for constructing routes and then assigning frequencies;and_6_models for simultaneously determining routes and frequencies.Spacovic et al._1994_and Spacovic and Schonfeld_1994_proposed a matrix organization and classified each study according to design parameters examined,objectives anticipated,network geometry,and demand characteristics. Ceder and Israeli_1997_suggested broad categorizations for TRNDP models into passenger flow simulation and mathematical programming models.Russo_1998_adopted the same categorization and noted that mathematical programming models guarantee optimal transit network design but sacrifice the level of detail in passenger representation and design parameters, while simulation models address passenger behavior but use heuristic procedures obtaining a TRNDP solution.Ceder_2001_enhanced his earlier categorization by classifying TRNDP models into simulation,ideal network,and mathematical programming models.Finally,in a recent series of studies,Fan and Machemehl_2004,2006a,b_divided TRNDP approaches into practical approaches,analytical optimization models for idealized conditions,and metaheuristic procedures for practical problems.The TRNDP is an optimization problem where objectives are defined,its constraints are determined,and a methodology is selected and validated for obtaining an optimal solution.The TRNDP is described by the objectives of the public transportation network service to be achieved, the operational characteristics and environment under which the network will operate,and the methodological approach for obtaining the optimal network design.Based on this description of the TRNDP,we propose a three-layer structure for organizing TRNDP approaches_Objectives, Parameters,and Methodology_.Each layer includes one or more items that characterize each study.The“Objectives”layer incorporates the goals set when designing a public transportation system such as the minimization of the costs of the system or the maximization of the quality of services provided.The“Parameters”layer describes the operating environment and includes both the design variables expected to be derived for the transit network_route layouts,frequencies_as well as environmental and operational parameters affecting and constraining that network_for example,allowable frequencies,desired load factors,fleet availability,demand characteristics and patterns,and so on_.Finally,the“Methodology”layer covers the logical–mathematical framework and algorithmic tools necessary to formulate and solve the TRNDP.The proposed structure follows the basic concepts toward setting up a TRNDP:deciding upon the objectives, selecting the transit network items and characteristics to be designed,setting the necessary constraints for the operating environment,and formulating and solving the problem. TRNDP:ObjectivesPublic transportation serves a very important social role while attempting to do this at the lowest possible operating cost.Objectives for designing daily operations of a public transportation system should encompass both angles.The literature suggests that most studies actually focus on both the service and economic efficiency when designing such a system. Practical goals for the TRNDP can be briefly summarized as follows_Fielding1987;van Oudheudsen et al.1987;Black1995_:_1_user benefit maximization;_2_operator cost minimization;_3_total welfare maximization;_4_capacity maximization;_5_energy conservation—protection of the environment;and_6_individual parameter optimization.Mandl_1980_indicated that public transportation systems have different objectives to meet. He commented,“even a single objective problem is difficult to attack”_p.401_.Often,these objectives are controversial since cutbacks in operating costs may require reductions in the quality of services.Van Nes and Bovy_2000_pointed out that selected objectives influence the attractiveness and performance of a public transportation network.According to Ceder and Wilson_1986_,minimization of generalized cost or time or maximization of consumer surplus were the most common objectives selected when developing transit network design models. Berechman_1993_agreed that maximization of total welfare is the most suitable objective for designing a public transportation system while Van Nes and Bovy_2000_argued that the minimization of total user and system costs seem the most suit able and less complicatedobjective_compared to total welfare_,while profit maximization leads to nonattractive public transportation networks.As can be seen in Table1,most studies seek to optimize total welfare,which incorporates benefits to the user and to the er benefits may include travel,access and waiting cost minimization,minimization of transfers,and maximization of coverage,while benefits for the system are maximum utilization and quality of service,minimization of operating costs, maximization of profits,and minimization of the fleet size used.Most commonly,total welfare is represented by the minimization of user and system costs.Some studies address specific objectives from the user,theoperator,or the environmental perspective.Passenger convenience,the number of transfers, profit and capacity maximization,travel time minimization,and fuel consumption minimization are such objectives.These studies either attempt to simplify the complex objective functions needed to setup the TRNDP_Newell1979;Baaj and Mahmassani1991;Chakroborty and Dwivedi2002_,or investigate specific aspects of the problem,such as objectives_Delle Site and Fillipi2001_,and the solution methodology_Zhao and Zeng2006;Yu and Yang2006_.Total welfare is,in a sense,a compromise between objectives.Moreover,as reported by some researchers such as Baaj and Mahmassani_1991_,Bielli et al._2002_,Chackroborty and Dwivedi_2002_,and Chakroborty_2003_,transit network design is inherently a multiobjective problem.Multiobjective models for solving the TRNDP have been based on the calculation of indicators representing different objectives for the problem at hand,both from the user and operator perspectives,such as travel and waiting times_user_,and capacity and operating costs _operator_.In their multiobjective model for the TRNDP,Baaj and Majmassani_1991_relied on the planner’s judgment and experience for selecting the optimal public transportation network,based on a set of indicators.In contrast,Bielli et al._2002_and Chakroborty and Dwivedi_2002_,combined indicators into an overall,weighted sum value, which served as the criterion for determining the optimaltransit network.TRNDP:ParametersThere are multiple characteristics and design attributes to consider for a realistic representation of a public transportation network.These form the parameters for the TRNDP.Part of these parameters is the problem set of decision variables that define its layout and operational characteristics_frequencies,vehicle size,etc._.Another set of design parameters represent the operating environment_network structure,demand characters,and patterns_, operational strategies and rules,and available resources for the public transportation network. These form the constraints needed to formulate the TRNDP and are,a-priori fixed,decided upon or assumed.Decision VariablesMost common decision variables for the TRNDP are the routes and frequencies of the public transportation network_Table1_.Simplified early studies derived optimal route spacing between predetermined parallel or radial routes,along with optimal frequencies per route_Holroyd1967; Byrne and Vuchic1972;Byrne1975,1976;Kocur and Hendrickson1982;Vaughan1986_,while later models dealt with the development of optimal route layouts and frequency determination. Other studies,additionally,considered fares_Kocur and Hendrickson1982;Morlok and Viton 1984;Chang and Schonfeld1991;Chien and Spacovic2001_,zones_Tsao and Schonfeld1983; Chang and Schonfeld1993a_,stop locations_Black1979;Spacovic and Schonfeld1994; Spacovic et al.1994;Van Nes2003;Yu and Yang2006_and bus types_Delle Site and Filippi 2001_.Network StructureSome early studies focused on the design of systems in simplified radial_Byrne1975;Black 1979;Vaughan1986_,or rectangular grid road networks_Hurdle1973;Byrne and Vuchic1972; Tsao and Schonfeld1984_.However,most approaches since the1980s were either applied to realistic,irregular grid networks or the network structure was of no importance for the proposed model and therefore not specified at all.Demand PatternsDemand patterns describe the nature of the flows of passengers expected to be accommodated by the public transportation network and therefore dictate its structure.For example,transit trips from a number of origins_for example,stops in a neighborhood_to a single destination_such as a bus terminal in the CBD of a city_and vice-versa,are characterized as many-to-one_or one-tomany_transit demand patterns.These patterns are typically encountered in public transportation systems connecting CBDs with suburbs and imply a structure of radial orparallel routes ending at a single point;models for patterns of that type have been proposed by Byrne and Vuchic_1972_,Salzborn_1972_,Byrne_1975,1976_,Kocur and Hendrickson _1982_,Morlok and Viton_1984_,Chang and Schonfeld_1991,1993a_,Spacovic and Schonfeld_1994_,Spacovic et al._1994_,Van Nes_2003_,and Chien et al._2003_.On the other hand,many-to-many demand patterns correspond to flows between multiple origins and destinations within an urban area,suggesting that the public transportation network is expected to connect various points in an area.Demand CharacteristicsDemand can be characterized either as“fixed”_or“inelastic”_or“elastic”;the later meaning that demand is affected by the performance and services provided by the public transportation network.Lee and Vuchic_2005_distinguished between two types of elastic demand:_1_demand per mode affected by transportation services,with total demand for travel kept constant;and_2_total demand for travel varying as a result of the performance of the transportation system and its modes.Fan and Machemehl_2006b_noted that the complexity of the TRNDP has led researchers intoassuming fixed demand,despite its inherent elastic nature.However,since the early1980s, studies included aspects of elastic demand in modeling the TRNDP_Hasselstrom1981;Kocur and Hendrickson1982_.Van Nes et al._1988_applied a simultaneous distribution-modal split model based on transit deterrence for estimatingdemand for public transportation.In a series of studies,Chang and Schonfeld_1991,1993a,b_ and Spacovic et al._1994_estimated demand as a direct function of travel times and fares with respect to their elasticities,while Chien and Spacovic2001_,followed the same approach assuming that demand is additionally affected by headways,route spacing and fares.Finally, studies by Leblanc_1988_,Imam_1998_,Cipriani et al._2005_,Lee and Vuchic_2005_;and Fan and Machemehl_2006a_based demand estimation on mode choice models for estimating transit demand as a function of total demand for travel.中文译文:公交路线网络设计问题:回顾摘要:公共交通网络的有效设计让交通理论与实践成为众人关注的焦点,随之发展出了很多规划相关公交路线网络设计问题(TRNDP)的模型与方法。
20外文文献翻译原文及译文参考样式

20外⽂⽂献翻译原⽂及译⽂参考样式华北电⼒⼤学科技学院毕业设计(论⽂)附件外⽂⽂献翻译学号: 0819******** 姓名:宗鹏程所在系别:机械⼯程及⾃动化专业班级:机械08K1指导教师:张超原⽂标题:Development of a High-PerformanceMagnetic Gear年⽉⽇⾼性能磁齿轮的发展1摘要:本⽂提出了⼀个⾼性能永磁齿轮的计算和测量结果。
上述分析的永磁齿轮有5.5的传动⽐,并能够提供27 Nm的⼒矩。
分析表明,由于它的弹簧扭转常数很⼩,因此需要特别重视安装了这种⾼性能永磁齿轮的系统。
上述分析的齿轮也已经被应⽤在实际中,以验证、预测其效率。
经测量,由于较⼤端齿轮传动引起的磁⼒齿轮的扭矩只有16 Nm。
⼀项关于磁齿轮效率损失的系统研究也展⽰了为什么实际⼯作效率只有81%。
⼀⼤部分磁损耗起源于轴承,因为机械故障的存在,此轴承的备⽤轴承在此时是必要的。
如果没有源于轴的少量磁泄漏,我们估计能得到⾼达96%的效率。
与传统的机械齿轮的⽐较表明,磁性齿轮具有更好的效率和单位体积较⼤扭矩。
最后,可以得出结论,本⽂的研究结果可能有助于促进传统机械齿轮向磁性齿轮发展。
关键词:有限元分析(FEA)、变速箱,⾼转矩密度,磁性齿轮。
⼀、导⾔由于永久磁铁能产⽣磁通和磁⼒,虽然⼏个世纪过去了,许多⼈仍然着迷于永久磁铁。
,在过去20年的复兴阶段,正是这些优点已经使得永久磁铁在很多实际中⼴泛的应⽤,包括在起重机,扬声器,接头领域,尤其是在永久磁铁电机⽅⾯。
其中对永磁铁的复兴最常见于效率和转矩密度由于永磁铁的应⽤显著提⾼的⼩型机器的领域。
在永久磁铁没有获取⾼度重视的⼀个领域是传动装置的领域,也就是说,磁⼒联轴器不被⼴泛⽤于传动装置。
磁性联轴器基本上可以被视为以传动⽐为1:1磁⼒齿轮。
相⽐标准电⽓机器有约10kN m/m的扭矩,装有⾼能量永久磁铁的磁耦有⾮常⾼的单位体积密度的扭矩,变化范围⼤约300–400 kN 。