最常用的matlab图像处理的源代码
黑白照片转化为彩色matlab代码
黑白照片转化为彩色matlab代码黑白照片转化为彩色是一项有趣且具有挑战性的任务。
在这个过程中,我们需要使用一些图像处理技术来还原照片的原始色彩。
本文将介绍一种基于Matlab的简单方法来实现这个目标。
我们需要加载待处理的黑白照片。
在Matlab中,可以使用imread 函数来读取图像文件。
例如,我们可以使用以下代码加载名为"bw_image.jpg"的黑白照片:```matlabbw_image = imread('bw_image.jpg');```接下来,我们将使用一些图像处理技术来将黑白照片转化为彩色。
一种常用的方法是通过颜色空间转换来实现。
在Matlab中,我们可以使用rgb2gray函数将彩色图像转换为灰度图像,然后使用gray2rgb函数将灰度图像转换回彩色图像。
以下是实现这个过程的代码:```matlabgray_image = rgb2gray(bw_image);color_image = gray2rgb(gray_image);```这样,我们就可以获得了一张彩色的图像。
然而,这种方法只是简单地将灰度信息复制到了RGB通道,效果可能并不理想。
为了改善结果,我们可以尝试其他更复杂的图像处理技术,例如图像增强或色彩补偿算法。
这些算法可以根据图像的内容和特征来调整颜色分布,以使图像看起来更加自然和生动。
除了使用内置的图像处理函数,我们还可以自定义一些算法来实现黑白照片转化为彩色。
例如,我们可以根据图像的纹理和结构信息来估计缺失的颜色信息。
这种方法需要一些先验知识和图像分析技术,但可以获得更好的结果。
黑白照片转化为彩色是一个有趣且具有挑战性的任务。
在Matlab中,我们可以使用一些内置的图像处理函数来实现这个目标,也可以尝试自定义算法来改进结果。
无论采用何种方法,我们都可以通过将灰暗的过去变为绚丽多彩的现在,使照片更加生动和有趣。
matlab经典源程序带有注释(详细经典)
2.1set 与get 函数 (1)2.2callback函数 (2)2.3元胞数组 (4)2.4结构数组 (6)2.5矩阵操作 (9)2.6字符串操作 (13)2.7判断函数使用大全 (16)2.11打开外部程序 (21)2.11程序运行时间 (22)2.14动画 (23)2.12动画 (24)2.23显示多行内容 (26)2.24 uitable 使用 (26)2.27鼠标操作 (27)2.28键盘操作 (27)2.32粘贴板 (28)2.1set 与get 函数set(edit_handle,'String','my value!'); %String为Edit控件的属性%%%2.1-1%创建figure对象hfig=figure(1);%创建坐标轴对象,指定其父对象为figure 1haxes1=axes('parent',hfig);prop.Color='b';prop.FontSize=12;set(haxes1,prop);%%%2.1-2hfig=figure(1);%查询其Units属性值get(hfig,'units')%其Units属性值为pixels(像素)% ans=% pixels%%%2.1-3%figure的Pointer属性标识了鼠标指针的形状set(gcf,'pointer');% 返回值为:[ crosshair | fullcrosshair | {arrow} | ibeam | watch | topl | topr | botl | botr | left | top | right | bottom | circle | cross | fleur | custom | hand ]%%%2.1-4%首先取得标识电脑屏幕大小的度量单位get(0,'units')% ans =% pixels%取得屏幕的尺寸get(0,'screensize')% ans =% 1 1 1280 8002.2callback函数%定义M文件的主函数名称为DefineCallback,不带输入和输出参数function DefineCallbackhFig= figure('units','normalize',...'position',[0.4 0.4 0.3 0.2]);%在窗口中创建按钮控件,并定义其Callback属性uicontrol('parent',hFig,...'style','pushbutton',...'String','Execute Callback',...'units','normalize',...'position',[0.4 0.4 0.3 0.2],...'callback',['figure;',...'x = 0:pi/20:2*pi;',...'y = sin(x);',...'plot(x,y);']);%定义M文件的主函数名称为DefineCallback,不带输入和输出参数function DefineCallback%创建界面窗口hFig= figure('units','normalize',...'position',[0.4 0.4 0.3 0.2]);%在窗口中创建按钮控件hpush=uicontrol('parent',hFig,...'style','pushbutton',...'String','Execute Callback',...'units','normalize',...'position',[0.4 0.4 0.3 0.2]);%设置按钮的Callback属性set(hpush,'callback',@mycallback);%定义回调函数为子函数function mycallback(hobj,event)figure;x = 0:pi/20:2*pi;y = sin(x);plot(x,y);2.3元胞数组a={'hello' [1 2 3;4 5 6];1 {'1''2'}}a ='hello' [2x3 double][ 1] {1x2 cell }%示例2:将元胞数组a中的元胞逐一赋值>> a{1,1}='hello';a{1,2}=[1 2 3;4 5 6];a{2,1}=1;a{2,2}={'1' '2'};>> aa ='hello' [2x3 double][ 1] {1x2 cell }%示例3:使用cell函数来创建元胞数组%生成2x3的元素为空数组的元胞数组>> a=cell(2,3)a =[] [] [][] [] []%示例4:判断数组A是否为元胞数组%定义一个元胞数组A>> A={1 2 3};%判断A是否为元胞数组,如果为元胞数组,则函数>> tf = iscell(A)tf =1%示例5:显示元胞数组C中的内容>> clear>> C={'Smith' [1 2;3 4] [12]};%直接显示元胞数组C中的内容>> celldisp(C)C{1} =SmithC{2} =1 23 4C{3} =12%显示元胞数组C中的内容,数组的名称用cellcontent代替>> celldisp(C,'cellcontent')cellcontent{1} =Smithcellcontent{2} =1 23 4cellcontent{3} =12%示例6:将字符数组转换为元胞数组>> S = ['abc '; 'defg'; 'hi m'];>> cellstr(S)ans ='abc'%原先abc后面的空格被清除'defg''hi m'%i和m之间的空格仍然保留%示例7:显示元胞数组S中的内容(包括空格和字符)>> S = {'abc ', 'defg','hi m'};>> cellplot(S)%示例8:将数字数组A按行或按列转换为元胞数组%A是4x3的数组>> A=[1 2 3;4 5 6;7 8 9;10 11 12];%把A的每一列转换为一个元胞,得到的C是1×3的元胞数组>> C=num2cell(A,1)C =[4x1 double] [4x1 double] [4x1 double] %把A的每一行转换为一个元胞,得到的C是4×1的元胞数组>> C=num2cell(A,2)C =[1x3 double][1x3 double][1x3 double][1x3 double]2.4结构数组%示例1:使用直接法来创建结构数组>> A(1).name = 'Pat';A(1).number = 176554;A(2).name = 'Tony';A(2).number = 901325;>> AA =1x2 struct array with fields:namenumber%示例2:利用struct函数来创建结构数组>> A(1)=struct('name','Pat','number',176554);A(2)=struct('name','Tony','number',901325);>> AA =1x2 struct array with fields:namenumber%示例3:使用deal函数来得到结构体中各结构域的值%定义结构数组A>> = 'Pat'; A.number = 176554;A(2).name = 'Tony';A(2).number = 901325;%得到结构数组中所有name结构域的数据>>[name1,name2] = deal(A(:).name)name1 =Patname2 =Tony%示例4:使用getfield函数来取得结构体中结构域的值%定义mystr结构数组>> mystr(1,1).name = 'alice';mystr(1,1).ID = 0;mystr(2,1).name = 'gertrude';mystr(2,1).ID = 1;%取得mystr(2,1)的结构域name的值>> f = getfield(mystr, {2,1}, 'name')f =gertrude%示例5:删除结构数组中的指定结构域%定义结构数组s>> s.field1=[1 2 3];s.field2='string';s.field3={1 2 3;4 5 6}; %删除结构域field1>> s=rmfield(s,'field1')s =field2: 'string'field3: {2x3 cell}%删除结构域'field2','field3'>> s=rmfield(s,{'field2','field3'})s =field1: [1 2 3]%示例6:%定义结构数组s>> s.field1=[1 2 3];s.field2='string';s.field3={1 2 3;4 5 6}; >> ss =field1: [1 2 3]field2: 'string'field3: {2x3 cell}%将结构数组转换为元胞数组>> c=struct2cell(s)c =[1x3 double]'string'{2x3 cell }%示例7:>>c = {'birch', 'betula', 65; 'maple', 'acer', 50}c ='birch''betula' [65]'maple''acer' [50]>>fields = {'name', 'genus', 'height'}; %fields包含struct中的结构域名>>s = cell2struct(c, fields, 2); %dim=2表示把c中的各行转换为struct数组s =2x1 struct array with fields:namegenusheight>> s(1)ans =name: 'birch'genus: 'betula'height: 65>> s(2)ans =name: 'maple'genus: 'acer'height: 50>> fields = {'field1', 'field2'};>> s = cell2struct(c, fields, 1); %dim=1表示把c中的各列转换为struct数组>> s(1)ans =field1: 'birch'field2: 'maple'>> s(2)ans =field1: 'betula'field2: 'acer'>> s(3)ans =field1:65field2:502.5矩阵操作%示例1: find函数的使用方法。
matlab光流法源代码

matlab光流法源代码以下是一个简单的MATLAB光流法源代码示例:matlab.% 读取视频文件。
videoFile = 'path_to_video_file'; % 替换为视频文件的路径。
videoObj = VideoReader(videoFile);% 读取第一帧图像。
frame1 = readFrame(videoObj);frame1_gray = rgb2gray(frame1);% 初始化光流估计器。
opticalFlow = opticalFlowLK('NoiseThreshold', 0.01); % 遍历视频的每一帧并计算光流。
while hasFrame(videoObj)。
% 读取当前帧图像。
frame2 = readFrame(videoObj);frame2_gray = rgb2gray(frame2);% 计算光流向量。
flow = estimateFlow(opticalFlow, frame1_gray); % 可视化光流向量。
imshow(frame1);hold on;plot(flow, 'DecimationFactor', [5 5], 'ScaleFactor', 10);hold off;drawnow;% 更新帧和光流向量。
frame1_gray = frame2_gray;end.请注意,这只是一个简单的光流法示例,使用了MATLAB的光流估计器函数`opticalFlowLK`。
你需要将`path_to_video_file`替换为实际的视频文件路径。
此代码将逐帧计算光流向量,并在每一帧上绘制光流向量的可视化结果。
这只是光流法的一个基本示例,实际应用中可能需要更复杂的光流估计器或其他处理步骤。
希望这个简单的代码示例能够帮助你入门光流法的实现。
数字图像处理及matlab实现源代码【1】
% *-*--*-*-*-*-*-*-*-*-*-*-*图像处理*-*-*-*-*-*-*-*-*-*-*-*%{% (一)图像文件的读/写A=imread('drum.jpg'); % 读入图像imshow(A); % 显示图像imwrite(A,'drum.jpg');info=imfinfo('drum.jpg') % 查询图像文件信息% 用colorbar函数将颜色条添加到坐标轴对象中RGB=imread('drum.jpg');I=rgb2gray(RGB); % 把RGB图像转换成灰度图像h=[1 2 1;0 0 0;-1 -2 -1];I2=filter2(h,I);imshow(I2,[]);colorbar('vert') % 将颜色条添加到坐标轴对象中% wrap函数将图像作为纹理进行映射A=imread('4.jpg');imshow(A);I=rgb2gray(RGB);[x,y,z]=sphere;warp(x,y,z,I); % 用warp函数将图像作为纹理进行映射%}% subimage函数实现一个图形窗口中显示多幅图像RGB=imread('drum.jpg');I=rgb2gray(RGB);subplot(1,2,1);subimage(RGB); % subimage函数实现一个图形窗口中显示多幅图像subplot(1,2,2),subimage(I);% *-*--*-*-*-*-*-*-*-*-*-*-*图像处理*-*-*-*-*-*-*-*-*-*-*-*% (二)图像处理的基本操作% ----------------图像代数运算------------------%{% imadd函数实现两幅图像的相加或给一幅图像加上一个常数% 给图像每个像素都增加亮度I=imread('4.jpg');J=imadd(I,100); % 给图像增加亮度subplot(1,2,1),imshow(I);title('原图');subplot(1,2,2),imshow(J);title('增加亮度图');%% imsubtract函数实现将一幅图像从另一个图像中减去或减去一个常数I=imread('drum.jpg');J=imsubtract(I,100); % 给图像减去亮度subplot(1,2,1),imshow(I);%% immultiply实现两幅图像的相乘或者一幅图像的亮度缩放I=imread('drum.jpg');J=immultiply(I,2); % 进行亮度缩放subplot(1,2,1),imshow(I);subplot(1,2,2),imshow(J);%% imdivide函数实现两幅图像的除法或一幅图像的亮度缩放I=imread('4.jpg');J=imdivide(I,0.5); % 图像的亮度缩放subplot(1,2,1),imshow(I);subplot(1,2,2),imshow(J);%}% ----------------图像的空间域操作------------------%{% imresize函数实现图像的缩放J=imread('4.jpg');subplot(1,2,1),imshow(J);title('原图');X1=imresize(J,0.2); % 对图像进行缩放subplot(1,2,2),imshow(X1);title('缩放图');%% imrotate函数实现图像的旋转I=imread('drum.jpg');J=imrotate(I,50,'bilinear'); % 对图像进行旋转subplot(1,2,1),imshow(I);subplot(1,2,2),imshow(J);%% imcrop函数实现图像的剪切I=imread('drum.jpg');I2=imcrop(I,[1 100 130 112]); % 对图像进行剪切subplot(1,2,1),imshow(I);subplot(1,2,2),imshow(I2);%}% ----------------特定区域处理------------------%{% roipoly函数用于选择图像中的多边形区域I=imread('4.jpg');c=[200 250 278 248 199 172];r=[21 21 75 121 121 75];BW=roipoly(I,c,r); % roipoly函数选择图像中的多边形区域subplot(1,2,1),imshow(I);subplot(1,2,2),imshow(BW);%% roicolor函数式对RGB图像和灰度图像实现按灰度或亮度值选择区域进行处理a=imread('4.jpg');subplot(2,2,1),imshow(a);I=rgb2gray(a);BW=roicolor(I,128,225); % 按灰度值选择的区域subplot(2,2,4),imshow(BW);%% ploy2mask 函数转化指定的多边形区域为二值掩模x=[63 186 54 190 63];y=[60 60 209 204 601];bw=poly2mask(x,y,256,256); % 转化指定的多边形区域为二值掩模imshow(bw);hold onplot(x,y,'r','LineWidth',2);hold off%% roifilt2函数实现区域滤波a=imread('4.jpg');I=rgb2gray(a);c=[200 250 278 248 199 172];r=[21 21 75 121 121 75];BW=roipoly(I,c,r); % roipoly函数选择图像中的多边形区域h=fspecial('unsharp');J=roifilt2(h,I,BW); % 区域滤波subplot(1,2,1),imshow(I);subplot(1,2,2),imshow(J);%% roifill函数实现对特定区域进行填充a=imread('4.jpg');I=rgb2gray(a);c=[200 250 278 248 199 172];r=[21 21 75 121 121 75];J=roifill(I,c,r); % 对特定区域进行填充subplot(1,2,1),imshow(I);subplot(1,2,2),imshow(J);%}% ----------------图像变换------------------%{% fft2 和ifft2函数分别是计算二维的快速傅里叶变换和反变换f=zeros(100,100);subplot(1,2,1);imshow(f);f(20:70,40:60)=1;subplot(1,2,2);imshow(f);F=fft2(f); % 计算二维的快速傅里叶变换F2=log(abs(F));% 对幅值对对数figure;subplot(1,2,1),imshow(F),colorbar;subplot(1,2,2),imshow(F2),colorbar;%% fftsshift 函数实现了补零操作和改变图像显示象限f=zeros(100,100);subplot(2,2,1),imshow(f);title('f')f(10:70,40:60)=1;subplot(2,2,2),imshow(f);title('f取后')F=fft2(f,256,256);subplot(2,2,3),imshow(F);title('F')F2=fftshift(F); % 实现补零操作subplot(2,2,4),imshow(F2);title('F2')figure,imshow(log(abs(F2)));title('log(|F2|)')%% dct2 函数采用基于快速傅里叶变换的算法,用于实现较大输入矩阵的离散余弦变换% idct2 函数实现图像的二维逆离散余弦变换RGB=imread('drum.jpg');I=rgb2gray(RGB);J=dct2(I); % 对I进行离散余弦变换imshow(log(abs(J))),title('对原图离散后取对数'),colorbar;J(abs(J)<10)=0;K=idct2(J); % 图像的二维逆离散余弦变换figure,imshow(I),title('原灰度图')figure,imshow(K,[0,255]);title('逆离散变换');%% dctmtx 函数用于实现较小输入矩阵的离散余弦变figure;RGB=imread('4.jpg');I=rgb2gray(RGB);subplot(3,2,1),imshow(I),title('原灰度图');I=im2double(I);subplot(3,2,2),imshow(I),title('取双精度后');T=dctmtx(8); % 离散余弦变换subplot(3,2,3),imshow(I),title('离散余弦变换后');B=blkproc(I,[8,8],'P1*x*P2',T,T');subplot(3,2,4),imshow(B),title('blkproc作用I后的B');mask=[ 1 1 1 1 0 0 0 01 1 1 0 0 0 0 01 1 0 0 0 0 0 01 0 0 0 0 0 0 00 0 0 0 0 0 0 00 0 0 0 0 0 0 00 0 0 0 0 0 0 00 0 0 0 0 0 0 0 ];B2=blkproc(B,[8,8],'P1.*x',mask);subplot(3,2,5),imshow(B2),title('blkproc作用B后的B2');I2=blkproc(B2,[8,8],'P1*x*P2',T',T);subplot(3,2,6),imshow(I2),title('blkproc作用B2后的I2');%% edge函数用于提取图像的边缘RGB=imread('4.jpg');I=rgb2gray(RGB);BW=edge(I);imshow(I);figure,imshow(BW);%% radon 函数用来计算指定方向上图像矩阵的投影RGB=imread('4.jpg');I=rgb2gray(RGB);BW=edge(I);theta=0:179;[R,XP]=radon(BW,theta); % 图像矩阵的投影figure,imagesc(theta,XP,R);colormap(hot);xlabel('\theta(degrees)');ylabel('x\prime');title('R_{\theta}(x\prime)');colorbar;%}% ----------------图像增强、分割和编码------------------%{% imhist 函数产生图像的直方图A=imread('4.jpg');B=rgb2gray(A);subplot(2,1,1),imshow(B);subplot(2,1,2),imhist(B);%% histeq 函数用于对图像的直方图均衡化A=imread('4.jpg');B=rgb2gray(A);subplot(2,1,1),imshow(B);subplot(2,1,2),imhist(B);C=histeq(B); % 对图像B进行均衡化figure;subplot(2,1,1),imshow(C);subplot(2,1,2),imhist(C);%% filter2 函数实现均值滤波a=imread('4.jpg');I=rgb2gray(a);subplot(2,2,1),imshow(I);K1=filter2(fspecial('average',3),I)/255; % 3*3的均值滤波K2=filter2(fspecial('average',5),I)/255; % 5*5的均值滤波K3=filter2(fspecial('average',7),I)/255; % 7*7的均值滤波subplot(2,2,2),imshow(K1);subplot(2,2,3),imshow(K2);subplot(2,2,4),imshow(K3);%% wiener2 函数实现Wiener(维纳)滤波a=imread('4.jpg');I=rgb2gray(a);subplot(2,2,1),imshow(I);K1=wiener2(I,[3,3]); % 3*3 wiener滤波K2=wiener2(I,[5,5]); % 5*5 wiener滤波K3=wiener2(I,[7,7]); % 7*7 wiener滤波subplot(2,2,2),imshow(K1);subplot(2,2,3),imshow(K2);subplot(2,2,4),imshow(K3);%% medfilt2 函数实现中值滤波a=imread('4.jpg');I=rgb2gray(a);subplot(2,2,1),imshow(I);K1=medfilt2(I,[3,3]); % 3*3 中值滤波K2=medfilt2(I,[5,5]); % 5*5 中值滤波K3=medfilt2(I,[7,7]); % 7*7 中值滤波subplot(2,2,2),imshow(K1);subplot(2,2,3),imshow(K2);subplot(2,2,4),imshow(K3);%}% ----------------图像模糊及复原------------------%{% deconvwnr 函数:使用维纳滤波器I=imread('qier.jpg');imshow(I);% 对图像进行模糊处理LEN=31;THETA=11;PSF1=fspecial('motion',LEN,THETA); % 运动模糊PSF2=fspecial('gaussian',10,5); % 高斯模糊Blurred1=imfilter(I,PSF1,'circular','conv'); % 得到运动模糊图像Blurred2=imfilter(I,PSF2,'conv'); % 得到高斯噪声模糊图像figure;subplot(1,2,1);imshow(Blurred1);title('Blurred1--"motion"'); subplot(1,2,2);imshow(Blurred2);title('Blurred2--"gaussian"');% 对模糊图像加噪声V=0.002;BlurredNoisy1=imnoise(Blurred1,'gaussian',0,V); % 加高斯噪声BlurredNoisy2=imnoise(Blurred2,'gaussian',0,V); % 加高斯噪声figure;subplot(1,2,1);imshow(BlurredNoisy1);title('BlurredNoisy1'); subplot(1,2,2);imshow(BlurredNoisy2);title('BlurredNoisy2');% 进行维纳滤波wnr1=deconvwnr(Blurred1,PSF1); % 维纳滤波wnr2=deconvwnr(Blurred2,PSF2); % 维纳滤波figure;subplot(1,2,1);imshow(wnr1);title('Restored1,True PSF'); subplot(1,2,2);imshow(wnr2);title('Restored2,True PSF');%% deconvreg函数:使用约束最小二乘滤波器I=imread('qier.jpg');imshow(I);% 对图像进行模糊处理LEN=31;THETA=11;PSF1=fspecial('motion',LEN,THETA); % 运动模糊PSF2=fspecial('gaussian',10,5); % 高斯模糊Blurred1=imfilter(I,PSF1,'circular','conv'); % 得到运动模糊图像Blurred2=imfilter(I,PSF2,'conv'); % 得到高斯噪声模糊图像figure;subplot(1,2,1);imshow(Blurred1);title('Blurred1--"motion"');subplot(1,2,2);imshow(Blurred2);title('Blurred2--"gaussian"');% 对模糊图像加噪声V=0.002;BlurredNoisy1=imnoise(Blurred1,'gaussian',0,V); % 加高斯噪声BlurredNoisy2=imnoise(Blurred2,'gaussian',0,V); % 加高斯噪声figure;subplot(1,2,1);imshow(BlurredNoisy1);title('BlurredNoisy1');subplot(1,2,2);imshow(BlurredNoisy2);title('BlurredNoisy2');NP=V*prod(size(I));reg1=deconvreg(BlurredNoisy1,PSF1,NP); % 约束最小二乘滤波reg2=deconvreg(BlurredNoisy2,PSF2,NP); % 约束最小二乘滤波figure;subplot(1,2,1);imshow(reg1);title('Restored1 with NP');subplot(1,2,2);imshow(reg2);title('Restored2 with NP');%% deconvlucy函数:使用Lucy-Richardson滤波器I=imread('qier.jpg');imshow(I);% 对图像进行模糊处理LEN=31;THETA=11;PSF1=fspecial('motion',LEN,THETA); % 运动模糊PSF2=fspecial('gaussian',10,5); % 高斯模糊Blurred1=imfilter(I,PSF1,'circular','conv'); % 得到运动模糊图像Blurred2=imfilter(I,PSF2,'conv'); % 得到高斯噪声模糊图像figure;subplot(1,2,1);imshow(Blurred1);title('Blurred1--"motion"');subplot(1,2,2);imshow(Blurred2);title('Blurred2--"gaussian"');% 对模糊图像加噪声V=0.002;BlurredNoisy1=imnoise(Blurred1,'gaussian',0,V); % 加高斯噪声BlurredNoisy2=imnoise(Blurred2,'gaussian',0,V); % 加高斯噪声figure;subplot(1,2,1);imshow(BlurredNoisy1);title('BlurredNoisy1');subplot(1,2,2);imshow(BlurredNoisy2);title('BlurredNoisy2');luc1=deconvlucy(BlurredNoisy1,PSF1,5); % 使用Lucy-Richardson滤波luc2=deconvlucy(BlurredNoisy1,PSF1,15); % 使用Lucy-Richardson滤波figure;subplot(1,2,1);imshow(luc1);title('Restored Image,NUMIT=5'); subplot(1,2,2);imshow(luc2);title('Restored Image,NUMIT=15');%}% deconvblind 函数:使用盲卷积算法a=imread('4.jpg');I=rgb2gray(a);figure;imshow(I);title('Original Image');PSF=fspecial('motion',13,45); % 运动模糊figure;imshow(PSF);Blurred=imfilter(I,PSF,'circ','conv'); % 得到运动模糊图像figure;imshow(Blurred);title('Blurred Image');INITPSF=ones(size(PSF));[J,P]=deconvblind(Blurred,INITPSF,30); % 使用盲卷积figure;imshow(J);figure;imshow(P,[],'notruesize');% *-*--*-*-*-*-*-*-*-*-*-*-*图像处理*-*-*-*-*-*-*-*-*-*-*-* %{% 对图像进行减采样a=imread('lena.jpg');%subplot(1,4,1);figure;imshow(a);title('原图');b=rgb2gray(a);%subplot(1,4,2);figure;imshow(b);title('原图的灰度图');[wid,hei]=size(b);%---4倍减采样----quartimg=zeros(wid/2+1,hei/2+1);i1=1;j1=1;for i=1:2:widfor j=1:2:heiquartimg(i1,j1)=b(i,j);j1=j1+1;endi1=i1+1;j1=1;end%subplot(1,4,3);figure;imshow(uint8(quartimg));title('4倍减采样')% ---16倍减采样---quanrtimg=zeros(wid/4+1,hei/4+1);i1=1;j1=1;for i=1:4:widfor j=1:4:heiquanrtimg(i1,j1)=b(i,j);j1=j1+1;endi1=i1+1;j1=1;end%subplot(1,4,4);.figure;imshow(uint8(quanrtimg));title('16倍减采样');%}% 图像类型% 将图像转换为256级灰度图像,64级灰度图像,32级灰度图像,8级灰度图像,2级灰度图像a=imread('4.jpg');%figure;subplot(2,3,1);imshow(a);title('原图');b=rgb2gray(a); % 这是256灰度级的图像%figure;subplot(2,3,2);imshow(b);title('原图的灰度图像');[wid,hei]=size(b);img64=zeros(wid,hei);img32=zeros(wid,hei);img8=zeros(wid,hei);img2=zeros(wid,hei);for i=1:widfor j=j:heiimg64(i,j)=floor(b(i,j)/4); % 转化为64灰度级endend%figure;subplot(2,3,3);imshow(uint8(img64),[0,63]);title('64级灰度图像');for i=1:widfor j=1:heiimg32(i,j)=floor(b(i,j)/8);% 转化为32灰度级endend%figure;subplot(2,3,4);imshow(uint8(img32),[0,31]);title('32级灰度图像');for i=1:widfor j=1:heiimg8(i,j)=floor(b(i,j)/32);% 转化为8灰度级endend%figure;subplot(2,3,5);imshow(uint8(img8),[0,7]);title('8级灰度图像');for i=1:widfor j=1:heiimg2(i,j)=floor(b(i,j)/128);% 转化为2灰度级endend%figure;subplot(2,3,6);imshow(uint8(img2),[0,1]);title('2级灰度图像');% *-*--*-*-*-*-*-*-*-*-*-*-*图像处理*-*-*-*-*-*-*-*-*-*-*-* %{% ------------------ 图像的点运算------------------I=imread('lena.jpg');figure;subplot(1,3,1);imshow(I);title('原图的灰度图');J=imadjust(I,[0.3;0.6],[0.1;0.9]); % 设置灰度变换的范围subplot(1,3,2);imshow(J);title('线性扩展');I1=double(I); % 将图像转换为double类型I2=I1/255; % 归一化此图像C=2; % 非线性扩展函数的参数K=C*log(1+I2); % 对图像的对数变换subplot(1,3,3);imshow(K);title('非线性扩展');M=255-I;figure;subplot(1,3,1);imshow(M);title('灰度倒置');N1=im2bw(I,0.4); % 将此图像二值化,阈值为0.4N2=im2bw(I,0.7); % 将此图像二值化,阈值为0.7 subplot(1,3,2);imshow(N1);title('二值化阈值0.4');subplot(1,3,3);imshow(N2);title('二值化阈值0.7');%}%{% ------------------ 图像的代数运算------------------% 将两幅图像进行加法运算I=imread('lena.jpg');I=rgb2gray(I);J=imread('rice.png');% 以下把两幅图转化为大小一样for i=1:size(I)for j=size(J):size(I)J(i,j)=0;endendI=im2double(I); % 将图像转化为double型J=im2double(J);% imshow(I);figure;imshow(J);K=I+0.3*J; % 将两幅图像相加subplot(1,3,1);imshow(I);title('人物图');subplot(1,3,2);imshow(J);title('背景图');subplot(1,3,3);imshow(K);title('相加后的图');imwrite(K,'i_lena1.jpg');%%% 将两幅图像做减运算,分离背景与原图A=imread('i_lena1.jpg');B=imread('rice.png');% 以下把两幅图转化为大小一样for i=1:size(A)for j=size(B):size(A)B(i,j)=0;endendC=A-0.3*B;a=imread('lena.jpg');subplot(2,2,1);imshow(a);title('原图图');subplot(2,2,2);imshow(A);title('混合图');subplot(2,2,3);imshow(B);title('背景图');subplot(2,2,4);imshow(C);title('分离后的图');%% 设置掩模,需要保留下来的区域,掩模图像的值为1,否则为0 A=imread('drum.jpg');A=rgb2gray(A);A=im2double(A);sizeA=size(A);subplot(1,2,1);imshow(A);title('原图');B=zeros(sizeA(1),sizeA(2)); % 设置模板B(100:400,100:500)=1;K=A.*B; % 两幅图像相乘subplot(1,2,2);imshow(K);title('局部图');%}%{% ------------------ 图像的缩放------------------A=imread('drum.jpg');B1=imresize(A,1.5); % 比例放大1.5杯,默认采用的是最近邻法进行线性插值B2=imresize(A,[420 384]); % 非比例放大到420:384C1=imresize(A,0.7); % 比例缩小0.7倍C2=imresize(A,[150 180]); % 非比例缩小到150:180figure;imshow(B1);title('比例放大图');figure;imshow(B2);title('非比例放大图');figure;imshow(C1);title('比例缩小图');figure;imshow(C2);title('非比例缩小图');% 检测非比例缩放得到的图片是否能还原到原图a=size(A)d=imresize(C2,[a(1),a(2)]);figure;imshow(d);%}% ------------------ 图像的旋转------------------I=imread('drum.jpg');J=imrotate(I,45); % 图像进行逆时针旋转,默认采用最近邻插值法进行插值处理K=imrotate(I,90); % 默认旋转出界的部分不被截出subplot(1,3,1);imshow(I);subplot(1,3,2);imshow(J);subplot(1,3,3);imshow(K);% 检测旋转后的图像是否失真P=imrotate(K,270);figure;imshow(P);。
matlab 开源代码
MATLAB 是一款由 MathWorks 公司出品的商业软件,它并不直接提供开源代码。
然而,MATLAB 的部分组件,如MATLAB 工具箱(Toolboxes),是开源的,可以供用户进行二次开发和使用。
如果你想要查找 MATLAB 的开源替代品,以下是一些可能的选项:
1.GNU Octave:GNU Octave 是MATLAB 的一个开源替代品,它几乎完
全兼容 MATLAB 的语法。
虽然它的开发速度可能没有 MATLAB 快,但它是一个完全免费的选择。
2.Python:Python 是一种广泛使用的编程语言,具有强大的科学计算和数
据处理能力。
通过使用 NumPy、SciPy 和 Matplotlib 等库,Python 可以实现与 MATLAB 类似的功能。
3.Julia:Julia 是一种为科学计算设计的编程语言,它的性能可以与C++ 和
Python 相媲美。
Julia 的一个主要优点是它的语法非常简洁,可以快速编写高效的代码。
4.R:R 是一种用于统计计算和图形制作的编程语言。
虽然 R 不像 Python 和
Julia 那样广泛用于机器学习,但它在数据分析领域仍然非常流行。
以上只是一些可能的选项。
选择哪种工具取决于你的具体需求和偏好。
Matlab源程序代码

Matlab源程序代码正弦波的源程序:(一),用到的函数1,f2t函数function x=f2t(X)global dt df t f T N%x=f2t(X)%x为时域的取样值矢量%X为x的傅氏变换%X与x长度相同并为2的整幂%本函数需要一个全局变量dt(时域取样间隔) X=[X(N/2+1:N),X(1:N/2)];x=ifft(X)/dt;end2,t2f函数。
function X=t2f(x)global dt df N t f T%X=t2f(x)%x为时域的取样值矢量%X为x的傅氏变换%X与x长度相同,并为2的整幂。
%本函数需要一个全局变量dt(时域取样间隔) H=fft(x);X=[H(N/2+1:N),H(1:N/2)]*dt;end(二),主程序。
1,%(1)绘出正弦信号波形及频谱global dt df t f Nclose allk=input('取样点数=2^k, k取10左右');if isempty(k), k=10; endf0=input('f0=取1(kz)左右');if isempty(f0), f0=1; endN=2^k;dt=0.01; %msdf=1/(N*dt); %KHzT=N*dt; %截短时间Bs=N*df/2; %系统带宽f=[-Bs+df/2:df:Bs]; %频域横坐标t=[-T/2+dt/2:dt:T/2]; %时域横坐标s=sin(2*pi*f0*t); %输入的正弦信号S=t2f(s); %S是s的傅氏变换a=f2t(S); %a是S的傅氏反变换a=real(a);as=abs(S);subplot(2,1,1) %输出的频谱plot(f,as,'b');gridaxis([-2*f0,+2*f0,min(as),max(as)]) xlabel('f (KHz)') ylabel('|S(f)| (V/KHz)') %figure(2) subplot(2,1,2) plot(t,a,'black') %输出信号波形画图gridaxis([-2/f0,+2/f0,-1.5,1.5])xlabel('t(ms)')ylabel('a(t)(V)')gtext('频谱图')最佳基带系统的源程序:(一),用到的函数f2t函数和t2f函数。
matlab经典代码大全
哈哈哈MATLAB显示正炫余炫图:plot(x,y1,'* r’,x,y2,'o b’)定义【0,2π】;t=0:pi/10:2*pi;定义函数文件:function [返回变量列表]=函数名(输入变量列表)顺序结构:选择结构1)if-else-end语句其格式为:if 逻辑表达式程序模块1;else程序模块2;End图片读取:%选择图片路径[filename, pathname]= .。
uigetfile({’*.jpg’;’*.bmp’;'*。
gif'},’选择图片’);%合成路径+文件名str=[pathname,filename];%为什么pathname和filename要前面出现的位置相反才能运行呢???%读取图片im=imread(str);%使用图片axes(handles。
axes1);%显示图片imshow(im);边缘检测:global imstr=get(hObject,'string’);axes (handles。
axes1);switch strcase ' 原图’imshow(im);case ’sobel’BW = edge(rgb2gray(im),’sobel’);imshow(BW);case 'prewitt’BW = edge(rgb2gray(im),'prewitt’);imshow(BW);case 'canny'BW = edge(rgb2gray(im),’canny’);imshow(BW);Canny算子边缘定位精确性和抗噪声能力效果较好,是一个折中方案end;开闭运算:se=[1,1,1;1,1,1;1,1,1;1,1,1];%Structuring ElementI=rgb2gray(im);imshow(I,[]);title('Original Image');I=double(I);[im_height,im_width]=size(I);[se_height,se_width]=size(se);halfheight=floor(se_height/2);halfwidth=floor(se_width/2);[se_origin]=floor((size(se)+1)/2);image_dilation=padarray(I,se_origin,0,'both’); %Image to be used for dilationimage_erosion=padarray(I,se_origin,256,’both'); %Image to be used for erosion %%%%%%%%%%%%%%%%%%%%%Dilation %%%%%%%%%%%%%%%%%%%%%for k=se_origin(1)+1:im_height+se_origin(1)for kk=se_origin(2)+1:im_width+se_origin(2)dilated_image(k—se_origin(1),kk—se_origin(2))=max (max(se+image_dilation(k-se_origin(1):k+halfheight-1,kk—se_origin(2):kk+halfwidth-1)));endendfigure;imshow(dilated_image,[]);title('Image after Dilation’); %%%%%%%%%%%%%%%%%%%%Erosion %%%%%%%%%%%%%%%%%%%%se=se’;for k=se_origin(2)+1:im_height+se_origin(2)for kk=se_origin(1)+1:im_width+se_origin(1)eroded_image(k-se_origin(2),kk—se_origin(1))=min(min (image_erosion(k-se_origin(2):k+halfwidth—1,kk-se_origin(1):kk+halfheight-1)-se));endendfigure;imshow(eroded_image,[]);title(’Image after Erosion'); %%%%%%%%%%%%%%%%%%%%%%%%%%%%%%%%%%%%%%%%%%%%%%%%%%Opening(Erosion first,then Dilation)%%%%%%%%%%%%%%%%%%%%%%%%%%%%%%%%%%%%%%%%%%%%%%%%%%se=se';image_dilation2=eroded_image;%Image to be used for dilationfor k=se_origin(1)+1:im_height—se_origin(1)for kk=se_origin(2)+1:im_width-se_origin(2)opening_image(k-se_origin(1),kk-se_origin(2))=max(max(se+image_dilation2(k-se_origin(1):k+halfheight—1,kk—se_origin(2):kk+halfwidth-1)));endendfigure;imshow(opening_image,[]);title(’Opening Image’);%%%%%%%%%%%%%%%%%%%%%%%%%%%%%%%%%%%%%%%%%%%%%%%%%% Closing(Dilation first,then Erosion) %%%%%%%%%%%%%%%%%%%%%%%%%%%%%%%%%%%%%%%%%%%%%%%%%%se=se';image_erosion2=dilated_image;%Image to be used for erosionfor k=se_origin(2)+1:im_height—se_origin(2)for kk=se_origin(1)+1:im_width-se_origin(1)closing_image(k-se_origin(2),kk—se_origin(1))=min(min(image_erosion2(k-se_origin(2):k+halfwidth-1,kk-se_origin(1):kk+halfheight—1)-se));endendfigure;imshow(closing_image,[]);title(’Closing Image');Warning: Image is too big to fit on screen; displaying at 31% scale.> In truesize>Resize1 at 308In truesize at 44In imshow at 161图像的直方图归一化:I=imread(‘red.bmp’);%读入图像figure;%打开新窗口[M,N]=size(I);%计算图像大小[counts,x]=imhist(I,32);%计算有32个小区间的灰度直方图counts=counts/M/N;%计算归一化灰度直方图各区间的值stem(x,counts);%绘制归一化直方图图像平移:I=imread('shuichi。
数字图像处理代码大全

1.图像反转MATLAB程序实现如下:I=imread('xian.bmp');J=double(I);J=-J+(256-1); %图像反转线性变换H=uint8(J);subplot(1,2,1),imshow(I);subplot(1,2,2),imshow(H);2.灰度线性变换MATLAB程序实现如下:I=imread('xian.bmp');subplot(2,2,1),imshow(I);title('原始图像');axis([50,250,50,200]);axis on; %显示坐标系I1=rgb2gray(I);subplot(2,2,2),imshow(I1);title('灰度图像');axis([50,250,50,200]);axis on; %显示坐标系J=imadjust(I1,[0.1 0.5],[]); %局部拉伸,把[0.1 0.5]内的灰度拉伸为[0 1]subplot(2,2,3),imshow(J);title('线性变换图像[0.1 0.5]');axis([50,250,50,200]);grid on; %显示网格线axis on; %显示坐标系K=imadjust(I1,[0.3 0.7],[]); %局部拉伸,把[0.3 0.7]内的灰度拉伸为[0 1]subplot(2,2,4),imshow(K);title('线性变换图像[0.3 0.7]');axis([50,250,50,200]);grid on; %显示网格线axis on; %显示坐标系3.非线性变换MATLAB程序实现如下:I=imread('xian.bmp');I1=rgb2gray(I);subplot(1,2,1),imshow(I1);title('灰度图像');axis([50,250,50,200]);grid on; %显示网格线axis on; %显示坐标系J=double(I1);J=40*(log(J+1));H=uint8(J);subplot(1,2,2),imshow(H);title('对数变换图像');axis([50,250,50,200]);grid on; %显示网格线axis on; %显示坐标系4.直方图均衡化MATLAB程序实现如下:I=imread('xian.bmp');I=rgb2gray(I);figure;subplot(2,2,1);imshow(I);subplot(2,2,2);imhist(I);I1=histeq(I);figure;subplot(2,2,1);imshow(I1);subplot(2,2,2);imhist(I1);5.线性平滑滤波器用MATLAB实现领域平均法抑制噪声程序:I=imread('xian.bmp');subplot(231)imshow(I)title('原始图像')I=rgb2gray(I);I1=imnoise(I,'salt & pepper',0.02);subplot(232)imshow(I1)title('添加椒盐噪声的图像')k1=filter2(fspecial('average',3),I1)/255; %进行3*3模板平滑滤波k2=filter2(fspecial('average',5),I1)/255; %进行5*5模板平滑滤波k3=filter2(fspecial('average',7),I1)/255; %进行7*7模板平滑滤波k4=filter2(fspecial('average',9),I1)/255; %进行9*9模板平滑滤波subplot(233),imshow(k1);title('3*3模板平滑滤波');subplot(234),imshow(k2);title('5*5模板平滑滤波');subplot(235),imshow(k3);title('7*7模板平滑滤波');subplot(236),imshow(k4);title('9*9模板平滑滤波'); 6.中值滤波器用MATLAB实现中值滤波程序如下:I=imread('xian.bmp');I=rgb2gray(I);J=imnoise(I,'salt&pepper',0.02);subplot(231),imshow(I);title('原图像');subplot(232),imshow(J);title('添加椒盐噪声图像');k1=medfilt2(J); %进行3*3模板中值滤波k2=medfilt2(J,[5,5]); %进行5*5模板中值滤波k3=medfilt2(J,[7,7]); %进行7*7模板中值滤波k4=medfilt2(J,[9,9]); %进行9*9模板中值滤波subplot(233),imshow(k1);title('3*3模板中值滤波'); subplot(234),imshow(k2);title('5*5模板中值滤波'); subplot(235),imshow(k3);title('7*7模板中值滤波'); subplot(236),imshow(k4);title('9*9模板中值滤波'); 7.用Sobel算子和拉普拉斯对图像锐化:I=imread('xian.bmp');subplot(2,2,1),imshow(I);title('原始图像');axis([50,250,50,200]);grid on; %显示网格线axis on; %显示坐标系I1=im2bw(I);subplot(2,2,2),imshow(I1);title('二值图像');axis([50,250,50,200]);grid on; %显示网格线axis on; %显示坐标系H=fspecial('sobel'); %选择sobel算子J=filter2(H,I1); %卷积运算subplot(2,2,3),imshow(J);title('sobel算子锐化图像');axis([50,250,50,200]);grid on; %显示网格线axis on; %显示坐标系h=[0 1 0,1 -4 1,0 1 0]; %拉普拉斯算子J1=conv2(I1,h,'same'); %卷积运算subplot(2,2,4),imshow(J1);title('拉普拉斯算子锐化图像');axis([50,250,50,200]);grid on; %显示网格线axis on; %显示坐标系8.梯度算子检测边缘用MATLAB实现如下:I=imread('xian.bmp');subplot(2,3,1);imshow(I);title('原始图像');axis([50,250,50,200]);grid on; %显示网格线axis on; %显示坐标系I1=im2bw(I);subplot(2,3,2);imshow(I1);title('二值图像');axis([50,250,50,200]);grid on; %显示网格线axis on; %显示坐标系I2=edge(I1,'roberts');figure;subplot(2,3,3);imshow(I2);title('roberts算子分割结果');axis([50,250,50,200]);grid on; %显示网格线axis on; %显示坐标系I3=edge(I1,'sobel');subplot(2,3,4);imshow(I3);title('sobel算子分割结果');axis([50,250,50,200]);grid on; %显示网格线axis on; %显示坐标系I4=edge(I1,'Prewitt');subplot(2,3,5);imshow(I4);title('Prewitt算子分割结果');axis([50,250,50,200]);grid on; %显示网格线axis on; %显示坐标系9.LOG算子检测边缘用MATLAB程序实现如下:I=imread('xian.bmp');subplot(2,2,1);imshow(I);title('原始图像');I1=rgb2gray(I);subplot(2,2,2);imshow(I1);title('灰度图像');I2=edge(I1,'log');subplot(2,2,3);imshow(I2);title('log算子分割结果'); 10.Canny算子检测边缘用MATLAB程序实现如下:I=imread('xian.bmp'); subplot(2,2,1);imshow(I);title('原始图像')I1=rgb2gray(I);subplot(2,2,2);imshow(I1);title('灰度图像');I2=edge(I1,'canny'); subplot(2,2,3);imshow(I2);title('canny算子分割结果');11.边界跟踪(bwtraceboundary函数)clcclear allI=imread('xian.bmp');figureimshow(I);title('原始图像');I1=rgb2gray(I); %将彩色图像转化灰度图像threshold=graythresh(I1); %计算将灰度图像转化为二值图像所需的门限BW=im2bw(I1, threshold); %将灰度图像转化为二值图像figureimshow(BW);title('二值图像');dim=size(BW);col=round(dim(2)/2)-90; %计算起始点列坐标row=find(BW(:,col),1); %计算起始点行坐标connectivity=8;num_points=180;contour=bwtraceboundary(BW,[row,col],'N',connectivity,num_p oints);%提取边界figureimshow(I1);hold on;plot(contour(:,2),contour(:,1), 'g','LineWidth' ,2); title('边界跟踪图像');12.Hough变换I= imread('xian.bmp');rotI=rgb2gray(I);subplot(2,2,1);imshow(rotI);title('灰度图像');axis([50,250,50,200]);grid on;axis on;BW=edge(rotI,'prewitt');subplot(2,2,2);imshow(BW);title('prewitt算子边缘检测后图像');axis([50,250,50,200]);grid on;axis on;[H,T,R]=hough(BW);subplot(2,2,3);imshow(H,[],'XData',T,'YData',R,'InitialMagnification','fit'); title('霍夫变换图');xlabel('\theta'),ylabel('\rho');axis on , axis normal, hold on;P=houghpeaks(H,5,'threshold',ceil(0.3*max(H(:))));x=T(P(:,2));y=R(P(:,1));plot(x,y,'s','color','white');lines=houghlines(BW,T,R,P,'FillGap',5,'MinLength',7); subplot(2,2,4);,imshow(rotI);title('霍夫变换图像检测');axis([50,250,50,200]);grid on;axis on;hold on;max_len=0;for k=1:length(lines)xy=[lines(k).point1;lines(k).point2];plot(xy(:,1),xy(:,2),'LineWidth',2,'Color','green');plot(xy(1,1),xy(1,2),'x','LineWidth',2,'Color','yellow');plot(xy(2,1),xy(2,2),'x','LineWidth',2,'Color','red');len=norm(lines(k).point1-lines(k).point2);if(len>max_len)max_len=len;xy_long=xy;endendplot(xy_long(:,1),xy_long(:,2),'LineWidth',2,'Color','cyan'); 13.直方图阈值法用MATLAB实现直方图阈值法:I=imread('xian.bmp');I1=rgb2gray(I);figure;subplot(2,2,1);imshow(I1);title('灰度图像')axis([50,250,50,200]);grid on; %显示网格线axis on; %显示坐标系[m,n]=size(I1); %测量图像尺寸参数GP=zeros(1,256); %预创建存放灰度出现概率的向量for k=0:255GP(k+1)=length(find(I1==k))/(m*n); %计算每级灰度出现的概率,将其存入GP中相应位置endsubplot(2,2,2),bar(0:255,GP,'g') %绘制直方图title('灰度直方图')xlabel('灰度值')ylabel('出现概率')I2=im2bw(I,150/255);subplot(2,2,3),imshow(I2);title('阈值150的分割图像')axis([50,250,50,200]);grid on; %显示网格线axis on; %显示坐标系I3=im2bw(I,200/255); %subplot(2,2,4),imshow(I3);title('阈值200的分割图像')axis([50,250,50,200]);grid on; %显示网格线axis on; %显示坐标系14. 自动阈值法:Otsu法用MATLAB实现Otsu算法:clcclear allI=imread('xian.bmp');subplot(1,2,1),imshow(I);title('原始图像')axis([50,250,50,200]);grid on; %显示网格线axis on; %显示坐标系level=graythresh(I); %确定灰度阈值BW=im2bw(I,level);subplot(1,2,2),imshow(BW);title('Otsu法阈值分割图像')axis([50,250,50,200]);grid on; %显示网格线axis on; %显示坐标系15.膨胀操作I=imread('xian.bmp'); %载入图像I1=rgb2gray(I);subplot(1,2,1);imshow(I1);title('灰度图像')axis([50,250,50,200]);grid on; %显示网格线axis on; %显示坐标系se=strel('disk',1); %生成圆形结构元素I2=imdilate(I1,se); %用生成的结构元素对图像进行膨胀subplot(1,2,2);imshow(I2);title('膨胀后图像');axis([50,250,50,200]);grid on; %显示网格线axis on; %显示坐标系16.腐蚀操作MATLAB实现腐蚀操作I=imread('xian.bmp'); %载入图像I1=rgb2gray(I);subplot(1,2,1);imshow(I1);title('灰度图像')axis([50,250,50,200]);grid on; %显示网格线axis on; %显示坐标系se=strel('disk',1); %生成圆形结构元素I2=imerode(I1,se); %用生成的结构元素对图像进行腐蚀subplot(1,2,2);imshow(I2);title('腐蚀后图像');axis([50,250,50,200]);grid on; %显示网格线axis on; %显示坐标系17.开启和闭合操作用MATLAB实现开启和闭合操作I=imread('xian.bmp'); %载入图像subplot(2,2,1),imshow(I);title('原始图像');axis([50,250,50,200]);axis on; %显示坐标系I1=rgb2gray(I);subplot(2,2,2),imshow(I1);title('灰度图像');axis([50,250,50,200]);axis on; %显示坐标系se=strel('disk',1); %采用半径为1的圆作为结构元素I3=imclose(I1,se); %闭合操作subplot(2,2,3),imshow(I2);title('开启运算后图像');axis([50,250,50,200]);axis on; %显示坐标系subplot(2,2,4),imshow(I3);title('闭合运算后图像');axis([50,250,50,200]);axis on; %显示坐标系18.开启和闭合组合操作I=imread('xian.bmp'); %载入图像subplot(3,2,1),imshow(I);title('原始图像');axis([50,250,50,200]);axis on; %显示坐标系I1=rgb2gray(I);subplot(3,2,2),imshow(I1);title('灰度图像');axis([50,250,50,200]);axis on; %显示坐标系se=strel('disk',1);I3=imclose(I1,se); %闭合操作subplot(3,2,3),imshow(I2);title('开启运算后图像');axis([50,250,50,200]);axis on; %显示坐标系subplot(3,2,4),imshow(I3);title('闭合运算后图像');axis([50,250,50,200]);axis on; %显示坐标系se=strel('disk',1);I4=imopen(I1,se);I5=imclose(I4,se);subplot(3,2,5),imshow(I5); %开—闭运算图像title('开—闭运算图像');axis([50,250,50,200]);axis on; %显示坐标系I6=imclose(I1,se);I7=imopen(I6,se);subplot(3,2,6),imshow(I7); %闭—开运算图像title('闭—开运算图像');axis([50,250,50,200]);axis on; %显示坐标系19.形态学边界提取利用MATLAB实现如下:I=imread('xian.bmp'); %载入图像subplot(1,3,1),imshow(I);title('原始图像');axis([50,250,50,200]);grid on; %显示网格线axis on; %显示坐标系I1=im2bw(I);subplot(1,3,2),imshow(I1);title('二值化图像');axis([50,250,50,200]);grid on; %显示网格线axis on; %显示坐标系I2=bwperim(I1); %获取区域的周长subplot(1,3,3),imshow(I2);title('边界周长的二值图像');axis([50,250,50,200]);grid on;axis on;20.形态学骨架提取利用MATLAB实现如下:I=imread('xian.bmp'); subplot(2,2,1),imshow(I); title('原始图像');axis([50,250,50,200]); axis on;I1=im2bw(I);subplot(2,2,2),imshow(I1); title('二值图像');axis([50,250,50,200]); axis on;I2=bwmorph(I1,'skel',1); subplot(2,2,3),imshow(I2); title('1次骨架提取');axis([50,250,50,200]); axis on;I3=bwmorph(I1,'skel',2); subplot(2,2,4),imshow(I3); title('2次骨架提取');axis([50,250,50,200]); axis on;21.直接提取四个顶点坐标I = imread('xian.bmp');I = I(:,:,1);BW=im2bw(I);figureimshow(~BW)[x,y]=getpts。
matlab图像处理函数大全
matlab图像处理函数大全Matlab是一种强大的科学计算软件,广泛应用于各个领域,包括图像处理。
在Matlab中,有许多内置的图像处理函数,可以帮助我们实现各种图像处理任务。
本文将介绍一些常用的Matlab图像处理函数,帮助您更好地理解和运用这些函数。
1. imread函数imread函数用于读取图像文件,并将其存储为Matlab的图像矩阵。
它可以读取多种图像格式,如JPEG、PNG、BMP等。
例如,可以使用以下代码读取名为"image.jpg"的图像文件:```matlabimage = imread('image.jpg');```2. imshow函数imshow函数用于显示图像。
它可以接受一个图像矩阵作为输入,并将其显示在Matlab的图像窗口中。
例如,可以使用以下代码显示之前读取的图像:```matlabimshow(image);```3. imresize函数imresize函数用于调整图像的大小。
它可以接受一个图像矩阵和目标大小作为输入,并返回调整大小后的图像矩阵。
例如,可以使用以下代码将图像调整为200x200的大小:```matlabresized_image = imresize(image, [200, 200]);```4. rgb2gray函数rgb2gray函数用于将彩色图像转换为灰度图像。
它可以接受一个彩色图像矩阵作为输入,并返回一个灰度图像矩阵。
例如,可以使用以下代码将彩色图像转换为灰度图像:```matlabgray_image = rgb2gray(image);```5. imadjust函数imadjust函数用于调整图像的对比度和亮度。
它可以接受一个灰度图像矩阵和目标对比度和亮度范围作为输入,并返回调整后的图像矩阵。
例如,可以使用以下代码增加图像的对比度和亮度:```matlabadjusted_image = imadjust(gray_image, [0.2, 0.8], [0, 1]);```6. imfilter函数imfilter函数用于对图像进行滤波操作。
Matlab绘图代码以及代码说明文档
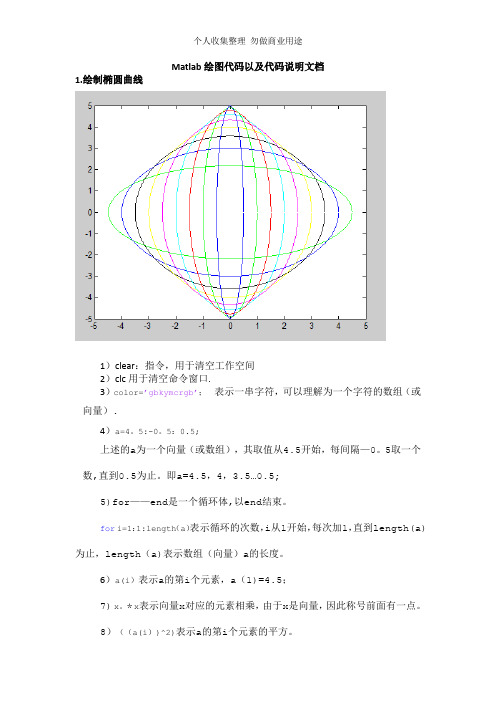
Matlab绘图代码以及代码说明文档1.绘制椭圆曲线1)clear:指令,用于清空工作空间2)clc用于清空命令窗口.3)color=’gbkymcrgb’;表示一串字符,可以理解为一个字符的数组(或向量).4)a=4。
5:-0。
5:0.5;上述的a为一个向量(或数组),其取值从4.5开始,每间隔—0。
5取一个数,直到0.5为止。
即a=4.5,4,3.5…0.5;5)for——end是一个循环体,以end结束。
for i=1:1:length(a)表示循环的次数,i从1开始,每次加1,直到length(a)为止,length(a)表示数组(向量)a的长度。
6)a(i)表示a的第i个元素,a(1)=4.5;7)x。
*x表示向量x对应的元素相乘,由于x是向量,因此称号前面有一点。
8)((a(i))^2)表示a的第i个元素的平方。
9)sqrt(a),是一个函数,对a进行开方.10)color(i)是字符数组color的第i个元素,数组前面有定义。
11)hold on是图像保持,就是绘制下一个椭圆时,上一个已经绘制的仍在图形界面上,不会消失。
2.多图形绘制1)sin(t)表示对t求它的正弦,是一个正弦函数.2)subplot(2,2,1),是一个函数,第一个参数2表示将绘图的窗口分割成两行显示;第二个参数2表示将绘图的界面分为两列显示,因此为两行两列4块显示。
第三个参数1表示在第1块(从左向右,从上向下)绘制图像。
3)plot(t1,y1,'.r’)其中,"。
”表示图像的形状为“点”,r为颜色。
4)axis([0,3。
1427,—1,1])表示固定坐标轴,只显示x轴的0到3.1427的区间;y轴的—1到1的区间.5)plot(t1,y1,'b'),由于b前面没有一点,因此是坐标点之间的连线。
6)title(’子图(3)’)表示该图的标题为“子图(3)”,是一个函数,参量为字符串。
(完整版)数字图像处理代码大全

1.图像反转MATLAB程序实现如下:I=imread('xian.bmp');J=double(I);J=-J+(256-1); %图像反转线性变换H=uint8(J);subplot(1,2,1),imshow(I);subplot(1,2,2),imshow(H);2.灰度线性变换MATLAB程序实现如下:I=imread('xian.bmp');subplot(2,2,1),imshow(I);title('原始图像');axis([50,250,50,200]);axis on; %显示坐标系I1=rgb2gray(I);subplot(2,2,2),imshow(I1);title('灰度图像');axis([50,250,50,200]);axis on; %显示坐标系J=imadjust(I1,[0.1 0.5],[]); %局部拉伸,把[0.1 0.5]内的灰度拉伸为[0 1]subplot(2,2,3),imshow(J);title('线性变换图像[0.1 0.5]');axis([50,250,50,200]);grid on; %显示网格线axis on; %显示坐标系K=imadjust(I1,[0.3 0.7],[]); %局部拉伸,把[0.3 0.7]内的灰度拉伸为[0 1]subplot(2,2,4),imshow(K);title('线性变换图像[0.3 0.7]');axis([50,250,50,200]);grid on; %显示网格线axis on; %显示坐标系3.非线性变换MATLAB程序实现如下:I=imread('xian.bmp');I1=rgb2gray(I);subplot(1,2,1),imshow(I1);title('灰度图像');axis([50,250,50,200]);grid on; %显示网格线axis on; %显示坐标系J=double(I1);J=40*(log(J+1));H=uint8(J);subplot(1,2,2),imshow(H);title('对数变换图像');axis([50,250,50,200]);grid on; %显示网格线axis on; %显示坐标系4.直方图均衡化MATLAB程序实现如下:I=imread('xian.bmp');I=rgb2gray(I);figure;subplot(2,2,1);imshow(I);subplot(2,2,2);imhist(I);I1=histeq(I);figure;subplot(2,2,1);imshow(I1);subplot(2,2,2);imhist(I1);5.线性平滑滤波器用MATLAB实现领域平均法抑制噪声程序:I=imread('xian.bmp');subplot(231)imshow(I)title('原始图像')I=rgb2gray(I);I1=imnoise(I,'salt & pepper',0.02);subplot(232)imshow(I1)title('添加椒盐噪声的图像')k1=filter2(fspecial('average',3),I1)/255; %进行3*3模板平滑滤波k2=filter2(fspecial('average',5),I1)/255; %进行5*5模板平滑滤波k3=filter2(fspecial('average',7),I1)/255; %进行7*7模板平滑滤波k4=filter2(fspecial('average',9),I1)/255; %进行9*9模板平滑滤波subplot(233),imshow(k1);title('3*3模板平滑滤波');subplot(234),imshow(k2);title('5*5模板平滑滤波');subplot(235),imshow(k3);title('7*7模板平滑滤波');subplot(236),imshow(k4);title('9*9模板平滑滤波'); 6.中值滤波器用MATLAB实现中值滤波程序如下:I=imread('xian.bmp');I=rgb2gray(I);J=imnoise(I,'salt&pepper',0.02);subplot(231),imshow(I);title('原图像');subplot(232),imshow(J);title('添加椒盐噪声图像');k1=medfilt2(J); %进行3*3模板中值滤波k2=medfilt2(J,[5,5]); %进行5*5模板中值滤波k3=medfilt2(J,[7,7]); %进行7*7模板中值滤波k4=medfilt2(J,[9,9]); %进行9*9模板中值滤波subplot(233),imshow(k1);title('3*3模板中值滤波'); subplot(234),imshow(k2);title('5*5模板中值滤波'); subplot(235),imshow(k3);title('7*7模板中值滤波'); subplot(236),imshow(k4);title('9*9模板中值滤波'); 7.用Sobel算子和拉普拉斯对图像锐化:I=imread('xian.bmp');subplot(2,2,1),imshow(I);title('原始图像');axis([50,250,50,200]);grid on; %显示网格线axis on; %显示坐标系I1=im2bw(I);subplot(2,2,2),imshow(I1);title('二值图像');axis([50,250,50,200]);grid on; %显示网格线axis on; %显示坐标系H=fspecial('sobel'); %选择sobel算子J=filter2(H,I1); %卷积运算subplot(2,2,3),imshow(J);title('sobel算子锐化图像');axis([50,250,50,200]);grid on; %显示网格线axis on; %显示坐标系h=[0 1 0,1 -4 1,0 1 0]; %拉普拉斯算子J1=conv2(I1,h,'same'); %卷积运算subplot(2,2,4),imshow(J1);title('拉普拉斯算子锐化图像');axis([50,250,50,200]);grid on; %显示网格线axis on; %显示坐标系8.梯度算子检测边缘用MATLAB实现如下:I=imread('xian.bmp');subplot(2,3,1);imshow(I);title('原始图像');axis([50,250,50,200]);grid on; %显示网格线axis on; %显示坐标系I1=im2bw(I);subplot(2,3,2);imshow(I1);title('二值图像');axis([50,250,50,200]);grid on; %显示网格线axis on; %显示坐标系I2=edge(I1,'roberts');figure;subplot(2,3,3);imshow(I2);title('roberts算子分割结果');axis([50,250,50,200]);grid on; %显示网格线axis on; %显示坐标系I3=edge(I1,'sobel');subplot(2,3,4);imshow(I3);title('sobel算子分割结果');axis([50,250,50,200]);grid on; %显示网格线axis on; %显示坐标系I4=edge(I1,'Prewitt');subplot(2,3,5);imshow(I4);title('Prewitt算子分割结果');axis([50,250,50,200]);grid on; %显示网格线axis on; %显示坐标系9.LOG算子检测边缘用MATLAB程序实现如下:I=imread('xian.bmp');subplot(2,2,1);imshow(I);title('原始图像');I1=rgb2gray(I);subplot(2,2,2);imshow(I1);title('灰度图像');I2=edge(I1,'log');subplot(2,2,3);imshow(I2);title('log算子分割结果'); 10.Canny算子检测边缘用MATLAB程序实现如下:I=imread('xian.bmp'); subplot(2,2,1);imshow(I);title('原始图像')I1=rgb2gray(I);subplot(2,2,2);imshow(I1);title('灰度图像');I2=edge(I1,'canny'); subplot(2,2,3);imshow(I2);title('canny算子分割结果');11.边界跟踪(bwtraceboundary函数)clcclear allI=imread('xian.bmp');figureimshow(I);title('原始图像');I1=rgb2gray(I); %将彩色图像转化灰度图像threshold=graythresh(I1); %计算将灰度图像转化为二值图像所需的门限BW=im2bw(I1, threshold); %将灰度图像转化为二值图像figureimshow(BW);title('二值图像');dim=size(BW);col=round(dim(2)/2)-90; %计算起始点列坐标row=find(BW(:,col),1); %计算起始点行坐标connectivity=8;num_points=180;contour=bwtraceboundary(BW,[row,col],'N',connectivity,num_p oints);%提取边界figureimshow(I1);hold on;plot(contour(:,2),contour(:,1), 'g','LineWidth' ,2); title('边界跟踪图像');12.Hough变换I= imread('xian.bmp');rotI=rgb2gray(I);subplot(2,2,1);imshow(rotI);title('灰度图像');axis([50,250,50,200]);grid on;axis on;BW=edge(rotI,'prewitt');subplot(2,2,2);imshow(BW);title('prewitt算子边缘检测后图像');axis([50,250,50,200]);grid on;axis on;[H,T,R]=hough(BW);subplot(2,2,3);imshow(H,[],'XData',T,'YData',R,'InitialMagnification','fit'); title('霍夫变换图');xlabel('\theta'),ylabel('\rho');axis on , axis normal, hold on;P=houghpeaks(H,5,'threshold',ceil(0.3*max(H(:))));x=T(P(:,2));y=R(P(:,1));plot(x,y,'s','color','white');lines=houghlines(BW,T,R,P,'FillGap',5,'MinLength',7); subplot(2,2,4);,imshow(rotI);title('霍夫变换图像检测');axis([50,250,50,200]);grid on;axis on;hold on;max_len=0;for k=1:length(lines)xy=[lines(k).point1;lines(k).point2];plot(xy(:,1),xy(:,2),'LineWidth',2,'Color','green');plot(xy(1,1),xy(1,2),'x','LineWidth',2,'Color','yellow');plot(xy(2,1),xy(2,2),'x','LineWidth',2,'Color','red');len=norm(lines(k).point1-lines(k).point2);if(len>max_len)max_len=len;xy_long=xy;endendplot(xy_long(:,1),xy_long(:,2),'LineWidth',2,'Color','cyan'); 13.直方图阈值法用MATLAB实现直方图阈值法:I=imread('xian.bmp');I1=rgb2gray(I);figure;subplot(2,2,1);imshow(I1);title('灰度图像')axis([50,250,50,200]);grid on; %显示网格线axis on; %显示坐标系[m,n]=size(I1); %测量图像尺寸参数GP=zeros(1,256); %预创建存放灰度出现概率的向量for k=0:255GP(k+1)=length(find(I1==k))/(m*n); %计算每级灰度出现的概率,将其存入GP中相应位置endsubplot(2,2,2),bar(0:255,GP,'g') %绘制直方图title('灰度直方图')xlabel('灰度值')ylabel('出现概率')I2=im2bw(I,150/255);subplot(2,2,3),imshow(I2);title('阈值150的分割图像')axis([50,250,50,200]);grid on; %显示网格线axis on; %显示坐标系I3=im2bw(I,200/255); %subplot(2,2,4),imshow(I3);title('阈值200的分割图像')axis([50,250,50,200]);grid on; %显示网格线axis on; %显示坐标系14. 自动阈值法:Otsu法用MATLAB实现Otsu算法:clcclear allI=imread('xian.bmp');subplot(1,2,1),imshow(I);title('原始图像')axis([50,250,50,200]);grid on; %显示网格线axis on; %显示坐标系level=graythresh(I); %确定灰度阈值BW=im2bw(I,level);subplot(1,2,2),imshow(BW);title('Otsu法阈值分割图像')axis([50,250,50,200]);grid on; %显示网格线axis on; %显示坐标系15.膨胀操作I=imread('xian.bmp'); %载入图像I1=rgb2gray(I);subplot(1,2,1);imshow(I1);title('灰度图像')axis([50,250,50,200]);grid on; %显示网格线axis on; %显示坐标系se=strel('disk',1); %生成圆形结构元素I2=imdilate(I1,se); %用生成的结构元素对图像进行膨胀subplot(1,2,2);imshow(I2);title('膨胀后图像');axis([50,250,50,200]);grid on; %显示网格线axis on; %显示坐标系16.腐蚀操作MATLAB实现腐蚀操作I=imread('xian.bmp'); %载入图像I1=rgb2gray(I);subplot(1,2,1);imshow(I1);title('灰度图像')axis([50,250,50,200]);grid on; %显示网格线axis on; %显示坐标系se=strel('disk',1); %生成圆形结构元素I2=imerode(I1,se); %用生成的结构元素对图像进行腐蚀subplot(1,2,2);imshow(I2);title('腐蚀后图像');axis([50,250,50,200]);grid on; %显示网格线axis on; %显示坐标系17.开启和闭合操作用MATLAB实现开启和闭合操作I=imread('xian.bmp'); %载入图像subplot(2,2,1),imshow(I);title('原始图像');axis([50,250,50,200]);axis on; %显示坐标系I1=rgb2gray(I);subplot(2,2,2),imshow(I1);title('灰度图像');axis([50,250,50,200]);axis on; %显示坐标系se=strel('disk',1); %采用半径为1的圆作为结构元素I3=imclose(I1,se); %闭合操作subplot(2,2,3),imshow(I2);title('开启运算后图像');axis([50,250,50,200]);axis on; %显示坐标系subplot(2,2,4),imshow(I3);title('闭合运算后图像');axis([50,250,50,200]);axis on; %显示坐标系18.开启和闭合组合操作I=imread('xian.bmp'); %载入图像subplot(3,2,1),imshow(I);title('原始图像');axis([50,250,50,200]);axis on; %显示坐标系I1=rgb2gray(I);subplot(3,2,2),imshow(I1);title('灰度图像');axis([50,250,50,200]);axis on; %显示坐标系se=strel('disk',1);I3=imclose(I1,se); %闭合操作subplot(3,2,3),imshow(I2);title('开启运算后图像');axis([50,250,50,200]);axis on; %显示坐标系subplot(3,2,4),imshow(I3);title('闭合运算后图像');axis([50,250,50,200]);axis on; %显示坐标系se=strel('disk',1);I4=imopen(I1,se);I5=imclose(I4,se);subplot(3,2,5),imshow(I5); %开—闭运算图像title('开—闭运算图像');axis([50,250,50,200]);axis on; %显示坐标系I6=imclose(I1,se);I7=imopen(I6,se);subplot(3,2,6),imshow(I7); %闭—开运算图像title('闭—开运算图像');axis([50,250,50,200]);axis on; %显示坐标系19.形态学边界提取利用MATLAB实现如下:I=imread('xian.bmp'); %载入图像subplot(1,3,1),imshow(I);title('原始图像');axis([50,250,50,200]);grid on; %显示网格线axis on; %显示坐标系I1=im2bw(I);subplot(1,3,2),imshow(I1);title('二值化图像');axis([50,250,50,200]);grid on; %显示网格线axis on; %显示坐标系I2=bwperim(I1); %获取区域的周长subplot(1,3,3),imshow(I2);title('边界周长的二值图像');axis([50,250,50,200]);grid on;axis on;20.形态学骨架提取利用MATLAB实现如下:I=imread('xian.bmp'); subplot(2,2,1),imshow(I); title('原始图像');axis([50,250,50,200]); axis on;I1=im2bw(I);subplot(2,2,2),imshow(I1); title('二值图像');axis([50,250,50,200]); axis on;I2=bwmorph(I1,'skel',1); subplot(2,2,3),imshow(I2); title('1次骨架提取');axis([50,250,50,200]); axis on;I3=bwmorph(I1,'skel',2); subplot(2,2,4),imshow(I3); title('2次骨架提取');axis([50,250,50,200]); axis on;21.直接提取四个顶点坐标I = imread('xian.bmp');I = I(:,:,1);BW=im2bw(I);figureimshow(~BW)[x,y]=getpts。
数字图像处理matlab代码
一、编写程序完成不同滤波器的图像频域降噪和边缘增强的算法并进行比较,得出结论。
1、不同滤波器的频域降噪1.1 理想低通滤波器(ILPF)和二阶巴特沃斯低通滤波器(BLPF)clc;clear all;close all;I1=imread('me.jpg');I1=rgb2gray(I1);subplot(2,2,1),imshow(I1),title('原始图像');I2=imnoise(I1,'salt & pepper');subplot(2,2,2),imshow(I2),title('噪声图像');F=double(I2);g = fft2(F);g = fftshift(g);[M, N]=size(g);result1=zeros(M,N);result2=zeros(M,N);nn = 2;d0 =50;m = fix(M/2);n = fix(N/2);for i = 1:Mfor j = 2:Nd = sqrt((i-m)^2+(j-n)^2);h = 1/(1+0.414*(d/d0)^(2*nn));result1(i,j) = h*g(i,j);if(g(i,j)< 50)result2(i,j) = 0;elseresult2(i,j) =g(i,j);endendendresult1 = ifftshift(result1);result2 = ifftshift(result2);J2 = ifft2(result1);J3 = uint8(real(J2));subplot(2, 2, 3),imshow(J3,[]),title('巴特沃斯低通滤波结果'); J4 = ifft2(result2);J5 = uint8(real(J4));subplot(2, 2, 4),imshow(J5,[]),title('理想低通滤波结果');实验结果:原始图像噪声图像巴特沃斯低通滤波结果理想低通滤波结果1.2 指数型低通滤波器(ELPF)clc;clear all;close all;I1=imread('me.jpg');I1=rgb2gray(I1);I2=im2double(I1);I3=imnoise(I2,'gaussian',0.01);I4=imnoise(I3,'salt & pepper',0.01);subplot(1,3,1),imshow(I2), title('原始图像'); %显示原始图像subplot(1,3,2),imshow(I4),title('加入混合躁声后图像 ');s=fftshift(fft2(I4));%将灰度图像的二维不连续Fourier 变换的零频率成分移到频谱的中心[M,N]=size(s); %分别返回s的行数到M中,列数到N中n1=floor(M/2); %对M/2进行取整n2=floor(N/2); %对N/2进行取整d0=40;for i=1:Mfor j=1:Nd=sqrt((i-n1)^2+(j-n2)^2); %点(i,j)到傅立叶变换中心的距离 h=exp(log(1/sqrt(2))*(d/d0)^2);s(i,j)=h*s(i,j); %ILPF滤波后的频域表示endends=ifftshift(s); %对s进行反FFT移动s=im2uint8(real(ifft2(s)));subplot(1,3,3),imshow(s),title('ELPF滤波后的图像(d=40)');运行结果:1.3 梯形低通滤波器(TLPF)clc;clear all;close all;I1=imread('me.jpg');I1=rgb2gray(I1); %读取图像I2=im2double(I1);I3=imnoise(I2,'gaussian',0.01);I4=imnoise(I3,'salt & pepper',0.01);subplot(1,3,1),imshow(I2),title('原始图像'); %显示原始图像subplot(1,3,2),imshow(I4),title('加噪后的图像');s=fftshift(fft2(I4));%将灰度图像的二维不连续Fourier 变换的零频率成分移到频谱的中心[M,N]=size(s); %分别返回s的行数到M中,列数到N中n1=floor(M/2); %对M/2进行取整n2=floor(N/2); %对N/2进行取整d0=10;d1=160;for i=1:Mfor j=1:Nd=sqrt((i-n1)^2+(j-n2)^2); %点(i,j)到傅立叶变换中心的距离 if (d<=d0)h=1;else if (d0<=d1)h=(d-d1)/(d0-d1);else h=0;endends(i,j)=h*s(i,j); %ILPF滤波后的频域表示endends=ifftshift(s); %对s进行反FFT移动s=im2uint8(real(ifft2(s))); %对s进行二维反离散的Fourier变换后,取复数的实部转化为无符号8位整数subplot(1,3,3),imshow(s),title('TLPF滤波后的图像');运行结果:1.4 高斯低通滤波器(GLPF)clear all;clc;close all;I1=imread('me.jpg');I1=rgb2gray(I1);I2=im2double(I1);I3=imnoise(I2,'gaussian',0.01);I4=imnoise(I3,'salt & pepper',0.01);subplot(1,3,1),imshow(I2),title('原始图像');subplot(1,3,2),imshow(I4),title('加噪后的图像');s=fftshift(fft2(I4));%将灰度图像的二维不连续Fourier 变换的零频率成分移到频谱的中心[M,N]=size(s); %分别返回s的行数到M中,列数到N中n1=floor(M/2); %对M/2进行取整n2=floor(N/2); %对N/2进行取整d0=40;for i=1:Mfor j=1:Nd=sqrt((i-n1)^2+(j-n2)^2); %点(i,j)到傅立叶变换中心的距离 h=1*exp(-1/2*(d^2/d0^2)); %GLPF滤波函数s(i,j)=h*s(i,j); %ILPF滤波后的频域表示endends=ifftshift(s); %对s进行反FFT移动s=im2uint8(real(ifft2(s))); %对s进行二维反离散的Fourier变换后,取复数的实部转化为无符号8位整数subplot(1,3,3),imshow(s),title('GLPF滤波后的图像(d=40)');运行结果:1.5 维纳滤波器clc;clear all;close all;I=imread('me.jpg'); %读取图像I=rgb2gray(I);I1=im2double(I);I2=imnoise(I1,'gaussian',0.01);I3=imnoise(I2,'salt & pepper',0.01);I4=wiener2(I3);subplot(1,3,1),imshow(I1),title('原始图像'); %显示原始图像subplot(1,3,2),imshow(I3),title('加入混合躁声后图像');I4=wiener2(I3);subplot(1,3,3),imshow(I4),title('wiener滤波后的图像');运行结果:结论:理想低通滤波器,虽然有陡峭的截止频率,却不能产生良好的效果,图像由于高频分量的滤除而变得模糊,同时还产生振铃效应。
MATLAB实用源代码(图像处理)
MATLAB实用源代码图像读取及灰度变换I=imread('cameraman.tif');%读取图像subplot(1,2,1),imshow(I) %输出图像title('原始图像') %在原始图像中加标题subplot(1,2,2),imhist(I) %输出原图直方图title('原始图像直方图') %在原图直方图上加标题图像旋转I = imread('cameraman.tif');figure,imshow(I);theta = 30;K = imrotate(I,theta); % Try varying the angle, theta. figure, imshow(K)边缘检测I = imread('cameraman.tif');J1=edge(I,'sobel');J2=edge(I,'prewitt');J3=edge(I,'log');subplot(1,4,1),imshow(I);subplot(1,4,2),imshow(J1);subplot(1,4,3),imshow(J2);subplot(1,4,4),imshow(J3);1.图像反转MATLAB 程序实现如下:I=imread('xian.bmp');J=double(I);J=-J+(256-1); %图像反转线性变换H=uint8(J);subplot(1,2,1),imshow(I);subplot(1,2,2),imshow(H);2.灰度线性变换MATLAB 程序实现如下:I=imread('xian.bmp');subplot(2,2,1),imshow(I);title('原始图像');axis([50,250,50,200]);axis on; %显示坐标系I1=rgb2gray(I);subplot(2,2,2),imshow(I1);title('灰度图像');axis([50,250,50,200]);axis on; %显示坐标系J=imadjust(I1,[0.1 0.5],[]); %局部拉伸,把[0.1 0.5]内的灰度拉伸为[0 1] subplot(2,2,3),imshow(J);title('线性变换图像[0.1 0.5]');axis([50,250,50,200]);grid on; %显示网格线axis on; %显示坐标系K=imadjust(I1,[0.3 0.7],[]); %局部拉伸,把[0.3 0.7]内的灰度拉伸为[0 1] subplot(2,2,4),imshow(K);title('线性变换图像[0.3 0.7]');axis([50,250,50,200]);grid on; %显示网格线axis on; %显示坐标系3.非线性变换MATLAB 程序实现如下:I=imread('xian.bmp');I1=rgb2gray(I);subplot(1,2,1),imshow(I1);title(' 灰度图像');axis([50,250,50,200]);grid on; %显示网格线axis on; %显示坐标系J=double(I1);J=40*(log(J+1));H=uint8(J);subplot(1,2,2),imshow(H);title(' 对数变换图像');axis([50,250,50,200]);grid on; %显示网格线axis on; %显示坐标系4.直方图均衡化MATLAB 程序实现如下:I=imread('xian.bmp');I=rgb2gray(I);figure;subplot(2,2,1);imshow(I);subplot(2,2,2);imhist(I);I1=histeq(I);figure;subplot(2,2,1);imshow(I1);subplot(2,2,2);imhist(I1);5. 线性平滑滤波器用MA TLAB实现领域平均法抑制噪声程序:I=imread('xian.bmp');subplot(231)imshow(I)title('原始图像')I=rgb2gray(I);I1=imnoise(I,'salt & pepper',0.02);subplot(232)imshow(I1)title(' 添加椒盐噪声的图像')k1=filter2(fspecial('average',3),I1)/255; %进行3*3模板平滑滤波k2=filter2(fspecial('average',5),I1)/255; %进行5*5模板平滑滤波k3=filter2(fspecial('average',7),I1)/255; %进行7*7模板平滑滤波k4=filter2(fspecial('average',9),I1)/255; %进行9*9模板平滑滤波subplot(233),imshow(k1);title('3*3 模板平滑滤波');subplot(234),imshow(k2);title('5*5 模板平滑滤波');subplot(235),imshow(k3);title('7*7 模板平滑滤波');subplot(236),imshow(k4);title('9*9 模板平滑滤波');6.中值滤波器用MA TLAB实现中值滤波程序如下:I=imread('xian.bmp');I=rgb2gray(I);J=imnoise(I,'salt&pepper',0.02);subplot(231),imshow(I);title('原图像');subplot(232),imshow(J);title('添加椒盐噪声图像');k1=medfilt2(J); %进行3*3模板中值滤波k2=medfilt2(J,[5,5]); %进行5*5模板中值滤波k3=medfilt2(J,[7,7]); %进行7*7模板中值滤波k4=medfilt2(J,[9,9]); %进行9*9模板中值滤波subplot(233),imshow(k1);title('3*3模板中值滤波');subplot(234),imshow(k2);title('5*5模板中值滤波');subplot(235),imshow(k3);title('7*7模板中值滤波');subplot(236),imshow(k4);title('9*9 模板中值滤波');7.用Sobel算子和拉普拉斯对图像锐化:I=imread('xian.bmp');subplot(2,2,1),imshow(I);title('原始图像');axis([50,250,50,200]);grid on; %显示网格线axis on; %显示坐标系I1=im2bw(I);subplot(2,2,2),imshow(I1);title('二值图像');axis([50,250,50,200]);grid on; %显示网格线axis on; %显示坐标系H=fspecial('sobel'); %选择sobel算子J=filter2(H,I1); %卷积运算subplot(2,2,3),imshow(J);title('sobel算子锐化图像');axis([50,250,50,200]);grid on; %显示网格线axis on; %显示坐标系h=[0 1 0,1 -4 1,0 1 0]; %拉普拉斯算子J1=conv2(I1,h,'same'); %卷积运算subplot(2,2,4),imshow(J1);title('拉普拉斯算子锐化图像');axis([50,250,50,200]);grid on; %显示网格线axis on; %显示坐标系8.梯度算子检测边缘用MA TLAB实现如下:I=imread('xian.bmp');subplot(2,3,1);imshow(I);title('原始图像');axis([50,250,50,200]);grid on; %显示网格线axis on; %显示坐标系I1=im2bw(I);subplot(2,3,2);imshow(I1);title('二值图像');axis([50,250,50,200]);grid on; %显示网格线axis on; %显示坐标系I2=edge(I1,'roberts');figure;subplot(2,3,3);imshow(I2);title('roberts算子分割结果');axis([50,250,50,200]);grid on; %显示网格线axis on; %显示坐标系I3=edge(I1,'sobel');subplot(2,3,4);imshow(I3);title('sobel算子分割结果');axis([50,250,50,200]);grid on; %显示网格线axis on; %显示坐标系I4=edge(I1,'Prewitt');subplot(2,3,5);imshow(I4);title('Prewitt算子分割结果');axis([50,250,50,200]);grid on; %显示网格线axis on; %显示坐标系9.LOG算子检测边缘用MA TLAB程序实现如下:I=imread('xian.bmp');subplot(2,2,1);imshow(I);title('原始图像');I1=rgb2gray(I);subplot(2,2,2);imshow(I1);title('灰度图像');I2=edge(I1,'log');subplot(2,2,3);imshow(I2);title('log算子分割结果');10.Canny算子检测边缘用MA TLAB程序实现如下:I=imread('xian.bmp');subplot(2,2,1);imshow(I);title('原始图像')I1=rgb2gray(I);subplot(2,2,2);imshow(I1);title('灰度图像');I2=edge(I1,'canny');subplot(2,2,3);imshow(I2);title('canny算子分割结果');11.边界跟踪(bwtraceboundary函数)clcclear allI=imread('xian.bmp');figureimshow(I);title('原始图像');I1=rgb2gray(I); %将彩色图像转化灰度图像threshold=graythresh(I1); %计算将灰度图像转化为二值图像所需的门限BW=im2bw(I1, threshold); %将灰度图像转化为二值图像figureimshow(BW);title('二值图像');dim=size(BW);col=round(dim(2)/2)-90; %计算起始点列坐标row=find(BW(:,col),1); %计算起始点行坐标connectivity=8;num_points=180;contour=bwtraceboundary(BW,[row,col],'N',connectivity,num_points);%提取边界figureimshow(I1);hold on;plot(contour(:,2),contour(:,1), 'g','LineWidth' ,2);title('边界跟踪图像');12.Hough变换I= imread('xian.bmp');rotI=rgb2gray(I);subplot(2,2,1);imshow(rotI);title('灰度图像');axis([50,250,50,200]);grid on;axis on;BW=edge(rotI,'prewitt');subplot(2,2,2);imshow(BW);title('prewitt算子边缘检测后图像');axis([50,250,50,200]);grid on;axis on;[H,T,R]=hough(BW);subplot(2,2,3);imshow(H,[],'XData',T,'YData',R,'InitialMagnification','fit');title('霍夫变换图');xlabel('\theta'),ylabel('\rho');axis on , axis normal, hold on;P=houghpeaks(H,5,'threshold',ceil(0.3*max(H(:))));x=T(P(:,2));y=R(P(:,1));plot(x,y,'s','color','white');lines=houghlines(BW,T,R,P,'FillGap',5,'MinLength',7);subplot(2,2,4);,imshow(rotI);title('霍夫变换图像检测');axis([50,250,50,200]);grid on;axis on;hold on;max_len=0;for k=1:length(lines)xy=[lines(k).point1;lines(k).point2];plot(xy(:,1),xy(:,2),'LineWidth',2,'Color','green');plot(xy(1,1),xy(1,2),'x','LineWidth',2,'Color','yellow');plot(xy(2,1),xy(2,2),'x','LineWidth',2,'Color','red');len=norm(lines(k).point1-lines(k).point2);if(len>max_len)max_len=len;xy_long=xy;endendplot(xy_long(:,1),xy_long(:,2),'LineWidth',2,'Color','cyan');13.直方图阈值法用MA TLAB实现直方图阈值法:I=imread('xian.bmp');I1=rgb2gray(I);figure;subplot(2,2,1);imshow(I1);title(' 灰度图像')axis([50,250,50,200]);grid on; %显示网格线axis on; %显示坐标系[m,n]=size(I1); %测量图像尺寸参数GP=zeros(1,256); %预创建存放灰度出现概率的向量for k=0:255GP(k+1)=length(find(I1==k))/(m*n); %计算每级灰度出现的概率,将其存入GP中相应位置endsubplot(2,2,2),bar(0:255,GP,'g') %绘制直方图title('灰度直方图')xlabel('灰度值')ylabel(' 出现概率')I2=im2bw(I,150/255);subplot(2,2,3),imshow(I2);title('阈值150的分割图像')axis([50,250,50,200]);grid on; %显示网格线axis on; %显示坐标系I3=im2bw(I,200/255); %subplot(2,2,4),imshow(I3);title('阈值200的分割图像')axis([50,250,50,200]);grid on; %显示网格线axis on; %显示坐标系14. 自动阈值法:Otsu法用MA TLAB实现Otsu算法:clcclear allI=imread('xian.bmp');subplot(1,2,1),imshow(I);title('原始图像')axis([50,250,50,200]);grid on; %显示网格线axis on; %显示坐标系level=graythresh(I); %确定灰度阈值BW=im2bw(I,level);subplot(1,2,2),imshow(BW);title('Otsu 法阈值分割图像')axis([50,250,50,200]);grid on; %显示网格线axis on; %显示坐标系15.膨胀操作I=imread('xian.bmp'); %载入图像I1=rgb2gray(I);subplot(1,2,1);imshow(I1);title('灰度图像')axis([50,250,50,200]);grid on; %显示网格线axis on; %显示坐标系se=strel('disk',1); %生成圆形结构元素I2=imdilate(I1,se); %用生成的结构元素对图像进行膨胀subplot(1,2,2);imshow(I2);title(' 膨胀后图像');axis([50,250,50,200]);grid on; %显示网格线axis on; %显示坐标系16.腐蚀操作MATLAB 实现腐蚀操作I=imread('xian.bmp'); %载入图像I1=rgb2gray(I);subplot(1,2,1);imshow(I1);title('灰度图像')axis([50,250,50,200]);grid on; %显示网格线axis on; %显示坐标系se=strel('disk',1); %生成圆形结构元素I2=imerode(I1,se); %用生成的结构元素对图像进行腐蚀subplot(1,2,2);imshow(I2);title('腐蚀后图像');axis([50,250,50,200]);grid on; %显示网格线axis on; %显示坐标系17.开启和闭合操作用MA TLAB实现开启和闭合操作I=imread('xian.bmp'); %载入图像subplot(2,2,1),imshow(I);title('原始图像');axis([50,250,50,200]);axis on; %显示坐标系I1=rgb2gray(I);subplot(2,2,2),imshow(I1);title('灰度图像');axis([50,250,50,200]);axis on; %显示坐标系se=strel('disk',1); %采用半径为1的圆作为结构元素I2=imopen(I1,se); %开启操作I3=imclose(I1,se); %闭合操作subplot(2,2,3),imshow(I2);title('开启运算后图像');axis([50,250,50,200]);axis on; %显示坐标系subplot(2,2,4),imshow(I3);title('闭合运算后图像');axis([50,250,50,200]);axis on; %显示坐标系18.开启和闭合组合操作I=imread('xian.bmp'); %载入图像subplot(3,2,1),imshow(I);title('原始图像');axis([50,250,50,200]);axis on; %显示坐标系I1=rgb2gray(I);subplot(3,2,2),imshow(I1);title('灰度图像');axis([50,250,50,200]);axis on; %显示坐标系se=strel('disk',1);I2=imopen(I1,se); %开启操作I3=imclose(I1,se); %闭合操作subplot(3,2,3),imshow(I2);title('开启运算后图像');axis([50,250,50,200]);axis on; %显示坐标系subplot(3,2,4),imshow(I3);title('闭合运算后图像');axis([50,250,50,200]);axis on; %显示坐标系se=strel('disk',1);I4=imopen(I1,se);I5=imclose(I4,se);subplot(3,2,5),imshow(I5); %开—闭运算图像title('开—闭运算图像');axis([50,250,50,200]);axis on; %显示坐标系I6=imclose(I1,se);I7=imopen(I6,se);subplot(3,2,6),imshow(I7); %闭—开运算图像title('闭—开运算图像');axis([50,250,50,200]);axis on; %显示坐标系19.形态学边界提取利用MATLAB实现如下:I=imread('xian.bmp'); %载入图像subplot(1,3,1),imshow(I);title('原始图像');axis([50,250,50,200]);grid on; %显示网格线axis on; %显示坐标系I1=im2bw(I);subplot(1,3,2),imshow(I1);title('二值化图像');权威认证axis([50,250,50,200]);grid on; %显示网格线axis on; %显示坐标系I2=bwperim(I1); %获取区域的周长subplot(1,3,3),imshow(I2);title('边界周长的二值图像');axis([50,250,50,200]);grid on;axis on;20.形态学骨架提取利用MATLAB实现如下:I=imread('xian.bmp');subplot(2,2,1),imshow(I);title('原始图像');axis([50,250,50,200]);axis on;I1=im2bw(I);subplot(2,2,2),imshow(I1);title('二值图像');axis([50,250,50,200]);axis on;I2=bwmorph(I1,'skel',1);subplot(2,2,3),imshow(I2);title('1次骨架提取');axis([50,250,50,200]);axis on;I3=bwmorph(I1,'skel',2);subplot(2,2,4),imshow(I3);title('2次骨架提取');axis([50,250,50,200]);axis on;21.直接提取四个顶点坐标I = imread('xian.bmp');I = I(:,:,1);BW=im2bw(I);figureimshow(~BW)[x,y]=getpts。
数字图像处理(Matlab复习代码)
双线性插值法I_=imread('test.jpg');I=rgb2gray(I_);A=0.7;B=0.7;%失真像素坐标[i,j]=size(I);m=round(i*A);n=round(j*B);temp=zeros(m,n);%产生m*n矩阵G=[A 0;0 B];for x=1:mfor y=1:nab=[x,y]/G;%取得x/A,y/Ba=ab(1)-floor(ab(1));%权值b=ab(2)-floor(ab(2));%防溢出处理if ab(1)<1ab(1)=1;endif ab(1)>iab(1)=i;endif ab(2)<1ab(2)=1;endif ab(2)>jab(2)=j;end%定义内插值坐标ab11=[floor(ab(1)) floor(ab(2))];ab12=[floor(ab(1)) ceil(ab(2))];ab21=[ceil(ab(1)) floor(ab(2))];ab22=[ceil(ab(1)) ceil(ab(2))]; temp(x,y)=(1-a)*(1-b)*I(ab11(1),ab11(2))+... a*(1-b)*I(ab12(1),ab12(2))+...(1-a)*b*I(ab21(1),ab21(2))+...a*b*I(ab22(1),ab22(2));endendimshow(uint8(temp)),title('0.7倍双线性'); 最近邻法I_=imread('test.jpg');%读入原始图像I1=rgb2gray(I_);[i,j]=size(I1);m=round(i*1.5);n=round(j*1.5);m_=round(i*0.7);n_=round(j*0.7);% 1.5倍最邻近TEMP=zeros(m,n);%产生m*n矩阵for i = 1:mfor j = 1:nTEMP(i,j)=I1(round(i/1.5),round(j/1.5));endendsubplot(1,3,1) ,imshow(I1),title('原图')TEMP1_5=uint8(TEMP);subplot(1,3,2),imshow(TEMP1_5),title('1.5倍最邻近')全局预测下的图像分割I_=imread('test.jpg');I=rgb2gray(I_);[m,n]=size(I);% 统计直方图zhifangtu=zeros(1,255);%for i=1:1:mfor j=1:1:nzhifangtu(I(i,j)+1)=zhifangtu(I(i,j)+1)+1;endendplot(zhifangtu);%阈值处理final=zeros(m,n);for x=1:1:mfor y=1:1:nAA=I(x,y);if AA > 120final(x,y)=255;elsefinal(x,y)=0;endendendimshow(uint8(final));高通滤波(锐化)Sobel算子O=imread('test.jpg');I=rgb2gray(O);imshow(I);title('锐化前的原始图像');[m,n]=size(I);TEMP=zeros(m+2,n+2);%避免边界为空,用0像素值填充for i=1:1:mfor j=1:1:nTEMP(i+1,j+1)=I(i,j);endend%定义所需的空间vertical=zeros(m,n);horize=zeros(m,n);for x=2:1:m+1for y=2:1:n+1%上下水平模板vertical(x-1,y-1)=[-TEMP(x-1,y-1)+TEMP(x-1,y+1)-TEMP(x,y-1)+ TEMP(x,y+1)-TEMP(x+1,y-1)+TEMP(x+1,y+1)]; %左右垂直模板horize(x-1,y-1)=[-TEMP(x-1,y-1)-TEMP(x-1,y)-TEMP(x-1,y+1)+ TEMP(x+1,y-1)+TEMP(x+1,y)+TEMP(x+1,y+1)];endendfigure;imshow(vertical);title('垂直模板锐化'); figure;imshow(vertical_);title('阈值处理后的垂直模板锐化');figure;imshow(horize);title('水平模板锐化'); figure;imshow(horize_);title('阈值处理后的水平模板锐化');低通滤波:线性滤波(邻域平均法)I=imread('eight.tif');%读入原始图像[m n]=size(I);a_ = imnoise(I,'salt & pepper',0.04);%对图像加椒盐噪声,噪声强度为0.04a=double(a_);%先将uint8转换为double类型,以免数据溢出TEMP=zeros(m+2,n+2);%数值填充,产生一个临时的空间for i=1:1:mfor j=1:1:nTEMP(i+1,j+1)=a(i,j);endendfinal=zeros(m,n);for x=2:1:m+1for y=2:1:n+1final(x-1,y-1)=[TEMP(x-1,y-1)+TEMP(x-1,y)+TEMP(x-1,y+1)+ TEMP(x,y-1)+TEMP(x,y)+TEMP(x,y+1)+TEMP(x+ 1,y-1)+TEMP(x+1,y)+TEMP(x+1,y+1)]/9;endendfinal2=uint8(final)非线性滤波(中值滤波)I=imread('eight.tif');%读入原始图像[m n]=size(I);a_ = imnoise(I,'salt & pepper',0.04);%对图像加椒盐噪声,噪声强度为0.04TEMP=zeros(m+2,n+2);%数值填充,产生一个临时的空间for i=1:1:mfor j=1:1:nTEMP(i+1,j+1)=a_(i,j);endend%中值滤波final=zeros(m,n);% zeros(m,n)产生m×n的零矩阵for x=2:1:m+1for y=2:1:n+1final(x-1,y-1)=median([TEMP(x-1,y-1),TEMP(x-1,y),TEMP(x-1,y +1),TEMP(x,y-1),TEMP(x,y),TEMP(x,y+1),TEMP( x+1,y-1),TEMP(x+1,y),TEMP(x+1,y+1)]);endend图像直方图I=imread('test.jpg'); J=rgb2gray(I);figure,subplot(2,2,1) H=zeros(1,256);% zeros(m,n)产生m ×n 的零矩阵 [m n]=size(J); for i=1:m for j=1:nH(J(i,j)+1)=H(J(i,j)+1)+1; %从第一个开始,并统计灰度值 end endplot(H);stem(H);%绘制二维离散数据的火柴杆图 %归一化直方图N=numbel(J );%统计图像像素的总数 for i=1:m for j=1:nH2(J(i,j)+1)=[H2(J(i,j)+1)+1]/N; end end %图像均衡化%一,图像的预处理,读入彩色图像将其灰度化 cd d:I=imread('test.jpg'); H=rgb2gray(I); imshow(H);%二,绘制直方图[m,n]=size(H); %测量图像尺寸参数GL=zeros(1,256); %预创建存放灰度出现概率的向量 for k=0:255GL(k+1)=length(find(H==k))/(m*n); %计算每级灰度出现的概率,将其存入GP 中相应位置 endfigure,bar(0:255,GL,'g') %绘制直方图 title('原图像直方图') xlabel('灰度值') ylabel('出现概率')%三,直方图均衡化S1=zeros(1,256); % zeros(m,n)产生m ×n 的零矩阵 for i=1:256 for j=1:iS1(i)=GL(j)+S1(i); %计算变换函数Sk end endS2=round((S1*256)+0.5); %将Sk 归到相近级的灰度 for i=1:256GLPeq(i)=sum(GL(find(S2==i))); %计算现有每个灰度级出现的概率 endfigure,bar(0:255,GLPeq,'b') %显示均衡化后的直方图 title('均衡化后的直方图') xlabel('灰度值') ylabel('出现概率') %显示均衡化后的图像title('均衡化后图像')imwrite(PA,'JUNHENGHUA.bmp');。
matlab filter函数源代码

matlab filter函数源代码MATLAB中的filter函数是一个非常常用的信号处理函数,它可以实现对信号进行滤波操作。
滤波是信号处理的重要环节之一,它可以去除信号中的噪声以及其他不需要的成分,使得信号更加清晰和准确。
在MATLAB中,filter函数的源代码如下所示:```matlabfunction y = filter(b, a, x)% 输入参数b为滤波器的分子系数,a为滤波器的分母系数,x 为输入信号% 输出参数y为滤波后的信号N = max(length(b), length(a)); % 滤波器的阶数b = [b, zeros(1, N-length(b))]; % 分子系数补零a = [a, zeros(1, N-length(a))]; % 分母系数补零M = length(x); % 输入信号的长度y = zeros(1, M); % 初始化输出信号for n = 1:Mfor k = 1:Nif n-k+1 > 0y(n) = y(n) + b(k)*x(n-k+1);endendfor k = 2:Nif n-k+1 > 0y(n) = y(n) - a(k)*y(n-k+1);endendy(n) = y(n)/a(1);endend```上述代码中,filter函数接受三个输入参数:分子系数b、分母系数a和输入信号x。
其中,分子系数和分母系数用于定义滤波器的传递函数,而输入信号则是待滤波的信号。
函数的输出参数为滤波后得到的信号y。
在代码的实现过程中,首先通过比较分子系数b和分母系数a的长度,确定滤波器的阶数N。
然后,根据阶数N对分子系数和分母系数进行补零操作,使得它们的长度一致。
接下来,通过两个嵌套的for循环遍历输入信号x的每一个样本点,并根据滤波器的差分方程进行滤波操作。
其中,第一个for循环用于计算输出信号y的累加和,第二个for循环用于计算输出信号y的递推和。
matlab数字图像处理源代码
数字图像去噪典型算法及matlab实现希望得到大家的指点和帮助图像去噪是数字图像处理中的重要环节和步骤。
去噪效果的好坏直接影响到后续的图像处理工作如图像分割、边缘检测等。
图像信号在产生、传输过程中都可能会受到噪声的污染,一般数字图像系统中的常见噪声主要有:高斯噪声(主要由阻性元器件内部产生)、椒盐噪声(主要是图像切割引起的黑图像上的白点噪声或光电转换过程中产生的泊松噪声)等;目前比较经典的图像去噪算法主要有以下三种:均值滤波算法:也称线性滤波,主要思想为邻域平均法,即用几个像素灰度的平均值来代替每个像素的灰度。
有效抑制加性噪声,但容易引起图像模糊,可以对其进行改进,主要避开对景物边缘的平滑处理。
中值滤波:基于排序统计理论的一种能有效抑制噪声的非线性平滑滤波信号处理技术。
中值滤波的特点即是首先确定一个以某个像素为中心点的邻域,一般为方形邻域,也可以为圆形、十字形等等,然后将邻域中各像素的灰度值排序,取其中间值作为中心像素灰度的新值,这里领域被称为窗口,当窗口移动时,利用中值滤波可以对图像进行平滑处理。
其算法简单,时间复杂度低,但其对点、线和尖顶多的图像不宜采用中值滤波。
很容易自适应化。
Wiener维纳滤波:使原始图像和其恢复图像之间的均方误差最小的复原方法,是一种自适应滤波器,根据局部方差来调整滤波器效果。
对于去除高斯噪声效果明显。
实验一:均值滤波对高斯噪声的效果I=imread('C:\Documents and Settings\Administrator\桌面\1.gif');%读取图像J=imnoise(I,'gaussian',0,0.005);%加入均值为0,方差为0.005的高斯噪声subplot(2,3,1);imshow(I);title('原始图像');subplot(2,3,2); imshow(J);title('加入高斯噪声之后的图像');%采用MATLAB中的函数filter2对受噪声干扰的图像进行均值滤波K1=filter2(fspecial('average',3),J)/255; %模板尺寸为3K2=filter2(fspecial('average',5),J)/255;% 模板尺寸为5K3=filter2(fspecial('average',7),J)/255; %模板尺寸为7K4= filter2(fspecial('average',9),J)/255; %模板尺寸为9subplot(2,3,3);imshow(K1);title('改进后的图像1');subplot(2,3,4); imshow(K2);title('改进后的图像2');subplot(2,3,5);imshow(K3);title('改进后的图像3');subplot(2,3,6);imshow(K4);title('改进后的图像4');PS:filter2用法:filter2用法fspecial函数用于创建预定义的滤波算子,其语法格式为:h = fspecial(type)h = fspecial(type,parameters)参数type制定算子类型,parameters指定相应的参数,具体格式为:type='average',为均值滤波,参数为n,代表模版尺寸,用向量表示,默认值为[3,3]。
数字图像处理第二版MatLab代码大全

4.3
空域滤波增强
Matlab 实现的邻域平均法抑制噪声的程序: I=imread('eight.tif'); J=imnoise(I,'salt & pepper', 0.02); subplot(231),imshow(I);title('原图像'); subplot(232),imshow(J);title('添加椒盐噪声图像') k1=filter2(fspecial('average',3),J); %进行 3×3 模板平滑滤波 k2=filter2(fspecial('average',5),J); %进行 5×5 模板平滑滤波 k3=filter2(fspecial('average',7),J); %进行 7×7 模板平滑滤波 k4=filter2(fspecial('average',9),J); %进行 9×9 模板平滑滤波 subplot(233),imshow(uint8(k1));title('3×3 模板平滑滤波'); subplot(234),imshow(uint8(k2));title('5×5 模板平滑滤波'); subplot(235),imshow(uint8(k3));title('7×7 模板平滑滤波'); subplot(236),imshow(uint8(k4));title('9×9 模板平滑滤波') 例 4.10:使用中值滤波降低图像噪声
9
xlabel(‘\theta (degrees)’); ylabel(‘X\prime’); set(gca,’Xtick’,0:20:180); colormap(hot); colorbar;
matlab的conv的c源代码

matlab的conv的c源代码MATLAB的conv函数是一种非常实用的工具,用于进行信号和图像处理中的卷积运算。
本文将介绍MATLAB conv函数的C源代码实现。
卷积运算是信号和图像处理中非常重要的一种操作。
它可以用来实现滤波、边缘检测、模糊处理等各种应用。
而MATLAB的conv函数提供了方便的卷积计算方式,允许用户快速高效地进行信号和图像处理。
以下是MATLAB conv函数的C源代码实现:```c#include <stdio.h>void convolution(double *input, int input_length, double *kernel, int kernel_length, double *output){int i, j, k;for (i = 0; i < input_length + kernel_length - 1; i++){output[i] = 0;for (j = 0; j < kernel_length; j++){k = i - j;if (k >= 0 && k < input_length){output[i] += input[k] * kernel[j];}}}}int main(){double input[] = {1, 2, 3, 4, 5};int input_length = sizeof(input) / sizeof(input[0]);double kernel[] = {0.5, 1, 0.5};int kernel_length = sizeof(kernel) / sizeof(kernel[0]);double output[input_length + kernel_length - 1];convolution(input, input_length, kernel, kernel_length, output); printf("Convolution result:\n");for (int i = 0; i < input_length + kernel_length - 1; i++){printf("%.2f ", output[i]);}printf("\n");return 0;}```在上述代码中,我们定义了一个convolution函数来实现卷积运算。
使用Matlab进行图像处理的方法
使用Matlab进行图像处理的方法引言:在当今数字化时代,图像处理成为了计算机科学中重要且热门的领域。
图像处理可以用于各种应用,比如医学图像分析、视频监控、人工智能等。
而Matlab作为一种强大的计算工具在图像处理中也发挥着重要的作用。
本文将介绍一些使用Matlab进行图像处理的方法,以帮助读者掌握这一领域的基本技能。
一、读入和显示图像图像处理的第一步是读入和显示图像。
在Matlab中,可以使用imread()函数读取图像,并使用imshow()函数显示图像。
例如,下面的代码将读入名为"image.jpg"的图像,并在Matlab中显示出来。
```image = imread('image.jpg');imshow(image);```二、灰度图像处理在图像处理中,常常需要将彩色图像转换为灰度图像,这可以通过将RGB通道的像素值取平均得到。
Matlab提供了rgb2gray()函数来实现这一转换。
例如,下面的代码将读入一个彩色图像,并将其转换为灰度图像。
```image = imread('image.jpg');gray_image = rgb2gray(image);imshow(gray_image);```三、图像的尺寸调整有时候我们需要调整图像的尺寸,比如缩小或者放大图像,以适应不同的应用场景。
Matlab中提供了imresize()函数来实现这一功能。
下面的代码将读入一个图像,并将其尺寸调整为原来的一半。
```image = imread('image.jpg');resized_image = imresize(image, 0.5);imshow(resized_image);```四、图像的滤波滤波是图像处理中常用的技术,它能够增强或者减弱图像中的某些特征。
在Matlab中,可以使用imfilter()函数来实现各种滤波操作。
使用Matlab进行图像处理的常用函数介绍
使用Matlab进行图像处理的常用函数介绍引言:图像处理是计算机科学和电子工程领域中的重要分支,它利用数字技术对图像进行各种操作和改变,以实现图像的增强、分割、恢复等目标。
而Matlab作为一种功能强大的科学计算软件,被广泛应用于图像处理领域。
本文将介绍几个常用的Matlab图像处理函数,并结合实例进行详解。
一、图像读取与显示函数1. imread函数imread函数是Matlab中用于读取图像的函数,它可以读取各种图像格式(如JPEG、PNG、BMP等)的图像文件,并将其转换为Matlab中的矩阵形式。
示例:```img = imread('image.jpg');```2. imshow函数imshow函数用于在Matlab中显示图像,它可以接受矩阵形式的图像作为输入,并在新窗口中显示出来。
此外,imshow函数还可以对显示的图像进行一些调整,如调整图像的亮度、对比度等参数。
示例:```imshow(img); % 显示读取的图像```二、图像增强函数1. imadjust函数imadjust函数可以调整图像的亮度和对比度,以增强图像的视觉效果。
它通过对图像的像素值进行映射,将原始图像灰度值的范围进行调整,从而使图像的显示效果更好。
示例:```img_adjusted = imadjust(img, [0.2 0.8], [0 1]);```2. histeq函数histeq函数可以进行直方图均衡化处理,使图像的像素值在不同灰度级之间更均匀分布,从而增强图像的对比度和细节。
示例:```img_equalized = histeq(img);```三、图像滤波函数1. imfilter函数imfilter函数实现了不同类型的图像滤波算法,包括平滑滤波、锐化滤波等。
它可以对图像的每个像素点进行卷积运算,以消除噪声、增强边缘等。
示例:```filter = fspecial('average', [5 5]); % 创建一个平滑滤波器img_filtered = imfilter(img, filter); % 对图像进行平滑滤波```2. medfilt2函数medfilt2函数是一种中值滤波算法,它可以有效地去除图像中的椒盐噪声、脉冲噪声等。
- 1、下载文档前请自行甄别文档内容的完整性,平台不提供额外的编辑、内容补充、找答案等附加服务。
- 2、"仅部分预览"的文档,不可在线预览部分如存在完整性等问题,可反馈申请退款(可完整预览的文档不适用该条件!)。
- 3、如文档侵犯您的权益,请联系客服反馈,我们会尽快为您处理(人工客服工作时间:9:00-18:30)。
最常用的一些图像处理Matlab源代码#1:数字图像矩阵数据的显示及其傅立叶变换#2:二维离散余弦变换的图像压缩#3:采用灰度变换的方法增强图像的对比度#4:直方图均匀化#5:模拟图像受高斯白噪声和椒盐噪声的影响#6:采用二维中值滤波函数medfilt2对受椒盐噪声干扰的图像滤波#7:采用MATLAB中的函数filter2对受噪声干扰的图像进行均值滤波#8:图像的自适应魏纳滤波#9:运用5种不同的梯度增强法进行图像锐化#10:图像的高通滤波和掩模处理#11:利用巴特沃斯(Butterworth)低通滤波器对受噪声干扰的图像进行平滑处理#12:利用巴特沃斯(Butterworth)高通滤波器对受噪声干扰的图像进行平滑处理1.数字图像矩阵数据的显示及其傅立叶变换f=zeros(30,30);f(5:24,13:17)=1;imshow(f, 'notruesize');F=fft2(f,256,256); % 快速傅立叶变换算法只能处矩阵维数为2的幂次,f矩阵不% 是,通过对f矩阵进行零填充来调整F2=fftshift(F); % 一般在计算图形函数的傅立叶变换时,坐标原点在% 函数图形的中心位置处,而计算机在对图像执行傅立叶变换% 时是以图像的左上角为坐标原点。
所以使用函数fftshift进%行修正,使变换后的直流分量位于图形的中心;figure,imshow(log(abs(F2)),[-1 5],'notruesize');2 二维离散余弦变换的图像压缩I=imread('cameraman.tif'); % MATLAB自带的图像imshow(I);clear;close allI=imread('cameraman.tif');imshow(I);I=im2double(I);T=dctmtx(8);B=blkproc(I,[8 8], 'P1*x*P2',T,T');Mask=[1 1 1 1 0 0 0 01 1 1 0 0 0 0 01 1 0 0 0 0 0 01 0 0 0 0 0 0 00 0 0 0 0 0 0 00 0 0 0 0 0 0 00 0 0 0 0 0 0 00 0 0 0 0 0 0 0];B2=blkproc(B,[8 8],'P1.*x',Mask); % 此处为点乘(.*)I2=blkproc(B2,[8 8], 'P1*x*P2',T',T);figure,imshow(I2); % 重建后的图像3.采用灰度变换的方法增强图像的对比度I=imread('rice.tif');imshow(I);figure,imhist(I);J=imadjust(I,[0.15 0.9], [0 1]);figure,imshow(J);figure,imhist(J);4直方图均匀化I=imread('pout.tif'); % 读取MATLAB自带的potu.tif图像imshow(I);figure,imhist(I);[J,T]=histeq(I,64); % 图像灰度扩展到0~255,但是只有64个灰度级figure,imshow(J);figure,imhist(J);figure,plot((0:255)/255,T); % 转移函数的变换曲线J=histeq(I,32);figure,imshow(J); % 图像灰度扩展到0~255,但是只有32个灰度级figure,imhist(J);5模拟图像受高斯白噪声和椒盐噪声的影响I=imread('eight.tif');imshow(I) ;J1=imnoise(I,'gaussian',0,0.02); % 叠加均值为0,方差为0.02的高斯噪声,可以用% localvar代替figure,imshow (J1);J2=imnoise(I,'salt & pepper',0.04); % 叠加密度为0.04的椒盐噪声。
figure,imshow(J2);6采用二维中值滤波函数medfilt2对受椒盐噪声干扰的图像I=imread('eight.tif');imshow(I) ;J2=imnoise(I,'salt & pepper',0.04); % 叠加密度为0.04的椒盐噪声。
figure,imshow(J2);I_Filter1=medfilt2(J2,[3 3]); %窗口大小为3×3figure,imshow(I_Filter1);I_Filter2=medfilt2(J2,[5 5]); %窗口大小为5×5figure,imshow(I_Filter2);I_Filter3=medfilt2(J2,[7 7]); %窗口大小为7×7figure,imshow(I_Filter3);7采用MATLAB中的函数filter2对受噪声干扰的图像进行均值滤波[I,map]=imread('eight.tif');figure,imshow(I);title('original')J1=imnoise(I,'gaussian',0,0.02); % 受高斯噪声干扰M4=[0 1 0; 1 0 1; 0 1 0];M4=M4/4; % 4邻域平均滤波I_filter1=filter2(M4,J1);figure,imshow(I_filter1,map);M8=[1 1 1; 1 0 1; 1 1 1]; % 8邻域平均滤波M8=M8/8;I_filter2=filter2(M8,J1);figure,imshow(I_filter2,map);8图像的自适应魏纳滤波[I,map]=imread('eight.tif');figure,imshow(I);title('original')J1=imnoise(I,'gaussian',0,0.02); % 受高斯噪声干扰[K noise]=wiener2(J1, [5 5]);figure,imshow(K);9运用5种不同的梯度增强法进行图像锐化[I,map]=imread('3-22.jpg');imshow(I,map);I=double(I);[Gx,Gy]=gradient(I); % 计算梯度G=sqrt(Gx.*Gx+Gy.*Gy); % 注意是矩阵点乘J1=G;figure,imshow(J1,map); % 第一种图像增强J2=I; % 第二种图像增强K=find(G>=7);J2(K)=G(K);figure,imshow(J2,map);J3=I; % 第三种图像增强K=find(G>=7);J3(K)=255;figure,imshow(J3,map);J4=I; % 第四种图像增强K=find(G<=7);J4(K)=255;figure,imshow(J4,map);J5=I; % 第五种图像增强K=find(G<=7);Q=find(G>=7);J5(Q)=255;figure,imshow(J5,map);10图像的高通滤波和掩模处理[I,map]=imread('blood1.tif');imshow(I,map);H2=[-1 -1 -1;-1 -9 -1;-1 -1 -1];J1=filter2(H2,I); % 高通滤波figure,imshow(J1,map);I=double(I);M=[1 1 1;1 1 1;1 1 1]/9;J2=filter2(M,I);J3=I-J2; % 掩模figure,imshow(J3,map);11利用巴特沃斯(Butterworth)低通滤波器对受噪声干扰的图像进行平滑处理I=imread('Saturn.tif');imshow(I);J1=imnoise(I,'salt & pepper'); % 叠加椒盐噪声figure,imshow(J1);f=double(J1); % 数据类型转换,MATLAB不支持图像的无符号整型的计算g=fft2(f); % 傅立叶变换g=fftshift(g); % 转换数据矩阵[M,N]=size(g);nn=2; % 二阶巴特沃斯(Butterworth)低通滤波器d0=50;m=fix(M/2); n=fix(N/2);for j=1:Nd=sqrt((i-m)^2+(j-n)^2);h=1/(1+0.414*(d/d0)^(2*nn)); % 计算低通滤波器传递函数result(i,j)=h*g(i,j);endendresult=ifftshift(result);J2=ifft2(result);J3=uint8(real(J2));figure,imshow(J3); % 显示滤波处理后的图像12利用巴特沃斯(Butterworth)高通滤波器对受噪声干扰的图像进行平滑处理I=imread('blood1.tif');imshow(I);f=double(I); % 数据类型转换,MATLAB不支持图像的无符号整型的计算g=fft2(f); % 傅立叶变换g=fftshift(g); % 转换数据矩阵[M,N]=size(g);nn=2; % 二阶巴特沃斯(Butterworth)高通滤波器d0=5;m=fix(M/2);n=fix(N/2);for i=1:Mfor j=1:Nd=sqrt((i-m)^2+(j-n)^2);if (d==0)h=0;elseh=1/(1+0.414*(d0/d)^(2*nn));% 计算传递函数endresult(i,j)=h*g(i,j);endendresult=ifftshift(result);J2=ifft2(result);J3=uint8(real(J2));figure,imshow(J3); % 滤波后图像显示。
