IQView用户使用手册
IQview测试介绍

Байду номын сангаас
接收灵敏度 无线传输的接收灵敏度类似于人们沟通交谈时的听力,提高 信号的接收灵敏度可使无线产品具有更强地捕获弱信号的能力。这 样,随着传输距离的增加,接收信号变弱,高灵敏度的无线产品仍 可以接收数据,维持稳定连接,大幅提高传输距离。普通11g产品 可以接收数据,维持稳定连接,大幅提高传输距离。普通11g产品 的接收灵敏度一般为-85dB,目前市面上的无线产品接收灵敏度最 的接收灵敏度一般为-85dB,目前市面上的无线产品接收灵敏度最 高可达-105dB,比普通产品提高了20dB。每增加3dB,接收灵敏度 高可达-105dB,比普通产品提高了20dB。每增加3dB,接收灵敏度 提高一倍。在保证达到所要求的误比特率的条件下,接收机所需要 的最小输入光功率 。
各参数指标
6.接受灵敏度 6.接受灵敏度
11b 11g
谢谢! 谢谢!
IQview针对射频部分的测试 IQview针对射频部分的测试
11b
IQview针对接受部分的测试 IQview针对接受部分的测试
RX测试环境拓扑图:
IQview针对接受部分的测试 IQview针对接受部分的测试
测试接收灵敏度的测试项目,需要用到 Vector Signal Generator 工具
Cable线衰减测量 Cable线衰减测量
1.效验测试环境的Cable Loss 1.效验测试环境的Cable 如右图架好环境 启动IQdebug.exe按如下 启动IQdebug.exe按如下 界面量出线材衰减。 1)用 5 处的值减去 9 处的 值就是线材的衰减。 2)此处为 -10 - (-14.7) 14.7) = 4.7 , 3)4.7 为上图中红线部分的 线材的衰减。
WIFI仪器操作说明_V01
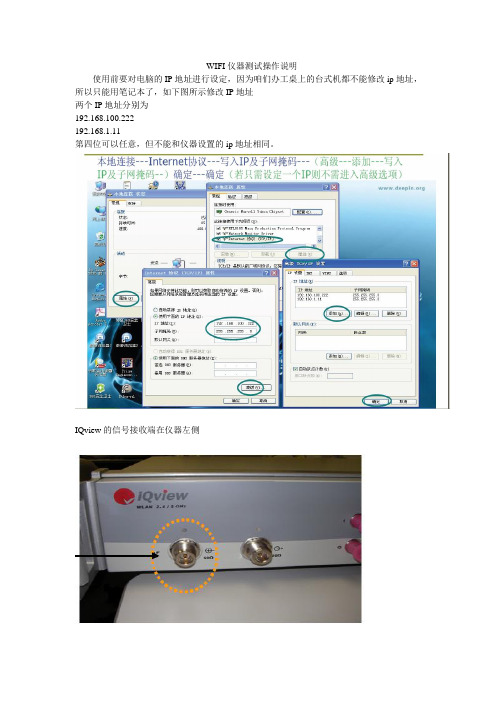
WIFI仪器测试操作说明
使用前要对电脑的IP地址进行设定,因为咱们办工桌上的台式机都不能修改ip地址,所以只能用笔记本了,如下图所示修改IP地址
两个IP地址分别为
192.168.100.222
192.168.1.11
第四位可以任意,但不能和仪器设置的ip地址相同。
IQview的信号接收端在仪器左侧
用于测试接收灵敏度的信号接收端在仪器左侧另一个位置
打开仪器控制软件,如果报出错误:
就要修改软件的IP地址设置,选定setup----parameters
仪器的IP地址设定通常是192.168.1.254或者是192..168.100.254,说明书中有提到。
软件界面如下图所示:
发射测试界面说明
1。
测试界面
频谱模板,功率幅度统计
EVM,平均信号功率,频率误差测试
频谱平坦度,本振动泄露
相位噪声,相位误差
功率上升沿,下降沿时间:
IQ信号图:
接收测试:
1。
控制手机进入接收测试状态.,设定好测试信道和速率
2。
仪器控制的VSG界面上,设定好信道。
3。
设定好调制方式,发射功率和一次性发射数据包数量。
4。
手机开始接收测试包,点击VSG界面的发包按钮,。
之后读取手机收到的包个数,(发包总数-收到的包数)/发包总数=丢包率。
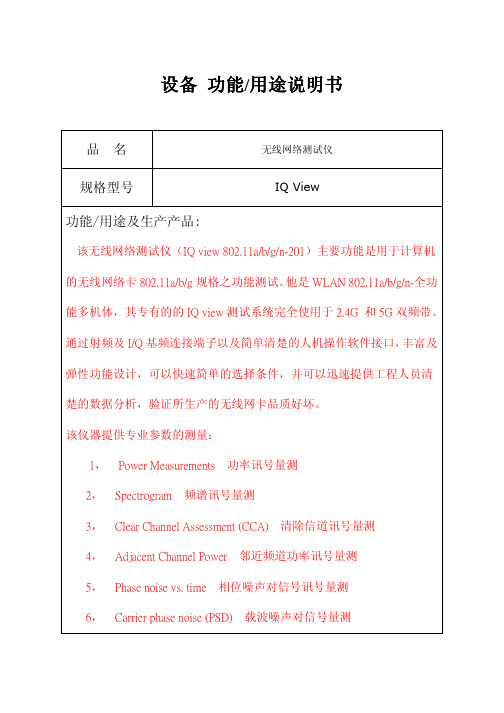
IQview功能说明书

设备功能/用途说明书品名无线网络测试仪规格型号IQ View功能/用途及生产产品:该无线网络测试仪(IQ view 802.11a/b/g/n-201)主要功能是用于计算机的无线网络卡802.11a/b/g规格之功能测试。
他是WLAN 802.11a/b/g/n-全功能多机体,其专有的的IQ view测试系统完全使用于2.4G 和5G双频带。
通过射频及I/Q基频连接端子以及简单清楚的人机操作软件接口,丰富及弹性功能设计,可以快速简单的选择条件,并可以迅速提供工程人员清楚的数据分析,验证所生产的无线网卡品质好坏。
该仪器提供专业参数的测量:1,Power Measurements功率讯号量测2,Spectrogram频谱讯号量测3,Clear Channel Assessment (CCA)清除信道讯号量测4,Adjacent Channel Power邻近频道功率讯号量测5,Phase noise vs. time相位噪声对信号讯号量测6,Carrier phase noise (PSD)载波噪声对信号量测7,Integrated Phase Noise整体噪声号量测8,Error Vector Magnitude Calculation (EVM)误差相量值计算量测9,Frequency error during short training sequence传递顺序频率误差讯号量测10 Short training sequence IQ Pretzel IQ 传递顺序讯号量测11,Phase Error (I-Q phase error) 相位误差讯号量测12,Amplitude Error (I-Q amplitude error)振幅误差讯号量测13,Spectral Flatness, Spectral Mask/PSD频谱平坦度波罩功率讯号量测主要用途﹕对符合802.11a/b/g/n之协定的无线网络通讯设备进行测试。
IQview使用说明

Menu Items Save PSDU data
Description
Saves the captured data of the packet to a text file. Two options exist: • Packet Info PSDU: Saves the data of the complete packet. • PSDU: Saves the data of the PSDU (data) portion of the packet only
Main Menu-File Menu
Menu Items Load Default Setup Exit
Descriptionngs for the application. Exits the program.
Software operation-IQ Signal
Software operation-IQ Signal
Main Menu-Setup Menu-
parameters
OFDM Optimization Parameters
Description
192.168.100.X, 其中X是1到253之間的任意一個整數 (IQview的該位址是254) 5. 在 子网掩碼 一欄中輸入255.255.0.0 點繫 確定 , 便完成設置
IQview安裝與設定
安裝IQsignal 802.11 Tester 測試軟件
插入 IQview Applications CD-ROM 光盤, 窗口會出現 安裝畫面
Software operation-IQ Signal
IQ Signal主界面-功能畫 面
Top-Right測量界面
Software operation-IQ Signal
QlikView使用文档

QlikView使用文档QlikView使用文档QlikViewll使用文档编写:叶坤审核:版本:QlikViewll日期:2015年04月17日QlikView使用文档本文档以一个简单的实例来介绍QlikViewll的使用,由于编者也是初学,不足之处,敬请指正。
1,创建新工作表QlikView引廉女Mrt t HfM 料5 B L'當:AH■ ■ ■IT已莖L•:" jtvi ■hlU礼打甲—n 心 rJr, TI J点击右下方新建文档或者点击工具栏中的新建按钮(红色框标注),创建一个新的工作表,如下图首先打开QlikView11,显示界面如下ltdJ am gi am 艸斗—_/ 1 . J如下,就创建了一个新工作表2QlikView使用文档'!■ . I r仕辛” LQvJl■ L—£ 1f | =rf: ? i Hii f 汗吐:u 工r:* iiT*叫k- i,!« r *J i —J 岂H d;」• ■・口i i; n '* J・兰星■今鼻 r 5^ ( ■•‘21甘4 L 丄Ililfr<祕I伯BE 甲2,生成数据抽取脚本点击工具栏中编辑脚本按钮,如下图紫色框所示:;」月」且丄丑・」連』首- 叨/[匠弹出如下脚本编辑对话框43QlikView 使用文档选择数据源有几种:1,连接数据库(点击连接按钮输入id 和密码),这里由于没有可以连接的数据库就不往下介绍了。
2,选择本地的excel 表格文件。
这里我们选择第二种数据加载方式:点击对话框中的表格文件按钮加载数据如下图点击完成按钮完成数据文件加载弹出如下窗口 :其中自动生成了脚本(紫色框内)QlikView 使用文档选择我们要加载的数据文件Sales Address.xls ,然后点击打开弹出如下窗口k…dL -<5->>1L-M --- - i I - I x L 吐I ・LJJJA T;irt PTI =: H — t-=.4111 f - a j・--»寸]Lj —kb : .- - —■ -F ■.t v. ■,2ii『•a -r ri ■/ ■>■ ;h lta -< : Ii-Fif-J | ZIP II w II 科 II *■» I然后依照上述加载数据文件的步骤将 Sales Orders.xls 文件加载进来(同时也 会产生加载数据的脚本),如下图所示:5QlikView 使用文档为了方便区分字段意思,我们可以在脚本中给字段名字赋予中文意思,如下图3, 加载数据点击上图所示的重新加载的按钮,这是第一次加载,会弹出如下窗口点击确定按钮,将文件名保存为 demo2如下图中紫色框所示QlikView 使用文档dLj 1. *・• 2 •廿r»去”.严!二-i-,*r | W 干-=二fi弊 *TTg—*o.S-ftiren tcifFrt —E=¥守JkH 孵 童l>n 心g 他niV^lT L&4JQi lVifwE A.tberTWl.^w溺ll/MJf I%#石CL 片■彳.耶抽eVIAl UiSD*1 丁的 iX中L"ZTitr ■即X 仰(J L 込圧FF D "*1 j J 尸|| if*p.qwMS315^fl5 H :W■工m■4 K p 1 1■辭,卅 lew口 w 讯.中<q 时io? 叮2 J ;4v 」'pq dJ 匕 'rtces cj■ q-Aqw U 56i * ■—WtDfN■ nvSqv#刃萨#叫・r m口韦、N 丹 Y J D Un 口_ . … ili.:1C 亞Hl 亠ril<_____________________________ J点击保存按钮,弹出如下界面如上图所示就是加载进来的所有字段,点击确定按钮,数据就加载进来了, 转换到如下界面:7QlikView使用文档山-.■ rM « [Q/,21 1 惬"I 三」嚼I _n_ *、*理迪丹卫:m.rj-. TM.-AJ mm r*:-rTtw-j E:F- r 卫,1 J 丿 & J. ^ |> y f i( I : J »L ■_ 二1 … 丿;和i"』』犬里JI三逼匸Ju L yj| -jK [_ -A-土上厲盘这里按CTRL+T键可以查看加载进来的表的结构图4,创建列表框首先先介绍下列表框的作用,它把一个字段的所有值罗列出来,方便用户对该字段的值进行关联查询,我们把所有的表加载进来以后,有两种方式创建列表框。
O R A C L E Smart View用户手册说明书

F U S I O N E D I T I O NR E L E A S E11.1.2C ONTENTS I N B RIEFOverview (2)Smart View Panel (2)Context-Sensitive Ribbons (2)Integration with Outlook (3)Redesigned Options Dialog Box (3)Planning Features (4)Financial Management Features (5)Smart View and Disclosure Management Integration (5)New VBA Functions (5)EPM System New Features (6)OverviewThis document describes the new features introduced in Oracle Hyperion Smart View for Office, Fusion Edition Release 11.1.2.It is our goal to make Oracle products, services, and supporting documentation accessible to the disabled community. Smart View Release 11.1.2 supports accessibility features, which are described in Appendix A of the Smart View for Office User's Guide.Smart View PanelFrom the Smart View Panel, you can manage data source connections, access data and task lists, create reports, and open Oracle Crystal Ball Enterprise Performance Management, Fusion Edition workbooks if you are licensed for Crystal Ball EPM.The Smart View Panel, opened from the Smart View ribbon, is displayed by default on the right side of the Microsoft Office application. You can move, re-size, or close the Smart View Panel from the down arrow in the title bar.The Smart View Panel contains the following panes:l Home: A panel that displays links to shared connections and private connections as well asa list of recently used items - ad hoc grids, data forms, and tasks - which you can click toestablish a connection.l Shared Connections: A drop-down menu of available connections from Oracle's Hyperion®Shared Services and a tree view of the contents of the currently selected connection.l Private Connections: A drop-down menu of available connections saved on the local computer and a tree view of the contents of the currently selected connection. You can also enter a URL to connect directly to a data source here.l Task Lists: A tree list of tasks from which you can manage your tasks. This pane opens only when you select a task list from shared connections or private connections.l Simulation Workbook: (only if you are licensed for Crystal Ball EPM) A tree list of available Oracle Crystal Ball Enterprise Performance Management, Fusion Edition workbooks that you can open in Smart View.l Action Panel: A list of operations available based on the selection in the shared connection.private connection, or task list tree list.Context-Sensitive RibbonsSmart View operations in Microsoft Office applications are available through ribbon commands. The Smart View ribbon, which contains commands for common Smart View operations, is always present. When you connect to a data source (other than Oracle's Hyperion Reporting and Analysis), the corresponding data source ribbon is also displayed. For Oracle Hyperion Planning, Fusion Edition, Oracle Hyperion Financial Management, Fusion Edition, and Oracle's Hyperion® Enterprise®, when you enter ad hoc analysis, the data source ribbon is automatically 2New Featuresreplaced by its ad hoc version. Each ribbon displays only the commands permitted for that datasource, mode, and Office application.These are the new ribbons:l Smart Viewl Essbasel Planningl Planning Ad Hocl HFM (Financial Management )l HFM Ad Hocl Enterprise (Oracle's Hyperion® Enterprise®)l Enterprise Ad Hocl OBIEE (Oracle Business Intelligence Enterprise Edition)Note:Microsoft Office 2003 users can still access Smart View operations via menus.Integration with OutlookPlanning and Financial Management task lists are now integrated into Outlook, so users canintegrate their tasks into Outlook tasks and perform these tasks from within Outlook. Data formtasks are seamlessly launched from Outlook into the familiar Excel interface.Redesigned Options Dialog BoxThe Smart View Options dialog box has been redesigned to make options more easily accessible.Options are organized into categories to provide better user experience and accommodateprovider-specific options. Like other components of Smart View in this release, options areavailable to users only if they are supported by the currently connected data source.The following new options are available from the Options dialog box:l Change the language in which Smart View is displayed without having to re-install Smart Viewl In shortcut menus, choose whether to display Smart View and Microsoft items or only Smart View itemsl Reset all options to default setting with a click of the Reset buttonNew Features3Figure 1 Options Dialog BoxPlanning FeaturesThis release of Smart View supports a greatly expanded set of Planning functionality.l Planning task lists are now integrated into Outlook, so planners can integrate their tasks into Outlook tasks, and can perform these tasks from within Outlook. Planning data form tasks are seamlessly launched from Outlook into the familiar Excel interfacel Planning task lists are available in Office, including task status and task reports; users can perform tasks in Excel, and have them automatically synchronized with the Webl All process management end-user functionality can be accessed from Outlook and Excel l Data validation, including validation indicators and messagesl The ability to monitor the status of Planning jobs in the Job Consolel Composite data forms in Microsoft Office with shared dimensions that are automatically synchronized across multiple data formsl Mass Allocate and Grid Spread for spreading valuesl Copy data across versions for scenario-entity combinationsl Dynamic user variables that allow end users to select and change user variable values directly in data formsl Custom right-click menus for data and metadatal Member formula display4New Featuresl Setting Planning user preferences within Smart Viewl Data forms enabled for ad hoc allow users to slice data and save a slice to create reports or share with other usersFor information about Planning, see the Oracle Hyperion Planning New Features and OracleHyperion Planning User's Guide.Financial Management FeaturesIn this release, Smart Slices are available toFinancial Management users who connect to SmartView. Using Smart Slices, Financial Management users can create and save reports from theReport Designer and cascade reports across a selected dimension.Smart View and Disclosure Management IntegrationCustomers who use Smart View in Excel or Word to assemble financial reports can also useOracle Hyperion Disclosure Management, which allows you to assemble a reporting packagefor submission to a regulatory agency that includes financial statements, as well as supportingschedules and commentary which may exist in Excel, Word, or an Oracle Hyperion FinancialReporting, Fusion Edition report.The first release of Oracle Hyperion Disclosure Management offers a complete XBRL creationand management solution with Enterprise level XBRL mapping; XBRL Taxonomy management,editing and viewing; and Instance document creation, validation and viewing. While viewingSmart View queries in Word or Excel, users can perform data source level mapping with theXBRL Taxonomy Mapping Tool, that allows for re-usable taxonomy element mapping withinOracle Hyperion Financial Management, Fusion Edition, Oracle Hyperion Planning, FusionEdition, and Oracle Essbase.New VBA FunctionsThis release features the following new VBA functions.l HypFindMemberEx retrieves member information like dimension, alias, generation and level names.l HypSetAsDefault creates a connection default.l HypOpenForm opens a data form.l HypSetPages sets page members for the selected sheet.l HypGetPagePOVChoices returns the available member names and member description fora given dimension.l HypDeleteMetaData deletes Oracle Hyperion Smart View for Office, Fusion Edition metadata from the workbook.New Features5l HypGetSharedConnectionsURL returns the Shared Connections URL to be used (also shown in the Options dialog box).l HypSetSharedConnectionsURL sets the Shared Connections URL in the config file and Options dialog box.l HypIsConnectedToSharedConnections checks whether SmartView is connected to Shared Connections.EPM System New Featuresl Most Oracle Hyperion Enterprise Performance Management System products have adopted Oracle Diagnostic Logging (ODL) as the logging mechanism. The ODL framework provides uniform support for managing log files, including log file rotation, maximum log file size, and the maximum log directory size. For more information, see the “Using EPM System Logs” chapter of the Oracle Hyperion Enterprise Performance Management System Installation and Configuration Troubleshooting Guide.l Oracle Configuration Manager (OCM) integrates with My Oracle Support and provides configuration information for Oracle software. It assists in the troubleshooting,maintenance, and diagnostics of your EPM System deployment. For more information about Oracle Configuration Manager see the Oracle Hyperion Enterprise PerformanceManagement System Installation and Configuration Guide.l With this release, many EPM System products support hostnames that resolve to IPv6 addresses. See the Oracle Hyperion Enterprise Performance Management System Certification Matrix. IPv4 support (both hostname and IP address) remains unchanged from earlier releases.l Oracle Hyperion Enterprise Performance Management System supports the following types of SSL configurations:m Full SSL Deployment (including data access)m SSL Terminating at the Web Serverm SSL Accelerators (Off-loading)m Two-way SSLFor more information on the SSL configurations, see the Oracle Hyperion EnterprisePerformance Management System Security Administration Guide.6New FeaturesNew Features7COPYRIGHT NOTICESmart View New Features, 11.1.2Copyright © 2004, 2010, Oracle and/or its affiliates. All rights reserved.Authors: EPM Information Development TeamThis software and related documentation are provided under a license agreement containing restrictions on use and disclosure and are protected by intellectual property laws. Except as expressly permitted in your license agreement or allowed by law, you may not use, copy, reproduce, translate, broadcast, modify, license, transmit, distribute, exhibit, perform, publish, or display any part, in any form, or by any means. Reverse engineering, disassembly, or decompilation of this software, unless required by law for interoperability, is prohibited. The information contained herein is subject to change without notice and is not warranted to be error-free. If you find any errors, please report them to us in writing.If this software or related documentation is delivered to the U.S. Government or anyone licensing it on behalf of the U.S. Government, the following notice is applicable:U.S. GOVERNMENT RIGHTS:Programs, software, databases, and related documentation and technical data delivered to U.S. Government customers are "commercial computer software" or "commercial technical data" pursuant to the applicable Federal Acquisition Regulation and agency-specific supplemental regulations. As such, the use, duplication, disclosure, modification, and adaptation shall be subject to the restrictions and license terms set forth in the applicable Government contract, and, to the extent applicable by the terms of the Government contract, the additional rights set forth in FAR 52.227-19, Commercial Computer Software License (December 2007). Oracle USA, Inc., 500 Oracle Parkway, Redwood City, CA 94065.This software is developed for general use in a variety of information management applications. It is not developed or intended for use in any inherently dangerous applications, including applications which may create a risk of personal injury. If you use this software in dangerous applications, then you shall be responsible to take all appropriate fail-safe, backup, redundancy, and other measures to ensure the safe use of this software. Oracle Corporation and its affiliates disclaim any liability for any damages caused by use of this software in dangerous applications.Oracle is a registered trademark of Oracle Corporation and/or its affiliates. Other names may be trademarks of their respective owners.This software and documentation may provide access to or information on content, products, and services from third parties. Oracle Corporation and its affiliates are not responsible for and expressly disclaim all warranties of any kind with respect to third-party content, products, and services. Oracle Corporation and its affiliates will not be responsible for any loss, costs, or damages incurred due to your access to or use of third-party content, products, or services.。
iqview测试指导书
平坦度(Spectral Flatness)
平坦度要求蓝色部分不要超出红色部分且蓝色部分波动越小越好。
图6-1平坦度截图
频谱模板(Spectrum Mask)
下图中选”Spectrum Mask”可以测量Mask,要求蓝色部分不允许越出红线之外,如果有一个点超出,就fail。
5、发射测试
测试环境如下所示
图5发射测试设备连接图
(2)然后通过产品的控制软件,选定一个channel和rate,发送信号。
(3)打开IQsignal.exe,显示如下界面
图6 IQ Signal VectorSignal Analyzer软件界面
位置1:选择channel,注意要和产品设置的channel一致
(1)按下图架好环境
图3校验衰减设备连接图
(2)启动IQdebug.exe可以看到如下界面,
图4IQ Debug软件界面
位置1: 。
位置2:默认选择的是Monitor(default),这里我们选择control,
位置3/8:3和8处分别选择VSG ON 2和VSA ON 1选项
位置4/6:4和6处填入要测试信道的中心频率
位置5:5处填入发射信号功率(一般填入-10dBm便于计算)
位置7:7处填入图中所示选项。
(3)各项参数配置好后按如下界面量出线材衰减。
用 5 处的值(IQView发射出来的信号功率)减去 9 处的值(IQView接收到的信号的功率)就是线材的衰减。
此处为 -10 dBm- (-14.7dBm)= 4.7dB,4.7dB即为射频线的衰减。
目前在我司常要用到IQView进行测试的项目包括:发射功率、EVM、频偏、频谱模板、接受灵敏度。
IQView测试指导书
IQView测试指导书1、IQView简介IQview是litpoint公司生产的产品,能够针对802.11a/b/g进行RF测试,该产品主要分两个模块:信号分析和信号产生,测试频段包括2.4G-2.5Ghz,4.9Ghz-6.0Ghz,可以满足我们公司的B/G产品和11A产品测试,测试项目包括:发射功率、EVM、频偏、频谱模板、平坦度、载波泄露、接受灵敏度等,最大接受功率为30dbm,支持的调制模式有BPSK、QPSK、16QAM、64QAM、CCK。
目前在我司常要用到IQView进行测试的项目包括:发射功率、EVM、频偏、频谱模板、平坦度、接受灵敏度。
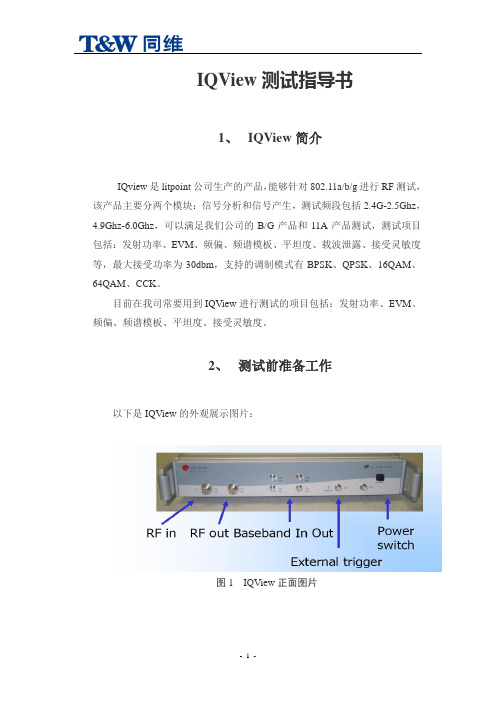
2、测试前准备工作以下是IQView的外观展示图片:图1 IQView正面图片图2 IQView背面图片测试产品的发射性能,需要连接到图1中的RF in,测试产品的接收性能需要连接到图1中的RF out;测试前,首先把IQView通过接上电源,然后用交换网线连接PC1和IQview的10/100Ethernet口(如图2所示),确认连接无误后,给IQView上电。
IQView连接无误后即可以进行下边一系列的测试。
(1)测试设备列表在每次测试中所要用到的主要测试设备如下表所示:测试设备列表項次设备名称规格数量备注1 PC 12 IQView 13 屏蔽箱 14 RF Cable 35 串口线06 交换网线 17 平行网线 18 固定衰减器10dB * 1 或20 dB * 1 19 条码 1 无线部分的MAC10 电源DC 12A 1.2A 1(2)IQ软件列表IQ view使用的软件有 1.2.5版本和 1.1.1版本,前一个版本含IQdebug.exe和IQsignal.exe软件,1.IQdebug.exe 设备自带软件,控制设备的程序,用来效验线材的衰减。
2.IQsignal.exe 设备自带软件,可以发送无线信号和接收并分析信号,主要使用这个程序来分析抓到的信号。
IQVIEW_WIFI测试仪的使用

IAC Confidential
8
Innovating Customer Value
Debug information shown for connected testor
IAC Confidential
9
Innovating Customer Value
Data capture output window
IAC Confidential
7
Innovating Customer Value
a. Connection controls and mode selection
a. Main output window b. VSA controls c. VSG controls d. Data capture controls e. Data capture output window f. Monitor update mode controls g. Analysis controls h. Main output window frame selection i. Main menu
14
Innovating Customer Value
IAC Confidential
15
Innovating Customer Value
IAC Confidential
16
Innovating Customer Value
IAC Confidential
17
Innovating Customer Value
IAC Confidential
6
Innovating Customer Value
The IQdebug applications is a software tool to be used in conjunction with one of litepoint’s WLAN test instruments. It provides an easy-to-use graphical user interface to monitor the status of the test instrument. The graphical user interface also gives access to the basic control and measurement capabilities of the WLAN test instrument.
IQview 使用说明
IQview 使用说明IQview 使用说明1. 简介在这一部分,您可以简要介绍 IQview 的概述、目的和优势。
2. 安装与配置2.1 系统要求这一部分详细说明了 IQview 的系统要求,包括操作系统版本、硬件需求等信息。
2.2 安装步骤提供了 IQview 安装的详细步骤和注意事项,包括、解压缩、运行安装程序等。
2.3 配置文件描述了如何进行 IQview 的基本配置,包括设置语言、主题、默认选项等。
3. 用户界面3.1 主界面详细介绍 IQview 的主界面,包括菜单栏、工具栏、工作区等元素的功能和使用方法。
3.2 窗口布局说明了如何进行 IQview 窗口布局的调整和保存,以适应用户的个性化需求。
3.3 快捷键列出了 IQview 的常用快捷键,提供了快速操作和提高工作效率的方法。
4. 数据导入与导出4.1 导入数据这一部分指导用户如何将数据导入到 IQview 中,支持的数据格式和导入步骤等信息。
4.2 导出数据说明了如何将 IQview 中的数据导出到文件或其他外部系统,包括导出格式和导出设置的选项。
5. 数据分析与可视化5.1 数据分析提供了 IQview 中可用的数据分析功能,包括统计分析、图表、数据筛选和排序等。
5.2 可视化介绍了 IQview 中的可视化工具和图表类型,如折线图、柱状图、散点图等,以及其使用方法和设置。
6. 报告与分享6.1 报告解释了 IQview 中如何报告,包括报告模板的选择、内容定制、导出格式等内容。
6.2 报告分享提供了报告分享的方法和平台选项,如通过邮件发送、导出为 PDF 或 Excel 文件等。
7. 常见问题与故障排除这一部分收集并回答了用户常见的问题和遇到的故障,提供了解决方法和相关支持资源的。
8. 附件本文档涉及到的附件可在以下中:[地址]9. 法律名词及注释9.1 法律名词解释:- 法律名词1:解释1- 法律名词2:解释29.2 注释:- 注释1:相关解释或说明 - 注释2:相关解释或说明。
QlikView中文教程v8_part1_WORKING+WITH+QLIKVIEW
QlikView Tutorial V8和QlikView一起工作WORKING WITH QLIKVIEW第一课进入QlikViewLESSON 1 MAKING QUERIES IN QLIKVIEW打开文档Opening the document1 启动QlikView.2 File->Open.3 在路径C:\Program Files\QlikView\Tutorial\Working with QlikView或者是你自定义QlikView程序的安装路径下,选择Tutorial.qvw,点击Open.选取Selections1 选择Geography标签,打开Geography面板.2 在列表框Country中,选择China.绿色高亮部分,代表了你选中的value.在面板中所有其他的objects会即刻显示相关联的结果.3 使用Ctrl键能够帮你选择多个不连续的values.4 使用Shift键能够帮你选择多个连续的values.关联选取Combining selections1 在工具栏中点击Clear,清除你之前的选取操作.2 选择Sales标签.3 在列表框Customer中找到Captain Cook’s Surfing School,选中它.4 在列表框Country中以白色显示了7个相关的values.选择Monaco.你发现在列表框Salesman中只有Joe Cheng这个value同时与Captain Cook’s Surfing School 和Monaco 相关查看你的选取Keeping track of your selections在Geography面板中,你能找到一个Current Selections Box.这个面板对象列表能够显示当前选择操作的信息.1 在列表中随意地选择一些values,观察Current Selections Box中如何反应相应的信息.当然,不是所有的QlikView文件中的面板都拥有Current Selections Objects,无论何时你都可以使用Current Selections Window来查看自己选择操作的信息.2 在工具栏中点击Current Selections.出现一个新的窗口,显示了与Current Selections Box同样的信息.移动选取Moving selections1 在工具栏中点击Clear,清除你之前的选取操作.2 依旧在Geography面板.在列表框Country中,选择China.3 使用↓键选择China后面的一个value,使用↑键选择China前面的一个value.文本和数字查询Text searches and numeric searchesText searches1 在工具栏中点击Clear,清除你之前的选取操作.2 选中列表框Country的标题,标题变成深绿色.3 输入"ch".现在列表显示处关键字"ch"经模糊查询后的结果.细心的你,一定观察到"ch"被包含进前后2个"*"就像这样-->"*ch*",QlikView中"*"用来表示多个字符,"?"用来表示单个字符.经试验QlikView貌似未提供转义字符的支持???通常,你也可以使用工具栏中的Search,Edit菜单中的Search选项,或F3来打开查询窗口.4 敲击Enter键将选择所有查询出的结果.Numeric searches1 在工具栏中点击Clear,清除你之前的选取操作.2 选中列表框Area(km.sq)的标题.3 输入"<100".4 只有小于100的numbers被显示出来,按Enter键选中他们.Examples:a* will find all values that begin with the letter a.*b* will find all values that contain the letter b.<10 will find all numeric values smaller than 10.>10 will find all numeric values larger than 10.>10<100 will find all numeric values between 10 and 100.10* will find all values (numeric or text) beginning with 10.选取上一步或前一步Stepping back or forward in the list of selections1 点击工具栏中的Back按钮,会显示上一步的操作记录.2 再次点击Back按钮,显示上上一步的操作记录.3 点击工具栏中的Forward按钮,会显示前一步的操作记录.锁定选取与解锁选取Locking and unlocking selections1 选取另一个值后之前的选取将会消失.为了避免这种情况,可以将之前的选取锁定,被锁定的单元将呈现蓝色.一个与已锁定选取发生冲突的选取将不会被执行.2 选择工具栏中的Lock,Edit菜单中的Lock选项.这将锁定所有的选取,以防止他们被不小心清除.3 尝试选取其他列表中的value,不相关联的value的选取是不会被执行的.4 选择工具栏中的Unlock,Edit菜单中的Unlock选项.这将解除所有选取的锁定.选取书签Selection bookmarks它能够保存一个选取设置,供今后使用.1 选取一个或数个values,此时选择工具栏中的Add Bookmark.创建bookmarks时使用当前日期作为default name(显示在Create Bookmart对话框中).第一个被创建的书签将使用number 1,第二个使用number 2,等等.当然,你也可以自定义Bookmark Name.2 输入Bookmark Name,点击OK.3 在Bookmarks菜单中,选取刚刚创建的书签.将看到之前保存在这个书签中的选取设置.最多能够保存10个书签.保存你的作业Saving your work1 选择File菜单中的Save As保存一个备份文档.2 在File name中填入MyTutorial.qvw或是相似的文件名,点击Save.3 选择File菜单中的Close,关闭当前文件.3 选择File菜单中的Exit,退出程序.检查你的作业Checking your workWorking with QlikView文件夹下除了Tutorial.qvw之外还有一个TutorialFinal.qvw,这个是已完成的示例,你可以将它打开做个比较.第二课处理面板和面板对象LESSON 2 HANDLING SHEETS AND SHEET OBJECTS打开文档Opening the document1 启动QlikView.2 打开MyTutorial.qvw.如果你最近使用过,你能够在Recently Opened Documents标签里找到它.介绍Presentation掌握所有不同的对象,在QlikView中面板是由众多最基本的要素所构成.一个文件通常包含数个面板,以用来完成想要实现的复杂设计布局.一个面板对象能够装载另一个面板.面板之间能够逻辑上关联,换言之,在一个面板上的对象的选取将影响其他所有面板上的对象.面板间的逻辑关联Logical connections between sheets在你的文件中有2个面板:Geography和Sales.Geography是当前活动的面板.1 点击标签Sales.2 在列表框Country中,选择China.China便变成绿色,其他列表中相关的values则以白色显示.3 点击标签Geography,切换到Geography.Geography中的各列表亦做出相关性的选取,显示相关联的values.4 回到Sales.5 在列表框Salesman中,选择Cezar Sandu.你立刻看到Cezar Sandu在法国,德国和蒙古国活动.中国没有在相关联的条目中出现.6 切换到Geography.Geography再度做出关联反应.特别的,当一个大文件中包含许多的选取,一些选取将不可避免地影响面板中的显示结果.添加面板Adding a sheet1 在工具栏中点击Clear,清除你之前的选取操作.2 选择工具栏中的Add Sheet按钮.一个新的面板出现了.3 右键点击新的面板,在出现的菜单中选择Properties,打开Properties对话框.4 在General页,改变Title,把Sheet2改成Customer.5 点击Fields标签.6 这个对话页包含一个可用filds的列表.选择Customer,然后点击Add>按钮.field被移入到显示栏位中,意思是,将会在你的面板中产生一个列表.7 你也可以通过双击fields,将左边的column移动到右边(Fields Displayed in Listboxes).双击Customer ID.8 点击OK,关闭对话框.现在,你创建了一个新的面板,其中包含2个列表.创建一个新的面板用于更改,也可以在一个已经存在的面板上使用右键,然后在出现的菜单中选择Copy Sheet.改变面板的布局设置Changing layout properties for a sheet让新面板的标签使用之前相同的色度.1 在新面板里的空白处点击右键,选择Properties...打开Properties对话框.2 在General页,选择Tab Settings下的Custom Colors,点击Tab Color按钮.打开Color Area对话框.3 选择Base Color下的Fixed,点击有色按钮.4 在颜色对话框中,进行如下设置:色调[Hue]:59 红[Red]:109饱和度[Sat]:139 绿[Green]:168亮度[Lum]:100 蓝[Blue]:455 点击OK,直至关闭所有的对话框.现在你的新面板标签已更新为绿色.使标签上的文字变成白色:To make the tab text white:1 在新面板里的空白处点击右键,选择Properties...打开Properties对话框.2 在General页,选择Tab Settings下的Custom Colors,点击Tab Text Color按钮.打开Color Area对话框.3 选择Base Color下的Fixed,点击有色按钮.4 在颜色对话框中选择白色.5 点击OK,直至关闭所有的对话框.现在你的新面板标签的文字已更新为白色.移动面板Moving a sheet新的面板Customer,包含列表框Customer和Customer ID,该面板位于Sales的右侧.你希望将Customer放到中间的位置:右键单击Customer的标签,在浮动菜单中选择Promote Sheet.现在Customer的位置被放在Geography和Sales中间.善于观察的你,一定发现选项Demote Sheet正好用于执行相反的操作.添加新的面板对象Adding new sheet objects如果你在面板Customer的空白处单击右键,选择New Sheet Object,你将看到一个列表,它包含了所有能够在QlikView中所使用的面板对象.这些面板对象能够支持数据的选取操作,除了按钮,文本对象和线条/箭头对象.所有的面板对象均能被用于选取结果的显示.在早前的课程中我们创建了Customer面板,其中包含2个列表Customer和Customer ID.现在添加第3个面板对象:一个列表,包含了国家信息.1 在面板Customer中的空白处单击右键,选择New Sheet Object下的列表.打开New List Box对话框.2 在General页,从下拉列表Field中选取Country.Country将会自动的作为新列表框标题的名称.如果你喜欢,你也可以在这个页面自定义标题名称.3 点击OK.在你的面板Customer上出现了一个新的列表框Country.在接下来的课程中,会逐一介绍许多重要的面板对象,包括列表.但首先你需要学习如何在面板中呈现和布置面板对象.移动面板对象Moving a sheet object为了移动一个面板对象,你需要用鼠标左键点击面板对象的标签,保持按下状态,拖动它.1 在面板Customer上,移动新的列表框Country.使用CTRL+方向键能够让你一步步微调对象的位置.使用CTRL+SHIFT+方向键能够让你以较大的步伐调整对象的位置.取消布局改变Undo Layout Change取消布局改变是一个非常有用的函数,它能使你取消之前的布局,包括面板对象的移动,大小和删除面板和面板对象的设置.QlikView维护一个布局改变列表.每一个取消布局的改变命令将使你在这个列表里向后一步.你将在之后的操作中使用这个命令.你也可以使用Windows命令CTRL+Z来实现同样的功能.1 取消你之前的布局改变.列表的移动将会一步步倒退.同时选取和移动数个面板对象Selecting and moving several sheet objects simultaneously为了在同一时刻移动数个面板对象,在一开始先得选取它们.操作如下:1 在面板Customer上,使用鼠标左键框选你希望进行移动操作的所有面板对象.被选中的面板对象标题条会变成深色.这说明它们已被选中,处于活动状态.2 使用鼠标左键拖动其中一个已选中的面板对象.所有的面板对象会一起移动.如果这些对象的排列不是很美观,别担心-你可以格式化它们的布局.你也可以使用SHIFT+鼠标左键逐一选取若干个sheep对象.拷贝面板对象Copying sheet objects为了在同一个面板中复制一个面板对象,先选中它,按下Ctrl键,拖动要复制的面板对象,光标处会多显示一个'+',松开鼠标,最后释放Ctrl键.你可以在同一个面板或是不同的面板间任意的对面板对象进行拷贝.在案例中,你希望添加一个面板对象,其拷贝蓝本来自另一个面板中,你能够轻松的完成它.列表框Country,它来自面板Geography:1 将面板Geography设为当前活动状态.2 选中列表框Country,按下Ctrl键.3 拖动列表框Country,至面板Customer的标签处.4 当出现带'+'的圆弧箭头时,释放鼠标,释放Ctrl键.5 切换到面板Customer,复制过来的列表框Country出现在的位置与其蓝本在面板Geography中的位置相同.如果你更喜欢Windows的复制和粘贴命令,它们也能运行得很好.你能在Edit菜单里找到它们.标准的Wimdows快捷方式CTRL+C和CTRL+V也能够正常工作.调整面板对象的大小Sizing a sheet object你可以通过拖拉对象的边框来调它的大小.在面板上排列和分布面板对象Aligning and distributing sheet objects on the sheet在design 工具栏上有若干个命令来帮助调整面板对象的布局.1 选取面板下需要调整布局的列表.2 点击相应的命令按钮即可.Align Left 左对齐Center Vertically 垂直居中Align Right 右对齐ALign Bottom 底对齐Center Horizontally 水平居中Align Top 顶对齐Space Vertically 垂直间隔Space Horizontally 水平间隔Adjust Left 横向自适应Adjust Top 纵向自适应面板对象的最小化与还原Minimizing and restoring a sheet object列表和其他面板对象能够被最小化,操作如下:1 在列表上点击右键,在浮动菜单上选择Properties...2 在Caption页选择Allow Minimize,点击OK.最小化标签出现在列表的右上角.3 点击最小化标签或是双击列表的标题.列表变成一个图标,这个图标可以自有的移动.4 双击图标,恢复列表.你也可以在Caption页选择Allow Maximize来添加最大化的图标,Auto Minimize是自动最小化.自动最小化Auto Minimize自动最小化在特定条件下是实用的命令,用于在给定的时刻只有一个图表在面板中全尺寸显示的时候,其他的图表则自动最小化在面板上.面板Geography上的图表Area和Population均被设置了Auto Minimize.1 双击Population.图表Population展开,Area自动最小化为图标.2 双击Area.图表Area展开,Population自动最小化为图标.删除面板对象Removing a sheet object在面板Customer上有2个Country列表框.你只需要一个:1 右键点击其中一个Country列表框2 选择浮动菜单上的Remove.3 确定你真的要删除它,点击OK.列表在屏幕上消失了.使用DELETE键也能够达到相同的目的.改变面板对象的边框Changing the border of a sheet object1 在列表上点击右键,在浮动菜单上选择Properties...2 选择Layout页.3 在Use Borders下选择边框样式.Border Width处设置边框宽度.4 点击OK.如果你希望所有的面板对象设置成统一的边框,你需要在Setting菜单下的Document Properties中的Layout页进行相应设置.改变面板对象的字体Changing the font of a sheet object1 在列表上点击右键,在浮动菜单上选择Properties...2 选择Font页.3 在Font下选择字体.Font Style处设置字体样式.Size处设置字体大小.4 点击OK.如果你希望所有的面板对象设置成统一的边框,你需要在Setting菜单下的Document Properties中的Font 页进行相应设置.在面板对象间复制字体和边框样式Copying font and border formats between sheet objects1 选择一个面板对象,作为正确格式的来源.2 点击工具栏上的格式刷[Format Painter]按钮.3 点击需要更新的面板对象.该面板对象的样式被更新了.你能够在任何面板对象上使用格式刷[Format Painter].你也能够同时对多个面板对象进行操作.只要点击来源对象,然后双击格式刷[Format Painter],再逐一格式化目标对象.保存,关闭和退出Saving, closing and exiting第三课列表和统计表LESSON 3 LIST BOXES AND STATISTICS BOXES打开文档Opening the document1 启动QlikView.2 打开MyTutorial.qvw.列表框The list box列表是屏幕上出现最常见的对象,包含一列来自数据库的字段值.如果没有足够的空间显示出所有的值,在列表的右侧会出现一个滚动条.一个值在列表里只保留一个,即使这个值在数据库中的栏位里出现过多次.更新列表的选项Changing the properties of a list box每一个sheep对象都有一个properties对话框,包含若干个你能够改变这个对象设置的页面.显示频率Showing frequency你对'有多少国家使用货币卢比[Rupee]?'很感兴趣.1 在工具栏中点击Clear,清除你之前的选取操作.2 切换至面板Geography.3 在列表框Currency上点击右键,在浮动菜单上选择Properties...4 在General页,选择Show Frequency.5 点击OK.现在所有的货币后都跟随了一个数字.货币卢比[Rupee]后的数字是5,说明有5个国家使用它作为货币单位.改变和排列数字Changing the number and order of columns是列表显示若干列:1 清除你之前的选取操作.2 切换到面板Sales.右键点击列表框Day,,在浮动菜单上选择Properties...3 选择Presentation页.4 取消选择Single Column,点击OK.5 拖放Day的边框,直至它已7列显示日期.这些值是按列排序的,换言之,是垂直排列.你也许喜欢这些日期按照行来水平排列.6 右键点击列表框Day,,在浮动菜单上选择Properties...7 选择Presentation页.8 取消选择Order by Column,点击OK.现在这些日期按行水平的排列显示.改变排列类型Changing the sort order在每一个列表中数字存在不同的排列方式.数字通常按照它的值来排序,如果包含文本则按照字母表顺序排列.这些值的排列依照他们的逻辑类型[数据类型]1 在Sales面板上,右键点击列表框Sales,在浮动菜单上选择Properties...2 选择Sort页.列表框Sales就像我们看到的那样,按照数据类型[State]和数值升序排列.列表会选择合适的排列种类. 因此,不用特别地选取,列表框Sales里的这些值已按照数值升序排列[Ascending].亦可自定义排列类型,但数据类型[State]将最终决定排序的种类.3 保持Numeric Value为选中状态,但改变排列方式为降序排列[Descending].4 点击OK.现在最高的数字排在了顶部,改变数字的显示格式Changing the number format数值数据能够以不同方式和不同的格式加以显示.1 右键点击列表框Sales,在浮动菜单上选择Properties...2 选择Number页.Sales的数字格式化选项没有打开,因为所有的数据格式均继承自文档的默认设置.而且文档的默认设置会受到你计算机的区域设置[控制面板->区域和语言设置]的影响.为了将列表框Sales中的数据格式化加上美圆$符号,这么做:3 选中Override Document Settings来在列表中创建一个带分隔符的数字格式.4 选取Money选项,点击OK.现在这些列表框Sales中的值以另一种的格式显示:一个逗号作为千位分隔符出现,在数值的前面出现了$.添加了2位十进制小数.5 再次打开Properties对话框.6 研究Number页.Format下的Preview显示出当前格式的示例.这个格式是可以被自定义的.在Format Pattem中去掉2位小数[将$#,##0.00;($#,##0.00)改成$#,##0;($#,##0.00)],同时观察Preview中显示结果的变化.如果你不能将0去掉,或者默认显示的是另一种数字格式,这也许跟你计算机的区域设置[控制面板->区域和语言设置]有关.7 点击OK,关闭对话框.排列这些值Aligning the values文本通常是左对齐,数字右对齐.这个设置是可以在Properties对话框下的Presentation页来改变.1 右键点击列表框Year,在浮动菜单上选择Properties...2 选择Presentation页.3 在Alignment中为Number点击Left选项.4 点击OK.统计表The statistics box统计表是当计算总数和平均值时以紧凑方式显示一栏分隔好的数值记录.统计表能够实现不同的数据统计功能.也能够在统计表中选择其他的函数,如:最小值,最大值等等.在面板Geography中包含了一个统计表Area(km.sq)在未选取的时候,统计表使用了所有可能参与计算的相应列表框的值来做运算,进而显示.一旦你在其他列表中选择了某个值,统计表会像其他面板对象一样产生关联反应,更新显示的数据.1 在列表框Country中选择Albania,Algeria,Andorra和Angola,观察统计表的反应.统计表能够被移动,调整大小和关闭,就像列表那样.创建统计表Creating a statistics box1 在工具栏中点击Clear,清除你之前的选取操作.2 切换到面板Sales,右键点击列表框Sales,在浮动窗口上选择Create Statistics Box显示出一个与列表名称相同的统计表.你也许需要调整它的大小来显示所有的数据:1 将光标放在统计表中,靠近右侧边框的位置.当光标变成'←|→',便可以开始拖动了.你可以限制每个值的小数位位数:1 右键点击统计表,打开Properties对话框.2 在Number页.在Functions下,点击Average选择Override Default Settings.3 选取Fixed to,在Decimals选取2.点击OK.你将立即看到公司销售产品的总金额为2317233,总计713个销售等等.你也能够选择新的面板对象来创建统计表,统计表来自新面板对象的菜单或是在工具栏上点击Create Statistics Box按钮.在本案中,New Statistics Box对话框看起来和创建列表时的对话框很相似,但它只包含4个页面.在General页,你选取自己需要的统计功能.在统计表中选取Making selections in a statistics box你能够在统计表中通过点击非计算函数来进行选取操作,例如:最小值或最大值1 通过点击函数Max来查找消费最大的购买者[Customer].选取动作导致列表框Customer关联的显示出该统计值相应的归属者.2 在工具栏中点击Clear,清除你之前的选取操作.保存,关闭和退出Saving, closing and exiting第四课柱状图和饼图LESSON 4 BAR CHARTS AND PIE CHARTS打开文档Opening the document1 启动QlikView.2 打开MyTutorial.qvw.使用快速类型更迭图标来改变图表类型Changing chart types using a fast type change icon在QlikView中有些图表会准备多个不同的类型来展示数据.这些展示通过一个小图标来完成,如果你点击该图标,它将显示下一个图表类型的微缩图.1 切换到面板Geography,观察Area这个柱状图.在标签栏上的最小化图标的左侧你将找到fast typechange图标.2 左键点击该图标.图形将会转变成一个线形图3 这个图表会在3种图表类型间做转换:柱状,线条和饼.如果你再度点击图标将使得图表转换成饼图显示.4 现在右键点击fast type change图标.一个下拉菜单将列出所有可选的图表类型.点击柱状图表的图标,我们将图表的展示退回到原点.所有图表均能通过在图表上点击右键选择Properties对话框,通过相关设置进而转换成可用的7种图表类型中的任意一种.在图表种进行选取操作Making selections in a chart知道现在,我们只学习了在列表中的选取操作.然而在图表中也可以对数据进行选取.回到面板Geography中的柱状图Area.它显示了10个最大的国家.1 在图表中用鼠标框选出一个色块区域用于选取其中一些柱图[不必全部框住,只要框出的色块和柱图存在重叠即可选中].选好后,释放鼠标.2 你已通过色块选择了一些国家.检查列表框Country.也可以通过在列表框Country中点击国家名称来间接的在柱状图Area中对国家进行选取:3 在列表框Country中选取一个或多个国家名称.观察柱状图Area的反应.4 清除你之前的选取操作.移动和调整大小Moving and sizing通过Quick Chart Wizard来创建柱状图Creating a bar chart using the Quick Chart Wizard工具栏包含了2个按钮用于创建图表.叫做Quick Chart Wizard的按钮帮助你用少而简单的步骤来创建一些常用的图表类型.叫做Create Chart的按钮,它提供完整的设置步骤来创建各种图表.如果你不做任何设置,你将得到一个具有完全特征的图表,当然你可以在任何时候来修改这些设置.如果工具栏没有出现,你可以通过View - Toolbars - Design来得到.你将要开始创建一个简单的图表,用于显示每个国家的销售总数.1 切换到面板Sales,在工具栏上点击Quick Chart Wizard按钮.打开Quick Chart Wizard的开始页.点击Next >.2 Quick Chart Wizard的Step 1包含了不同图表类型的图标.默认选择的是柱状图Bar Chart.点击Next >.下一个页面,定义维度[Define dimension(s)],这里你定义每一个柱体在柱状图中的含义.在本案中每一个柱体代表一个国家.3 在First Dimension选取Country,点击Next >.在下一个页面,定义表达式[Define Expression],你定义柱体的高度在柱状图中代表的意义.答案,在本案中表示的是每个国家的销售总数.4 为了得到每个国家的销售总数,选取Sum.在下拉列表中选取Sales,点击Next >.5 在第四个页面你可以通过分别点击Style,Orientation和Mode下的图标来选取一个图表格式.保持默认的选项,选中Show Numbers以在每个柱体上显示相应的数值.6 点击Finish.新的图表出现在你的屏幕上.你可以在任何时候通过Properties对话框来调整现有的图表.7 右键点击图表,在浮动菜单上选择Properties...8 在General页,Window Title下填入Sales, Show Title in Chart下填入Sales per Country.9 点击OK.图表的布局不是很理想:不同的数字重叠在了一起.你能够改变这一现状.不管怎样,你可以在图表里选取或是通过其他选取方式来让图表显示结果:10 在列表框Salesman中选取Ann Lindquist.图表立即显示出Ann Lindquist有销售记录的国家,而且包含了销售总金额.通过Create Chart来创建柱状图Creating a bar chart using the full chart wizard现在你将再度创建相同的图表- 这一次将使用完整的创建过程.1 还是在面板Sales,点击工具栏上的Create Chart按钮.第一页General.在这个页面你能够为作业选择你喜欢的图表类型.柱状图是被默认选取的.2 Window Title下填入Sales, Show Title in Chart下填入Sales per Country.3 点击Next >.第二页,维度[Dimensions].这里你能够设置在X轴[横坐标]上的维度,在本案中你希望每个柱体代表一个国家.左侧的列表包含了所有可用的条目和分组.4 在Available Fields/Groups下选择Country,点击Add>将它移动到Used Dimensions下用于显示.5 点击Next >.6 打开对话框Expression和Edit Expression.使用它们来设置一个或多个表达式在Y轴[纵坐标]上显示其结果,在本案中你希望每个柱体的高度代表国家销售的总数.你能够在Expression OK下直接输入表达式,也可以使用在Aggregation和Field下预设的函数.7 在Aggregation的下拉列表中选取Sum,然后在Field的下拉列表中选取Sales.8 点击Paste.Expression OK下出现了表达式.你也可以在Expression OK下直接书写表达式.9 点击OK.关闭Edit Expression对话框.你刚刚定义的表达式出现在Expressions dialog对话框中Definition下方.你现在已经选取了一个变量一个表达式,换言之,已完成创建图表的基本步骤.10 在Label下填入Sales.11 点击Next >,花点时间研究剩下的页面.12 点击Finish.如果列表框Salesman中的Ann Lindquist没有被选取,那么选取她.将这个图表和之前快速创建的图表比较一下.你将注意到柱体的顶部没有数值显示.这是由于不同的设置造成的.删除图表Removing a chart你只需要保留其中一个你创建的图表.1 右键点击第一个图表,在浮动菜单上选择Remove.改变排列种类Changing the sort order图表一般情况下按照字母表顺序排列.你也许希望将最大的客户国家放在左侧: You may prefer to put the main customer country furthest to the left:1 右键点击图表Sales,在浮动菜单上选择Properties...2 切换至Sort页.3 选择Y-value,让国家按照它们的总销售来排列.4 选择Y-value为Descending,来将最高的柱体放在左侧.5 点击OK.6 清除你之前的选取操作.限定柱体的数量Limiting the number of bars改进图表为概要显示,你能够限定柱体的最大显示数量.1 右键点击图表Sales,在浮动菜单上选择Properties...2 切换至Presentation页3 选中Dimension Limitations下的Max Visible Number(1 - 100).输入10.4 点击OK.清除你之前的选取操作.图表中显示经过改良剩下10个柱体.在柱体上显示数字Displaying numbers on the bars接下来我们希望在我们图表的柱体顶部显示相应的数字.1 右键点击图表Sales,在浮动菜单上选择Properties...2 切换至Expressions页.3 选取Display Options下的Numbers on Data Point.4 点击OK.你现在给每个柱体的顶部添加了Y轴[纵坐标]上相应的数字.改变数字的显示格式Changing the number format。
IQVEIW的使及无线测试工装的验证
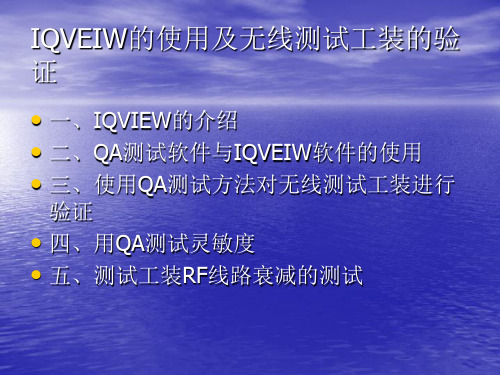
二、IQVEIW软件的使用
1.首先把电脑的IP指定为:192.168.100.100使它能够与 IQVEIW进行通信,再增加一个DUT的IP网段。 2.等ping通192.168.100.254之后双击打开IQsignal这个软 件。 3.把右下角的Left下面的选项框选第四个 Symbol Const;Right选项框里选择为:I/QSignals Top let选项框里面选择为:Amplitude;把右上角的 Trigger settings选项框选为:signals trigger如下图:
首先我们要进行功率验证和EVM的验证,把QA测试程序进行 设置,如下图:然后点击START TX进行测试。
选择要测试的模式(B、G、N)
选择要测试的信道
要测试的速率
要测试 的带宽
把1000改为0
测试相应的天线
点击START TX控制 DUT进行发射功率 可调整功率
把IQVIEW的信道选为和QA测试程序选择的信道先点一下 AUTO Range,然后点cont这个按钮,再点击start进行测试
五、测试工装RF线路衰减的测试
• 1、把要测试的RF线路两端分别接到
IQVIEW/IQFLEX的两个端口上;双击打开 测试衰减的软件Cable Calibration Software 弹出如下界面然后点击connect,如果连接 成功则在右上角的框里显示connect to the test ok如下图
选下面的选项然后 把包数设为10000
选择要测试的速率模式
I-View 用户手册

i-View 用户手册石田 AstraXT 应用软件1st版September 5, 2001ISHIDA CO., L TD版权© 2001 Ishida Co. Ltd., Japan版权© 2001 Interface Translation Ltd., New Zealand此部分若无石田授权不得已任何的介质(电子的、机械的)方式进行复制与传输。
Microsoft Windows 是微软公司的注册商标。
Motorola 是摩托罗拉公司的注册商标。
内容目录1、简介 (4)如何正确使用本说明 (4)2、安装 (5)2.1 系统要求 (5)2.2 安装I-View (5)2.3 卸载I-View (5)3、启动 (6)3.1 I-View 配置 (6)3.1.1 从其他石田软件中可以复制配置 (6)3.1.2 电子秤网络配置 (7)3.1.3 错误说明 (8)3.1.4 日志设置 (9)3.2 使用I-View (10)4 、秤介绍 (11)4.1 秤数据含义 (12)4.2 秤屏幕操作 (12)4.2.1 更新显示数据 (13)4.2.2 显示日志 (14)4.2.3 显示热敏头的数据 (16)4.2.4 输出状态信息 (17)5、错误日志 (17)5.1 显示错误信息 (17)5.2 输出错误信息 (17)6、备份与还原 (18)6.1 备份与还原数据 (18)6.2 秤数据备份 (18)6.3 恢复电子秤数据 (19)7、电子秤程序更新 (21)7.1 从电子秤接收程序 (21)7.2 更新单台电子秤的数据 (22)7.3 更新所有的电子秤数据 (22)8、状态日志 (24)1、介绍I-view 是管理石田ASTRA XT电子秤的网络工作的有效软件。
本软件的管理功能主要体现在以下几点:●由店内的局域网连接电子秤。
●显示每一台秤的操作状态。
包括:●当前秤的操作方式。
●错误信息。
IQVIEW-4-S显示器IQVIEW SCD for IQ4安装说明书
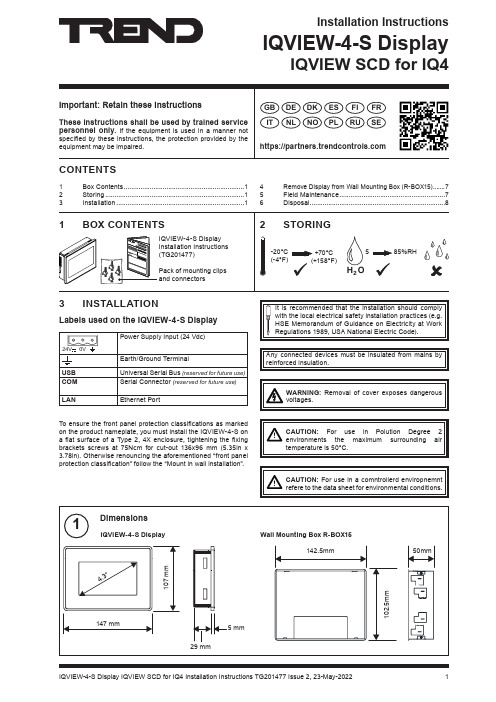
Installation InstructionsIQVIEW-4-S DisplayIQVIEW SCD for IQ4Important: Retain these instructionsThese instructions shall be used by trained service personnel only. If the equipment is used in a manner notspecified by these instructions, the protection provided by the equipment may be impaired.https://GB DE DK FI ES FR ITNLNORUPLSETo ensure the front panel protection classifications as marked on the product nameplate, you must install the IQVIEW-4-S on a flat surface of a Type 2, 4X enclosure, tightening the fixing brackets screws at 75Ncm for cut-out 136x96 mm (5.35in x 3.78in). Otherwise renouncing the aforementioned “front panel protection classification” follow the “Mount in wall installation”.!CAUTION: For use in Polution Degree 2 environments the maximum surrounding air temperature is 50°C.!CAUTION: For use in a comntrollerd enviropnemnt refere to the data sheet for environmental conditions.3 INSTALLATIONCONTENTS1 Box Contents .................................................................12 Storing ...........................................................................13 Installation (1)4 Remove Display from Wall Mounting Box (R-BOX15).......75 Field Maintenance (76)Disposal (8)Labels used on the IQVIEW-4-S Display24V0VPower Supply Input (24 Vdc)Earth/Ground TerminalUSB Universal Serial Bus (reserved for future use)COM Serial Connector (reserved for future use)LANEthernet PortAny connected devices must be insulated from mains by reinforced insulation.IQVIEW-4-S DisplayInstallation Instructions3 INSTALLATION (continued)Installation InstructionsIQVIEW-4-S Display3 INSTALLATION (continued)IQVIEW-4-S DisplayInstallation Instructions3 INSTALLATION (continued)Installation InstructionsIQVIEW-4-S Display3 INSTALLATION (continued)IQVIEW-4-S DisplayInstallation Instructions3 INSTALLATION (continued)Installation InstructionsIQVIEW-4-S Display 5 FIELD MAINTENANCE!WARNING: Contains no serviceable parts. Do not attempt to open the unit. Failure to comply may cause damage to the unit.4 REMOVE DISPLAY FROM WALL MOUNTING BOX (R-BOX15) Do not allow layers of dust or other contaminates to form onthe front panel of the IQVIEW-4-S: it must be cleaned regularlywith a soft cloth and neutral soap product. Do not use solvents.Disconnect power before carrying out any cleaning.IQVIEW-4-S Display Installation InstructionsPlease send any comments about this or any other Trend technical ***************************************© 2022 Honeywell Products and Solutions SARL, Connected Building Division. All rights reserved. Manufactured for and on behalf of the Connected Building Division of Honeywell Products and Solutions SARL, Z.A. La Pièce, 16, 1180 Rolle, Switzerland by its Authorized Representative, Trend Control Systems Limited.Trend Control Systems Limited reserves the right to revise this publication from time to time and make changes to the content hereof without obligation to notify any person of such revisions or changes.Trend Control Systems LimitedSt. Mark’s Court, North Street, Horsham, West Sussex, RH12 1BW, UK. Tel: +44 (0)1403 211888, 6 DISPOSAL。
IQview功能说明书
设备功能/用途说明书品名无线网络测试仪规格型号IQ View功能/用途及生产产品:该无线网络测试仪(IQ view 802.11a/b/g/n-201)主要功能是用于计算机的无线网络卡802.11a/b/g规格之功能测试。
他是WLAN 802.11a/b/g/n-全功能多机体,其专有的的IQ view测试系统完全使用于2.4G 和5G双频带。
通过射频及I/Q基频连接端子以及简单清楚的人机操作软件接口,丰富及弹性功能设计,可以快速简单的选择条件,并可以迅速提供工程人员清楚的数据分析,验证所生产的无线网卡品质好坏。
该仪器提供专业参数的测量:1,Power Measurements功率讯号量测2,Spectrogram频谱讯号量测3,Clear Channel Assessment (CCA)清除信道讯号量测4,Adjacent Channel Power邻近频道功率讯号量测5,Phase noise vs. time相位噪声对信号讯号量测6,Carrier phase noise (PSD)载波噪声对信号量测7,Integrated Phase Noise整体噪声号量测8,Error Vector Magnitude Calculation (EVM)误差相量值计算量测9,Frequency error during short training sequence传递顺序频率误差讯号量测10 Short training sequence IQ Pretzel IQ 传递顺序讯号量测11,Phase Error (I-Q phase error) 相位误差讯号量测12,Amplitude Error (I-Q amplitude error)振幅误差讯号量测13,Spectral Flatness, Spectral Mask/PSD频谱平坦度波罩功率讯号量测主要用途﹕对符合802.11a/b/g/n之协定的无线网络通讯设备进行测试。
IQVIEW WIFI测试仪使用简介

IAC Confidential
11
Innovating Customer Value
IQ signal
IAC Confidential
12
Innovating Customer Value
IAC Confidential
13
Innovating Customer Value
IAC Confidential
IAC Confidential
8
Innovating Customer Value
Debug information shown for connected testor
IAC Confidential
9
Innovating Customer Value
DaAC Confidential
6
Innovating Customer Value
The IQdebug applications is a software tool to be used in conjunction with one of litepoint’s WLAN test instruments. It provides an easy-to-use graphical user interface to monitor the status of the test instrument. The graphical user interface also gives access to the basic control and measurement capabilities of the WLAN test instrument.
IQVIEW WIFI測試儀使用簡介 測試儀使用簡介
IQsignal中文操作手册分析
发射测试结果(3)
EVM指标要求
EVM--矢量误差 信号平均功率
IQ星座图----反映EVM指标好坏
频率误差
符号时 钟误差
要求小于 20ppm----802.11a/g 25ppm----802.11b
相位噪声 要求<3Deg
发射测试结果(4)
频谱平坦度
蓝线不能超出上 下红色限制线
本振泄漏 不能超 过2dB
)
发射测试结果(1)
红色线为 均值波形
底噪
单次测 试结果
平均测 试结果
信号波形
信号平均功率
(重点关注指标)
平均次数设定
频谱
发射测试结果(2)
频谱模板
蓝色谱线不 能超出红色 限制线
判定产品功放 是工作在饱和 区还是线性区 (读数如箭头所 示)
功率幅度 统计图
蓝线紧贴红 线代表产品 工作在线性 区,两线分 离较大代表 产品功放在 饱和区工作
IQsignal软件界面——VSG界面
选择Tools->Vector Signal Generator即可进入
信号单次 发射按键
设定频道和调制 方式(速率)
信号连续 发射开关
选择连续发射 或一次性发射 数据包数量
选择射频信号或 基带信号输出
调整信 号功率
应用举例——RTL8187L无线网卡的测试
衰减器
PC
产品 控制软件
IQSignal
LAN
IQView
RX
IQview信号接收端
接收测试安装图
屏蔽箱
DUT
RX RF
衰减器
PC
产品 控制软件
IQSignal
LAN
IQ View射频输出功率量测试方法
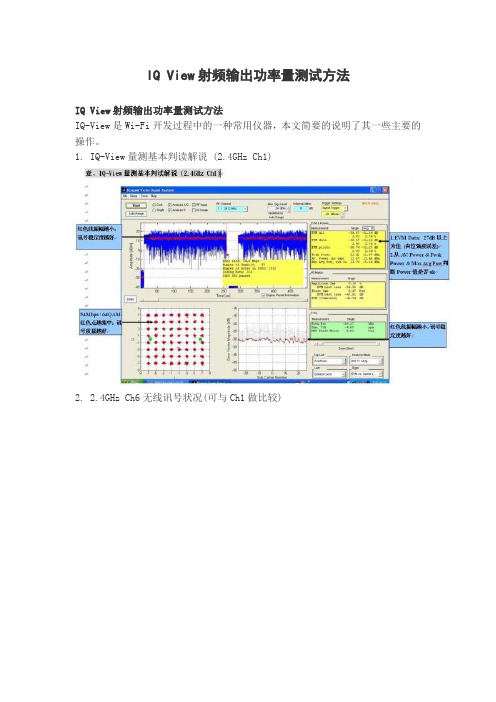
IQ View射频输出功率量测试方法IQ View射频输出功率量测试方法IQ-View是Wi-Fi开发过程中的一种常用仪器,本文简要的说明了其一些主要的操作。
1. IQ-View量测基本判读解说 (2.4GHz Ch1)2. 2.4GHz Ch6无线讯号状况(可与Ch1做比较)3. 2.4GHz Ch11无线讯号状况(可与Ch1 & Ch6做比较)4. RF + PA 6dBm (Booster)无线网卡加功率放大电子组件(功率放大器) Ch15. RF + PA 6dBm (Booster)无线网卡加功率放大电子组件(功率放大器) Ch66. RF + PA 14dBm (Booster)无线网卡加功率放大电子组件(功率放大器) Ch17 .RF + PA 14dBm (Booster)无线网卡加功率放大电子组件(功率放大器) Ch68. 总结从上文图片数据与列表分析,有几项结论:1. RF 射频研发商,当初订出的RF OutputPower是经过研究分析后,确定出最佳无线发射讯号值,尽可能不要去变动。
2. 同一个无线射频模块,在不同频率发射状况下,产生的无线讯号质量及输出功率会有差异,有时差异是很大的。
3. EVM值随着输出功率加大,会明显受到影响,甚至产生过低,造成无法正常传输,传输有效距离会缩到剩1/10。
4. 相同频率下,不同的增加PA功率加大值,产生的效果也不一定等比反应。
个人认为,增加PA或Booster去加大无线输出功率,理论是可以提高输出讯号强度与增加穿透率及可传输更远,这观点是没错,但因PA电子组件或Booster 电路电子组件过滤、同步时脉及耗电影响传输…等问题,导至要做出一颗好的P A与Booster实是非常困难,除非每个产品都花时间去调整与修正(有少数厂商如此做),才能达到真正效益,当然产品数量不多,卖价更是数倍于一般无线设备。
试问,你手上的高功率、大功率无线产品是哪一类??。
- 1、下载文档前请自行甄别文档内容的完整性,平台不提供额外的编辑、内容补充、找答案等附加服务。
- 2、"仅部分预览"的文档,不可在线预览部分如存在完整性等问题,可反馈申请退款(可完整预览的文档不适用该条件!)。
- 3、如文档侵犯您的权益,请联系客服反馈,我们会尽快为您处理(人工客服工作时间:9:00-18:30)。
LitePoint IQdebugUser’s GuideCopyright © 2008, LitePoint CorporationAll rights reservedRESTRICTED RIGHTS LEGENDNo part of this document may be reproduced, transmitted, transcribed, stored in a retrieval system, or translated into any language or computer language, in any form or by any means, electronic, mechanical, magnetic, optical, chemical, manual, or otherwise, without the prior written permission of LitePoint Corporation.DISCLAIMERLitePoint Corporation makes no representations or warranties with respect to the contents of this manual or of the associated LitePoint Corporation products, and specifically disclaims any implied warranties of merchantability or fitness for any particular purpose. LitePoint Corporation shall under no circumstances be liable for incidental or consequential damages or related expenses resulting from the use of this product, even if it has been notified of the possibility of such damages.If you find errors or problems with this documentation, please notify LitePoint Corporation at the address listed below. LitePoint Corporation does not guarantee that this document is error-free. LitePoint Corporation reserves the right to make changes in specifications and other information contained in this document without prior notice.TRADEMARKSLitePoint and the LitePoint logo, IQview IQflex, IQnxn, and IQmax are registered trademarks and IQsignal, IQwave, IQfact, IQcheck, IQdebug, IQmeasure, IQtest, IQexpress, IQturbo, IQultra, TrueChannel, and TrueCable are trademarks of LitePoint Corporation. Microsoft Windows is a registered trademark of Microsoft Corporation in the United States and/or other countries. All trademarks or registered trademarks are owned by their respective owners.CONTACT INFORMATIONLitePoint Corporation575 Maude CourtSunnyvale, CA 94085-2803United States of AmericaTelephone: +1.408.456.5000Facsimile: +1.408.456.0106LITEPOINT TECHNICAL SUPPORT/supportTelephone: +1.408.456.5000Available: weekdays 8am to 6pm, Pacific Standard Time.E-mail: support@Part Number: 1075-5102-004July 2008Table of ContentsPreface (3)Who Should Use This Guide (3)Getting Product Updates (3)Conventions Used in This Manual (3)IQdebug Application (5)Launching IQdebug (6)IQdebug Menu Bar (7)File Menu (7)Edit Menu (8)Wave Menu (8)Analyze Menu (8)Update Menu (9)Help Menu (9)Connecting to a Test System (9)Selecting the Operating Mode (11)Monitor Mode (11)Control Mode (12)Controlling the Test Instrument (13)Changing VSA Settings in Control Mode (13)VSG Settings in Control Mode (16)Using VSG Wave Files in Control Mode (17)Screen Background Color (17)Performing Data Captures in Control Mode (18)Automatic Gain Control in Control Mode (20)Power Versus Time Display (21)Zoom (21)Analysis (21)PrefaceThe LitePoint IQdebug ™ User’s Guide describes how to use the LitePoint IQdebug application to monitor the status of the test instrument.The preface includes the following topics:∙ Who should use this guide ∙ Getting product updates ∙Conventions used in this manualWho Should Use This GuideThe LitePoint IQdebug User’s Guide is intended for test engineers, IT administrators and sales engineers who use the LitePoint test instruments to monitor the status of the instruments.Getting Product UpdatesLitePoint makes product updates available on its website at . In order to download these updates, you must be a valid, registered user of the Client Center and have a current software maintenance agreement with LitePoint for the product or products you wish to download.Conventions Used in This ManualThis document uses the typographic conventions listed in the table below.BoldIndicates text the user must enter or select, such as, menu items, buttons andcommands.Example: In the VSA window system menu, choose Setup > Parameters .Italics Indicates emphasisExample: For detailed information about expanding the frames, refer to the topic Expanded Viewing .Monospace Represents filename, code, function name, variable name, argument name,program examples etc.Example: The lp_gps_api.h contains the error structure as shown below.Indicates that it is a tip. Provides users with useful tips.Example: If there are multiple signal streams present in the captured/loadedwaveform, a separate spectrogram plot can be displayed for each stream.Indicates that the user must take note. Provides users with helpful suggestions.Example: This menu option only works if a valid LTE analysis has occurredon the current data capture.LitePoint IQdebug User’s GuideUsed for warning the user of potential loss of some sort. The user must be careful not to perform something that results in equipment damage or loss of data.Example: Changing the IP address or the subnet mask may affect the Network Address and the Broadcast Address.Indicates potential danger in operating the equipment. Users must use caution while operating the equipment.Example: This application must be used only by administrators who are highly technical and who have experience using such systems.Used for identifying important features or instructions.Example: You can attach the IP address label provided with the unit and attach it to the front of the unit after you have decided on the correct IP address for the instrument.IQdebug ApplicationThe IQdebug application is a software tool to be used in conjunction with one of LitePoint's WLAN and WiMAX test instruments. It provides an easy-to-use graphical user interface to monitor the status of the test instrument.The graphical user interface also gives access to the basic control and measurement capabilities of the WLAN test instruments. Figure 1 shows the main IQdebug Application window.The application provides the following operating modes:∙Monitor mode∙Control modeThe Monitor mode, which is the default mode, provides an overview of the test system status while running other applications. This mode allows you to debug applications that are being developed with the IQview, IQmax or IQflex tester. For example, it allows you to debug an application while single-stepping through the application code. Using this mode, you can monitor data captures, RF and power levels.The Control mode is used to manipulate basic settings of the connected test system. This includes controlling the settings for the VSG and VSA, such as RF frequencies, RF input amplitude, RF output power level, loading waveforms to the VSG and performing data captures using the VSA.Figure 1. IQdebug User InterfaceLaunching IQdebugTo launch the IQdebug application, go to Start>All Programs><LitePoint Application>>IQdebug<LitePoint Application>represents either the IQmax, IQflex or IQview application.When you launch the IQdebug application, the main screen displays. Figure 2 shows the IQdebug main screen.ABCDEFGHIJFigure 2. Description of IQdebug User InterfaceThe legend for Figure 2 is as follows:A.Menu barB.Dialog box to enter IP address of the test systemC.Operating modesD.VSA controlsE.VSG controlsF.Main output windowG.Data capture outputH.Tester monitor update modesI.Time/spectrum output windowJ.Time/spectrum analysisIQdebug Menu BarThe IQdebug menu bar has the following menus:∙File∙Edit∙Wave∙Analyze∙Update∙HelpFile MenuThe File menu allows you to view the default setup and load, save and print configurations. Figure 3 displays the submenus from the File menu.Figure 3. File MenuThe submenus in the File menu and the description for each submenu are as follows:∙Default Setup—returns to default test system settings; used only in Control mode∙Load Setup—allows you to load previous settings of the test system that have been saved using File>SaveSetup; used only in Control mode∙Save Setup—allows you to save current settings of the test system; you can retrieve the settings using Load>Setup ∙Save Wave—allows you to save the wave data from the most recent capture in *.mat format∙Save Wave ASCII—allows you to save captured data in a *.csv (Comma Separated Value) format to be imported intoa spreadsheet∙Printer Setup—allows you to set printer settings∙Print—allows you to print the plots∙Exit—allows you to exit the IQdebug applicationEdit MenuThe Edit menu has only one submenu—Copy Spectrum. Figure 4 displays the submenu for the Edit menu.Figure 4. Edit MenuEdit>Copy Spectrum copies the screenshot of the main application window to the clipboard for use in other applications. Wave MenuThe Wave menu allows you to open a stored wave file or a predefined wave file. Figure 5 displays the submenu items for the Wave menu. To open a stored wave file, go to Wave>Open any wave file, navigate to the directory where the wave files are stored and select a file you wish to open. The available file formats are *.mod or *.mat. To open a predefined wave file, go to Wave and select one of the predefined wave files from the drop-down list.Figure 5. Wave MenuAnalyze MenuThe Analyze menu allows you to analyze wave information in time and spectrum domain. Figure 6 displays the submenu items for the Analyze menu.Figure 6. Analyze MenuTo receive basic waveform power measurements in time domain, go to Analyze>Basic wave info.To analyze spectral wave information, go to Analyze>Spectrum.Update MenuThe update menu allows you to copy the calibration file to the host PC. Figure 7 displays the submenu items for the Update menu. To copy the calibration file to the host PC, go to Update>Copy Calibration file to PC.Figure 7. Update MenuHelp MenuThe Help menu provides information about the IQdebug software. Figure 8 displays the submenu items for the Help menu. To obtain information about the IQdebug software, go to Help>About.Figure 8. Help MenuConnecting to a Test SystemYou must connect the IQdebug application to the test system in order to use it to capture data. To connect to a test system, enter the IP address of the test system, select the desired mode of operation and click Connect. Figure 9 shows the controls needed for this operation.Figure 9. Controls for Connecting to a TesterBy default, the IP address of the test system is set to 192.168.100.254. The IP address of the test system can be changed using the administration tool supplied with the test system.Perform the following actions to connect to the test system:1.Turn the test system on and make sure the LED is green.2.Enter the IP address of the test system, select the operating mode and click Connect.∙Refer to the Selecting the Operating Mode section to select an operating mode.∙In a local network, the IP addresses of the test system and the host PC should both be in the same range. For instance, if the IP address of the tester is 192.168.100.23, and the IP address of the hosting PC is 10.10.241.1, then a connectioncannot be made. However, if the IP address of the tester is 192.168.100.23, and the IP address of the hosting PC is192.168.100.24, then a connection will be made if the test system is accessible via the network connection and if it ispowered on.Figure 10 shows an established connection between the host PC and the test system.Figure 10. Connecting to a TesterIf the test system is not accessible via the network connection or is not powered on, the connection cannot be made. This is represented in Figure 11.Figure 11. Host PC Not Connected to TesterIf the host PC cannot make a connection to the test system, the main output window indicates that the host PC could not connect to the test system. This is represented in Figure 12.Figure 12. Connection Status WindowReset is used to get the test system and the IQdebug application into a known state after a connection has been established. If you attempt to connect to a different test system using the IQdebug application, you must reset the test system. This refreshes the test system calibration. Reset works only in Control mode.Refer to the Selecting the Operating Mode section for information on the two different operating modes.During a reset, the VSG window displays a red status bar indicating that the application is busy. Figure 13 shows a representation of a system being reset.Figure 13. VSG Control status bar during resetWhen you connect to a different test system, you can use the calibration data of the test system you are connected to by selecting Update>Copy Calibration file to PC in the menu bar. After you make this selection, the calibration file of the test system you are connected to is used for calibration.Selecting the Operating ModeThe IQdebug application allows you to select one of two operating modes:∙Monitor (default)∙ControlMonitor ModeWhen a LitePoint IQview, IQmax or IQflex application is connected to a test system, the Monitor mode allows you to monitor the status of the following items in the test system:∙VSA Setup Information∙VSG Setup Information∙Test System Data Capture BufferFor example, if you are using IQapi to modify the settings on the test system, you can use the IQdebug application in Monitor mode to view the status of the test system. Figure 14 shows the Monitor mode selection.Figure 14. Selecting Monitor ModeThe Update Tester Monitor controls can only be used in Monitor mode and are used to specify if update of information in the main output window is performed once or continuously. Figure 15 shows the Update Tester Monitor controls. Click Once to update the data and receive it once and click Continuous to receive a continuous stream of updated data.If the IQdebug application is set to Continuous mode for a long time, it will impact the test system execution speed and willadd description of the information in the output window.Figure 15. Updating Tester MonitorControl ModeThis mode allows you to take control of the tester settings, change the VSG and the VSA settings, as well as perform data captures. Figure 16 shows the Control mode selection.Figure 16. Selecting Control ModeWhen you actively monitor a tester, the output information is displayed in the main output window and in the data capture output window. This is represented in Figure 17 and Figure 18.Figure 17. Debug Information for Connected tester Figure 18. Data Capture Output WindowControlling the Test InstrumentThe IQdebug application allows you to set the various VSA and VSG parameters in control mode.Changing VSA Settings in Control ModeYou can set the following parameters from the VSA Control section:∙VSA RF Port∙VSA Frequency∙VSA Input Amplitude∙VSA Baseband Gain∙VSA Trigger Mode∙VSA Amplitude Mode∙VSA Input SelectionYou can also perform an Automatic Gain Control (AGC) operation. Refer to the section on Automatic Gain Control for more information on how to set the parameter.The IQflex test system does not support baseband operations.Figure 19. VSA Control SettingsVSA RF PortThe VSA RF port drop-down menu is used to select the RF port to which the VSA is connected.The VSA RF port drop-down menu contains the following items:VSA OFF—indicates that RF port is turned offVSA on 1—indicates the left RF portVSA on 2—indicates the right RF portThe VSA can be connected to either the left or the right RF port. If the VSA is connected to the left RF port, then the VSG is connected to the right RF port.Figure 20. Selecting VSA RF portVSA FrequencyEnter the valid input carrier frequency for the VSA in the VSA Frequency dialog box.Make sure that the baseband input checkbox is not selected.The frequency can be set in the 2.4 GHz, 3 GHz (IQmax only) and 5 GHz bands. Refer to the instrument’s documentation for valid ranges.VSA Input AmplitudeEnter the valid input amplitude, in dBm, to manually set the VSA RF input amplitude. Refer to the instrument’s documentation for valid ranges.VSA Baseband GainUse the VSA baseband gain to adjust the variable-gain amplifier input gain when using the baseband input selection. The variable-gain amplifier input gain is fixed when you use the RF input selection.Make sure that the baseband input checkbox is selected.VSA Trigger ModeThe VSA Trigger Mode is used to select the desired trigger mode. In RF input mode, all available selections are valid. In baseband input mode, only Free Run and External trigger selections are valid.The following figure shows the Trigger Mode Selection menu.Figure 21. Trigger Mode SelectionsThe descriptions for the trigger modes are as follows:Free Run—no trigger handling is applied and data is captured immediately after being initiatedExternal Trigger—data is captured when a trigger signal is applied to the external trigger input portNot all test systems have the external trigger ports.IF level—signal-level variations at the RF input port are used for triggering. In this mode, internal trigger circuitry of the test system is calibrated on every data capture. This will affect the speed of data capture.IF level NoCal—signals applied to the RF input port are used for triggering. In this mode, the internal trigger circuitry of the test system is not calibrated unless gain-stage adjustments are performed in the tester.For the IF level and IF level NoCal modes, the amplitude of the input signal must match the amplitude setting of the signal source. This, for instance, can be achieved by applying the AGC in Free Run trigger mode prior to performing the data capture in the IF level trigger mode.VSA Amplitude ModeThe VSA Amplitude Mode selection is used to switch between two modes that affect the reported VSA amplitude level. The actual gain settings in the VSA are not affected.The two VSA amplitude modes are as follows:∙Average Amplitude Mode∙Peak Amplitude ModeFigure 22. VSA Amplitude Mode SelectionsAverage Amplitude mode—the reported amplitude is the average signal powerPeak Amplitude mode—the reported amplitude is the peak power of the input signal, assuming that the input signal is an OFDM signalVSA Input SelectionWhen you select the VSA Baseband Input check box, the application allows you to select the input source either from the RF ports or from the baseband ports. When you select the check box, the application captures the data from the baseband input ports; if you do not select the checkbox, the application captures the data from the RF input ports.If the VSA frequency settings are valid, the color of the screen does not change. If the VSA frequency settings are notvalid, the screen background color changes to red, as shown in the figure below.Figure 23a. VSA Settings with No Error Figure 23b. VSA Settings with ErrorVSG Settings in Control ModeYou can set the following parameters from the VSG control section: ∙VSG RF Port∙VSG Frequency∙VSG Tx Power∙VSG Sine Wave Generator Frequency∙VSG Sine Wave Generator Enable∙VSG Output SelectionBaseband operation does not apply to the IQflex test system.Figure 24. VSG Control settings VSG RF portThe VSG RF port drop-down menu contains the following items:VSG OFF—indicates that RF port is turned offVSG on 1—indicates the left RF portVSG on 2—indicates the right RF portFigure 25. Selecting VSG RF portVSG FrequencyEnter the valid input carrier frequency for the VSG in the VSG Frequency dialog box.Make sure that the baseband output checkbox is not selected.The frequency can be set in the 2.4 and 5 GHz bands at a resolution of 1 MHz. Refer to the instrument’s documentation for valid ranges.VSG PowerEnter a valid RF transmit output power level, in dBm, in the VSG Tx Power dialog box. The assumed load is 50Ω. R efer to the instrument’s documentation for valid ranges.VSG Sine Wave Generator FrequencySelect the Sine Wave check box to enable the sine-wave signal generator. The generated sine wave will be modulated on to the output signal. The VSG generator frequency is used to set the modulation frequency in MHz. When the Sine Wave check box has not been checked, a signal that is generated from a modulation file will be used.VSG Sine Wave Generator EnableThe VSG output can either be an RF output or a baseband output. For modulation using baseband output, select the Baseband Output checkbox. For modulation using RF output, make sure that the Baseband Output checkbox is not selected.Using VSG Wave Files in Control ModeThe IQdebug application allows you to modulate data from wave files onto the output signal at the transmitter port. The Wave menu allows you to open a stored wave file or predefined wave files.To open a stored wave file, in the menu bar, go to Wave>Open any wave fileTo open a predefined wave file, in the menu bar, go to Wave and select a wave file.Make sure that the VSG Sine Wave checkbox is not selected when you open a stored wave file or select a predefined wave file.Screen Background ColorThe VSG screen background color differs based on the VSG settings.The screen colors displayed and the description are as follows:Gray—if all VSG settings are correctRed—if the VSG frequency is set outside the valid range, or if the VSG output power level is too high. If the VSG output power is too high, the signal may get compressed.Yellow—if the VSG output power level is too low. If the VSG output level is too low, the signal to noise ratio would decrease.Figure 26a. Correct Settings Figure 26b. Frequency Not Valid Figure 26c. Low Output PowerPerforming Data Captures in Control ModeIn Control Mode, you can perform data captures by clicking either one of the three buttons shown in the figure below.Figure 27. Buttons for Performing Data CapturesThe three buttons allow you to capture different amounts of samples:0.200 ms—captures 200 μsec of samples1.000 ms—captures 1 msec of samples10.000 ms—captures 10 msec of samplesThe figure below shows the Data Capture Output window for the I and the Q channels plotted against time. The blue plot represents the I channel, and the green plot represents the Q channel.Figure 28. Data for I and Q channelThe color of the status bar indicates the following:Gray—successful data capture.Red—data is being captured; application is busyYellow—clipping has occurred in the digital domain of the VSAOrange—trigger time-out has occurred or the application has been disconnected from the test system before performing the data captureFigure 29a. Successful Data Capture Figure 29b. Application is BusyFigure 29c. Clipping in VSA Figure 29d. Trigger Time-OutAutomatic Gain Control in Control ModeThe AGC button allows you to apply Automatic Gain Control. This button allows you to automatically set the optimum gain for the present input signal, and performs data capture. AGC is performed by taking several measurements, and then adjusting the individual gain stages of the test system. After the gain stages have been adjusted, the system performs the actual data capture.Figure 30a. AGC Operation Successful Figure 30b. AGC in Operation Figure 30c. AGC Fails Gray—AGC operation was successfulRed—AGC is being performedOrange—One of the following reasons:- AGC fails- input signal is too low and AGC is out of range- trigger times out; for example, if the external trigger has been enabled and no trigger signal is present- if the connection to the test system is disrupted before performing AGCPower Versus Time DisplayYou can toggle between showing the I and Q channel data in the data capture output window and showing the data as power versus time using the dB button. The I channel data is shown in blue, and the Q channel data is shown in green.Figure 31. Showing the Power Versus Time of the Captured DataZoomYou can zoom in the data capture output window by dragging the mouse. Figure 32 shows the process of zooming in on the data capture.Figure 32. Zooming in on Captured DataAnalysisThe data can be analyzed in one of two ways:∙Wave Information in the Time domain∙Spectrum InformationWave Information in the Time DomainThis analysis type shows basic power measurements in the time domain.To analyze wave information in the time domain, you can do one of the following:∙In the main menu, go to Analyze>Basic Wave Info∙Click Time in the left pane. See Figure 33.∙Click Time in the right pane. See Figure 34.Figure 33. Selecting Analysis Type from Left Pane to Perform AnalysisFigure 34. Selecting Analysis Type from Right Pane to Show Analysis ResultsThe analysis data displays in the main output window. An example of the output window is shown in Figure 35.The descriptions of parameters in the figure below are as follows:DC—DC level for I and Q signalsrms—Root Mean Square (rms) voltage for I and Q and combined signalmin—minimum voltage levelmax—maximum voltage levelFigure 35. Sine Wave Information in Time DomainSpectrum InformationSpectral analysis shows the measured frequency spectrum. The X-axis indicates the frequency offset from center frequency and the Y-axis indicates the signal power. If the RF ports are used for input, then the signal power is measured in dBm; if the Baseband port is used for input, then the signal power is measured in dBV. An example of the spectrum analysis of an OFDM signal is shown in Figure 36.Baseband operation is not applicable for the IQflex tester.To select spectral analysis, you can do one of the following:∙In the main menu, go to Analyze>Spectrum∙Click Spectrum in the left pane. See Figure 36.∙Click Spectrum in the right pane. See Figure 37.Figure 36. Spectrum of CW SignalAn example of the spectrum analysis of a Continuous Wave (CW) signal is shown in Figure 38.When analyzing an OFDM package, you can zoom the preamble portion. An example of this is shown in Figure 37.Figure 37. Preamble of OFDM SignalAn analysis has to be performed first using left pane buttons, before valid results are shown on the right pane using buttons in the right pane.DisclaimerLitePoint Corporation reserves the right to make this product available for sale and make changes in specifications and other information contained in this document without prior notice! LitePoint Corporation makes no warranty of any kind with regards to this material, including, but not limited to, the implied warranties of merchantability and fitness for a particular purpose. LitePoint shall not be liable for errors contained herein or for material or consequential damages in connection with the furnishing, performance, or use of this material.No part of this manual may be reproduced or transmitted in any form or by any means without the written permission of LitePoint Corporation. Contact your local sales representative for latest information and availability. The information furnished by LitePoint Corporation is believed to be accurate and reliable. However, no responsibility is assumed by LitePoint for its use. LitePoint reserves the right to change specifications and documentation at any time without notice.LitePoint and the LitePoint logo, IQview IQflex, IQnxn, and IQmax are registered trademarks and IQsignal, IQwave, IQfact, IQcheck, IQdebug, IQmeasure, IQtest, IQexpress, IQturbo, IQultra, TrueChannel, and TrueCable are trademarks of LitePoint Corporation. Microsoft Windows is a registered trademark of Microsoft Corporation in the United States and/or other countries. All trademarks or registered trademarks are owned by their respective owners. © 2008 LitePoint Corporation.LitePoint Corporation - Corporate Headquarters。