近红外仪操作说明书
近红外光谱仪的操作步骤 光谱仪技术指标
近红外光谱仪的操作步骤光谱仪技术指标近红外光谱仪从分光系统可分为固定波长滤光片、光栅色散、快速傅立叶变换、声光可调滤光器和阵列检测五种类型。
滤光片型紧要作专用分析仪器,如粮食水分测定仪。
近近红外光谱仪从分光系统可分为固定波长滤光片、光栅色散、快速傅立叶变换、声光可调滤光器和阵列检测五种类型。
滤光片型紧要作专用分析仪器,如粮食水分测定仪。
近红外光谱仪的操作步骤如下:(1)将烟叶样品全部经60目旋风磨处理,待测:(2)开机(要求在18—24℃范围内启动),持续预热 1.5小时;(3)扫描背景,一般要求四次样品扫一次背景。
在环境要求变化不大时可适当放宽要求;(4)用烧杯量取待测样品约75ml(仅对粉末而言)放入样品杯,样品装填均匀,用压紧器(可做成铜块)压紧样品,要求底部没有裂缝。
(5)将样品杯放入样品室,开始扫描;(6)扫描结束后,取出样品杯,清扫样品;(7)重新装样,进行第二个样品的扫描;(8)样品全部扫描结束后,分析结果。
试样测试完成后,首先应退出FT—IR软件,关闭电脑,最后关闭主机电源。
近红外光谱仪仪器使用的注意事项:A 、保持室内环境相对湿度在50%以下。
KBr窗片和分束器很简单吸潮,为防止潮解,务必保持室内干燥。
同时操作的人员不宜太多,以防人呼出的水气和CO2影响仪器的工作。
B 、维持室内温度相对稳定。
温差变化太大,也简单造成水气在窗片上凝结。
C 、假如条件允许,建议定期对仪器用N2进行吹扫。
D 、尽量不要搬动仪器,防止精密仪器的猛烈震动。
—专业分析仪器服务平台,试验室仪器设备交易网,仪器行业专业网络宣扬媒体。
相关热词:等离子清洗机,反应釜,旋转蒸发仪,高精度温湿度计,露点仪,高效液相色谱仪价格,霉菌试验箱,跌落试验台,离子色谱仪价格,噪声计,高压灭菌器,集菌仪,接地电阻测试仪型号,柱温箱,旋涡混合仪,电热套,场强仪万能材料试验机价格,洗瓶机,匀浆机,耐候试验箱,熔融指数仪,透射电子显微镜。
红外线测量仪使用方法说明书
红外线测量仪使用方法说明书一、引言红外线测量仪是一种常用的测量设备,广泛应用于工业领域和科学实验室中。
本说明书旨在向用户提供红外线测量仪的正确使用方法,帮助用户充分发挥该仪器的性能,确保测量结果的准确性和可靠性。
二、产品概述红外线测量仪是一种能够检测和测量物体表面红外辐射的设备。
它基于红外线辐射的原理,通过测量物体表面的红外辐射强度来获取温度信息。
该仪器采用先进的红外线传感技术,具有测量范围广、响应速度快、操作简便等特点。
三、安全须知1. 在使用红外线测量仪之前,请仔细阅读本说明书,并确保理解和遵守所有的安全须知。
2. 在进行测量操作时,请佩戴适当的个人防护设备,如手套和护目镜,以防止可能的伤害。
3. 将红外线测量仪保持干燥,避免接触水或其他液体。
4. 在存放和携带红外线测量仪时,请避免与尖锐物品或硬物摩擦,以免损坏仪器。
5. 如发现仪器故障或异常情况,请立即停止使用,并与售后服务部门联系。
四、使用方法1. 准备工作a. 确保红外线测量仪已经充电完毕,或已插入新鲜的电池。
b. 打开红外线测量仪的电源开关,等待仪器初始化完成。
c. 将红外线测量仪对准待测物体,确保距离合适。
2. 测量操作a. 确定测量模式:根据测量需要,选择红外线测量仪的合适模式。
通常可以选择单点测量、连续测量或扫描测量等模式。
b. 对准物体:将红外线测量仪对准待测物体的表面,保持一定的距离,通常为10厘米至30厘米之间。
c. 触发测量:按下红外线测量仪上的测量按钮或触摸屏幕上的测量图标,开始进行测量操作。
d. 等待结果:等待红外线测量仪测量完成,显示出测量结果。
一般情况下,仪器会同时显示出温度数值和热像图。
3. 结果解读a. 读取温度数值:查看红外线测量仪显示的温度数值,注意数值的单位和精度。
b. 分析热像图:热像图能够直观地显示物体表面的温度分布情况。
通过分析热像图,可以更好地了解物体的热量分布情况和异常区域。
五、常见问题解答1. 为什么红外线测量仪的测量结果与接触式测温工具的结果有差异?答:红外线测量仪是通过测量物体表面的红外辐射强度来获取温度信息,而接触式测温工具是直接接触物体表面来测量温度的。
DA7200近红外分析仪基本操作手册
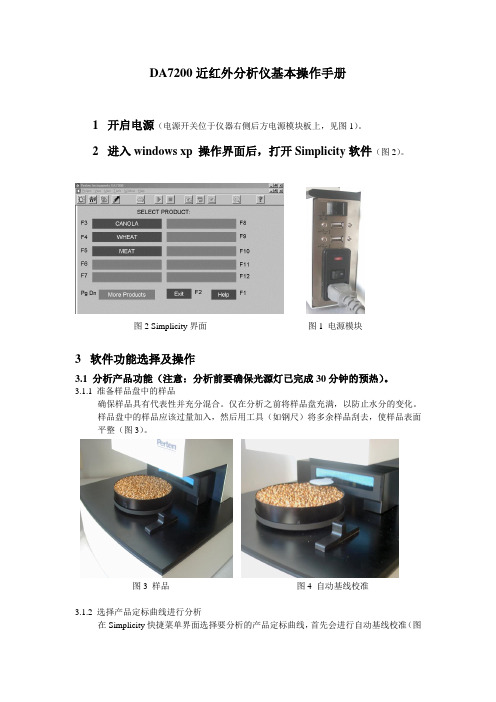
DA7200近红外分析仪基本操作手册1开启电源(电源开关位于仪器右侧后方电源模块板上,见图1)。
2进入windows xp 操作界面后,打开Simplicity软件(图2)。
图2 Simplicity界面图1 电源模块3软件功能选择及操作3.1 分析产品功能(注意:分析前要确保光源灯已完成30分钟的预热)。
3.1.1 准备样品盘中的样品确保样品具有代表性并充分混合。
仅在分析之前将样品盘充满,以防止水分的变化。
样品盘中的样品应该过量加入,然后用工具(如钢尺)将多余样品刮去,使样品表面平整(图3)。
图3 样品图4 自动基线校准3.1.2 选择产品定标曲线进行分析在Simplicity快捷菜单界面选择要分析的产品定标曲线,首先会进行自动基线校准(图4),然后点击Analyze按钮对将被分析的样品进行光谱扫描,分析结果将在样品被扫描后给出(图5)。
图5 分析程序3.2 光谱数据采集3.2.1 创建收集光谱数据项目➢在创建项目中选择数据采集Data collection,然后进行下一步定义(图6)。
➢在参数引导程序中,用户定义每个样品进行重复测量(Repeats)和/或样品的重装(Repacks)的次数,以提高测量的准确度。
用户可以随意选择定义样品ID号的方式,如果选择“Require sample ID”,输入ID后,用户才能分析样品;如果选择“ID not required”,可用于任何时候在“Next sample ID”中输入样品ID(图7)。
图6 Data collection图7参数设置➢完成预期的设定后,点击Next继续下一步引导程序。
在标签引导程序中,用户需要定义进行预测的成分名称(图8)。
图8 标签引导程序➢信息引导程序,用户可以设置一个分析采集项目所需要的所有信息(图9)。
图9 信息引导程序4保存程序和数据,关闭Simplicity软件5先关闭Windows xp 操作系统,再关闭电源。
近红外光谱仪操作流程
近红外光谱仪操作流程下载温馨提示:该文档是我店铺精心编制而成,希望大家下载以后,能够帮助大家解决实际的问题。
文档下载后可定制随意修改,请根据实际需要进行相应的调整和使用,谢谢!并且,本店铺为大家提供各种各样类型的实用资料,如教育随笔、日记赏析、句子摘抄、古诗大全、经典美文、话题作文、工作总结、词语解析、文案摘录、其他资料等等,如想了解不同资料格式和写法,敬请关注!Download tips: This document is carefully compiled by theeditor. I hope that after you download them,they can help yousolve practical problems. The document can be customized andmodified after downloading,please adjust and use it according toactual needs, thank you!In addition, our shop provides you with various types ofpractical materials,such as educational essays, diaryappreciation,sentence excerpts,ancient poems,classic articles,topic composition,work summary,word parsing,copy excerpts,other materials and so on,want to know different data formats andwriting methods,please pay attention!近红外光谱仪操作流程。
1. 开机。
打开仪器电源开关。
启动计算机和光谱软件。
红外线仪器操作说明书
红外线仪器操作说明书一、介绍红外线仪器是一种用于测量和检测物体表面红外辐射的设备。
本操作说明书将详细介绍红外线仪器的使用方法和相关注意事项。
二、安全注意事项在操作红外线仪器前,请务必注意以下安全事项:1. 使用前,必须确保仪器及其附件处于完好无损的状态。
2. 避免将红外线仪器暴露于高温或潮湿环境中,以免损坏仪器。
3. 在使用红外线仪器时,务必佩戴相关个人防护设备,如手套和护目镜。
4. 需要特别注意的是,红外线仪器不适用于测量高强度红外辐射源,以免伤害人体。
5. 在曝光于红外线时,应避免直接注视红外辐射物体,以防伤害眼睛。
三、操作步骤以下是使用红外线仪器的详细操作步骤:1. 准备工作a. 将红外线仪器连接到电源,并确保电源稳定。
b. 仔细阅读红外线仪器的用户手册,了解仪器的各种控制按钮和显示屏符号的含义。
2. 仪器设置a. 打开红外线仪器开关,待仪器启动完成后,进入设置模式。
b. 在仪器设置界面中,选择适当的测量模式和参数,如温度范围和单位等。
3. 目标标定a. 选择要测量的目标物体,并标定其表面温度作为基准。
b. 将红外线仪器对准目标物体,保持一定的距离,并按下测量按钮。
4. 数据测量和记录a. 等待仪器完成测量过程,并在显示屏上获取测量结果。
b. 如需记录数据,可使用红外线仪器提供的数据记录功能或连接到计算机进行数据存储和分析。
5. 仪器维护a. 使用完红外线仪器后,及时关闭仪器电源。
b. 清洁仪器外壳和镜头,保持仪器的清洁和干燥。
c. 定期校准红外线仪器,以确保测量结果的准确性。
四、故障排除如果红外线仪器出现以下问题,可以参考以下故障排除步骤:1. 仪器无法开机:a. 检查仪器是否连接到正常的电源。
b. 检查电源线缆和插头是否损坏。
2. 测量结果异常:a. 检查目标物体表面是否存在干扰物或覆盖物。
b. 检查红外线仪器是否需要校准或更新软件。
3. 仪器无法正常连接到计算机:a. 检查连接线缆和接口是否正确连接。
近红外实验室分析仪安全操作及保养规程
近红外实验室分析仪安全操作及保养规程1. 引言近红外实验室分析仪是一种用于近红外光谱分析的仪器,广泛应用于农业、食品、医药等领域。
为了确保实验室操作人员和仪器设备的安全,本文将介绍近红外实验室分析仪的安全操作和保养规程。
2. 安全操作规程2.1 实验室环境要求近红外实验室应设置在通风良好、安全稳定的环境中。
避免阳光直射、气温过高或过低的场所。
实验室的桌面应保持整洁,不得堆放杂物,确保实验空间的清洁和整洁。
2.2 仪器操作准备在操作仪器之前,必须确保仪器处于正常工作状态。
检查仪器的电源及连接线是否故障,仪器表面是否有明显磨损或损坏。
若发现异常情况,应及时联系维修人员进行处理。
2.3 安全操作步骤2.3.1 正确佩戴个人防护装备在操作近红外实验室分析仪时,操作人员需正确佩戴防护眼镜、实验服、手套等安全装备,以降低事故风险。
2.3.2 仪器开启和关闭在开启或关闭仪器时,务必按照操作手册的要求进行操作,严禁随意操作或强行关闭。
关闭仪器后,应将电源插头拔出,以避免电流侵害。
2.3.3 样品处理和装载样品处理和装载时,必须按照实验操作规程进行。
避免将有腐蚀性、易燃性等危险化学物质接触到近红外实验仪器,以免造成设备损坏或人员伤害。
2.3.4 仪器操作技巧在操作过程中,应熟悉仪器的使用方法和操作步骤。
避免用力过猛或过度拉拽仪器部件,以免损坏设备。
使用仪器时要注意稳定性,避免因操作不当而引发意外事故。
2.4 应急处理措施在实验过程中,如发生仪器故障、样品失控或其他意外情况时,操作人员应迅速切断电源,采取适当的安全措施。
如无法解决问题,应及时向实验室负责人或相关专业维修人员求助。
3. 保养规程3.1 定期检查和维护近红外实验室分析仪应定期进行检查和维护,以确保仪器的正常运行和使用寿命。
检查的内容包括仪器电源、连接线、控制面板、显示屏等。
如发现异常情况,应及时维修或更换部件。
3.2 清洁和消毒定期进行仪器的清洁和消毒是保养的重要环节。
近红外高光谱分析仪安全操作及保养规程
近红外高光谱分析仪安全操作及保养规程1. 引言近红外高光谱分析仪是一种非接触式光谱分析仪器,广泛应用于食品、药品、农业、环保等领域。
为了确保设备的正常运行并保证工作人员的安全,本文档旨在提供近红外高光谱分析仪的安全操作及保养规程。
2. 安全操作规程2.1 设备准备在操作近红外高光谱分析仪之前,必须进行以下准备工作:•检查设备的电源线是否连接稳固;•确保地面是干燥的,以防止电击事故;•检查设备表面是否有明显损坏;•确保工作区域的环境温度适宜,不要有强光照射。
2.2 操作步骤遵循以下操作步骤以确保安全操作:1.打开近红外高光谱分析仪的电源开关,并等待设备启动完成;2.选择适当的模式和参数设置,根据需要进行设定;3.将待测样品放置在设备的测量区域,确保样品与设备接触良好;4.根据设备指导,启动分析过程,等待分析结果的生成;5.分析完成后,关闭电源开关,断开设备的电源线。
2.3 注意事项在操作近红外高光谱分析仪时,请注意以下事项:•不得将任何物品放置在设备上方,以防止堵塞风口;•禁止在设备工作期间随意拔插电源线;•不得将液体或其它杂物倒入设备通风孔;•在操作过程中,严禁将手指或其它物品插入设备的测量区域;•使用设备前,必须熟悉设备的用户手册,并按照说明进行操作。
3. 保养规程为了确保近红外高光谱分析仪的长期稳定运行,需要进行定期的保养和检修工作。
3.1 清洁保养定期清洁设备是保持其正常运行的重要措施。
根据以下步骤进行清洁保养:1.断开设备的电源线,确保设备处于关闭状态;2.使用柔软、干燥的布擦拭设备表面,清除灰尘和污渍;3.如果设备表面有顽固的污渍,可以使用专用的清洁剂进行清洗;4.清洁设备的通风孔,确保气流通畅;5.定期清洁设备的测量区域,防止积累异物影响测量准确性。
3.2 日常维护除了定期清洁外,还需要进行日常维护工作,以确保设备的正常运行:1.定期检查设备的电源线是否损坏,如有损坏应及时更换;2.检查并紧固设备的连接部件,确保设备结构牢固;3.定期校准设备,以保证分析结果的准确性;4.定期更换设备的滤光片和光源,避免长时间使用导致的性能下降;5.将设备放置在干燥、通风良好的环境中,避免过高温度和潮湿环境。
岛津3700紫外可见近红外分光光度计说明书
岛津3700紫外可见近红外分光光度计说明书岛津3700紫外可见近红外分光光度计是一种高精度的光学仪器,广泛应用于化学、生物、环境、药物等领域的分析实验中。
下面是岛津3700紫外可见近红外分光光度计的详细说明书。
一、产品概述岛津3700紫外可见近红外分光光度计采用先进的光学技术和数字化设计,具有高精度、高灵敏度和稳定性强的特点。
该仪器能够在紫外、可见和近红外光谱范围内进行分光光度学分析,可测量物质的吸光度、透过度等参数,广泛应用于定量分析、溶液浓度测定和质量控制等领域。
二、主要特点1.广泛的波长范围:岛津3700紫外可见近红外分光光度计可以测量200-1100nm范围内的光谱,适用于不同实验需求。
2.高分辨率:仪器的分辨率为1nm,能够准确地分辨光谱的细微差别。
3.自动化功能:仪器配备了自动化的控制系统,能够进行自动遮光器调节、数据存储和结果分析等功能。
4.快速扫描速度:仪器具有快速的扫描速度,能够实现快速的光谱扫描和数据采集。
5.多种测量模式:仪器支持吸光度、透过度、浓度、动力学等测量模式,可根据实验需求进行选择。
三、主要部件和结构1.光源系统:岛津3700紫外可见近红外分光光度计使用了高亮度的氘灯和钨灯作为光源,在不同波长范围内提供稳定且均匀的辐射光。
2.分光系统:仪器采用光栅分光光度计设计,通过光栅的衍射原理将不同波长的光线进行分光,保证测量的准确性和可靠性。
3.探测器系统:岛津3700紫外可见近红外分光光度计使用了高灵敏度的光电二极管作为探测器,能够快速准确地转换光信号为电信号。
4.光学导路系统:仪器通过精密的光学导路系统将光线引导到样品室中,实现光谱的采集和测量。
5.信号处理系统:岛津3700紫外可见近红外分光光度计配备了高性能的信号处理系统,能够实现数据的采集、处理和存储。
四、操作流程1.打开仪器电源,待仪器初始化完成后,进入仪器操作界面。
2.根据实验需求选择相应的测量模式,设置光谱扫描范围和扫描速度。
近红外脑功能成像仪简略操作步骤
近红外脑功能成像仪简略操作步骤
L开机:开电源,按下“standby SW”按钮,激光器(探头)需预热半小时;
2.输入被试ID及name: ID相对于文件夹名,那么相对于文件名;
3.给被试戴好头套,一般以最下一排中级一个探头正对眉心为宜;
4.检测探头性能:点"probe set”按钮一"auto gain w按钮一如显示正中三列通道为绿色,表示性能良好;其中通道有黄色,表示通道功能不良,需将四周的探头拿下,用医用棉棒讲患者头发拨开以保障探头信号良好,再测试,直至显示为绿色一“exit”按钮;
5.施测:“ready”按钮一"start”按钮一试验结束后,“stop”按钮呈闪耀状态,点一下;
6.数据保存:新ID需要先点“addition”按钮,旧ID直接点“save as w
7.查看数据:“utility”按钮一"file manager"一选中某数据的IDf “load”
8.关机:关电脑,据工程师说仪器显示屏按钮可以不关
留意:探头纤维较脆弱,不行牵拉!
试验分为为measure和VFT两种,measure试验可自行设计,用于各种人群;VFT仅用于精神科病人。
AnaIySiS参数设置:首先选full time
(1)Integral: PrC+res+pos=试验设计中的恢复时间(res尽量大;Prc、PoS尽量小,可选0.5s); Sti i n=试验设计中的任务时间
(2)Continuous:两个时间都填试验设计中的恢复时间(等待时间)
实际上这些参数是用来调整波形显示的,做科研还要用导出(file out)的原始数据。
近红外光谱仪操作规程1

近红外光谱仪近红外光谱仪操作规程1 适用范围本标准规定了MATRIX-Ⅰ/MPA近红外光谱仪的操作方法。
本标准适用于烟草及烟草制品总糖、还原糖、总氮、总碱、氯、钾的测量。
2 操作环境无要求。
3 操作步骤3.1 开机3.1.1接通电源,打开电脑。
3.1.2按下主机后面的电源按纽,使仪器进入准备状态。
3.2软件操作3.2.1开机操作3.2.1.1双击桌面上OPUS6.5图标,在口令栏中输入OPUS(大写),回车,再回车。
3.2.1.2确认软件界面右下角圆点为绿色。
3.2.1.3单击工具栏中“高级数据采集”图标(绿色),在新界面中进行如下操作:3.2.1.3.1在“基本设置”界面中单击“调入”,调入“背景测试”文件。
3.2.1.3.2单击进入“检查信号”界面,仪器自动检测峰位(约3-5秒),结束后单击“保存峰位”,单击“退出”。
3.2.1.4单击右下角绿色圆点,出现“仪器状态”界面,确认第一排六项全部为绿色对号,单击第二排第一项,单击“现在测试”,单击“measure”,在新界面中,只将”Bruker PQ(IT) Test Protocol”前打对号,单击“measure”,再单击”measure”,,进入仪器自检,此过程约需十五分钟。
3.2样品测试3.2.1装样将样品杯放在一张干净的纸上,向里面装入烟丝或烟沫(不能成团),摊平(烟丝高度约5厘米左右即可,烟沫高度约一钢笔厚即可)。
放入压样器,用手轻轻按压。
3.2.2样品检测3.2.2.1单击工具栏中“高级数据采集”图标(绿色)。
3.2.2.2进入“基本设置”界面,单击“调入”,调入“背景测试”文件,单击“背景单通道”,进行背景测试,约需十秒左右。
3.2.2.3背景测试结束后,将样品杯防于样品台上,进入“高级设置”界面,调入“样品扫描参数”文件,输入文件名和路径。
3.2.2.4进入“基本设置”界面,单击“样品单通道”,仪器进行自动检测。
3.2.3样品清理将样品杯中的烟丝(或烟沫)倒出,用吸耳球将样品杯石英玻璃内面上附着的烟丝(或烟沫)吹净(吹不掉的可用棉布擦掉),保证玻璃外面也不沾有任何东西,进行下一个装样。
近红外光谱仪操作步骤
近红外光谱仪操作步骤简介近红外光谱仪是一种测量样品在近红外波段(约800-2500 nm)光吸收和反射的仪器,广泛应用于食品、制药、化工等领域的成分分析。
本文将介绍近红外光谱仪的操作步骤和注意事项。
操作步骤1. 打开近红外光谱仪进入实验室后,按下近红外光谱仪上的电源按钮,等待电源指示灯亮起,表明仪器已开始启动。
2. 样品前处理将待测样品准备好,进行必要的前处理。
对于固体样品,需要将其研磨或压片,以便获得均匀、平整的表面。
对于液态样品,需要稀释至适当的浓度,并且防止样品产生气泡或振荡。
3. 标准化参考物质在进行样品测量前,需要先标准化参考物质。
将参考物质放入近红外光谱仪的样品室中,进行标准化处理。
标准化处理可以通过光谱仪软件中的特定功能完成。
4. 放置待测样品标准化参考物质处理完成后,将参考物质取出,放置待测样品于样品室中。
注意,不同样品的数量和放置位置可以根据实验需求进行调整。
5. 进行光谱测量根据光谱仪的操作说明,设置相关参数,执行光谱测量。
待测样品的光谱图像可以在电脑屏幕上进行实时观察。
6. 数据处理将测量的光谱数据导出至电脑,通过相应的软件对数据进行分析和处理。
根据需要,进行数据平滑、基线校准、峰识别、谱图匹配等处理过程。
7. 关闭近红外光谱仪完成光谱测量和数据处理后,关闭近红外光谱仪。
注意,不要关闭电源开关,而是通过光谱仪上的软件操作进行关闭。
注意事项在操作近红外光谱仪时,需要注意以下几点:1.样品需处理干净和均匀,避免杂质和热源的影响;2.参考物质的标准化过程应当做好,避免影响数据的准确性;3.光谱测量时需要选择适当的光源和检测器,以获得准确的数据;4.数据处理时需要根据实验需求进行调整,避免过度平滑和谱图失真现象;5.操作过程中要注意保护近红外光谱仪,避免碰撞、摔落等损坏。
总结近红外光谱仪是一种重要的分析工具,能够广泛应用于食品、制药、化工等领域的成分分析。
通过本文介绍的操作步骤和注意事项的学习,能够更好地掌握近红外光谱仪的操作技巧,并且让实验结果更加准确和可靠。
22-近红外碘价测定仪操作指导书
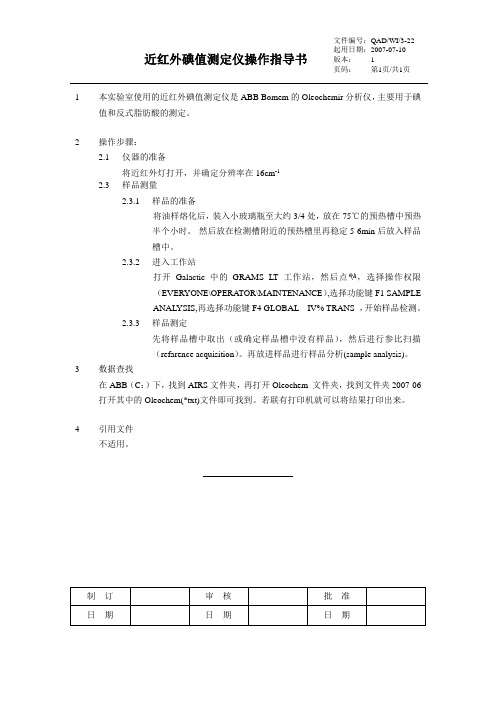
近红外碘值测定仪操作指导书文件编号:QAD/WI/3-22 起用日期:2007-07-10
版本: 1
页码:第1页/共1页
1本实验室使用的近红外碘值测定仪是ABB Bomem的Oleochemir分析仪,主要用于碘值和反式脂肪酸的测定。
2操作步骤:
2.1仪器的准备
将近红外灯打开,并确定分辨率在16cm-1
2.3样品测量
2.3.1样品的准备
将油样熔化后,装入小玻璃瓶至大约3/4处,放在75℃的预热槽中预热
半个小时。
然后放在检测槽附近的预热槽里再稳定5-6min后放入样品
槽中。
2.3.2进入工作站
打开Galactic中的GRAMS LT
工作站,然后点,选择操作权限
(EVERYONE\OPERATOR\MAINTENANCE),选择功能键F1 SAMPLE
ANAL YSIS,再选择功能键F4 GLOBAL IV% TRANS ,开始样品检测。
2.3.3样品测定
先将样品槽中取出(或确定样品槽中没有样品),然后进行参比扫描
(refarence acquisition)。
再放进样品进行样品分析(sample analysis)。
3数据查找
在ABB(C:)下,找到AIRS文件夹,再打开Oleochem 文件夹,找到文件夹2007-06打开其中的Oleochem(*txt)文件即可找到。
若联有打印机就可以将结果打印出来。
4引用文件
不适用。
近红外光谱仪的使用教程
近红外光谱仪的使用教程近红外光谱仪(Near-Infrared Spectrometer,简称NIR)是一种常用的分析仪器,广泛应用于农业、食品、医药、化工等领域。
它能够通过测量样品在近红外光波段的吸收和散射光来确定样品的物理、化学及结构性质。
本篇文章将介绍近红外光谱仪的使用方法和注意事项,以帮助读者更好地利用该仪器。
仪器准备在操作近红外光谱仪之前,首先需要对仪器进行准备。
确保设备工作正常并经过校准是十分重要的。
首先,检查光源是否亮度均匀、光束是否齐整。
其次,确保样品舱及光学部件的清洁度,以免影响测量结果。
最后,进行仪器校准,确保光谱仪的准确性和稳定性。
样品处理在使用近红外光谱仪前,需要对样品进行适当的前处理,以保证测量结果的准确性。
样品通常需要经过研磨、过滤或稀释等步骤,以确保样品均匀、无颗粒和适宜的浓度。
此外,还需要注意样品的温度和湿度,以免对测量结果产生影响。
光谱测量在进行光谱测量时,需要选择适当的光谱范围和参数,以获得最佳的结果。
一般来说,近红外光谱仪有两种测量模式:反射和透射。
反射模式适用于固体样品和粉末样品,而透射模式适用于液体和溶液样品。
在选择测量模式时,根据样品的性质和要求进行选择。
数据分析获取光谱数据后,需要对数据进行分析和解读。
常见的数据处理方法包括预处理、特征提取和模型建立等。
预处理是指对数据进行平滑、去噪、标准化等操作,以提高数据的质量和可解释性。
特征提取是将复杂的光谱数据转化为可理解的数据特征,以便进一步分析和识别。
模型建立是利用已知样品的光谱数据建立模型,并利用该模型对未知样品进行分类、定量和质量控制等。
注意事项在使用近红外光谱仪时,需要注意以下几点。
首先,避免光源和检测器受到干扰,保持实验环境的干净和安静。
其次,校准仪器的频率要求,以确保测量结果的稳定性和准确性。
此外,注意样品舱的温度控制,以免样品受到热辐射的影响。
总结近红外光谱仪是一种重要的分析工具,它能够提供大量关于样品性质和组成的信息。
近红外光谱分析仪的使用 分析仪操作规程

近红外光谱分析仪的使用分析仪操作规程近红外光谱分析仪是利用气体或液体对红外线进行选择性吸取的原理制成的一种分析仪表,它具有灵敏度高反应速度快分析范围宽选择性好抗干扰本领强等特点,被广泛应近红外光谱分析仪是利用气体或液体对红外线进行选择性吸取的原理制成的一种分析仪表,它具有灵敏度高反应速度快分析范围宽选择性好抗干扰本领强等特点,被广泛应用于石油化工冶金等工业生产中。
近红外光谱分析仪的光源是接受上下两个电极的方法,通上电流,电极之间就形成一个火花式光谱仪光源。
在这火花式光谱仪光源中,电极之间空气或其他气体一般处于大气压力。
因此放电是在充有气体的电极之间发生,是依靠电极间流过的电流使气体发光,是建立在气体放电的基础上。
低压火花以及控波型光谱分析仪光源是在电容电场作用下,接受掌控气氛中放电;火花光谱分析仪光源是在直流电场作用下,淡薄掌控气氛中放电;等离子体火花式光谱仪光源是在射频电磁场作用下掌控气氛中放电(电极之间的电压以及电流的关系不遵守欧姆定律的)。
光谱分析仪光源的作用是将待测元素变成气体状态,而后激发成光谱,依据该元素谱线强度转换成光电流,由计算机掌控的测光系统按谱线的强度换算成元素的含量。
光源作用的这种动态过程,就是将样品由固态变成气态,其中一部份元素激发而发射光谱,而这些气态的样品又不断地向四周扩散,分析间隙的气态样品也在不断更新,以求达到一个动态平衡,当火花光谱分析仪光源激发确定时间后,蒸气云中待测元素浓度增大,只有蒸气云中浓度充分大,才能得到大的光电信号。
近红外光谱分析仪是否稳定正常地运行,直接影响到仪器测定数据的好坏,假如气路中有水珠、机械杂物杂屑等都会造成气流不稳定,因此,对气体掌控系统要常常进行检查和维护。
首先要做试验,打开掌控系统的电源开关,使电磁阀处于工作状态,然后开启气瓶及减压阀,使气体压力指示在额定值上,然后关闭气瓶,察看减压阀上的压力表指针,应在几个小时内没有下降或下降很少,否则气路中有漏气现象,需要检查和排出。
MPA型傅立叶近红外光谱仪操作说明
MPA型傅立叶近红外光谱仪操作说明1.前言2.准备工作-确保仪器连接电源并开机,待仪器完全启动后开始操作。
-清洁仪器的测量窗口,以确保获得准确的光谱数据。
-检查光纤连接是否牢固,避免信号干扰。
3.仪器设置- 打开MIRacle™软件。
选择“新建光谱”并填写必要的样品信息,点击“确定”按钮。
-在菜单中选择“光谱参数设置”,设置扫描范围和分辨率。
根据实际需求,选择适当的参数进行设置。
-通过点击“参考光谱设置”按钮,选择参考光谱并保存设置。
4.样品测量-将待测的样品放置在样品架上,确保样品光路无阻碍。
-点击软件界面上方的“开始光谱测量”按钮,开始样品测量。
-后续扫描过程中,确保光路稳定,避免干扰。
-取得光谱结果后,进行保存并进行下一个样品的测量。
5.数据分析-在软件界面中选择所需的已测量的样品光谱。
-利用软件自带的光谱分析工具,进行波长校正、谱图修整、数据转换等操作。
-根据实际需求,选择合适的分析方法,并进行数据处理和解读。
6.结果呈现-利用软件绘制光谱图或进行其他数据可视化处理,以直观地展示结果。
-根据实际需求,结合分析结果编写报告或生成数据报表,储存或输出结果。
7.注意事项-在进行测量前,确保仪器已经预热至工作温度,以获得准确的光谱结果。
-对于液体样品,使用合适的光学配件进行测量。
-避免样品和光路间的灰尘和杂质,以免影响测量结果。
-注意样品的质量和浓度范围,适量选择样品进行测量。
-在操作过程中,注意安全,避免对自身和他人造成伤害。
总结:MPA型傅立叶近红外光谱仪操作简单易行,只需按照上述步骤进行操作,即可获得高质量的光谱数据。
根据实际需求,可进行进一步的数据分析和结果呈现,以满足各种分析要求。
同时,在操作中要注意仪器的安全和样品的处理,确保准确性和可靠性。
近红外光谱仪操作规程
办农家乐原则
• • • • 合理布局,有序推进 推行标准、实施规范 加强培训、提升素质 挖掘文化、提升品位
农家菜肴的特点
• • • • • 绿色健康 生态环保(环境、加热方式) 原汁原味 地方特色 安全卫生
问题
1.食品安全问题突出
现场宰杀后烹饪,厨房、碗筷等,出售明令禁 止销售的保护野生动物
2.景区安全令人担忧
五、主要城市地区乡村旅游发展模式
1)深圳市模式:农业公园,观光农场,绿色农场 2)北京市模式:观光农业园,科技农业园,观光采摘园 3)上海市模式:现代农业园,生态农业园 4)广州市模式:农业主题公园,观光农业园 5)成都模式:农家乐,乡村旅游度假村,花卉盆景园 6)台湾模式:休闲农场,休闲牧场,乡村民宿
四、乡村旅游发展的新特点
1)乡村旅游分布的变化与新格局的形成 第一个为观光、餐饮为主的旅游圈,以城市为中心,大型城市周边50公 里,中型城市周边25公里,小型城市周边15公里范围区域,都是城市居民观 光、餐饮、购物的旅游出行区域。 第二个为休闲、体验圈,以城市为中心,大型城市周边250公里,中型城 市150公里,小型城市周边80公里范围区域,都是城市居民观光、休闲、体 验旅游出行的区域。 2)乡村旅游从依托城市向依托景区发展。 3)乡村旅游从单一观光采摘农业型向休闲、度假、体验乡村型发展。 4)乡村旅游从自发发展逐步走向规范化发展。 5)乡村旅游发展与新农村建设相结合
,包括防盗、防抢,要让客人有一个安全、放心的住宿环境 。
第三节 农家乐的接待
• 三、娱乐方面
农家乐传播的是农家文化,体现的是淳朴自然的民风民俗, 必须依托当地文化,因地制宜。
第三节 农家乐的接待
• 四、购物方面
很多游客在停留或者离开的时候会购买些当地的特产,购物 能够推动生产的积极性、增加农家收入,同时特产也是吸引游
近红外脑功能成像仪简略操作步骤
近红外脑功能成像仪简略操作步骤
1.开机:开电源,按下“standby SW”按钮,激光器(探头)需预热半小时;
2.输入被试ID及name:ID相对于文件夹名,那么相对于文件名;
3.给被试戴好头套,一般以最下一排中级一个探头正对眉心为宜;
4.检测探头性能:点“probe set”按钮→“auto gain”按钮→如显示正中三列通道为绿色,表示性能良好;其中通道有黄色,表示通道功能不良,需将附近的探头拿下,用医用棉棒讲患者头发拨开以保障探头信号良好,再测试,直至显示为绿色→“exit”按钮;
5.施测:“ready”按钮→“start”按钮→实验结束后,“stop”按钮呈闪烁状态,点一下;
6.数据保存:新ID需要先点“addition”按钮,旧ID直接点“save as”
7.查看数据:“utility”按钮→“file manager”→选中某数据的ID→“load”
8.关机:关电脑,据工程师说仪器显示屏按钮可以不关
注意:探头纤维较脆弱,不可牵拉!
实验分为为measure和VFT两种,measure实验可自行设计,用于各种人群;VFT仅用于精神科病人。
Analysis参数设置:首先选full time
(1)Integral: pre+res+pos=实验设计中的恢复时间(res尽量大;pre、pos尽量小,可选0.5s);stim=实验设计中的任务时间
(2)Continuous:两个时间都填实验设计中的恢复时间(等待时间)
实际上这些参数是用来调整波形显示的,做科研还要用导出(file out)的原始数据。
红外线仪器使用方法说明书
红外线仪器使用方法说明书一、概述红外线仪器是一种用于测量、检测和分析目标物体红外辐射特征的设备。
本说明书旨在为用户提供准确、详细的红外线仪器使用方法,以便顺利操作和获取准确的测试结果。
二、安全注意事项在使用红外线仪器之前,请务必遵守以下安全事项,以保证个人安全和设备的正确操作:1. 在使用红外线仪器前,请仔细阅读本说明书,并确保已完全理解和掌握操作步骤。
2. 使用红外线仪器时,请确保仪器及周围环境处于干燥、清洁、无尘、无腐蚀性气体的环境中。
3. 在操作红外线仪器时,请佩戴防护手套和眼镜,以防止意外事故发生。
4. 使用红外线仪器时,请确保设备的电源接地良好,以避免电击风险。
5. 禁止将红外线仪器用作测量生命体温或人体诊断,以免产生不准确的结果及可能的健康风险。
三、准备工作在开始使用红外线仪器之前,请完成以下准备工作:1. 打开红外线仪器的电源开关,并等待设备预热。
2. 将红外线仪器放置在平稳、无震动的表面上,以确保测试稳定性。
3. 定位红外线仪器的测量距离和角度,确保目标物体能够在整个测量范围内受到红外辐射。
4. 清洁目标物体的表面,以消除干扰因素,并提供准确的测试结果。
四、操作步骤以下为使用红外线仪器的操作步骤:1. 打开红外线仪器,并选择合适的测试模式。
2. 使用红外线仪器的测量按钮或触摸屏,进入测量界面。
3. 定位待测目标物体,并将仪器对准目标物体表面。
4. 确认红外线仪器的测量距离和角度是否正确,确保目标物体完全受到红外辐射。
5. 按下红外线仪器的开始测量按钮,开始测量过程。
6. 在测量过程中,保持稳定的手持姿势,以防止测量结果的失真。
7. 等待红外线仪器完成测量,并在显示屏上查看测试结果。
8. 根据需要,可以将测量结果保存或打印,以备后续分析和参考。
五、注意事项在使用红外线仪器时,请注意以下事项,以获得准确可靠的测试结果:1. 在进行连续测量时,请确保每次测量间的时间间隔足够,以避免测试结果受到前一次测量的干扰。
- 1、下载文档前请自行甄别文档内容的完整性,平台不提供额外的编辑、内容补充、找答案等附加服务。
- 2、"仅部分预览"的文档,不可在线预览部分如存在完整性等问题,可反馈申请退款(可完整预览的文档不适用该条件!)。
- 3、如文档侵犯您的权益,请联系客服反馈,我们会尽快为您处理(人工客服工作时间:9:00-18:30)。
PureSpect Manual (English version)1. OverveiwThis chapter introduces the general information on the PureSpect operation software. The PureSpect operation software consists of the main menu of six windows as the below figure.1.Continuation save : The window is to save a spectrum.2.Sampling : The window is to operate various sampling functions.3.Add index line : The window is to set various index lines in the spectrum window.4.Reading time : The window is to control measuring conditions.5.MP & Auto gain : The window is to overview measuring status.6.Motor & lamp : The window is to control lamps on/off etc.FileThe File menu consists of “Save”, “Extension Mode” and “Exit” commands. The “Save” command is used when you save the spectra which is measured. The “Extension Mode” command is used when the PureSpect is needed a troubleshooting. The “Exit”command is used when you close the PureSpect software.ParameterThe Parameter menu consists of “Automatic parameter measurement” and “Motor and lamp control”commands. The “Automatic parameter measurement” command is used when you want to check the conditions of a CCD diode array sensor. The “Motor and lamp control” command is used when you control lamps or a turn table.DisplayThe Display menu consists of “Drawing line”and “Error display”commands. The “Drawing line”command is used when you want to draw index lines in the spectrum window. The “Error display”command is used when you check error messages which are occurred by a trouble in the PureSpect software or instrument.2. Operation2.1. Select parameterThe “setprm2”icon is displayed in the Windowsdesktop menu. Click on this icon to start thePureSpect software.If the login dialog box is opened, select “Parameterfile” in the drop-down list. The name of parameter fileis a “Parameter-SPC” for your spectrometer. A SaikaTIF service technician has configured your copy of thePureSpect software to match your spectrometer whenyour spectrometer was installed.Click on the “PureSpect start”button and thePureSpect main window opens.NewIf you want to create a new parameter file, click the “New”icon and the “COPY”window opens. You can write a newparameter file in the entry box. This menu is useful when youcreate a new parameter file which is similar to a former file.Phase checkYou can check communication between a computer and thePureSpect instrument, when the PureSpect software will bestarted. If the icon is clicked, the PureSpect software willstart after checking whether a communication between thecomputer and the PureSpect instrument is working well ornot. In this case, you can find “Under a communication test”message on your screen during a few seconds.Offset file readingIf it is clicked, it reads a “Offset file”while starting theprogram. The offset file is the data file of spectrum which wassaved when the CCD diode array sensor turned on. If youstart the PureSpect software without the offset file, you haveto pass a calculating step which corrects the Offset file whena spectrum is converted to an absorbance spectrum for future procedures. Please, click this icon toread the offset file.ChangeIf you changed “Phase check” or “Offset file reading” command, click this icon to save a changing condition. If the change button is displayed in gray, the conditions were saved.Open folderUse this command to read parameter file.2.2. Spectrum WindowWhen loading the PureSpect software, the spectrum window is displayed in the screen with “Sampling”and “MP & Auto gain”windows. The spectrum window consists of the “title bar”, “pull-down menu”, “icons”, “spectrum display window”and “status bar”. The title bar shows the execution file name, parameter file name and status whether the offset file is read or not. The pull-down menus can be used to access all PureSpect functions. The icons may be configured to quickly access frequently used functions. If you move the mouse cursor on an icon, a small text is displayed to explain its meaning. The status bar indicates the cursor position, the wavelength and temperature of the CCD diode array sensor. The default settings for the spectral range are from 643.26nm to 985.11nm with 1.29nm increment.Cursor position Wavelength(nm)Set temp.of sensor2.3. Continuation SaveYou can save measured spectra as follows. At first, select your folder in the Folder box and input a common file name in the “Common file name” box. The next step, click the “Save” icon, after you finished to measure a spectrum. From now, whenever you click only “Save” icon, a spectrum will be saved with common file name in the folder numerically. The files will be saved with TXT file format.FolderInput folder name to save spectrum files.Common file nameInput common file name of spectra.Ext.Extension name of spectrum files.2.4. SamplingIf you want to open a “Sampling” window, click on the “S” icon. I am sorry you cannot find and use it from the pull-down menu. Please use the icon.AUTOIt is an automatic measurement mode. It operates a lmost similar to the fruits packing house systems.So, it can measure a spectrum of the target, a reference filterand a dark state, automatically. To save all spectra which havea lot of target, reference and offset spectra in a file, you firsthave to click “Save”icon in the right-hand side. And, click“Save”icon again, after you finish to measure spectra in theAUTO mode. Then, “Save As”window opens, write your filename that may as well write without an extension in the entrybox. You have to convert the file, because the file is saved witha binary format. To convert the binary file to TXT format file,drag the file on the “SAM2TXT.exe” file in the program folder.Then, you can find a TXT file of same name as the binary file.Don’t forget Fruits-analyzer has to be turned on to operate thePureSpect in this mode, because the PureSpect instrument is interlocked with Fruits-analyzer.TargetThe “Target” command is used when you measure only a target spectrum in the manual mode. If you click on the “Sampling”icon in the right-bottom side in the Sampling window, after you click “Target” icon, you can find a target spectrum in the spectrum window. At that time, gain value of the spectrum is displayed in the MP& Auto gain window. If you click “AutoGain” icon in upper right side, a gain values of a spectrum is changed whenever you click “Sampling” icon. The range of a gain value in the target spectrum is from 0 to 255.OffsetThe “Offset” command is also used when you measure only an offset spectrum in the manual mode. If you click on the “Sampling” icon, after you click “Offset” icon, you can find an offset spectrum in your spectrum window. Although a gain value of an offset is displayed in the MP& Auto gain window, the gain value isn’t changed in the “AutoGain”mode. The offset gain value depends on the parameter set in the “Reading time” window. The range of an offset gain is also from 0 to 255.ReferenceThe “Reference” command is also used when you measure only a reference spectrum in the manual mode. If you click on the “Sampling” icon, after you click “Reference” icon, you can find a reference spectrum in your spectrum window. The gain value of reference isn’t also changed in the “AutoGain”mode, because the reference gain value depends on the parameter set in the “Reading time” window. The range of a reference gain is also from 0 to 255. But this mode has a different meaning with a reference called reference in the AUTO mode. This mode uses a reference filter of the inner site in PureSpect instrument.D lineThe “D line” command is used when you measure only a D line spectrum in the manual mode. If you click on the “Sampling” icon, after you click “D line” icon, you can find a spectrum of a D line in your spectrum window and you can find a value of a D line at the 3rd line in the MP& Auto gain window. The D line hasn’t a gain value.ContinuationThe “Continuation” command can be used to measure spectrum in the manual mode continuously. For example, you can measure a target spectrum continuously as follows, click Target -> Continuation -> Sampling.AutoGainA gain is a parameter which makes a spectrum amplify appropriately with a vertical axis. An AutoGain is also a parameter which can amplify a spectrum automatically. The “AutoGain”command is used both automatic and manual mode.OverwriteThe “Overwrite” command is a parameter which makes a spectrum write in the spectrum window without erasing spectra.No displayThe “No display”command is a parameter which does not display a spectrum in the spectrum window.SaveThe “Save” command is a parameter which saves a spectrum sequentially.Ref. displayThe “Ref. display”command is a parameter which displays an index spectrum in the spectrum window.SamplingThe “Sampling” command is used when you want to start to measure a spectrum in the AUTO or manual mode.2.5. Add Index LineThe “Add Index Line” menu allows you to see and to changeindex lines. Upper 12 lines are the vertical index lines, andbelow 4 lines are the horizontal index lines. The 1st columnindicates the position of each index lines. The 2nd columnindicates the value of a spectrum in the auto gain area. The3rd column indicates the value of a target spectrum.If you check lift side box next to color box, a index line isdisplayed at the left side (or at the top side) in the spectrumwindow. You can move a index line to the position which youwant to locate using a mouse drag. And you can also change aindex line color by double click on a color button. If you checkat right side box, a index line is locked at the presentposition.2.6. Reading timeTarget exposure timeThe “Target exposure time” command is a parameter which sets up the time to measure a target spectrum in manual mode. The range of the upper scroll bar is from 1 to 200 milliseconds, of the bottom scroll bar is from 1 to 18 times. For example, if you want to measure a spectrum for 0.1 second, set 100 milliseconds in the upper scroll bar and 1 time in the bottom scroll bar. And if you want to measure a spectrum for 1 second, set 200 milliseconds in the upper scroll bar and 5 times in the bottom scroll bar. But, please don’t use over 1.5 seconds.Target gainA gain is a parameter which makes a spectrum amplifyappropriately with a vertical axis. The “Target gain” command isa parameter which sets a target gain in the manual. When it isoperated by the AutoGain in the automatic mode, you have to seta value of the target as “0”. The range of a target gain is from 0 to255.Offset exposure timeThe “Offset exposure time” command is a parameter which setstime to measure an offset spectrum in manual mode. The rangeof the upper scroll bar is from 1 to 200 milliseconds, of the bottomscroll bar is from 1 to 18 times. For example, if you want tomeasure a spectrum for 0.1 second, set also 100 milliseconds inthe upper scroll bar and 1 time in the bottom scroll bar. And ifyou want to measure a spectrum for 1 second, set also 200milliseconds in the upper scroll bar and 5 times in the bottomscroll bar. But, please don’t use over 1.5 seconds.Offset gainThe “Offset gain” command is a parameter which sets an offsetgain in the manual mode. The range of a offset gain is from 0 to 255.Reference exposure timeThe “Reference exposure time”command is a parameter which sets time to measure a reference spectrum in manual mode. The range of the upper scroll bar is from 1 to 200 milliseconds, of the bottom scroll bar is from 1 to 18 times.Reference gainThe “Reference gain” command is a parameter which sets a reference gain in the manual mode. The range of a reference gain is from 0 to 255.Num. of 1st PV read-outThe “Num. of 1st PV read-out” is a number of the CCD diode array sensor to be used in the AutoGain area. The range of the Num. of 1st PV read-out is from 1 to 127.2.7. MA & Auto GainAuto gain positionThe “Auto gain position” indicates a position of an index line in the Auto gain area. You can move a position of an index line where you want to locate. If you want to display the index line, check a box next to the green color button of the left side. You can also lock the index line checking a box which is located at the right side.Gain constant displayThe “Gain constant display” indicates a position of an index line of aGain constant. The Auto gain makes a target spectrum amplifywith a vertical axis toward this line. If you want to display thisindex line, check a box next to the yellow color button of the leftside.D lineThe “D line” indicates a value of a spectrum which is measured inthe dark state. The value of the D line is indicated at the right sideof the 3rd line in the MP & Auto gain window. If you want to displaya D line spectrum, check a box next to the gray color button of theleft side.MP switchThe “MP switch” command is a channel to communicate data whichconsist of a target, a reference or an offset etc. You can select achannel of data if you move this scroll bar.Auto gain SUM numberThe “Auto gain SUM number” indicates how many data you use for the auto gain. The range of this parameter is from 1 to 253.Auto gain gainThe “Auto gain gain” command is a parameter which sets a gain of auto gain. The range of an auto gain gain is from 0 to 255. If you want to display a spectrum of an auto gain, check a box next to the scroll bar in the left side.Status windowThe “Ring buffer” is a memory buffer to load the data of a spectrum. It consist of the 4 blocks, is rotated from 0 to 3 automatically. The “Flag” is one of the inner circle channels in the spectrometer. It is mapped as a target is 1, a reference is 2, an offset is 3 and a D line is 4. The “Target” and “Others” columns indicate a state of a reference or an offsetstate. The “Gain”is a value of a gain in the target andreference (or offset) mode. The “Size” is a size of the target asthe 0.1mm unit. The “Speed” is a speed of the turn table as0.5mm/sec unit. The “Number”is a counter of the targetwhich is reset if you click the button located left bottom side.The “Exp. time”is a exposure time of target. The “E Size”don’t use in this research project.2.8. Motor & LampMotor Stop positionThis parameter cannot be used and needn’t in this researchproject. It has to be installed an elevation motor in the lamphousing which is used the on-line packing house system.Turn TableThe “Turn Table” command is used when you want to operatethe Fruits-analyzer. If you click “ON” button, the turn table ofthe Fruits-analyzer starts to be rounded measuring aspectrum. You can find a speed value of the turn table in theright side of this command. The range of the speed of the turntable is from 0m/min to 90m/min (from 0 to 3000 pulse). Butyou have to calculate a speed value from pulse to mm/second,because, its value is displayed as pulse unit. For example, if it is displayed 100, the speed of turn table is 50mm/second.Lamp1 (or Lamp2)This command is used when the lamp1 (or lamp2) is turned on or off. You can control the light level of lamp1 (or lamp2) using the scroll bar in the Lamp1 (or Lamp2) command. The range of the light level is from 0 to 10. If you set the light level 10, the lamp1 (or lamp2) is set full level of 100 watt.Lamp3, 4The command cannot be used and needn’t in this research project.3. Calculation3.1. Edit dataTable 1. The data sheet of NIR spectra.If you open a spectrum file using the EXCEL software, you can load a data sheet of spectra. (Table 1) The spectrum data is only from the 15th line to the 274th line in the full 600 lines. But you had better use only from 15th line to the 269th line to the edit data in the EXCEL software. The meaning of the value of the 15th line is the value of the spectrum in the 643.26nm. The values from the 1st line to the 14th line are meaning of target mode, a value of gain, a size, a speed of the turn table, a number, a target exposure time, a dummy size, a dummy value1 –7, respectively. In Table 2, you can find the data edited from the Table 1. The data in the Table 2 are the spectra of water which is changed by temperature conditions.The data of spectra in the Table 3 which is the absorbance spectra of water are calculated from Table 2 using a follow simple equation. N o.w at er-100C w at er-90C w at er-80C w at er-70C 1111120000381898189818981894162551625516255162555111162002002002007162851628516285162858000093025305430393027 101967198819621988 11585587588582 12620612623608 13634635625635 14709723714719 151820181118151815 161837183618341844 171855186018511839 181878187718601864 191882189318881895 201912190819051909 211944193719271928 221947195419491954 231977197019661962 241992198719971982 252018201720222011 262041204520502030 272074207920572068 282103210721072111 292128214821312132 302179216521552162)lineD -Target lineD - Reference log(AbsorbanceTable 2. The data sheet of raw spectra in the water which is changed by temperature conditions643.26644.55645.88647.21648.54649.87651.2652.53653.9water-100C 182018371855187818821912194419471977water-90C 181118361860187718931908193719541970water-80C 181518341851186018881905192719491966water-70C 181518441839186418951909192819541962water-60C 181718301851185418841901191919431970water-50C 179318351850186718841891191419481957water-40C 179618181844184518791897191919291952water-30C 178918341827184218731899190619321946Reference 158615951618163116401659167216961714D line470470470470470470470470470Table 3. The data sheet of absorbance spectra in the water which is changed by temperature conditions.643.26644.59645.92647.25648.58649.91651.24652.57653.9water-100C -0.083-0.085-0.082-0.084-0.082-0.084-0.089-0.081-0.08water-90C -0.08-0.084-0.083-0.083-0.085-0.083-0.087-0.083-0.08water-80C -0.081-0.084-0.08-0.078-0.083-0.082-0.084-0.081-0.08water-70C -0.081-0.087-0.076-0.079-0.086-0.083-0.084-0.083-0.08water-60C -0.082-0.082-0.08-0.076-0.082-0.08-0.081-0.08-0.08water-50C -0.074-0.084-0.08-0.08-0.082-0.077-0.08-0.081-0.08water-40C -0.075-0.079-0.078-0.073-0.081-0.079-0.081-0.076-0.08water-30C-0.073-0.084-0.073-0.073-0.079-0.08-0.077-0.076-0.073.2. View SpectraThe fact is that the explanation of usage of the PureSpect software finished in this stage, because you will get to use the “The Unscrambler ” application software from this step. If you have already gained experience in working with “The Unscrambler ” software, it will be unnecessary to explain the next step. By the way, if you import the EXCEL file which has the data sheet of the absorbance spectra in the “The Unscrambler ” software, you must be able to draw the spectra on the “The Uncrambler ” window and proceed to future steps.。