图标作文常用表达总结
图表作文常用表达
might conclude that…
❖As is shown in the graph… 如图所示… ❖As can be seen from the table,… 从表格中能够
在描述中常用到旳词:
❖significant changes 图中某些较大变化
❖noticeable trend 明显趋势
❖during the same period 在同一时期
❖grow 增长
❖distribute 分布,区别
❖unequally 不相等地
❖in the case of adv. 在……旳情况下
(2) The graph shows /tells/reveals that… (3) As is shown/can be seen in the chart that… (4) The table is /gives information/about… (5) The table represents the development and changes
图表作文
常见旳图表类型有: 1.table(表格) 2.curve graph(曲线) 3.Bar Graph(柱状) 4.Pie Graph(饼状)
1) 表格(table),它表达多种事物旳相互关系
E
D
A
B
C
m
n
f
g
e
z
p
q
x
y
o
h
2)曲线(curve graph ),它常用表达事物旳变化趋势:
系
20.4 20.4 27.4
图表类作文方法总结 + 范文中的优秀句子.doc
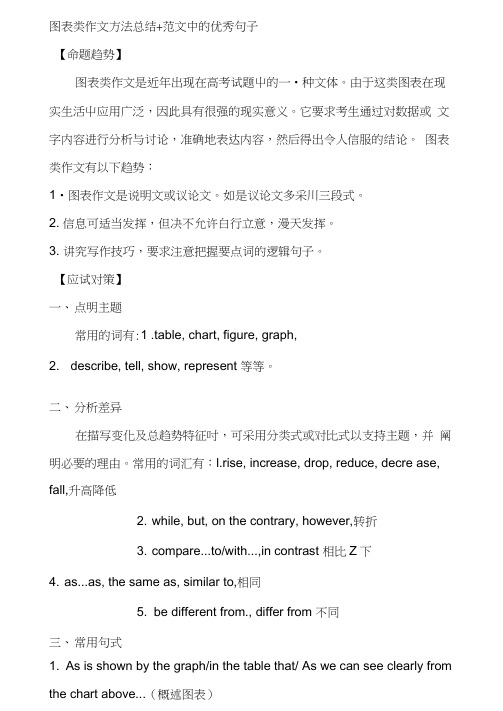
图表类作文方法总结+范文中的优秀句子【命题趋势】图表类作文是近年出现在高考试题屮的一•种文体。
由于这类图表在现实生活屮应用广泛,因此具有很强的现实意义。
它要求考生通过对数据或文字内容进行分析与讨论,准确地表达内容,然后得出令人信服的结论。
图表类作文有以下趋势:1•图表作文是说明文或议论文。
如是议论文多采川三段式。
2. 信息可适当发挥,但决不允许白行立意,漫天发挥。
3. 讲究写作技巧,要求注意把握要点词的逻辑句子。
【应试对策】一、点明主题常用的词有:1 .table, chart, figure, graph,2. describe, tell, show, represent 等等。
二、分析差异在描写变化及总趋势特征吋,可采用分类式或对比式以支持主题,并阐明必要的理由。
常用的词汇有:l.rise, increase, drop, reduce, decre ase, fall,升高降低2. while, but, on the contrary, however,转折3. compare...to/with...,in contrast 相比Z下4. as...as, the same as, similar to,相同5. be different from., differ from 不同三、常用句式1. As is shown by the graph/in the table that/ As we can see clearly from the chart above...(概述图表)2. The results of the survey seem to suggest that… (得出结论)3•…amount to…(数量总计)(add up to /come to /sum up to )4. …increase (rise/ fall/ drop ) from …to … (数量增减)5. (be) three times as + 形容词 + as6. Compared with …,…7. There is (was) a rapid rise in …8 The changes ....can be explained for several reasons・9. It is reported that 85% of...10 In recent years/during this years ......11 ・・・ are also the reason why the number in creasing so fast.12 From the increased number we can get that...8 •结尾段屮常用的句型:1. In conclusionffo conclude/We can draw the conclusion that...,2. In my opinion/ Pers on ally, I …3. In short (= In brief), in a word,…4 it seems clear that /Ifs clear from the chart that...,5 We can learn/know that..四、优秀句子饮食・1 There have been some changes in the diet of Chinese people. ^Grain, the main food of most people in China, is now playing a less important role. ・3The amount of ............ h as also dropped by 1.5 percent from1998 to 2002・・4The amount of milk and meat has increased・•5 There is no doubt that there will be greater changes in peopled diet in the future.教育•6 It is reported that 85% of the Chinese students felt a heavy workload in their study.7 ...more than 50%of the information is forgotten after one hour, and almost two-thirds within one day・8 2000 the number had in creased to 83%,still much lower for girlsthan for boys・9 The results of the survey seem to suggest that Chinese students abroad have little time for part-time jobs.旅游0 In contrast, the number of people going abroad in 1996 increased.11 There is a growing tendency for Chinese to spend their holiday abroad ・ 12 Compared with the number 5 years ago, which was only 20%, now more than 50% of the families prefer to spend their holiday traveling.志愿者13 The number of people who do voluntary work are growing.14 Increasing numbers of Chinese youth want to make a contribution to society.其他15 Of all other things they spend their wages on, the most important were phone calls (40%), followed closely by clothes and makeup (35%)and going out (15%).16 In 1995 there were only two or three computers in per hundred families.17 In the past, one in three families could afford to buy houses, while now 70% of them have their own flat. 调査18 On 8th November 2004, a survey was conducted among 400 Chinese students at different universities in Auckland.19 The purpose of the survey was to discover what the students do in their free time, after school.20 The survey was conducted by means of a questionnaire given to the students to complete・附:分数表示法3/4 three fourths 或three quarters1/3 one third 或a third1/2 a half。
高级图表作文常用表达
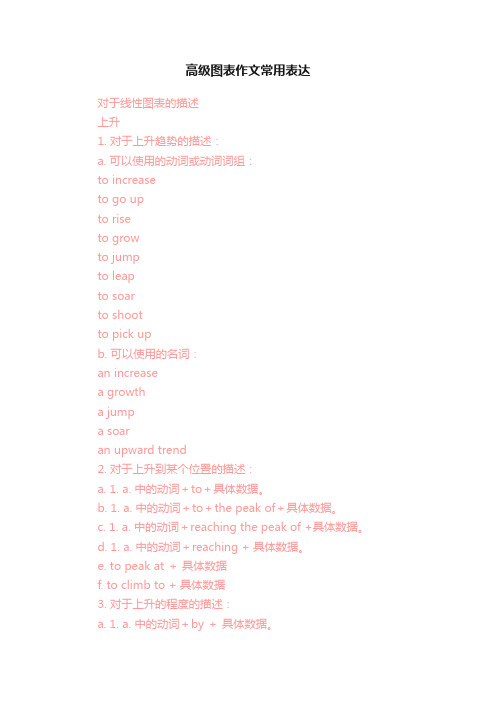
高级图表作文常用表达对于线性图表的描述上升1. 对于上升趋势的描述:a. 可以使用的动词或动词词组:to increaseto go upto riseto growto jumpto leapto soarto shootto pick upb. 可以使用的名词:an increasea growtha jumpa soaran upward trend2. 对于上升到某个位置的描述:a. 1. a. 中的动词+to+具体数据。
b. 1. a. 中的动词+to+the peak of+具体数据。
c. 1. a. 中的动词+reaching the peak of +具体数据。
d. 1. a. 中的动词+reaching + 具体数据。
e. to peak at +具体数据f. to climb to + 具体数据3. 对于上升的程度的描述:a. 1. a. 中的动词+by +具体数据。
b. 1. a. 中的动词+副词。
(见下降1. 对于下降趋势的描述:a. 可以使用的动词或动词词组:to fallto decreaseto go downto slideto collapseto declineto dropb. 可以使用的名词:a collapsea decreasea falla declinea drop2. 对于下降到某个位置的描述:a. 1. a. 中的动词+to+具体数据。
b. 1. a. 中的动词+to+the bottom of+具体数据。
c. 1. a. 中的动词+reaching the bottom of +具体数据。
d. 1. a. 中的动词+reaching + 具体数据。
3. 对于下降程度的描述:a. 1. a. 中的动词+by +具体数据。
b. 1. a. 中的动词+副词。
(见对于平稳的趋势的描述:可以使用的动词或动词词组:to hardly changeto have little changeto keep steadyto level offto remain constantto stay the same表示程度的副词:1. 程度较大:considerablydramaticallygreatlymarkedlyobviouslyquicklyrapidlysharplysignificantlysuddenly2. 程度较小:slightlygraduallyslowlysteadily时间的嵌入嵌入时间时所使用的介词和介词词组:infrom……to……between…….and……during……and……at the start of ……by the end of ……over ……at the end of ……throughout ……时间’s + 具体数据上升和下降趋势的组合描述(嵌入了时间和程度之后):1. 先上升后下降的句型:...... increased slowly during…… and …… but fell sharply in …….A steady fall in …… during …… and …… followed the sharp increase in …….2. 先下降后上升的句型:…… fell before …… began to make a recovery ………… continue the recovery, climbing to ………… dropped during …… but increased again in ………… fell and then pick up during ………… collapsed before rising to ……at the end of ……3. 起伏波动的句型:…… fluctuated sharply all through ……4. 波动不大的句型:…… hardly changed through the period between ……and ……柱状图形的描述转换为线形图形的描述饼状图形的描述对于百分比进行描述所使用的句型:…… % the …… is/has/have/are ………… accounts for ……% of the total…… takes up ……% in the whole chart趋势的比较1. 表示相似的句型 (实例) :Both share prices rose sharply in January.Neither company has made a profit yet.Like X, Y fell in June.X rose just as sharply as Y.2. 表示差异的句型(实例):X fell sharply whereas/while Y remained steady.X fell quickly compared to Y.Unlike Y, X rose by 10%.X rose far more dramatically than Y.3. 表示倍数的句型:the …… doubled/tripled in …… compared with those in ……4. 客观比较的句型:…… is …… in contrast to ……数据的修饰1. 表示不足的词或词组:up tobelowunderalmostnearly2. 表示超过的词或词组:overmore thanjust over3. 表示大约的词:about补充一点点:一. 主章开头图表类型:table; chart; diagram; graph; column chart; pie graph描述:show; describe; illustrate; can be seen from; clear; apparent; reveal; represent内容:figure; statistic; number; percentage; proportion二. 表示数据一般:have 10%; at 10%;over 10%最高(低)点:peaked; reached a peak/high(point)bottomed out; reached the bottom变化:recover 略有回升; increase; jump; rise/rose; climb; decrease; fall/fell; drop; decline; reducefluctuate 浮动,摇摆不定remained steady/stable; stay the same; little/hardly any /no change变化程度:sudden/suddenly 突然的,意外的rapid/rapidly 迅速的,飞快的,险峻的dramatic/dramatically 戏剧性的,生动的significant/significantly 有意义的,重大的,重要的sharp/sharply 锐利的,明显的,急剧的steep/steeply 急剧升降的steady/steadily 稳固的,坚定不移的gradual/gradually 渐进的,逐渐的slow/slowly 缓慢的,不活跃的slight/slightly轻微的、略微地stable/stably 稳定的表示范围:from…to… between…and… for …to …多长时间直到表示程度:almost adv. 几乎,差不多nearly adv. 几乎,密切地approximately adv. 近似的,大约about adv. 附近,大约,转向,左右,周围just over 刚超过over adv. 结束,越过,从头到尾exactly adv. 正确地,严密地precisely adv. 正好精确地;清晰地比例:20 per cent 20%one in three 1/3one out of every four 1/4三。
图表类小作文必备句型
图表类小作文必备句型
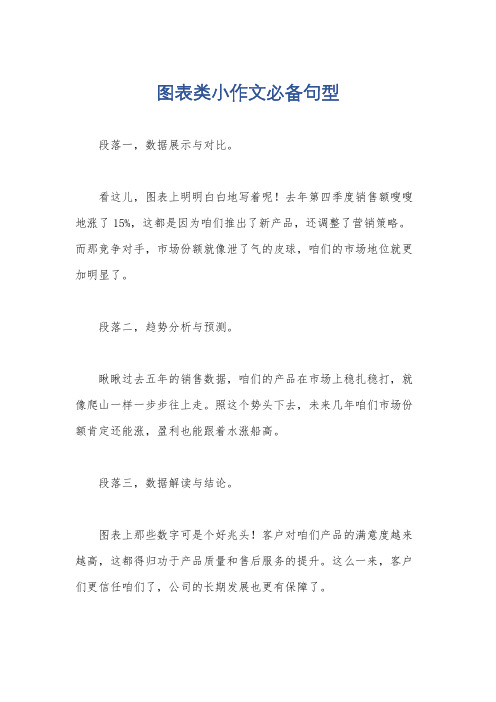
段落一,数据展示与对比。
看这儿,图表上明明白白地写着呢!去年第四季度销售额嗖嗖地涨了15%,这都是因为咱们推出了新产品,还调整了营销策略。
而那竞争对手,市场份额就像泄了气的皮球,咱们的市场地位就更加明显了。
段落二,趋势分析与预测。
瞅瞅过去五年的销售数据,咱们的产品在市场上稳扎稳打,就像爬山一样一步步往上走。
照这个势头下去,未来几年咱们市场份额肯定还能涨,盈利也能跟着水涨船高。
段落三,数据解读与结论。
图表上那些数字可是个好兆头!客户对咱们产品的满意度越来越高,这都得归功于产品质量和售后服务的提升。
这么一来,客户们更信任咱们了,公司的长期发展也更有保障了。
段落四,数据背后的故事。
这些数据可不是天上掉下来的,背后都是咱们团队的辛勤付出。
从市场调研到产品研发,再到市场推广,每个环节都少不了团队成
员的智慧和努力。
这些成绩,都是大家用汗水和智慧换来的。
段落五,数据的启发与启示。
看着这些数据,我心里就有数了。
想要在竞争激烈的市场中站
稳脚跟,就得不断创新,满足客户需求。
这些数据不仅仅是数字,
更是咱们未来发展的指南针。
四级图表作文常用表达
图表作文常用表达作为特殊的说明文形式,图表作文有其语言特点,尤其是要大量使用数字信息,说明数字变化情况,因此有必要学习一些常用的表达方式准确规范地写好图表作文。
图表的表述:图表类型:table; chart; diagram; graph; column chart; pie graph描述:show; describe; illustrate; can be seen from; clear; apparent; reveal; represent内容:figure; statistic; number; percentage; proportion数字变化的表述:上升:increase rise ascend core surge go up climb mount level up下降: decrease fall drop descend decline reduce lessen level down平稳:stable steady remain/maintain/keep/be the same as/similar to波动:fluctuate fluctuation rise and falls up and down占:occupy take up account for gain而:while however whereas on the other hand actually/in fact相比:by contract on the contrary likewise compared with最高点:the highest the top the summit the peak the most最低点:bottom less least rock bottom平均:mean average趋势:tendency trend inclination预见:prediction达到顶峰: mount to在***中占***:***gain the percentage of有一个稳定的过程:a stable period can be seen。
考研英语二图表类作文常用描述词汇及表达
考研英语二图表类作文常用描述词汇及表达本文汇总了考研英语二大作文图表类作文写作中描述词汇、词组及句型常用表达的相关内容,帮助大家在考研英语作文中拿到高分。
图表描述词汇、词组及句型常用表达基本要素类型:table, chart, diagram/graph, column chart, pie graph描述:show, describe, illustrate, reveal, represent, can be seen from, clear, apparent内容:figure, statistic, number, percentage, proportion表示数据变化的单词或者词组–动词(1) 起伏、波动rise and fall, fluctuate, wave, undulate, rebound, recover(2) 高、低点值peak, reach a (high) peak/point,reach the bottom, reach a low point(3) 增加、上升、提高increase, grow, rise, climb, expand, ascend, skyrocket, soar(4) 减少、下降decrease, decline, fall, drop, descend, diminish, slide, shrink, collapse 形容词或副词(1)变化巨大迅速的,飞快的,rapid/rapidly戏剧性的,生动的dramatic/dramatically有意义的,重大的significant/significantly锐利的,明显的sharp/sharply急剧升降的steep/steeply(2)变化平缓稳固的,坚定不移的steady/steadily渐进的,逐渐的gradual/gradually缓慢的,不活跃的slow/slowly轻微的、略微地slight/slightly稳定的stable/stably英语图表写作套句推荐图表的总体描述1.The table shows the changes in the number of……over the period from……to……2.The data/statistics/figures lead us to the conclusion that……3.As can be seen from the diagram, great changes have taken place in……/ the two curves show the fluctuation of……4.From the table/chart/diagram/figure, we can see clearly that……or it is clear/apparent from the chart that……5.This is a graph which illustrates……6.The graph, …presented in a pie chart, shows the general trend in……7.This is a column chart showing……时间段表达方式1.over the period from…to…the…remained level.2.in the year between……and……3.in the 3 years spanning from 1995 through 1998……4.from then on/from this time onwards……数据变化表达方式表示上升趋势的句型:1.the number sharply went up to……2.the figures peaked at……in(month/year)3.the situation reached a peak(a high point at) of[%].4.a increased by……5.a increased to……6.there is an upward trend in the number of……7. a considerable increase/decrease occurred from……to……8.……(year)witnessed/saw a sharp rise in……表示下降趋势的句型:1.the figures/situation bottomed out in……2.the figures reached the bottom/a low point/hit a trough.3.from……to……the rate of decrease slow down.4.from this year on,there was a gradual decline/ reduction in the……,reaching a figure of……表示平稳趋势的句型:1.the number of……remained steady/stable from (month/year) to (month/year).2.the percentage of…stayed the same between…and……3.the percentage remained steady at……表示比较的句型:1.the percentage of…is slightly larger/smaller than that of2.there is not a great deal of difference between……and……3.…decreased year by year while……increased steadily.4.there are a lot similarities/differences between……and……5.a has something in common with b6.the difference between a and b lies in……表示倍数的句型:1.the graphs show a threefold increase in the number of……2.a is ……times as much/many as b.。
四级考试图表作文中常用表达
1.图表类型:table 表格; chart 图表; diagram图表或图解,示意图; graph图表, 曲线图; column/ bar chart柱状图; pie graph饼图2. 描述:show; describe; illustrate; can be seen from; reveal 显示; represent 表现, 描绘3.内容:figure数字; statistic统计值; statistics [用作复]统计, 统计数字[资料], 统计表number; percentage; proportion●表示数据上升:increase, rise, ascend, core, surge, go up, climb, mount, level up下降: decrease, fall, drop, descend, decline, reduce ,lessen, level, down平稳: stable, steady, remain steady/stable; /maintain/keep/be the same as/similar to ; little/hardly any /no change波动: fluctuate, fluctuation, rise and falls, up and down占: occupy,take up,account for, gain而: while, however, whereas , on the other hand, actually/in fact相比: by contract, on the contrary, likewise, comparedwith最高点: the highest, the top, the summit, the peak, the most最低点: bottom, less, least, rock bottom最低点例句Prices have hit rock bottom. 价格已达最低水平平均: mean平均值, average趋势: tendency, trend, inclination预见: prediction达到顶峰: mount to比例:20 per cent , 20%one in three, 1/3one out of every four,1/4有一个稳定的过程: a stable period can be seen表示变化程度的词:sudden/suddenly 突然的,意外的rapid/rapidly 迅速的,飞快的,险峻的dramatic/dramatically 戏剧性的,生动的significant/significantly 有意义的,重大的,重要的sharp/sharply 明显的,急剧的steep/steeply 急剧升降的steady/steadily 稳固的,坚定不移的gradual/gradually 渐进的,逐渐的slow/slowly 缓慢的,不活跃的slight/slightly 轻微的、略微地stable/stably 稳定的表示范围:from…to…between…and…for …to …多长时间直到表示程度:almost adv. 几乎,差不多nearly adv. 几乎,密切地approximately adv. 近似的,大约just over 刚超过exactly adv. 正确地,严密地precisely adv. 正好精确地;清晰地●常用词和短语significant changes 图中一些较大变化noticeable trend 明显趋势during the same period 在同一时期grow/grew 增长distribute 分布,区别unequally 不相等地pronounced 明显的average 平均no doubt 无疑地corresponding adj. 相应的,通讯的represent vt. 阐述,表现overall 体上讲except 除外in the case of adv. 在…的情况下in contrast 相反,大不相同in conclusion adv. 最后,总之in comparison 相比之下inversely adv. 相反地,倒转地in general 通常,大体上,一般而言rang from…to 从…到…不等excessive adj. 过多的,过分的,额外lower v. 降低,跌落elapse vi. (时间)过去,消逝category n. 种类government policy 政府政策market forces 市场规律measure n. 尺寸,方法,措施v.估量,调节forecast n. 先见,预见表示程度的副词:1.)程度较大:considerably dramatically greatly markedly obviously quickly rapidly sharply significantly suddenly2)程度较小:slightly gradually slowly steadily四、图表作文常用的句型(1)常用的开篇句型(即概述图表内容时常用的表达法)①According to the table/pie chart/line graph/bar graph, we can see/conclude that …根据该表/图,我们可知……②The table/graph reveals (shows/indicates/illustrates/ represents/points out) that …该表/图表明……③As we can see from the table …As can be seen from the line/bar graph …As is shown (illustrated/indicated) in the pie chart …如表/图所示,……(2) 描述增减变化常用的句型①Compared with …is still increased by …②The number of …grew/rose from …to …③An increase is shown in …; then came a sharp increase of …④In …the number remains the same/drops to …⑤There was a very slight (small/slow/gradual) rise/increase in 1990.⑥There was a very steady (marked/sharp/rapid/sudden/ dramatic) drop (decrease/decline/fall/reduction) in 1998/ compared with that of last year).表示“说明”的常用句型:⏹As can be seen from the diagram/chart/graph/table…⏹As is revealed/illustrated/shown/stated/noted in the chart…⏹It can be seen from the chart/table/statistics that…⏹The figure suggests/shows/indicates/illustrates/demonstratesthat…⏹The chart gives information that…表示“结论”的常用句型:⏹From the analyses above, we can draw/arrive at/cometo/make/reach the conclusion that…⏹From the above data we can conclude…⏹According to the information gathered above, we may reachthe conclusion that…⏹The graph reflects that…⏹We can make a conclusion from the above that…表示“数据”的常用句型:⏹…had the largest percentage/proportion of…⏹…make(s) up/ take(s) up/ account(s)for…percent.⏹On the top of the list is…, which accounts for…percent.⏹At the bottom is…, which takes up…percent.⏹Compared with A, B has a higher/lowerpercentage.⏹A is second to B.⏹A is ranked/ rated first, followed by B at…percent and C at…percent.⏹A is twice as much/ many as B.⏹A is three times faster/slower than B.⏹A is …percent higher than B.⏹A is slower than B by three times.⏹The number of A is three times as much as thatof B.表示“成倍变化”的常用句型:⏹The number has doubled/tripled,between…and…⏹From …to…,…increased/dropped more than six fold.⏹A is twice/three times/four times the amount in…表示“极点变化”的常用句型:⏹The situation/figures reached a peak/high at…percent in…⏹The situation/figures bottomed out at…percent in…表示“数据增长”的常用句型:⏹There was a rapid/sharp/dramatic/marked/gradual/slowrise/increase/upward…⏹It increased/rose/went up from…to…⏹It has risen to an average of…⏹The number of…is on the rise/increase.⏹The number of …tends to go up/increase/rise.⏹There was a boom in the number of…from…to…⏹The number of…climbed/jumped/rose suddenly/went sharplyup/soared to…in…表示“数据下降”的常用句型:⏹There was a fall/decrease/reduction/decline/drop/downwardtrend…⏹The number of…has fallen/dropped/declined to…⏹The number of …is on the decline.⏹The number of …tends to go down/decrease/fall/drop.表示“变化不大”的常用句型:⏹There was a slight fluctuation in the number of…from…to…⏹The number of…remained steady/stable/constantbetween …and…⏹There was little/hardly any change in the numberof…between …and …⏹The number of …remained level between …and…⏹The number of…remained steady atapproximately…between…and…。
【仅供参考】图表类作文专用词汇表达

图表类作文专用词汇表达汇总:表示增长的词汇表达:increase (v, n)rise (v, n), climb (v, n), grow(v)-growth (n),surge (v, n), jump (v, n), soar (v)表示下降的词汇表达:decrease;fall (v, n),drop (v, n), decline (v, n), slip to (v, n),fall sharply; decrease dramatically slide away, plunge to a low of…(v),表示程度的词汇表达:程度剧烈的表达方式:急剧的、猛烈的、迅速的sharp (a), dramatic (a), rapid(a), considerable(a), exponential (a),marked (a), significant (adj), sharply(adv), dramatically (adv),rapidly(adv),considerably(adv),exponentially(adv), markedly (adv),significantly(adv),A 描述对象(含地点)+趋势变化的动词+程度副词+时间例如: The unemployment rate of China increases sharply /dramatically/significantly /considerably during the year 1990 to 2005.The unemployment rate of China increased sharply /dramatically/significantly considerably from 1990 to 2005The unemployment rate of China increases sharply /dramatically/significantly /considerably in recent years.B There be+a/an+程度形容词+趋势变化的名词+in+描述对象(含地点)+时间例如:There will be a dramatical/sharp/rapid increase in unemployment rate of China in 2015.C 地点+see+a/an+程度形容词+趋势变化的名词+in+描述对象+时间例如:China saw a sharp /considerable /rapid increase in unemployment rate between 1905 and 1945.China saw a sharp /considerable /rapid increase in unemployment rate between 1905 and 1945.程度和缓的表达:逐步的、慢慢、渐进的Gradually-gradual, slightly-slight, smoothly-smooth, moderately-moderate例如:The unemployment rate of China increases gradually/slightly/smoothly/ moderately in recent years.There was a gradual/ slight / moderate increase in the unemployment rate ofChina from the year 1990 to 1995.◆中国失业率从..到…增长了10%The unemployment rate of China increased by 10%, from…in…to…in…There was a rise of 12% in the unemployment rate of China, from…in…to…in…China saw a growth of 12% in the unemployment rate of China, from…in…to…in…◆中国的失业率从..到…减少了四倍The unemployment rate of China decreased fourfold, from…in…to…in…There was a fourfold drop in the unemployment rate of China, from…in…to…in…China saw a fourfold fall in the unemployment rate of China, from…in…to…in…三者以上比较类表达方式:最大Max:The largest, the highest, the most=the largest number of=the largest amount of,the most popular/prevalent/widely enjoyed, stay in top position in terms of,例如:China is a country which holds the most / the largest number ofpopulation in the world.例如:Cell phone is one of the most popular/prevalent / widely enjoyed means of communication.例如:Russia stays in top position in terms of land area第二大值表达Second Largest:…be the second+形容词最高级…take the second place in terms of…The next one is/was …例如:Canada is the second largest country /Canada takes the second place in terms of land area中间值表达Middle:This is/was followed by……maintain(ed) the middle positions例如:Canada takes the second place in terms of land area, this was/ is followed by China. 或者Canada maintained the middle positions, this is followed by China.最小值表达Min:The smallest, the lowest, the least, the smallest amount of, the fewest, the smallest number of, the least popular/prevalent/widely enjoyed例如:A listing of the seventeen smallest countries in the world can be learned from encyclopedia.倍数表达…be+倍数词+as+形容词(large/much/many/high)+as+(that of…)…be+倍数词(减1)+比较级(larger/more/higher)+than+(that of…)例如:老虎数量是狮子的4倍。
图画图表作文常用语言及通用句式【已总结】
图画图表作文常用语言及通用句式1、图的种类及相关表达漫画cartoon(亦可做连环漫画,讽刺漫画),caricature漫画家cartoonist迪斯尼动画片 a Walt Disney Cartoon图片picture照片、相片photograph图形graph,chart,diagram,illustration饼图,圆形图pie chart,pie graph条形图,柱状图bar chart,column chart,histogram直线图,曲线图line chart,curve diagram表格图table程序图processing diagram,procedures diagram流程图,过程图flow chart,sequence diagram树型图tree diagram线条line直线the straight line虚线the dotted line肖像绘画portrait painting轮廓,外形outline2、图表数据的种类及相关表达数字figure 数量,数字number 数据,信息data统计数据statistic 比例proportion 百分比percentage3、图表作文通用句式a)The table shows the change in the number of …over the period from …to…该表格描述了从…年至…年间…数量的变化。
b)The bar chart illustrates that ..该柱状图展示了……c)The pie graph depicts that…该圆形图揭示了……d)The tree diagram reveal how..该树形图向我们揭示了该如何……e)The data ( statistics , figures) lead us to the conclusion that …这些数据资料令我们的出结论…f)This is a graph which illustrates …这个图表向我们展示了…g)This table shows the changing proportion of a & b from… to …该表格描述了从…年到…年间a与b的比例关系。
图表作文常用语言手段

图表作文常用语言手段1.表示“出处” 的句子结构在图表作文中(尤其是在文章的引言部分)需要说明数据和信息的来源,如:The table shows the estimated number of visitors to the UK between 1982 and 1987.As can be seen from the table, there was an 85 percent increase in real expenditure during this period.上述两例中的划线部分表明了信息的来源。
类似的结构还有很多,现归纳如下:需要强调的是,以上结构在同一篇图表作文中使用不宜过多, 而且需要尽量避免不必要的重复。
2.描述“数据变化”的常用表达方式注:在描述“增长”趋势时,有2两种结构可供选用:a) Sales increased in the first quarter.b)There was an increase in sales in the first quarter.注:在描述“下降”趋势时,有2两种结构可供选用:a) Unemployment levels fell .b) There was a fall in unemployment levels.b. 表示变化的副词和形容词在描述“增加”、“下降”以及“波动”等变化时,需要根据具体情况恰当地使用表示变化程度和速度的形容词或副词。
如:There has been a slight increase in the value of the dollar. [形容词slight表时变化的程度]Unemployment fell rapidly last year. [副词rapidly表时变化的速度]描述变化“程度”的形容词和副词表示变化速度的形容词和副词3.描述“数据”的表达方式percentNegroes constitute 10% of the general population. 黑人占整个人口的10%。
英语图表作文常用句型和结构
英语图表作文常用句型和结构1) 常用的开篇句型(概述图表内容、描述总趋势)The table/chart/graph/diagram shows the changes in the number of...over the period from...to...该表格描述了在...年之...年间...数量的变化。
According to the table, we can see/conclude that …根据该表/图/数字,我们可知……The chart/table/graph…reveals (/reflects/shows) that …该表/图表明……The figures provided in the chart show (that)... 数据(字)表明...The graph provides some interesting data regarding/about/on/of...该图为我们提供了有关...有趣数据。
As can be seen from the diagram, great changes have taken place in...从图中可以看出,...发生了巨大变化。
As is shown (illustrated/indicated) in the pie chart ( that)….…如图所示...From the chart, we know that... 从这张表中,我们可知..It can be seen /concluded from the line /bar/chart /table that ….There is a great difference (a sharp contrast) between …The data/statistics/figures lead us to the conclusion that...这些数据资料令我们得出结论...All these data clearly prove the fact that... 所有这些数据明显证明这一事实,即...The graphs show a threefold increase in the number of...该图表表明...的数目增长了三倍。
图表作文常用表达方法

1、图形种类及概述法:、图形种类及概述法:泛指一份数据图表:a data graph/chart/diagram/illustration/table 饼图:pie chart 直方图或柱形图:bar chart / histogram 趋势曲线图:line chart / curve diagram 表格图:table 流程图或过程图:flow chart / sequence diagram 程序图:processing/procedures diagram 2、常用的描述用法、常用的描述用法The table/chart diagram/graph shows (that)According to the table/chart diagram/graph As (is)shown in the table/chart diagram/graph As can be seen from the table/chart/diagram/graph/figures,figures/statistics shows (that)……It can be seen from the figures/statistics We can see from the figures/statistics It is clear from the figures/statistics It is apparent from the figures/statistics table/chart/diagram/graph figures (that)……table/chart/diagram/graph shows/describes/illustrates how……3、图表中的数据(Data)具体表达法)具体表达法数据(Data)在某一个时间段固定不变:fixed in time 在一系列的时间段中转变:changes over time 持续变化的data在不同情况下:在不同情况下:增加:increase / raise / rise / go up ……减少:decrease / grow down / drop / fall ……波动:fluctuate / rebound / undulate / wave ……/ stabilize / level off ……稳定:remain stable / stabilize / level off ……最常用的两种表达法:最常用的两种表达法:动词+副词形式(V erb+Adverb form)形容词+名词形式(Adjective+Noun form)二、相关常用词组二、相关常用词组1、主章开头、主章开头图表类型:table、chart、diagramgraph、column chart、pie graph 描述:show、describe、illustrate、can be seen from、clear、apparent、reveal、represent 内容:figure、statistic、number、percentage、proportion 2、表示数据变化的单词或者词组、表示数据变化的单词或者词组rapid/rapidly迅速的,飞快的,险峻的迅速的,飞快的,险峻的dramatic/dramatically戏剧性的,生动的戏剧性的,生动的significant/significantly有意义的,重大的,重要的有意义的,重大的,重要的sharp/sharply锐利的,明显的,急剧的锐利的,明显的,急剧的steep/steeply急剧升降的急剧升降的steady/steadily稳固的,坚定不移的稳固的,坚定不移的gradual/gradually渐进的,逐渐的渐进的,逐渐的slow/slowly缓慢的,不活跃的缓慢的,不活跃的slight/slightly轻微的、略微地轻微的、略微地stable/stably稳定的稳定的3、其它在描述中的常用到的词、其它在描述中的常用到的词significant changes图中一些较大变化图中一些较大变化noticeable trend明显趋势明显趋势during the same period在同一时期在同一时期grow/grew增长增长distribute分布,区别分布,区别unequally不相等地不相等地in the case of adv.在……的情况下的情况下in terms of / in respect of / regarding在……方面方面in contrast相反,大不相同相反,大不相同government policy政府政策政府政策market forces市场规率市场规率measure n.尺寸,方法,措施v.估量,调节估量,调节forecast n.先见,预见v.预测预测三、考研英语图表写作套句精选三、考研英语图表写作套句精选1.the table shows the changes in the number of……over the period from……to……该表格描述了在……年之……年间……数量的变化。
图表作文常用的表达法
以下是图表作文常用的表达法:1.According to the figures shown in the table/graph we can see/conclude that...例句:According to the figures shown in the table, we can see that great changes have been taking place in people's diet over the period from 1988 to 1998.2.We can see/We have noted/It can be seen from the table/chart/graph that...例句:We have noted from the graph that there is a wide gap between the top ten universities both of China and of the world.3.The graph/table/chart shows/indicates/reveals/points out that...例句:The chart reveals that the number of road accidents is spiraling upward every year as more and more highways are constructed all over China.4.As is shown/can be seen in the chart/graph/diagram released by the government...例句:As we can see in the diagram released by the government, the rapid growth of population has resulted in the extinction of many wildlife species.5.After considering the information in the graph/table/chart, we might conclude that...例句:After considering the information in the graph, we might conclude that the energy structure in rural areas has been greatly improved over the past 15 years.6.The chart/graph/table shows a minimal/slight/slow/steady/marked/dramatic/sharp/sudden increase/rise/decline/reduction/fall/drop pared with those of last year/10 years ago/last century...例句:The graph shows a marked decline in the number of wildlife species compared with that of last century.7.This year, the products of...dropped to half/was cut in half/doubled/tripled.例句:This year, the products of cotton doubled.8.The number of ... grew/rose/dropped from...to...例句:The number of car accidents grew from 3691 in 1985 to 8245 in 1995.9.No increase is shown in ...; then came a sharp increase of ...例句:No increase is shown in 1988; then came a sharp increase of 8 million.10.Sth. is twice/three/half as large/high/much as sth. else.例句:The production of cotton is twice as much as that of wheat.11.The table/chart/graph represents the development and changes in ...例句:The table represents the development and changes in agriculture structure in the past 30 years.12.By comparison with..., it dropped/ fell/ decreased from...to.../ by...例句:By comparison with 1990, it dropped by 15 percent.13.There appeared an even more stable/consistent/steady tendency to rise/drop.14.The curve has leveled off/stayed the same/remained unchanged for 2 years and the trend will be continuing .一、在运动范畴中存在着如下的8种运动趋向:1.保持平稳:我们可以使用的套用结构有:stay stable/remain steady.举例:表示人口数量保持平稳的时候可以写:the number of population stayed stable./the number of population remained steady.2.上升/增加:我们可以使用的套用结构有:rise/climb/increase/ascend /mount/aggrandize(增加) 举例:人口上升:the number of population increased/ascended/mounted等等。
2020年中考英语作文万能模板:图表类作文
2020年中考英语作文万能模板:图表类作文(名师剖析高分技巧+万能模板,值得下载背诵)图表类作文一、常用表达1. 常用词汇从……增加到……, great changes 图中一些较大变increase from …to化during the same period 在同一时; grow/grew 增长; no doubt 无疑地; overall 总体上讲; except 除外; in contrast 相反,大不相同; in conclusion adv. 最后,总之; in comparison 相比之下2. 常用句型这是……的结果。
Here are the results of…The number rose to…数量增长到了……通过图表,我们可以看到……According to the graph, we can find…表格反应的是……The chart shows us that…从……我们可以发现很多重We can find many important changes in…要的变化。
From the diagram, we know that…从图表中,我们得知……The chart gives us an overall picture of the…这个图表给我们呈现了……The figures also tell us that …这些数字也告诉了我们……Judging from these figures, we can draw the conclusion…通过这些数字,我们可以得出这样的结论……The reason for this, as far as I am concerned is …据我所知,原因是……二、万能模板三、满分作文最近,学校就空中俱乐部的英语学习内容设置做了意向调查(结果见下面图表)。
请你帮俱乐部用英语写一篇报告,并谈谈你自己的想法或建议。
图表类作文常用词汇及句式

图表类作文常用词汇及句式(图表/数据):table、graph、chart、figure动词:show、tell、describe、represent表示上升的动词:increase、rise、climb、go up表示上升的名词:rise、increase表示下降的动词:fall、decline、decrease、drop、go down、reduce表示下降的名词:fall、decline、decrease、drop表示平稳的词:remain steady、remain unchanged、not change表示上升趋势:There is (was) an upward trend in (toward)表示下降趋势:There is (was) a downward trend in (toward)表示达到顶峰:reaches (reached) its peak、reaches its highest point表示达到最低点:reaches (reached) its lowest point图表类作文常用句式The table shows (indicates) that a great number of people spent their holidays traveling abroad.As we can see from the graph , the rate dropped slightly from 38% in 1993 to 31% in 2003.…From the table we can find out that only 35% of the people have taken in physical activities.…According to Chart I, the number was ten times as many as in 1995.Compared with the boys, the girls show more interested in chatting.The number of the boys playing games is much larger than that of the girls.The number of...is equal to that of...It doubled the number of last year.It is clear from the chart that as incomes increase people can afford to live more comfortably and eat well.图标类作文常用套语As can be seen from the chart,only 10% of the time is taken up with sports activities.…As is shown in the chart,the production last month rose so significantly…As is described in the chart, the total number of visitors to the United States had nearly doubled to 2.7 million person by 1974.图标类作文常用结束语After giving a careful consideration to the problem, I think I will be able to select the one who best fits the position.Therefore, we need to educate our children, warning them of the dangers of playing with matches.In conclusion, the upward trends suggest that more and more computer users will have access to Internet in the future.In summary, smoking increased three different times and declined twice, with the last downward trend still continuing.图表作文模板As is shown/indicated/illustrated by the figure/percentage in the table(graph/picture/pie/chart), _作文题目的议题_has been on rise (goesup/increases/drops/decreases),significantly/dramatically/ steadily rising/decreasing from_% in _年_ to _%_ in _年_.From the sharp/marked decline/ rise in the chart, it goes without saying that __现象总结___.There are at least two good reasons accounting for __. On the one hand, ____.On the other hand,___ is due to the fact that __.In addition, __ is responsiblefor ___.(Maybe there are some other reasons to show ______.But it is generally believed that the above mentioned reasons are commonly convincing.As far as I am concerned,I hold the point of view that _______. 再加上对策、口号。
图表作文总结
图表作文汇总时态如果图表中没有具体标明时间,描述时可采用一般现在时,但如果图表中给出了具体时间参照,则应对时态进行相应的调整。
一、图表作文经典句型分类:(一)常用的开篇句型(即概述图表内容时常用的表达法)1. According to the table/pie chart/line graph/bar graph, we can see/conclude that … 根据该表/图,我们可知……2. The table/graph reveals (shows/indicates/illustrates/ demonstrates/suggests) that … 该表/图表明……3. As we can see from the table …As can be seen from the line/bar graph …As is shown (illustrated/indicated) in the pie chart …如表/图所示,……It is clear/appar ent from the figure/statistics,…From the statistics given in the table, we estimate/conclude that, ….From the information given in the graph, we can see that,…(二)表数据变化的句式:a. 表示增加, 减少和波动的结构1. The number of…climbed/jumped/rose suddenly/ went sharply up/ soared to…in…2. There was an evident/ apparent/obvious increase in…from…to…3. The number of…increased/rose steadily/gradually from…to…4. There was a steady/gradual increase/rise in the number of…from…to…5. There was a slight/slow increase/rise in the number of…from…to6. The number of…increased/rose slightly/slowly from…to…7. The number of…decreased/ fell/ dropped suddenly / rapidly /dramatically /substantially /sharply/steeply from…to…8. There was a sudden/ rapid/ dramatic/ substantial/ sharp/ steep decrease/ drop/ reduction/ decline in the number of…from…to…9. There was an evident/ apparent/obvious reduction/decline in…from…to…10. The number of…dropped sharply/went sharply down to…in…11. The number of…increased/rose by…%from…to…12. There was a slight fluctuation in the number of…from…to…b. 表示变化不大或没有变化的结构1. The number of…remained steady/stable/constant between…and…2. The number of…stayed the same between…and…3. There was little/hardly any change in the number of…between…and…4. The number of…remained level between…and…5. The number of…remained steady at approximately…between…and…6. The number of…appeared to level off.c. 表示最高点或最低点的结构1. The situation/figures reached a peak/a high at…%in…2. The situation/figures bottomed out at…%in…3. The situation/figures peaked at…%in…4. The sit uation/figures hit a trough at…%in…5. The number soared to a record high ofd. 表示最高点或最低点的结构1. A is twice/three times/four times what it was in…2. A is twice/three times/four times the amount in…3. A is twice/three times/four times as much/many as…in…4. A is twice/three times/four times more than…in…5. From…to…, A increased/dropped more than sixfold.6. The output of steel in 1990 was 400%up compared with in 1980.7. The figure was roughly doubled/tripled/quintupled between…and…(三)表数据的句式:1. had the largest percentage/proportion of2. account for/take up 20%3. Compared with A, B has a higher percentage.4. On the top of the list is…, which accounts for 50%.5. At the bottom is…, which takes up 20%.6. A is second to B.7. A is ranked/rated first, followed by B at 45%and C at 30%例句1. As is shown by the graph/in the table…(概述图表)正如曲线所示,最近54年来该国人口飞速增长。
图表作文总结
图表总结单一图表结构:首段:图表描述了。
信息(转述题目),整体特征是。
主体:按照分类进行描述1.第一类:主题句概括+ 具体数字描述并比较2.第二类:主题句概括+ 具体数字描述并比较。
结尾:回应首段信息多图表结构:首段:图表一描述了。
;图表二描述了。
主体:分别描述两个图表1.图表一的整体特征+ 具体数字描述并比较2.图表二的整体特征+ 具体数字描述并比较。
结尾:(可省去或者添加两个图表内在关系的描述)注意:1.整篇时态的使用;图表中没有给出具体时间的用一般现在时,给出过去时间的用过去时描写2.首段第一句话总是用一般现在时;3.段中以及段落与段落连接时过渡词的使用;4.词语和句型使用上避免重复,对于类似的数据放在一起概述;5.语言上数字结合图表反映的事件描述6.多用被动句描写图表类型:饼图:1.描写各部分和整体之间的比例关系;2.特殊部分描写:最大,最小部分一定要写(others代表的比例除外);比例相同部分描写;3.两个饼图如果是不同时间或者地点的比较,侧重比较主要部分的变化(增长,下降)并要描写增长或下降幅度突出的部分;如果两个饼图是不同类别的比较,要把两个饼图的信息结合点找出来,结合在一起描写(例如饼图练习第一页area and population)柱图:1.看清楚横轴,纵轴分别代表什么;2.横轴与纵轴结合起来代表什么(第一段的内容);3.每个column代表什么;4.观察整体特征:各组column的相似之处和不同之处,即,找出整个柱图的特征和趋势;5.找出一个清晰的线索或分类标准进行主体段落写作;6.详细描写最大值,最小值,特殊值(明显的倍数关系,近似数据)曲线图:1.看清楚横纵坐标分别代表什么;2.要给多条曲线归类,相似趋势曲线的放在一个段落;或者同一类别的放在一个段落3.曲线的起始点要描述,中间部分按照区间进行描述相似的区间放在一起写;发生重大转折的数字单独描述4.侧重两条或多条曲线的比较(起始点,最大,最小值)表格1.关键在于对数据的分类,通常分为二到三类去描述2.选择变化大的或者特殊数字加以描述3.如果有total一栏,一定要写。
- 1、下载文档前请自行甄别文档内容的完整性,平台不提供额外的编辑、内容补充、找答案等附加服务。
- 2、"仅部分预览"的文档,不可在线预览部分如存在完整性等问题,可反馈申请退款(可完整预览的文档不适用该条件!)。
- 3、如文档侵犯您的权益,请联系客服反馈,我们会尽快为您处理(人工客服工作时间:9:00-18:30)。
• The number of truck sales rose steadily from 150 to 280 during October and December.
句型练习之外国国籍
• 加入外国国籍的百分比从1995的百分之一平稳增长到 2006年的百分之六. • The percentage of immigrants ________ (动 词)from one percent in 1995 to 6 percent in 2006. • There was a steady and smooth rise (形容词+名词) in the percentage of immigrants from one percent in 1995 to 6 percent in 2006. • The past decade witnessed a stable ascendance in the percentage of immigrants from one percent in 1995 to 6 percent in 2006
reach the maximum / the largest part of… peak at… reach the peak at… reach the highest point at…
小,跌到最小值,达到最低点:
reach the minimum / the smallest part of bottom out at … reach the bottom at… reach the lowest point at…
6. 急剧下降,大幅度下降:
(1).plummet, plunge (不加修饰语) (2).下降8个+大幅度7个
7. 小幅度下降: 下降8个+小幅度4个
8. 平稳下降,逐渐下降: 下降8个+平稳5个
9.波动,(在…间)起伏不定:
fluctuate v. 用法:fluctuate between …and … fluctuate over the period of… fluctuate over these 24 hours fluctuation n. 用法:rise with some fluctuations
there be主语
• There be +作主语
• There was steady/sharp/slight(用形容词表趋势) increase(名词)/upward trend in/of _ from _ to _ ,reaching the peak of _ .
时间主语
The last half of 2008 saw the most savage decrease in demand for motor vehicles since the second world war. The biggest/quickest/most noticeable increase occurred in 2000, which saw/witnessed a growth(替换increase) from _ to _ . The year between 1980 and 2000 witnessed a huge/ flexible change from _ to _ .
句型练习之婚礼费用
• 上海的婚礼的花费从96年的5万迅猛的震荡上 扬到08年的120万,最终达顶点300万在09年. • The figure of wedding fee in shanghai boomed rapidly from 50 thousand rmb to 1 million and 200 thousand rmb between 1996 and 2008, reaching the peak of 3 million in 2009.
句型练习之婚礼费用
• 海的婚礼的花费从96年的5万迅猛的震荡上扬到 08年的120万,最终达顶点300万在09年 • Shanghai saw a tremendous rise of wedding fee from 50,000 rmb in 1996 to 1,200.000 rmb in 2008, peaking at 3,000,000 in 2009.
• A steady fall in sales during November and December followed the sharp increase in October.
• Truck sales dropped during November but increased again in December to exceed October sales.
go up / ascend / grow / increase / rise + gradually / consistently / steadily / slowly /
5.下降,减少:
decrease, decline, fall, drop, ( v / n) go down, descend, sink, dip show a downward trend
At the start of the period Microsoft’s share price was virtually twice that of Apple, by late November however, Apple had outsripped Microsoft with a share value of almost $100 more than Microsoft.
Over the following three-year period, 在接下来的三年里
研究对象主语
• The figure/data/percentage(图单位) of/in/ about +研究对象 dropped/increased/fluctuated/ leveled off/remained stable/was upward(图趋势) from _ to _ (具体数字波动)during/ between…and…, and it reached the maximum/minimum of…
3. 小幅度上升:
go up / ascend / grow / increase / rise/ climb up + modestly / slightly / marginally / moderately
experience a slight growth in…
4. 平稳上升,逐渐上升:
• Truck sales hardly changed throughout the period, except for a slight increase in November.
• A slow but steady increase was followed by a sharp fall and an increase towards the End.
• A very noticeable trend was the steady increase in the number of wedding fee from
50,000 rmb in 1996 to 1,200.000 rmb in 2008, peaking at 3,000,000 in 2009.
• Truck sales dropped down in October, but remained unchanged for the rest of the period
Exercise
Report: Comparison of Microsoft Corporation and Apple Computer, Inc. shares
句型练习之婚礼费用
• There was a sharp rocket in the weeding fee in shanghai from 50 thousand rmb to 1 million and 200 rmb thousand between 1996 and 2008, reaching the zenith of 3 million in 2009. • The amazing soar of weeding fee in shanghai occurred between 1996 and 2008, which witnessed the upward trend from 50 thousand to 1 million and 200 thousand ,reaching the climax of 3 million in 2009.
地点作主语
• 地点做主语 • The place witnessed a sharp increase in sth from…to…in certain year.
• “趋势”做主语 A very noticeable trend was the steady increase in the number of __ from ___ to __ in ___. • The trend showed the steady increase in the number of __ from ___ to ___in ___.
10. 保持平稳,平衡,静止不动:
level off at, level out at +数字/百分比
hover at , stabilize at, reach a plateau at … remain / stay/ keep stable/ unchanged at…