MathCAD Prime 2.0 自带教程
mathCADprime2.0--WIN7安装教程
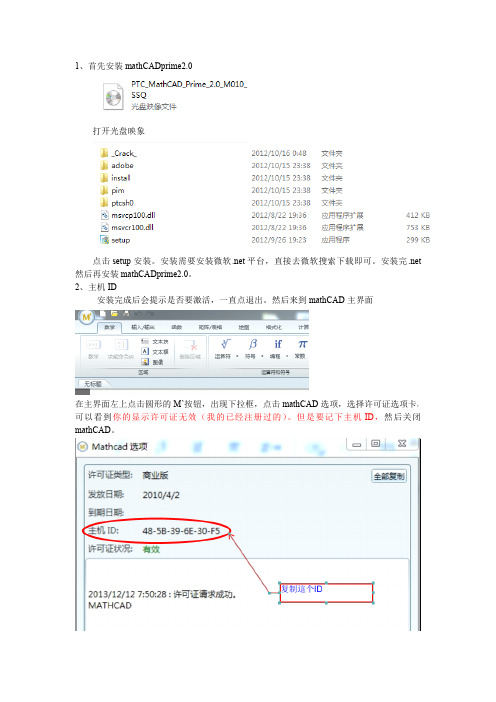
1、首先安装mathCADprime2.0打开光盘映象点击setup安装。
安装需要安装微软.net平台,直接去微软搜索下载即可。
安装完.net 然后再安装mathCADprime2.0。
2、主机ID安装完成后会提示是否要激活,一直点退出。
然后来到mathCAD主界面在主界面左上点击圆形的M’按钮,出现下拉框,点击mathCAD选项,选择许可证选项卡,可以看到你的显示许可证无效(我的已经注册过的)。
但是要记下主机ID,然后关闭mathCAD。
3、修改mathcad_license.dat文件去光盘印象里面,打开_Crack_文件夹,用记事本打开mathcad_license.dat。
>>>>>>>>>>>>将上图中红色框框的00-00-00-00-00-00替换成你刚刚记录的主机ID>>>>然后保存退出4、复制文件将_Crack_文件夹中的mathcad_license.dat和Ptc.License.Plpf.dll文件复制到D:\study\mathCADprime2\Mathcad\Mathcad Prime2.0安装路径下。
(红色是我的安装路径)>>>>>>复制和替换5、最后注册打开mathCAD,同样点击左上角M’>>选择mathCAD选项>>许可证选项卡将文件位置,浏览D:\study\mathCADprime2\Mathcad\Mathcad Prime 2.0>>>>mathcad_license.dat文件。
然后点击应用这样你就完成了注册。
MathcadPrimerMathcad手册
A Mathcad PrimerThis document will summarize many of the features of Mathcad 11 and how these features are used to solve physical chemistry problems. It is not a replacement for the Mathcad Reference Guide by Mathsoft?.You need to enable Print Layout View in Word (View, Print Layout).You can CTRL-click any topic to go to any section or you can scroll down.ContentsThe Mathcad WindowWhen you start Mathcad, the screen should appear as shown below. A series of menu items are listed, and underneath the menu are toolbars. An ancillary toolbarcalled Math appears to the right. In this document, menu commands will be noted as Item 1, item 2, and so forth. As an example, the print preview command would be typed as: File, Print Preview . To execute the command you would point to File, then select Print Preview from the drop-down list.If you do not see all the items in the graphic, go to View, Toolbars , and select the toolbars that you wish to see. Your first assignment is to check the various menu items to see what they contain.The page boundary shows you what will fit on a normal page when the document is printed. Material to the right of the boundary will print on the next page. Menu ItemsToolbars Math toolbarInsertion pointPage boundaryStyle boxThe toolbar under the menu is the Standard toolbar and contains icons for: New document, Open document, Save, Print, Print Preview, and so on. These icons have tooltips (little tags that inform you of their functions). If you forget what an icon does, hold the mouse pointer over it for a second and the tooltip will appear. Note the red crosshair in the document window. This is the insertion point in Mathcad and any typed information will appear at this point. Clicking the mouse in a new location moves the insertion point (try it!).Entering TextIn Mathcad, text is different from mathematics. Text information and math information have their separate fonts, colors, and styles. The formatting toolbar (the one right above the actual document) has a style box that informs you of the type of information that is being typed or selected in the document. The default style is variables so when you type, Mathcad assumes you are typing mathematics.If you wish to type text, first type a quotation mark, “. The quote opens a text region in Mathcad and you can type any text that you wish. Click anywhere outside the text region to stop.Any good Mathcad document should contain text to annotate and explain the calculations. You can, and should, change the appearance of text to distinguish it from math. You can do this by typing Format, Style. This brings up the format dialog box. To change the text font, choose Normal and click modify. Click thefont box and you may change the font style, size, and color. A good choice is to make text font a different color than the black font used for variables.Equations and VariablesMathematical expressions are typed in the usual way, using the +, –, /, and *keys for addition, subtraction, division, and multiplication. Exponents areentered with the ^ key. You must remember to include the multiplication symbol in all expressions. Mathcad will interpret xy as a new variable, and not as the product of x and y. Here we type 5*12= and you can see the result is 60. If wetype 512= Mathcad interprets the second statement as the number 512 as you can see from the result.Forgetting the multiplication symbol (*) is the most common source of headachesfor Mathcad beginners.A convenient way to see multiplication is to go to Tools, Worksheet options, Display. If you make the multiplication symbol a dot, large dot, or , it will be hard to miss.You must first define a variable before you use it in a calculation. In the example below, x is not defined at the beginning and is highlighted by Mathcad in red (an error):To define a variable, use the := operator. You enter this by typing a colon.The := is an assignment operator in Mathcad; it states that the variable on theleft is assigned the value or expression on the right. You cannot define an expression on the right side of this operator; 14 := sin(x) will produce an error. Some typical uses: Try the assignment operator by typing x: and observe the result. Common mathematical functions can be found by using the function icon, f(x) on the toolbar. Try defining a new variable to be the cosine of y and set y equal to 15.To evaluate an expression, use the “normal” equals sign just as you would in normal mathematics.Notice that the function is always on the left side of the assignment operator. Anmakes no sense to Mathcad.expression such as 12:xExercise: Define a variable to represent the distance as a function of time. The distance follows this expression: initial_position + *time + *time2.Set the initial position to 255 and calculate the position at time = 2, 12, 25. Exercise: Harmonic motion follows a sinusoidal pattern:position = amplitude*sin(time) + phase.Define a variable to represent the position as a function of time when the amplitude is and the phase is zero. Calculate the position at time = 0, 12, 24, 44.What change to position occurs if the phase changesImportant Warning about Typical Scientific SymbolsMathcad has a built-in set of units that are used for cancellation and obtaining the units of an answer. This is a very powerful concept but sometimes these units can cause confusion when you try to make them variables. A common example is g. We all like to use g for grams, but Mathcad has already defined this symbol as the acceleration due to gravity:This problem also occurs for T. We like to use T for temperature, but it represents Tesla, the built-in unit for magnetic flux density. You can use T in this manner: T = 325 K, where K is the symbol for kelvin temperature. Another problem exists for the letter e. We typically use e as the charge on an electron but in Mathcad, e represents the base of natural logarithms (e= ….). Mathcad also writes e as exp as in e x = exp(x).Selecting and EditingMathcad expressions can be edited using the standard windows methods for cut, copy, and paste. Before editing part of an expression, the appropriate section must be selected. To select an area, click inside the expression; the red crosshair will become a blue selection cursor that looks like ?, or ?. The small “foot” on the cursor indicates which way the data will be selected. ? will select to the right, while ? will select to the left. Use the insert key to change the direction. The spacebar repeatedly expands the selection, and the ✍ and ✍ keys move it right and left respectively. Try it on an expression to see how these keys workThe spacebar changes the selection by parts of an expression (pieces connected by +, –, *, /), while the arrows move character by character. It is easier toobserve than to explain. Build and expression such as 2():27y x x =+ and try it. Once a part of an expression is selected, you can cut it, delete it, or copy it. You can also edit it by substituting different operators. Text is edited in the same manner. Any selected item can be pasted into another document such as a Word document or an Excel spreadsheet. All of the Mathcad work in this primer was pasted directly from Mathcad into Word. Variable NamesMathcad allows almost any name for a variable as long as the name is not a predefined function. Some example variables are:Variable names can be any combination of alphanumeric characters. These names should begin with a letter and should not contain symbols except for theunderscore( _ ), percent ( % ), or a prime( ` ). You cannot use unit symbols or built-in functions as names (to see a list of built-in functions, click the f(x) on the toolbar). Some examples of variables are:This_is_a_variable okayMass_proton okayVariable_4 okayV okay1st _value invalid; begins with a number.Sin(X) invalid; sin is a built-in function.A list of predefined functions can be found by clicking the f(x) icon on the toolbar.As simple example of variables, we calculate P from the ideal gas law. Define some values and evaluate the pressure.The variables are defined in the first line; P is then defined (as nRT/V) and evaluated. If any variable is left undefined, the undefined quantities will be in red (an error). In this example, we delete the definition for V, therefore P cannot be calculated.You can put a subscript as part of a variable name by using the period characterv in theon the keyboard. If we type (that’s v period initial), we getinitialdocument. Subscripted variable names can be quite useful.UnitsBy default, Mathcad will use the SI unit system for all calculations. You can change this in the Tools, Worksheet options, Display command. Go to the Units tab and choose a system of units or set it to none. You enter a unit for any quantity by multiplying a numerical value by the unit. If you want a volume of 15 liters, you type V:15*L. The previous gas law example, with units is:Mathcad automatically cancels units and produces the result in Pascals (thedefault SI unit for pressure). If you prefer a different unit for the result,click the expression and a black box will appear after the Pa unit. Double-click this box and a set of possible units will be shown; you can choose the units you want. Here we change the answer to atmospheres.An easy way to see the defined units in Mathcad is to click the measuring cup on the toolbar. Choose any type of quantity (length, mass, etc.) and Mathcad will display the possible units.Defining Your Own UnitsMathcad does not contain all possible units for all possible quantities. For example, Mathcad does not have picometers in its units database. You can define units such as picometers in your Mathcad document.Note that it is 10–12 * m! Don’t forget the mult iplication operator. Mathcad also has a table of reference data that contains physical constants. These data can be copied and pasted into any Mathcad document. Click the Resource center icon on the toolbar (it looks like a book); click on quicksheets and reference tables; click reference tables and then physical constants. The Resource center is also an excellent source for help, and the quicksheets are quite useful to show you how to do certain calculations in Mathcad.When you use units in calculations, Mathcad checks the units and will not work with incompatible units. You will get an error message.The bar is the preferred unit of pressure, but Mathcad does not have the bar inits units database. You must define it as we did for picometers earlier. By definition: 1?bar? ?105?Pa.Easy GraphsMathcad has a method for developing an xy graph of any simple function. To illustrate the method , let’s graph the sine of x. Start a new document and put the cursor where you want the graph. From the menu, choose Insert, Graph, XY Plot . You will see an empty graph with black boxes (placeholders). You can cycle through the placeholders by using the TAB key.Type x in the placeholder on the x-axis and then type sin(x) in the box on the y-axis. The graph will change to:Mathcad makes a guess at the limits, in this case: –10 to +10.Plot the function 32415y x x =-+. From the menu, choose Insert, Graph, XY Plot . You will see an empty graph. Type x in the x-axis box, and type the expression, 32415x x -+, in the y-axis box:One more graph example. We can define a function and then graph it by placing the f(x) in the y-placeholder:If the range of values on the x or y axis is not appropriate, you can change them by clicking the graph. Values in placeholders will show for the maximum and minimum x and y ranges. In the example, the maximum y is .Click inside any value and edit it to your liking. Here the maximum y has been changed to 10 and the maximum x to 5.If you double-click the graph, a dialog box will open that allows you to change any properties of the graph including whether it will be displayed as lines, points, or a combination of both; the color of the lines, labels for the axes, and a graph title. For the title to show, you must be sure to check the show title box (don’t ask why).Range Variables and GraphsWhen we need to have numerous values for a variable in Mathcad, we use range variables. Range variables are also used to generate graphs of scientific data. A range variable is a variable that has different values based on an index. For example, we may have three different pressures: P 1, P 2, and P 3 where P 1 is 100 bar, P 2 is 220 bar and P 3 is 75 bar.In Mathcad, enter a range variable by typing the variable name, then type [ and then the index. The [ is a definition for a subscripted range variable . This is completely different than the subscripted variable we discussed earlier (obtain by using a period). As an example, let’s produce a set of pressures that go from 1 to 12 atm in unit steps. First we define the range, i.Type i:1;12 (that’s i colon 1 semicolon 12)Now define the pressures, type P[i := iYou should see:To see that this works, type P = to list the values of P.What if we did not want to increase the pressure in unit steps, but we want increase it by steps of starting at 1 In this case, we need to define anothervariable. We cannot change the range of i to be 1, , …because i is the index for P. We can have P1, P2, or P3, but we can’t have . One way around this problem is shown below. We define i and an increment that depends on i.The new range variable (incr) changes the increment values to times the index. Suppose you want a range of x-data for a graph that starts at , increments at , and ends at 22. You enter this as: x colon comma semicolon 22.Note that the second number is the next value in the sequence and it is not the increment to be added to the initial value.We can also produce variables that are functional forms. For instance, we can define a range of pressures and then define a variable such as V(P) that depends on the pressure range. This method of using range variables is shown next. In this example, we use the pressure itself as the range variable. We define the compressibility in terms of both pressure and temperature, and that allows us the option of evaluating and plotting multiple functions simultaneously.Note how Z(p,T). The pressure is defined in the range and we plot three different temperatures: 1379, 300, and 500 K. Multiple arguments on the y-axis are entered and separated with a comma. To enter these functions we would type: Z(p, 1379),Z(p, 300), Z(p, 500) into the y placeholder on the graph.Zoom and Trace Functions in a GraphMathcad has built-in zoom and trace capabilities for graphs as shown in the next figure. On a Mathcad document, reproduce the work to produce the previous graph. Right-click the graph and choose either Trace or Zoom from the context menu. Zoom: Move the Zoom dialog box to the side. Click and hold at the point in the graph that you wish to begin the Zoom; drag a rectangular box until it encompasses the region you wish. Finish by clicking Zoom or OK in the dialog box.Trace: Move the Trace dialog box to the side. Click anywhere in the graph; the points will show in the Trace box. If the Track Data Points box is checked, Mathcad will skip from one data point to the next. It will not provide data (interpolate) between the points.Data and Data Files: Excel DataMathcad data are held in arrays and arrays have a range associated with them.Often we need to get scientific data into or out of Mathcad. Fortunately, Mathcad has built-in functions for this. Data can usually be saved as a text (ASCII) file from another program (such as EXCEL). In this example, the data were saved from a Word file (Saved a text file, not as a Word document!). To read the data file, we first define a variable for the data. Usually we have x and y data so thisvariable will have two columns of data; this is called a matrix. A typical matrixof data is:To add our data to Mathcad, click the Insert Data File Input, and then choose the file format (usually Excel). Click Browse to find the data file. Then click finish. Put a variable name in the placeholder on the Mathcad screen and you're done. When done, you should have something like this:The variable PZ is defined as the data set given by the url, C:\..\. The variable PZ contains the pressure and compressibility data for the gas. To separate the pressure and compressibility data, we extract the columns of the data matrix. P is in the first column (Mathcad labels it as zero) and the compressibility is in the second column (Mathcad labels it as one). To extract each column use the Extract Column command from the matrix palette or use CTRL6. You need to type in the column number that you want to extract. We define P as the first column of ourdata matrix and z as the second column:Now we have two variables of data and we can work with them just as we did for any other range of data. A graph of the data is:Entering Data into MathcadOften we need to enter data directly into Mathcad. Data are held in arrays and arrays have a range associated with them. First, define a range variable (j inthis case).Then type P[j :Type in the first number followed by a comma; repeat for each number. The last line shows that P3 does equal 7.Another method of entering data is to define a variable as a matrix. For example, we can define X as a matrix of five elements in this manner: Type X : to produce the assignment operator; then choose Insert , Matrix from the toolbar. In the dialog box, choose 5 rows and 1 column. You should have:You can now type values into the matrix.Copying Data from EXCELThe easiest method to provide Mathcad with EXCEL data is to define a variable such as New_data (you can use any name you choose): Open EXCEL and highlight the data range in EXCEL. Copy the data. In Mathcad, place the cursor on the placeholder for New_data and choose Edit, Paste from the menu (or right-click and chose Paste ). The selected data will now be in Mathcad. You can set up x and y variables in Mathcad and then paste the x data from EXCEL and then select and paste the y data from EXCEL.Numerical CalculationsMathcad can solve many problems numerically using common algorithms. As you have already seen, numerical computations are trivial:Integrals are evaluated using a modified Romberg algorithm, a method that is superior to the trapezoidal rule:Numerical derivatives are also easily obtained:Numerical Roots of EquationsRoots of equations can be obtained from the root function:root(f(x),x)The root function obtains roots by successive approximation and it needs aninitial guess for the root. This guess can be supplied after graphing the function and observing where the function crosses the x-axis. As an example, we will find the roots of: 32()317005f x x x x =--+.Now we can find the exact roots: Warning: Always graph the function or try many initial estimates to be sure you have the correct root.Exercise: Find the third root of the function.Mathcad can also find the roots by symbolic calculation. In this example, we use the same function, 32()317005f x x x x =--+, but we do not write it as adefinition (that is, we leave out the f (x ) part). Select any x in the expression, and then select Symbolics, Variable, SolveNote the decimal point after the 5 in the expression. Without a decimal number, Mathcad will solve analytically without substituting numbers into the expression. For numerical problems, this can be cumbersome.Exercise: Remove the decimal point after the 5 and solve to see the result. Also, note that Mathcad provides all three roots by this method.Symbolic CalculationA powerful feature of Mathcad is the ability to do symbolic algebra and calculus. The commands are located in the Symbolics menu on the toolbar and also on the Symbolics palette (the graduation hat icon). Symbolic calculations can either be static or “live”. A live symbolic calculation is automatically updated when a change is made to the document; a static calculation is not updated. Static symbolic work is accomplished by using the commands on the symbolics menu; live symbolic calculation is accomplished using the symbolics equal sign, ?.As an example, let’s find the deriva tive of sin(5x) using the static method. Type sin(5x) into a worksheet (don’t forget the * for multiplication), select the x, and then click Symbolics, Variable, Differentiate . The result, 5cos(5x) will appear below your expression. Another option can be set to improve readability. Click Symbolics, Evaluation Style , and check the box that says Show Comments . Repeat the sin(5x) example and note the difference.If we use live symbolics to perform the same derivative, we would first enter the derivative symbols from the calculus palette (the one with the integral). Fill in the placeholders with sin(5x) and x. Type CTRL . (Control period) and you should see the live symbolics arrow (this is equivalent to an equals sign). Clickanywhere and the result, 5cos(5x) should appear. The difference in live symbolics is that any change is immediately reflected in the result. Change the 5 to 17 and observe.Symbolic calculations from the menu do not update in this manner as you can show for yourself.Symbolic IntegrationSymbolic integration works in the same manner as differentiation. We can evaluate both definite and indefinite integrals. Use the integral symbol from the calculus palette.Mathcad can also evaluate double and triple integrals:andNotice that in the second example, the function was defined and then substituted into the integral.The Assume Keyword (Very Important)Sometimes, we know something about the problem that Mathcad does not know. Forinstance, the integral2ax e dx ∞--∞⎰is not defined for a < 0. If we put this expression into Mathcad, we get this result:This is Mathcad’s way of telling you it cannot evaluate the expression; theresult is the same as the original. We must inform Mathcad that a > 0, and we use the assume keyword for this. Write the integral and then press CTRL SHIFT . (Control shift, period, pressed simultaneously) to produce the symbolics equal sign and a placeholder. You can also use the ? from the symbolics palette if youprefer. In the placeholder, type assume, a>0, then click outside the integral to see the result.Mathcad sometimes has problems with the assume command and multiple integrals. The integral can be evaluated if it is written as a product of three integrals:Partial DerivativesMathcad easily evaluates partial derivatives. In fact, Mathcad always assumes itis taking the partial derivative.Partial derivatives:The partial derivative symbol is obtained by Math, Options, Display, Derivative.Solving EquationsMathcad can symbolically solve a single equation for an unknown or it can solve a set of equations for multiple unknowns. These calculations are done in solve blocks, a construct that is defined in Mathcad by the words given and find. A solve block always begins with the word given. This is followed by the equation or equations to be solved. The result is evaluated in the find command. Solve block use only the symbolics equal sign typed as CTRL =. It appears as a bold equal in the document. A typical example is:Mathcad can solve multiple equations in multiple unknowns. Remember to use the symbolics equal sign here (CTRL=).You can also solve for limits in integrals. The following example shows how to find the radius, d, where the probability of finding the electron is 90% (or . Simple Method for Finding EigenvaluesOften we need to obtain an eigenvalue for a function. A convenient method for solving for eigenvalues is shown here.An eigenvalue is a constant in the equation, ˆ()()Ofx cf x = where ˆO is an operator. A simple method for finding an eigenvalue is to rearrange the equation:ˆ()()Of x c f x =. Example: is the function ()x x a π⎛⎫ψ= ⎪⎝⎭and eigenfunction of the derivative operator If so, what is the eigenvalueNo, we do not get a constant; we get a new function,。
mathcad教程

mathcad教程跟我学数学软件包MathCADMathCAD是由MathSoft公司推出的一种交互式数值系统。
在输入一个数学公式、方程组、矩阵之后,计算机能直接给出结果,而无须去考虑中间计算过程。
最令人激动的是在加入软件包自带的Maple 插件后能直接支持符号运算。
你可以在计算机上输入数学公式、符号和等式等,很容易地算出代数、积分、三角以及很多科技领域中的复杂表达式的值,并可显示数学表格和图形,通过对图形结果的分析,使我们对问题的理解更加形象。
MathCAD的用户主要针对具备应用数学知识但并不要求具有较多的计算机知识的用户,如工程研究人员、学生等。
一、文件功能(1)Insert……在当前文件中插入MathCAD文件,能达到合并两个文件的效果。
(2)Save Configuration……将当前MathCAD有关的字体属性、数值有效位等各类设置存贮成一个配置文件 ,以备后用。
(3)Execute Configuration……载入配置文件。
(4)Associate Filename……定义文件变量。
此功能提供MathCAD与外部数据的接口功能。
将数据文档(如 .dat .prn等数据文件)载入MathCAD内,并将数据送给矩阵或矢量。
此功能较为重要,通过此功能,用户可以用其它语言编写程序(如用C语言编写自己的计算程序,通过fprint函数生成数据文件),然后将包含计算结果的数据文件送给MathCAD处理。
下面将详细说明MathCAD 如何读写数据文件。
二、数据读写功能为了进行ASCII数据文件读写,MathCAD提供几个内部读写函数READPRN()、WRITEPRN()、APPENDPRN()、READ()、WRITE()、APPEND()(函数名必须大写)。
其中READPRN()、WRITEPRN()、APPENDPRN()是对结构化数据(structured data)文件进行读写和追加;而READ()、WRITE ()、APPEND ()是针对无结构数据(unstructured data)文件进行操作。
MATHCAD教程

三、全屏幕编辑器、计算器和活的数学
Mathcad的工作区是一个全屏幕的编辑器,用户可以在屏 幕的任何位置输入数学公式、文字和制作图形,而对它们的编 辑也和其它常用图文编辑软件一样方便,特别是输入数学公式 就像我们平时在纸上书写一样 。
它还是一个全屏幕的计算器,我们看到只需在数学区域内
式子后输入等号,就可以得出一定精度的数值解,如果用
系统的“保留字”作为变量名,所谓“保留字”就是具有特定意义
的Mathcad专用标识符。 内部变量、系统变量和自定义变量。
函数 用于规定变量(包括常量)的运算法则。对于函数名
也遵循与变量名相同的规则,但函数名后都带有参数表。在函
数的参数表中通常遵循下述习惯:① i, j, k, m, n表示整型数
(Integer);② a, b, x, y表示实型数(Real);③ z表示复数
4.占位符(Placeholder)
在数学区域或图形区域内出现的小黑方块,它表明算式或
图形参数不完整,需要在此添加适当的字符。单击占位符,填 入数字或变量名后,占位符消失。
→
在数学区域内,当占位符没有全部用数字、字符或表达式 等填写,可以用Tab键进行占位符之间的切换。没有空占位符了, 用Tab键则可以跳出区域。
⑴ 输入指定代数运算符; ⑵ 在左占位符输入代数式; ⑶ 在右占位符输入关键字“substitute , x〓代换式”,这里“x‖ 代表被代换式,而“〓”为逻辑等号用“Ctrl+=‖输入; ⑷ 移开光标。 方法二 用Substitute菜单命令进行变量代换 ⑴ 将代换式通过复制或剪切存入剪贴板; ⑵ 用编辑线选择被代换变量; ⑶ 单击Symbolics/Variable/Substitute菜单命令。
mathcad-使用教程PPT(课堂PPT)

三、对齐区域
1. 选择区域。 2. 从“格式”菜单选择“对齐区域” > “横向”(用于水平对齐)或“对齐区 域”>“纵向”(用于垂直对齐)。或者单击“标准”工具栏上的
和。 四、分隔区域
“视图”菜单下的区域选项确定区域是否重叠
“格式”菜单选择“分隔区域”。
五、更改工作表背景色
1. 从“格式”菜单选择“颜色”。 2. 选择“背景”以查看可从中选择的颜色。
1.5 定义函数
要添加函数定义到工作表: 1. 首先通过键入 d(t): 定义函数 d(t)
特殊:
2. 键入此表达式完成定义:1600+acc/2[ 空格键]*t^2[Enter]
1.6 格式化结果
结果的显示形式,包括小数位数、指数符号的使用以及字尾补零等等。
Eg:
1.7 图形
创建基本图形
Eg:
6.3 布局
1.设置页边距、纸张大小、来源以及方向 “文件”菜单选择“页面设置”
2.页眉和页脚
“视图”菜单选择“页眉和页脚”
6.4 保护工作表的一个区域
一.“插入”菜单选择“区域”
* 无法在一个可锁定的区域中拥有另一个可锁定区域。 二.锁定和折叠一个区域
1. 在区域中单击。 2. 从“格式”菜单选择“区域” > “锁定” 3.“格式”菜单选择“区域” > “折叠”。
Web 资源 /appserver/mkt/products/resource/mathcad.jsp
2.2 用户论坛
一,从“帮助”菜单选择“用户论坛”
二,浏览器 /go/mathsoft/collab/。 注册新用户名 共享其它用户资源
2. 按“=”键或单击“计算器”工具栏上的
mathcad教程

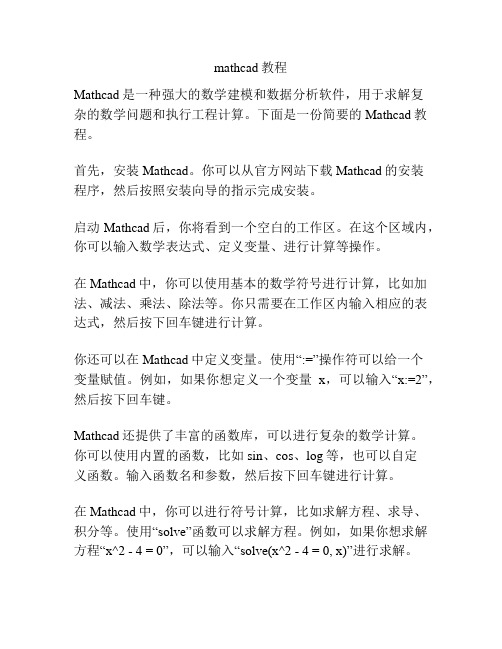
mathcad教程数学软件Mathcad是一种强大的工具,用于解决数学问题、执行数据分析、进行图表绘制以及展示工程计算和数学建模等任务。
这篇教程将介绍Mathcad的一些基本操作和功能。
1. 创建新工作表在Mathcad中,你可以创建新的工作表来执行你的计算任务。
点击"文件"菜单,然后选择"新建"。
一个空白的工作表将会被创建出来,你可以在上面进行计算。
2. 输入数学表达式在Mathcad中,你可以直接输入数学表达式。
Mathcad支持各种数学运算符和函数,如加减乘除、平方根、对数、三角函数等。
只需输入表达式并按下Enter键,Mathcad将会帮助你进行计算并显示结果。
例如,你可以输入以下表达式来计算两个数的和:a + b3. 定义变量在Mathcad中,你可以使用变量来存储数值和计算结果。
你可以通过":= "运算符将值赋给变量。
例如,你可以定义一个名为"radius"的变量,并将其值设置为10:radius := 104. 数组和向量运算Mathcad还支持数组和向量运算。
你可以使用方括号来创建数组或向量,并使用逗号分隔元素。
例如,你可以创建一个包含1,2,3的向量:v := [1, 2, 3]你还可以执行向量加法、乘法等运算。
5. 绘制图表Mathcad提供了绘制图表的功能,你可以基于你的计算结果创建各种类型的图表。
通过点击菜单中的"绘图"选项,你可以选择要绘制的图表类型、数据源等。
Mathcad将会自动绘制出相应的图表。
这些只是Mathcad的一些基本操作和功能。
通过探索更多的菜单选项和命令,你可以发现Mathcad的更多强大功能。
希望本教程能帮助你入门Mathcad,并能在你的数学和工程计算中发挥作用。
Mathcad 用户指南

Mathcad 用户指南Mathcad 用户指南目录1. 简介1.1 Mathcad 概述1.2 Mathcad 功能1.3 Mathcad 界面2. 基本使用方法2.1 Mathcad 的安装与启动2.2 Mathcad 文档的创建与保存2.3 Mathcad 工作区的组成2.4 Mathcad 计算表达式的输入与编辑2.5 Mathcad 变量与公式的定义3. 数学运算3.1 基本数学运算3.2 矩阵与向量运算3.3 微积分运算3.4 微分方程求解3.5 概率与统计运算4. 绘图与可视化4.1 绘制函数图形4.2 绘制数据图形4.3 定制图形属性4.4 图形导出与共享5. 数据分析与建模5.1 数据导入与处理5.2 数据分析与统计5.3 建立数学模型5.4 模型优化与拟合6. 编程与自动化6.1 Mathcad 编程语言概述 6.2 脚本编写与执行6.3 自定义函数与程序6.4 自动化与批处理7. 其他特性7.1 Mathcad 文档的共享与协作7.2 Mathcad 的扩展模块7.3 Mathcad 的高级功能与技巧7.4 Mathcad 的错误处理与故障排除附件:附件1:Mathcad 示例文档附件2:Mathcad 使用案例附件3:Mathcad 常见问题解答法律名词及注释:1. 版权:著作权法所规定的对个人或团体的智力创造成果的保护权利。
2. 商标:对某种商品或服务的标识符号,以区别于其他竞争对手的同类商品或服务而具有独立性和识别性的标志。
3. 许可:指授权他人以某种特定方式来使用许可人拥有的某项权益的行为。
本文档涉及附件:附件1:Mathcad 示例文档附件2:Mathcad 使用案例附件3:Mathcad 常见问题解答本文所涉及的法律名词及注释:1. 版权:著作权法所规定的对个人或团体的智力创造成果的保护权利。
2. 商标:对某种商品或服务的标识符号,以区别于其他竞争对手的同类商品或服务而具有独立性和识别性的标志。
Mathcad_Prime_Whats_New_zh-CN
增强功能的详细信息: Mathcad 2.0按产品查看Mathcad Prime (13)版权 © 2012 Parametric Technology CorporationMathcad Prime 2.03D 绘图您可在三维绘图上绘制曲面、曲线和数据点。
Excel 组件通过 Excel 组件,您可以在 Mathcad 工作表中嵌入 Excel 格式的表格。
Is Element Of 运算符Is Element Of 比较运算符可指示元素是为复数、实数还是整数的成员。
KNITRO 求解器Mathcad Prime 2.0 中的优化求解器来自高级 KNITRO 7.0 优化软件库。
利用 64 位计算机Mathcad Prime 2.0 既有 32 位版本也有 64 位版本。
可折叠区域可插入到工作表中并且可进行折叠以隐藏复杂方程的区域。
可调整输入矩阵的大小您可以调整输入矩阵和结果矩阵的大小。
调整矩阵大小可改进来自 Mathcad 早期版本的数据表和输入表的转换。
多线程多线程功能可同时计算多个进程,以提高大型数据集和矩阵的处理速度。
新的符号运算符:极限和不定积分新增了以下符号运算符:不定积分、右极限、左极限和双侧极限。
清除多变量的数值或符号Clear(x,y,z) 和 clearsym(x,y,z) 可清除多变量定义的符号和数值,或仅清除符号。
符号数学您可以计算含变量和符号的表达式,并可得到符号形式的结果。
符号显式功能使用显式关键字,可返回变量值被替换后的表达式,但不简化数值表达式。
调整较大符号结果的大小较大的符号结果会被截断,可调整其大小。
3D 绘图您可在三维绘图上绘制曲面、曲线和数据点。
产品信息产品Mathcad PrimePTC 支持版本 2.0产品功能领域Mathcad用户界面位置在“绘图”选项卡的“轨迹”组中,打开“插入绘图”列表,然后选择“3D 绘图”。
工艺与计划益处和说明使用三维绘图显示具有两个变量的函数、矢量值函数或 3D 数据集。
mathcad教程
mathcad教程Mathcad是一种强大的数学建模和数据分析软件,用于求解复杂的数学问题和执行工程计算。
下面是一份简要的Mathcad教程。
首先,安装Mathcad。
你可以从官方网站下载Mathcad的安装程序,然后按照安装向导的指示完成安装。
启动Mathcad后,你将看到一个空白的工作区。
在这个区域内,你可以输入数学表达式、定义变量、进行计算等操作。
在Mathcad中,你可以使用基本的数学符号进行计算,比如加法、减法、乘法、除法等。
你只需要在工作区内输入相应的表达式,然后按下回车键进行计算。
你还可以在Mathcad中定义变量。
使用“:=”操作符可以给一个变量赋值。
例如,如果你想定义一个变量x,可以输入“x:=2”,然后按下回车键。
Mathcad还提供了丰富的函数库,可以进行复杂的数学计算。
你可以使用内置的函数,比如sin、cos、log等,也可以自定义函数。
输入函数名和参数,然后按下回车键进行计算。
在Mathcad中,你可以进行符号计算,比如求解方程、求导、积分等。
使用“solve”函数可以求解方程。
例如,如果你想求解方程“x^2 - 4 = 0”,可以输入“solve(x^2 - 4 = 0, x)”进行求解。
Mathcad还支持绘制图形。
你可以使用“plot”函数绘制函数图像,也可以使用“scatterplot”函数绘制散点图。
输入相应的函数或数据,然后按下回车键进行绘图。
此外,Mathcad还支持数据分析。
你可以导入数据文件,进行统计分析、回归分析等操作。
使用“worksheet”可以新建一个工作表,然后输入数据和相应的分析函数,按下回车键进行计算。
在Mathcad中,你可以使用注释和文本框来添加说明和注解。
使用“//”可以添加注释。
使用文本框工具可以添加文本框,然后在文本框中输入文字。
最后,你可以将Mathcad文档保存为不同的格式,比如Mathcad文档、PDF文件、Word文档等。
Mathcad介绍

函数与运算符(续)• 17 个微分方程函数• 8 个求解函数• 5 个表达式类型函数• 33 个文件访问函数• 70 个图像处理函数• 18 个财务函数• 11 个傅立叶变换函数• 4 个制图函数• 12 个双曲线函数• 17 个插值与预测函数• 5 个对数和指数函数• 49 个矢量和矩阵函数• 5 个数论/组合数学函数• 6 个分段连续函数• 17 个概率密度函数• 35 个概率分布函数• 19 个随机数字函数• 61 个信号处理函数• 4 个排序函数• 11 个字符串函数• 20 个特殊函数• 23 个符号专用函数• 15 个三角函数• 8 个截断和舍入函数• 6 个小波函数更高的灵活性、易于使用、直观的布局、强大的计算工具和其他许多出色的功能使 Mathcad Prime 2.0 远远超越了前几代版本。
”- B rian Lumb,高级机械工程师Instrumentation Laboratory单位• 在所有数值和符号计算、函数、求解块、表、矢量/矩阵和绘图中持续支持单位• 自动检查和转换单位• 自动换算和加亮单位• 185 种预定义的单位,并能够轻松创建更多单位• 支持 SI、USGS 和 CGS 单位系统绘图和制图• XY 绘图:散点、直线、柱形、条形、杆形、瀑布形、错误、方框、效果• 3-D 绘图:散点、曲面、曲线• 极坐标图• 等值线图• 各种格式设置选项求解• 多个高级求解器,适用于线性和非线性代数及微分方程组• 更高级别的描述性数学公式,以一种易于阅读的、类似课本的求解块格式呈现• 最新的非线性最优化算法,使用了可靠和强大的 KNITRO® 引擎• 支持参数化建模,并通过无缝的绘图集成对嵌套的复杂问题进行求解• 能够将符号结果合并到数值函数中“矢量和矩阵• 7 个运算符和 49 个函数• 对于许多函数和运算符自动应用元素智能• 轻松直观地进行编辑数据• 嵌入式 Microsoft Excel 组件允许与 Mathcad 工作表内容进行双向集成• 用于定义参数和常量的规格表• 33 个文件访问函数(读取和写入)用户界面• 基于功能区的用户界面 (Microsoft Office Fluent UI)• 为所有可用功能提供详尽的工具提示集成和可互操作性• Creo Parametric• Windchill 10.0• 可打开 Mathcad Prime 1.0 工作表• 使用 Mathcad Prime 2.0 工作表转换器可打开 Mathcad 7 到 Mathcad 15.0 的工作表资源、帮助和支持• 包含生动示例的集成式上下文相关帮助• 集成了对 LearningConnector 的访问• PTC 标准和持续维护支持计划• PlanetPTC® 在线社区规范• 有适用于 Windows® XP (SP3)、Windows Vista®、Windows 7 的 64 位或 32 位版本• 提供英语、法语、德语、日语、意大利语、西班牙语、韩语、俄语、简体中文和繁体中文版本• Microsoft Excel 2003、2007、2010• 将 .mcd 和 .xmcd 文件类型转换为新的 .mcdx 类型• 集成的许可证获得和管理功能有关 Mathcad 的更多信息,请访问:/go/mathcad。
Mathcad操作方法

Mathcad一.一.MathCAD简介MathCAD是美国Mathsoft公司推出的一个交互式的数学软件。
该软件定位于向广大教师、学生、工程人员提供一个兼备文字处理、数学和图形能力的集成工作环境,使他们能方便地准备教案、完成作业和准备科学分析报告。
在输入一个数学公式、方程组、矩阵之后,计算机能直接给出结果,而无须去考虑中间计算过程。
在加入软件包自带的Maple插件后能直接支持符号运算。
你可以在计算机上输入数学公式、符号和等式等,很容易地算出代数、积分、三角以及很多科技领域中的复杂表达式的值,并可显示数学表格和图形,通过对图形结果的分析,使我们对问题的理解更加形象。
二.二.特点1. 1.与数学书写习惯非常接近;2. 2.动态的所见即所得(WYSIWYG)界面;例:a:=3 a+4=7 当a的值改变时后a+4的值自动更新。
3. 3.任意位置输入You can place equations, text, and graphics anywhere(不受行的限制)。
三.三.操作环境的设置(一)(一)显示/关闭工具栏1.1.常用工具栏:“View”菜单——Toolbar2.2.格式工具栏:“View”菜单——Format bar3.3.数学工具栏:“View”菜单——Math Palatte(二)(二)对象域RegionMathcad 文档是一个式子、文字、图形等对象的集合。
创建每一个对象时就生成了一个不可见矩形包围的对象域Region.显示/关闭对象域Region:“View”菜单——Regions四.四.文档编辑(MATHCAD WORKSHEET)(三)(一)常用数学符号的输入4. 1.键盘输入字母,Ctrl+G 希腊字母:例:a,Ctrl+G →αp,Ctrl-G→πD,Ctrl-G→Δ* 乘号multiplication or inner (dot) product/ 分数division^ 指数exponentiation。
mathcad使用说明
Mathcad 7.0Mathcad是美国Mathsoft公司推出的一个交互式的数学系统软件。
也是适于制作理科CAI 课件的一个工具软件。
在理科类(例如数学、物理、)的教学中有大量的函数、图形,表现这方面的内容,Mathcad要比一般的通用多媒体创作工具更方便、更科学。
从早期的DOS下的1.0和Windows下的4.0版本,到今日的Mathcad 2001版本,功能也从简单的数值计算,直至引用Maple强大的符号计算能力,使得它发生了一个质的飞跃。
Mathcad7.0是集文本编辑、数学计算、程序编辑和仿真于一体的软件。
它有专业版,标准版和学生版。
Mathcad7.0 Professional(专业版)运行在Win9X/NT下。
4.3.1 Mathcad 7.0的特色Mathcad7.0的主要特点是输入格式与人们习惯的数学书写格式很近似,采用WYSWYG (所见所得)界面,适合广泛的数学计算。
Mathcad可以看作是一个功能强大的计算器,没有很复杂的规则;同时它也可以和Word、Lotus、WPS2000等字处理软件很好地配合使用,可以把它当作一个出色的全屏幕数学公式编辑器。
Mathcad在输入一个数学公式、方程组、矩阵之后,计算机能直接给出结果,而无须去考虑中间计算过程。
Mathcad 7.0 Professional 还带有一个程序编辑器,对于一般比较短小,或者要求计算速度比较低时,采用它也是可以的。
这个程序编辑器的优点是语法特别简单。
值得注意的是在加入软件包自带的Maple插件后能直接支持符号运算。
你可以在计算机上输入数学公式、符号和等式等,很容易地算出代数、积分、三角以及很多科技领域中的复杂表达式的值。
特别是Mathcad7.0显示各种图形以及科学的动画的功能,使我们对问题的理解更加容易。
Mathcad7.0的主要功能如下:1.数学运算(1)处理实数、虚数、复合数以及中间变量。
(2)处理数字、矢量和矩阵的算子以及空间变量。
MathcadPrimev2.0工程计算软件

MathcadPrimev2.0工程计算软件
Mathcad Primev 2.0工程计算软件
Mathcad Primev 2.0工程计算软件
佚名
【期刊名称】《工业设计》
【年(卷),期】2012(000)005
【摘要】如今,顶尖的工程师使用Mathcad来执行、记录和共享工程计算及设计工作。
独特的Mathcad可视化格式和便笺式界面将标准的数学符号、文本和图形均集成到一个工作表中一使Mathcad成为知识捕捉、工程计算重用和工程协作的理想之选。
【总页数】1页(P68-68)
【正文语种】中文
【中图分类】O13-4
【相关文献】
1.超级蒙特卡罗计算软件 Supe rM C
2.0中子输运计算校验 [J], 孙光耀;宋婧;郑华庆;陈珍平;郝丽娟;龙鹏程;胡丽琴;吴宜灿
2.科学计算软件Mathcad与VisualC++接口的实现 [J], 刘石丹
3.计算机辅助计算软件:Windows 95环境下财务、工程和科学计算(Mathcad 6.0,Mathcad PLUS 6.0用户指南) [J], 李斌
4.PTC Mathcad Prime2.0发布 [J],
5.“节流装置设计计算软件”(LGY-2.0-06版) [J],
因版权原因,仅展示原文概要,查看原文内容请购买。
MathCad经典入门教程(上篇)
MathCad经典入门教程(上篇)任务2-1输入及计算方程1. 单击。
随即打开一个空白工作表,显示网格和蓝色十字线。
此十字线表示下一个数学区域、文本区域、绘图、图像或求解命令块的插入点。
单击网格或按箭头键可改变蓝色十字线的位置。
2. 键入19。
将创建一个数学区域,以数字19周围的边框表示。
3. 在该数学区域外单击。
边框将消失,而蓝色十字线重新出现。
4. 单击数字19,重新激活该数学区域。
请注意蓝色光标。
使用箭头键将光标移至数学区域最右侧的插入点,如步骤2所述。
5. 要插入加法运算符,请键入 + (加号)。
键入5。
请勿插入空格。
PTC Mathcad 可根据需要在每个运算符周围插入空格。
6. 要插入指数运算符,请在数学选项卡的运算符和符号组中单击运算符。
运算符列表随即打开。
单击 xn。
会出现占位符。
键入 2。
当光标指向运算符列表中的某个运算符时,将显示工具提示,会给出该运算符的简短说明及其键盘快捷方式。
7. 要对项19和52进行分组,请按3次空格键。
待全部所需项均突出显示后,即表示分组完成。
8. 要插入乘法运算符,请键入 * (星号)。
PTC Mathcad 将插入圆括号,以指示乘以整个组。
9. 要插入余弦函数,请键入 cos。
10. 要为该余弦函数添加自变量,请键入 ( 来获得左右圆括号。
将显示中间具有一个空白占位符的圆括号对。
请注意,在步骤5、6和8中输入运算符时也会显示空白占位符。
多数情况下,当出现此类占位符时,必须先对其进行填充,方可计算表达式。
11. 要插入常数π,请键入p,然后按Ctrl+G。
要获得常数列表,请在数学选项卡的运算符和符号组中单击常数。
12. 要计算表达式,请键入 = (等号)。
将显示求值运算符及结果。
要删除结果,必须首先选择等号,然后按 Delete 或 Backspace 键。
任务2-2编辑方程1. 要编辑您在前一任务中输入的方程,必须激活其数学区域。
单击该区域。
被激活区域的周围会显示浅灰色矩形:注意:要格式化某个区域,选择该区域即可。
mathcad操作指导
/215687.html
mathcad bode 图相位为什么会从-180 度变到 180 度?减小 360 度还是解决不了。
想解释下这个帖子所提出的问题,关于波特图的相频曲线为什么从-180 度变到 180 度,很多人最初 使用 Mathcad 绘制相频曲线时应该都遇到过这个问题。,我一开始也绘制出了那样的相频曲线,好着急。 那个出现-180 度突变到 180 度因为用的 arg 函数,arg 函数在插入函数工具栏的解释是“返回复数 z 在-pi 与 pi 之间主值辐角,包括 pi。” ...这句话都能看懂吧,arg 函数计算出的值在-pi 到 pi 之间,换成角度 也就是-180 度到 180 度,所以说你觉得相位不从-180 度变到 180 度,难道还指望相位从-180 度继续减小 到-360 度么? 那怎么解决呢,那个帖子里其实有大师答复了,那就是用 angle 函数,angle 函数有两个参数,把你 需要绘制相频曲线的那个函数的实部和虚部用 Re 和 Im 分别输进去,angle 函数返回值在 0~2pi 之间,所 以还得乘以一个系数 180/pi,然后减去-360,减 360 是因为传递函数的相频特性曲线好像都在坐标轴下面 啊。。。?? 另外再提示一点,绘制相频曲线记得把 x 轴设置成对数坐标啊,双击图形弹出 x-y 图形的格式化选项 就可以设置了。 再扯点向量矩阵之类的内容吧,这个我用得也不多,不过一开始不会用函数,所以我的函数全是用向 量实现的,好傻吧,现在那个开关电源的计算文件里传递函数还是向量呢。 从数学工具栏的第三个图标调出向量矩阵工具栏,如下图所示
Mathcad操作指南.doc

Mathcad操作指南.docMathcad操作指南基础部分 3Lesson 1. Mathcad工具栏及面板 11Lesson 2:使用Mathcad工作区域 13Lesson 3: 输入数学和文本 14Lesson 4: 使用 Mathcad模板及样式 17Lesson 5: 定义变量 18Lesson 6: 定义函数 19Lesson 7: 建立数学表达式 21Lesson 8: 编辑表达式 23Lesson 9: 定义变量范围 25Lesson 10: 定义矢量和矩阵 28Lesson 11: 图表 32Lesson 12:数字和文本格式 39Lesson 13: 结果格式化 40Lesson 14:单位运算 43Lesson 15:MathCad的编程 44在哪里可以得到更多帮助: 50基础部分注意此稿包含的使用Mathcad 11版本的指南同从软件内置的指南相同。
最初的资料来源于Mathcad 7的专业版,更新了Mathcad 11版本新增加的内容。
因此, 有可能涉及到MathCad 7相关的信息,也可能在此稿中出现,标识符同MathCad 11版有些不同。
我们已经做了一些必要的编辑工作,用命令表格介绍材料,以满足FAMU - FSU 学院的机械工程系采用MathCad进行动力系统课程教育的需要。
如果未经著作拥有者许可仅限于本公司使用,不得提供给其他公司使用,MathSoft公司。
简介: Mathcad 优点Mathcad 是唯一的一个在同一张工作表集合了数学公式、数字、文本和图表的功能强大的工程应用工具。
和其它数学软件不同的是,Mathcad 是用和您一样的方式做数学。
那是因为它的操作界面就像是铅笔和纸张。
Mathcad的操作界面就是一个空白的工作区域,您可以在上面直接输入公式、图表或者是方程式,而且可以在任意的地方插入文字注解。
不像有些数学软。
Mathcad 用户指南

Mathcad 用户指南Mathcad 用户指南第一章:介绍1.1 Mathcad概述1.2 Mathcad的优势1.3 Mathcad的组成部分1.4 安装与启动Mathcad第二章:基础操作2.1 Mathcad界面介绍2.2 创建新工作表2.3 公式输入与编辑2.4 变量定义与赋值2.5 函数使用与定义2.6 数据类型与转换2.7 绘图与图像处理2.8 方程求解与优化第三章:高级技巧3.1 Mathcad程序设计与调试3.2 数值与符号计算3.3 数据处理与分析3.4 优化与拟合3.5 符号处理与微积分3.6 MATLAB与Mathcad的连接3.7 在Mathcad中使用外部数据第四章:应用示例4.1 工程问题求解4.2 科学计算与建模4.3 数据可视化与报表4.4 数学教学与研究4.5 数据分析与统计第五章:常见问题解答5.1 Mathcad软件常见问题与解答 5.2 Mathcad使用技巧与建议5.3 Mathcad故障排除与修复5.4 Mathcad版本更新内容第六章:附件附件A:Mathcad快捷键列表附件B:Mathcad内置函数参考手册附件C:常用数学符号表附录:1、本文所涉及的法律名词及注释:- 版权:指通过法律手段保护著作权人对其作品所拥有的权利,禁止他人未经许可对作品进行复制、传播、演绎等行为。
- 许可证:指著作权人给予他人使用其作品的合法权利,并明确约定使用条件和限制。
- 商标:指用于标识某种产品或服务的特殊标志、图案、文字等,具有识别和区别商品来源的功能。
2、本文档涉及附件:- 附件A:Mathcad快捷键列表,包含Mathcad软件中常用的快捷键及对应功能。
- 附件B:Mathcad内置函数参考手册,详细介绍了Mathcad中常用的数学函数及其使用方法。
- 附件C:常用数学符号表,列出了常见的数学符号及其意义,方便用户在Mathcad中使用。
- 1、下载文档前请自行甄别文档内容的完整性,平台不提供额外的编辑、内容补充、找答案等附加服务。
- 2、"仅部分预览"的文档,不可在线预览部分如存在完整性等问题,可反馈申请退款(可完整预览的文档不适用该条件!)。
- 3、如文档侵犯您的权益,请联系客服反馈,我们会尽快为您处理(人工客服工作时间:9:00-18:30)。
4. 单击 Mathcad 按钮 查看其中的命令列表,然后检查位于 Mathcad 按 钮旁边的“快速访问工具栏”。
将光标置于余弦函数自变量 α 旁边,并确保在“数学”选项卡的“样式”组中,“标签”设为 (无)。 注意 任务·3–2 描述了如何使用标签。 13. 要定义积分变量,请在其余占位符中输入与步骤 9 中相同的希腊字母。
14. 要插入除法运算符,请将光标置于 52 的左侧,然后键入 / (斜线)。将显示一个分数线,其上方有一个占 位符。
2
6. 在“数学”选项卡的“区域”组中,将指针置于“求解命令块”按钮上。将显示命 令工具提示。
7. 显示工具提示时,按 F1 键。将打开帮助主题“关于求解命令块”。 8. 在“相关链接”列表中,单击“示例:使用不等式约束求解命令块”。该帮助
主题随即打开。 9. 阅读该“示例”帮助主题,最小化“帮助中心”窗口,然后按下列步骤继续
2013/6/4
任务 2-2:编辑方程
页码,3/3
注意光标的位置如何影响结果。在步骤 11 中,您将光标置于 52 的左侧。这样,当您插入除法运算符 时,52 将成为分母。在步骤 13 中,您将光标置于组的右侧。这样,当您插入除法运算符时,该组将成为 分子。
练习
继续下一个练习之前,请输入并计算下面的方程:
即打开。单击 xn。会出现占位符。
键入 2。
当光标指向“运算符”列表中的某个运算符时,将显示工具提示,会给出该运算符的简短说明及其键盘快 捷方式。 7. 要对项 19 和 52 进行分组,请按 3 次空格键。待全部所需项均突出显示后,即表示分组完成。
8. 要插入乘法运算符,请键入 * (星号)。
http://127.0.0.1:64633/tutorials_zh_CN/gst/task2-1_entering_and_evaluating_an_equati... 2013/6/4
一些示例可以读取外部数据文件。所有的外部数据文件均位于 data_files.zip 中。如果复制的数学表达式引用了外部文件,则使用前 必须先将 data_files 目录设为当前工作目录。设置当前工作目录的方法 是将工作表保存到该目录。
1. 要保存空白工作表,请单击 。“另存为”对话框随即打开。 2. 键入文件名称,使默认 .mcdx 文件扩展名保持选中状态,然后将工作表
2013/6/4
任务 3-1:定义并计算变量
页码,1/2
Mathcad 用户界面可使您的工作变得更加直观、简单。Mathcad 的绝大多数 命令都可在功能区中找到。您可以自定义工作区:最小化或最大化功能区, 以及将常用命令添加到“快速访问工具栏”中。要详细了解某个功能区命令, 可查看其工具提示及访问上下文相关帮助。完成此练习后,您将能够: • 导航 Mathcad 工作区 • 充分利用帮助 执行任务 1-1
操作。
复制帮助示例中的数学表达式
“帮助”中包含许多示例,用来演示如何使用 Mathcad 及其函数与运算符。您 可以将“帮助”示例中的数学表达式复制到工作表中,然后尝试使用该数学 式。 注意 若要在“帮助中心”中通过可复制的数学查找示例,请在搜索字符串中添加 词“示例”,例如,“示例温度”。标题以词“示例”开始的帮助主题包含可复制 的数学。
8. 要删除指数运算符,请按 Backspace 或 Delete 键。5 和 2 变为一个整体。
当您删除某个运算符时,删除后的结果取决于该运算符及操作数。有关详细信息,请参阅“帮助”中的 “运算符”部分。 9. 要分组余弦函数及其自变量,请将指针拖到 cos(π) 上。
http://127.0.0.1:64633/tutorials_zh_CN/gst/task2-2_editing_an_equation.html
1
任务 1-1:导航及自定义 Mathcad 工作区
在本练习中,您需要导航 Mathcad 工作区和“帮助中心”。为方便起见,请下 载此 PDF 文件的副本并在您的计算机上打开它,然后继续。 1. 要保存此文件,请单击 PDF 工具栏中的 。 2. 打开保存的文件,并按下列步骤继续操作。 3. 在 Mathcad 中,检查“数学”选项卡,然后单击其他功能区选项卡以查看其
任务 2-2:编辑方程
页码,1/3
电子学习
无推荐的主题
知识库
查看英文搜索结果
搜索 LearningConnector
设置
Start using Mathcad Prime 2.0 with these free tutorials!
任务 2-2:编辑方程
1. 要编辑您在前一任务中输入的方程,必须激活其数学区域。单击该区域。被激活区域的周围会显示浅灰色 矩形:
1. 单击 。随即打开一个空白工作表,显示网格和蓝色十字线。此十字线表示下一个数学区域、文本区 域、绘图、图像或求解命令块的插入点。单击网格或按箭头键可改变蓝色十字线的位置。
2. 键入 19。
将创建一个数学区域,以数字 19 周围的边框表示。 3. 在该数学区域外单击。边框将消失,而蓝色十字线重新出现。
12. 要计算表达式,请键入 = (等号)。
将显示求值运算符及结果。要删除结果,必须首先选择等号,然后按 Delete 或 Backspace 键。 执行任务 2-2。
http://127.0.0.1:64633/tutorials_zh_CN/gst/task2-1_entering_and_evaluating_an_equati... 2013/6/4
执行任务 1-2。
任务 1-2:使用“帮助中心”
打开及导航帮助 1. 单击功能区右上角的“帮助”图标 。“帮助中心”随即打开。 2. 使用左侧的“目录”导航“帮助中心”。 3. 在“搜索”框中键入“复制数学”,并单击“搜索”。 4. 在搜索结果中,打开帮助主题“要从‘帮助’复制数学示例”。 5. 执行该主题中的步骤,然后关闭“帮助中心”。
注意 要格式化某个区域,选择该区域即可。单击工作表并将指针拖过该区域。所选区域周围会显示深灰色矩 形:
2. 单击加法运算符。运算符现在为蓝色,其操作数 (数学项 19 和 52) 已被分组。
3. 要将加法运算符替换为平方根或 n 次方根运算符,请键入 \ (反斜线),然后按 Enter 键。结果会自动重 新计算。
5. 要将某个按钮添加到“快速访问工具栏”中,请在“数学”选项卡的“区域”组 上,右键单击“文本块”图标,然后从快捷菜单中选择“添加到快速访问工具 栏”。 注意 默认情况下,“快速访问工具栏”位于 Mathcad 按钮的右侧、功能区的上 方。
6. 要移除添加的按钮,请右键单击该按钮,然后选择“从快速访问工具栏删 除”。
1
关于练习 1
任务 1-1:导航及自定义 Mathcad 工作区 ......................................................................2 任务 1-2:使用“帮助中心” ............................................................................................2
4
任务 2-1:输入及计算方程
页码,1/2
电子学习
无推荐的主题
ቤተ መጻሕፍቲ ባይዱ
知识库
查看英文搜索结果 查看知识库结果
PTC University
搜索 LearningConnector
设置
Start using Mathcad Prime 2.0 with these free tutorials!
任务 2-1:输入及计算方程
4. 单击数字 19,重新激活该数学区域。请注意蓝色光标。使用箭头键将光标移至数学区域最右侧的插入点, 如步骤 2 所述。
5. 要插入加法运算符,请键入 + (加号)。
键入 5。
请勿插入空格。Mathcad 可根据需要在每个运算符周围插入空格。 6. 要插入指数运算符,请在“数学”选项卡的“运算符和符号”组中单击“运算符”。“运算符”列表随
保存到 data_files 目录中。 注意 要检查所设置的当前工作目录是否正确,需在工作表中键入字符串 CWD=。引号所引的内容即为当前工作目录。 3. 打开帮助,并在“搜索”框中键入“示例:列、正态概率和箱线图”。单 击“搜索”并从搜索结果中打开主题。 4. 要将主题“示例:柱形图、正态概率图和箱线图”中的第一个表达式复制 到工作表中,请指向表达式图形并单击。该表达式即被复制到剪贴板 中。
15. 在该占位符中键入 1。 16. 要对方程的数学项分组,请从左至右拖动光标:
17. 键入 /。将显示一个分数线,其下方有一个占位符。
18. 在该占位符中键入 2。
http://127.0.0.1:64633/tutorials_zh_CN/gst/task2-2_editing_an_equation.html
注意
您可以输入 2 和 π,而不插入乘法运算符。Mathcad 可识别出隐式乘法,并在两项之间自动插入缩放运算 符。但是,Mathcad 会将 πθ 识别为单个变量。您必须先插入 π,然后插入乘法运算符或缩放运算符,最后 再插入 θ。
进行练习 3。
http://127.0.0.1:64633/tutorials_zh_CN/gst/task2-2_editing_an_equation.html
关于练习 1
3
注意 必须单击图形才能将表达式复制到剪贴板中。不要按 Ctrl+C。 5. 要粘贴表达式,请在工作表中单击,然后按 Ctrl+V。 也可右键单击工作表并从快捷菜单中选择“粘贴”。 该表达式即被复制到工作表中。 6. 要复制示例中的所有数学表达式,请单击“帮助”示例右上角的“复制表达 式”。 7. 在工作表中单击,并按下 Ctrl+V。所有表达式都将复制到工作表中。 注意 本示例使用了外部数据文件 furnace.csv。如果工作目录未设为 data_files 文件夹,则工作表会显示计算错误。 8. 编辑所粘贴的数学表达式以查看结果如何变化。 9. 保存工作表,并使其保持打开状态。 打开“帮助中心”中的“入门教程”,然后继续进行练习 2。