雅思剑桥部分Task1考官范文翻译
剑桥雅思考官范文讲解
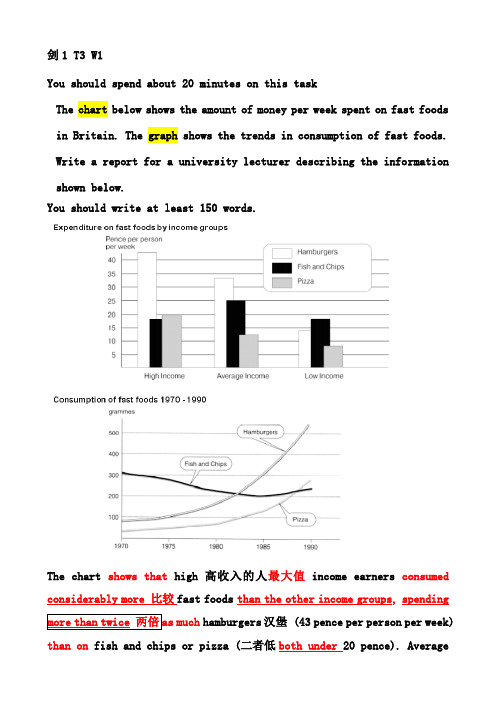
剑1 T3 W1You should spend about 20 minutes on this taskThe chart below shows the amount of money per week spent on fast foods in Britain. The graph shows the trends in consumption of fast foods. Write a report for a university lecturer describing the information shown below.You should write at least 150 words.The chart shows that high 高收入的人最大值income earners consumed considerably more 比较fast foods than the other income groups, spending more than twice 两倍as much hamburgers汉堡 (43 pence per person per week) than on fish and chips or pizza (二者低both under 20 pence). Averageincome earners also比较 favored hamburgers,中等收入spending 33 pence per person per week, followed by f ish and chips at 24 pence, and then pizza at 11 pence. Low income earners appear to 低收入spend less 比较than other income groups on fast foods,though fish and chips remain their most popular fast food, 没写数值followed by hamburgers and then pizza.From the graph we can see that in 1970, fish and chips were开头最大值 twice as popular as burgers, 比较pizza being at that time the least popular fast food. The consumption of hamburgers and pizza has risen steadily 上升over the 20 years period to 1990 while the consumption of fish and chips has been 下降趋势in decline over that same period with a slight increase in popularity 虽然中间有上升since 1985.剑1 T3 W2You should spend about 40 minutes on this task.Present a written argument or case to an educated reader with no specialist knowledge of the following topic:News editors decide what to broadcast on television and what to print in newspapers. What factors do you think influence these decisions? Do we become used to bad news? Would it be better if more good news was reported?混合类,媒体You should write at least 250 words.Use your own ideas, knowledge and experience and support your arguments with examples and relevant evidence.It has often been said that‘Good news is bad news’ because it does not sell newspapers. A radio station that once decided to present only good news soon found that it had gone out of business for lack of listeners. Bad news, on the other hand, is so common that in order to cope with it, we often simply ignore it. We have become immune to bad news a nd the newspapers and radio stations are aware of this.While newspapers and TV stations may aim to report world events accurately,be they natural or human disasters, political events or the horrors of war, it is also true that their m ain objective is to sell newspapers and attract listeners and viewers to their stations. For this reason, TV and radio stations attempt to reflect the flavor of their station by providing news broadcasts tailor-made to suit their listeners’preferences. Programmes specializing in pop music or TV soap operas focus more on local news, home issues and up-to-date traffic reports. The more serious stations and newspapers like to provide “so called”objective news reports with editorial comment aimed at analyzing the situation.If it is true, then, that newspapers and TV stations are tailoring their news to their readers’and viewer’s requirements how can they possibly be reporting real world events in an honest and objective light? Many radio and TV stations do, in fact, report items of good news but they no longer call this news. They refer to these as human interest stories and package them in programmes specializing, for instance, in consumeraffairs or local issues. Good news now comes to us in the form of documentaries the fight against children’s cancer or AIDS, or the latest developments in the fight to save the planet from environmental pollution.GENERAL TRAINING WRITING MODULEWriting Task 1You should spend about 20 minutes on this task.You have had a bank account for a few years. Recently you received a letter from the hank stating that your account is $240 overdrawn and that you will he charged $70 which will he taken directly from your account.You know that this information is incorrect.Write a letter to the bank. Explain what has happened and say what you would like them to do about it.You should write at least 150 words.You do NOT need to write your own address.Begin your letter as follows:Model answer 186 wordsDear Sir,I am writing in reply to a letter I received from you a few days ago. In your letter you state that I am $240 overdrawn and that you will be charging me $70.I would like to point out that the reason I am overdrawn is because ofa mistake made by your bank. If you look through your records you will see that I wrote several weeks ago explaining the situation. For the last twelve months, I have been paying $300 a month for a car I bought last summer. The monthly payments were taken directly from my bank account. However, two months ago I sold the car and I wrote to you instructing you to stop paying the monthly installments. I received a letter from you acknowledging my request, but, for some reason, nothing was done about it. Another $300 installment has been paid this month and this is the reason why I am overdrawn.I would like you to contact the garage where I bought the car explaining your error. I would also like you to ask them to return the money.Yours faithfully,P Stoft.Writing Task 2You should spend about 40 minutes on this task.As part of a class assignment you have to write about the following topic: We are becoming increasingly dependent on computers. They are used in businesses, hospitals, crime detection and even to fly planes. What things will they be used for in the future? Is this dependence on computers a good thing or should we be more auspicious of their benefits?表态混合,科技You should write at least 250 words.Model answer 287 wordsComputers ar e a relatively new invention. The first computers were built fifty years ago and it is only in the last thirty or so years that their influence has affected our everyday life. Personal computers were introduced as recently as the early eighties. In this short time they have made a tremendous impact on our lives. We have been so dependent on computers that it is hard to imagine what things would be like today without them.You have only got to go into a bank when their main computer is broken to appreciate the chaos that would occur if computers were suddenly removed world-wide.In the future computers will be used to create bigger and even more sophisticated computers. The prospects for this are quite alarming.They will be so complex that no individual could hope to understand how they work. They will bring a lot of benefits but t hey will also increase the potential for unimaginable chaos. They will, for example, be able to f ly planes and they will be able to coordinate the movements of several planes in the vicinity of an airport. Providing all the computers is working correctly, and nothing can go wrong.There is a certain inevitability that technology will progress and become increasingly complex. We should, however, ensure that we are still in a position where we are able to control technology. It will be all tooeasy to suddenly discover that technology is controlling us. By then it might be too late. I believe that it is very important to be suspicious of the benefits that computers will bring and make sure that we never become totally dependent on a completely technological world.剑2T1 W1You should spend about 20 minutes on this task.The table below shows the consumer durables (telephone, refrigerator, etc.) owned in Britain from 1972 to 1983.Write a report for a university lecturer describing the information shown below.You should write at least 150 words.The chart shows that the percentage of British households with a range of consumer durables steadily increased 总体上升between 1972 and 1983. The greatest increase最大变化 was in telephone ownership, rising from 42% in 1972 to 77% in 1983. 接着Next came central heating ownershi p, rising from 37% of households in 1972 to 64% in 1983. The percentage of households with a refrigerator 第三变化rose 21% over the same period and of those with a washing machine by 14%. Households with vacuum-cleaners, televisions and dishwashers increased by 8%, 5% and 2% respectively.In 1983, the year of their introduction, 18% of households had a video recorder.The significant social changes reflected in the statics are that over the period the proportion of British houses with central heating rose from one to two thirds, and of those with a phone from under a half to over three-quarters. Together with the big increases in the ownership of washing machines and refrigerators, they are evidence of b oth rising living standards and the trend to lifestyles based on comfort and convenience.剑2T1W2You should spend about 40 minutes on this task.Present a written argument or case to an educated reader with no specialist knowledge of the following topic.“Fatherhood ought to be emphasized as much as motherhood. The idea that women are solely responsible for deciding whether or not to have babies leads on to the idea that they are also responsible for bringthe children up. ”表态,家庭教育To what extent do you agree or disagree?You should write at least 250 words.You should use your own ideas, knowledge and experience and support your arguments with examples and relevant evidence.I believe表观点二者一样重要that child-rearing should be the responsibility of both parents and that, whilst roles within that relationship may be different, they are nevertheless equal in importance. In some societies, it has been made easier over the years for single parents to raise children on their own. However, this does not mean that the traditional family,with both parents providing emotional support and role-models for their children, is not the most satisfactory way of bringing up children.Of crucial importance, in my opinion, is how we define‘responsible for bringing the children up’. At its simplest, it could mean giving the financial support necessary to provide a home, food and clothes and making sure the child is safe and receives an adequate education. This would be the basic definition.There is, however, another possible way of defining that part of the quotation. This would say it is not just the father’s responsibility to provide the basics for his children, while his wife involves herself in the everyday activity of bringing them up.Rather, he would share those daily duties, spend as much time as his job allows with his children,play with them, read to them, help directly with their education, participate very fully in their lives and encourage them to share his.It is this second, fuller concept of ‘fatherhood’ that I am in favour of,although I also realize how difficult it is to achieve sometimes. The economic and employment situation in many countries means that jobs are g etting more, not less, stressful, requiring long hours and perhaps long journeys to work as well. Therefore it may remain for many a desirable ideal rather than an achievable reality.剑2 T2 W1The chart below shows the amount of leisure time enjoyed by men and women of different employment status.Write a report for a university lecturer describing the information shown below. You should write at least 150 words.The chart shows the number of hours of leisure enjoyed by men and women in a typical week in 1998-9, according to gender and employment.Among those employed full-time, men on average had fifty hours of leisure, whereas women had approximately thirty-seven hours. There were no figures given for male part-time workers, but female part-timers had forty hours of leisure time, only slightly more than women in full-time employment, perhaps reflecting their work in the home.In the unemployed and retired categories,leisure time showed an increase for both sexes, as might have been expected. Here too, men enjoyed more leisure time --- over eighty hours, compared with seventy hours for women, perhaps once again reflecting the fact that women spend more time working in the home than men.Lastly, housewives enjoyed approximately fifty-four hours of leisure on average. There were no figures given for househusbands. Overall, the chart demonstrates that in the categories for which statistics on male leisure time were available, men enjoyed at least ten hours of extra leisure time.剑2 T2 W2You should spend about 40 minutes on this task.Present a written argument or case to an educated reader with nospecialist knowledge of the following topic.“Prevention is better than cure.” Out of a country’s budget, a large proportion should be diverted from treatment to spending on health education and prevention measures.表态,医疗To what extent do you agree or disagree with this statement.You should write at least 250 words. You should use your own ideas, knowledge and experience and support your argument with examples and relevant evidence.Of course it goes without saying that prevention is better than cure. That is to say, in recent years, there has been a growing body of opinion in favor of putting more resources into health education and preventive measures. The argument is that ignorance of, for example, basic hygiene or the dangers of an unhealthy diet or lifestyle needs to be combated by special nationwide public campaigns, as well as longer-term health education.Obviously, there is a strong argument for catching any medical condition as early as possible. There is also an economic argument for doing so. Statistics demonstrate the cost-effectiveness of treating a condition in the early stages, rather than delaying until more expensive and prolonged treatment is necessary. Then there are social or economic costs, perhaps in terms of loss of earnings for the family concerned or unemployed benefits paid by the state.So far so good, but the difficulties start when we try to define whatthe ‘proportion’ of the budget should be, particularly if the funds will be ‘diverted from treatment’. Decisions on exactly how much of the total health budget should be spent in this way are not a matter for the non-specialist, but should be made on the basis of an accepted health service model.This is the point at which real problems occur---the formulation of the model. How do we accurately measure which health education campaigns are effective in both medical and financial terms? How do we agree about the medical efficacy of various screening programme s, for example, when the medical establishment itself does not agree? A very rigorous process of evaluation is called for, so that we can make informed decisions.剑2 T4 W1You should spend about 20 minutes on this task.The table below shows the figures for imprisonment in five countries between 1930 and 1980. Write a report for a unive rsity lecturer describing the information shown below.You should write at least 150 words.The table shows that t he figures for imprisonment in the five countries mentioned indicated no overall pattern of increase or decrease. In fact there is considerable fluctuation from country to country.In Great Britain the numbers in prison have increased steadily 增长from 30,000 in 1930 to 80,000 in 1980. O n the other hand in Australia, and particularly in New Zealand,the numbers fell下降 markedly from1930 to 1940. Since then they have increased gradually接着上升, apart from in 1980 when一个特例the numbers in prison in New Zealand fell by about 30,000 from the 1970 total. Canada is the only country in which the numbers in prison have decreased一直下降的 over the period 1930 to 1980, although there have been fluctuations in this trend. T he figures for the United States 美国的数量最多i ndicate the greatest number of prisoners compared to比较 the other four countries but population size needs to be taken into account in this analysis. The prison population i n the United States increased rapidly增长的快 f rom 1970 to 1980 and this trendmust be a worrying trend.剑2 T4 W2You should spend about 40 minutes on this task.Present a written argument or case to an educated reader with no specialist knowledge of the following topic.The position of women in society has changed markedly in the last twenty years. Many of the problems young people now experience, such as juvenile delinquency, arise from the fact that many married women now work and are not at home to care for their children.To what extent do you agree of disagree with this opinion?表态,犯罪You should write at least 250 words. You should use your own ideas, knowledge and experience and support your arguments with examples and relevant evidence.It is certainly true 开头背景句that t he position of women in society has undergone a dramatic change in the past twenty years but开头表达I do not feel that this 代词is the direct cause of t he indisputable increase in juvenile-related problems during this代词 period.It is now accepted主语从句 that young women should work on leaving school; indeed to rely totally on their parents’ financial support第一个经济原则:结婚前不依靠父母 is no longer an option in many families. Likewise, once一旦代替if they get married结婚后, the majority of women continue working since代替because the financial pressures of settingup a house and establishing a reasonable standard of living often require two incomes第二个经济原则:生活要求双薪.Twenty years ago 对比it was common过去在家里 for women to give up work once they had children and to devote their time to caring for their children. This代词 is no longer the general rule and the provision of professionally-run child care facilities and day nurseries现在不用have removed much of the responsibility for child rearing that used to fall to mo thers.However, these facilities代词 come at a cost and often require two salaries coming into a family to be afforded.I do not believe再次表达观点 that t he increase in the number of working mothers has resulted in children非谓语being brought up less well than previously.Indeed it could be argued让步承认 that by giving mothers the opportunity to work and earn extra money children can be better provided for than previously.There is more money for luxuries and holidays and a more secure family l ife is possible. Of course there are limits as to the amount of time that ideally should be spent away from home, and the ideal scenario would 可能be for one of the parents (often the wife) to have a part-time job and thus连接副词前加连词 be available for their children before and after school. 建议It is important to establish the correct balance between family life and working life.剑2 General Training Test AYou should spend no more than 20 minutes on this task.You borrowed some books from your school or college library.Unfortunately you have to go away to visit a sick relative and cannot return the books in time.Write a letter to the library. Explain what has happened and tell them what you want to do about it. You should write at least 150 words. You do NOT need to write your own address.Begin your letter as follows:Dear _________.Dear Sir or Madam,I am writing this letter to explain why I have been unable to return the three books I have out on three-day loan, which are now overdue. After taking the books out on 16th March, I had an urgent phone call from my aunt’s neighbor to say that my aunt had had a fall and had been taken into hospital. I am her only surviving relative in this country, so I felt I had to go and see her immediately. I travelled down to Surrey the following morning, thinking I would stay for only two or three days. Unfortunately, my aunt’s condition has only improved very slowly, so I have had to stay here longer than expected. However, the hospital says that if all goes well, she should be able to go home in two or three days’time, in which case I will be back at the beginning of next week.Bearing in mind the circumstances, I trust you will kindly waive any fines that may have accumulated.Your sincerely,Writing Task 2You should spend no more than 40 minutes on this task.As part of a class assignment you have to write about the following topic.Some governments say how many children a family can have in their country. They may control the number of children someone has through taxes.It is sometimes necessary and right for a government to control the population in this way.表态,政府控制人口Do you agree or disagree? Give reasons for your answer. You should write at least 250 words.It is certainly very understandable (主语从句)that s ome governments should start looking at ways of limiting their代词 populations t o a sustainable figure.In the past, (过去)populations were partly regulated by frequent war and widespread disease,(时间对比方法) but in recent years(现在) the effects of those(代表前句中的frequent…) factors have been diminished. Countries can be faced with a population that i s growing much faster than the nation’s food resources or employment opportunities and whose members can be condemned to poverty by the need to feed extra mouths. They identify population control as a means of raising living standards.But how should it be achieved? Clearly, this whole area i s a very delicate personal and cultural issue. Many people feel that this is not a matter for the state. They feel that this is one area of life where they have the right(权利原则) to make decisions for themselves.For that reason, it would seem that the best approach would be to work最好说服bypersuasion rather than不是强迫compulsion. This could be done by a process of education教育 that points out the way a smaller family can mean an improved quality of life for the family members, as well as less strain on the country’s, perhaps v ery limited, resources.This is the preferred way. Of course, if this does not succeed within a reasonable time scale, i t may be necessary to 也可以采取其他consider o ther measures, such as tax incentives or child-benefit payments for small families only. These are midway between persuasion and compulsion.So it is sometimes建议 necessary, but governments should try very hard to 首先persuade first. They should also remember that this is a very delicate area indeed, and that social engineering can create as many problems as it solves.剑3 T2 W1You should spend about 20 minutes on this task.The chart shows the amount spent on six consumer goods in four European countries.Write a report for a university lecturer describing the information shown below.The chart shows that Britain,最大值 among the four European countries listed, has spent heavily on the range of consumer goods included. In every case, Britain spending is considerably higher than that of other countries;only in the case of tennis racquets dose another country, Italy, comes close.In contrast,Germany is generally 最小值the lowest spender.This is most evident on photographic fi lm, where Germany spends much less than Britain. Germany only spends more than another country, France, in two cases: tennis racquets and perfumes.M eanwhile, France and Italy中间 g enerally maintain middle positions, averaging approximately similar spending overall. Specifically, France spends more on CDs and photographic film but less on tennis racquets than Italy does. Italy’s spending on personal stereos i s only marginally greater than that of F rance, while spending on toys is equal between the two.It is clear from the data given that there are some significant differences in spending habits within Europe.剑3 T2 W2You should spend about 40 minutes on this task.Present a written argument or case to an educated reader with no specialist knowledge of the following topic:When a country develops its technology, the traditional skills and ways of life die out. It is pointless to try and keep them alive. To what extent do you agree or disagree?表态,科技You should use your own knowledge and experience and support your arguments with examples and relevant evidence.Overall, I disagree with表观点 the opinion expressed. I would like to begin by pointing out that traditional skills and ways of life are not automatically of one country, but of one culture or community.In many ways, the history of civilization is the history of technology: from the discovery of fire to the invention of the wheel to thedevelopment of the internet, we have been moving on from previous ways of doing things. Some technologies, such as w eapons of mass destruction, are of negative impact. Others, such as medical advance s, positively help people to live better or longer, so very much help traditional ways of life. Surely,few people would seek to preserve such traditions as living in caves!Interestingly, technology can positively contribute to the keeping alive of traditional skills and ways of life. For example,the populations of some islands are too small to have normal schools. Rather than breaking up families by sending children to the mainland, educational authorities have been able to use the Internet to deliver schooling online. In addition, the Internet and modern refrigeration techniques are being used to keep alive the traditional skills of producing salmon; it can now be ordered from, and delivered to, anywhere in the world.I n conclusion, without suggesting that all technology is necessarily good, I think 再次表达it is by no means ‘pointless’, in any way, to try to keep traditions alive with technology. We should not ignore technology, because it can be our friend and support our way of life.剑3 T3 W1You should spend 20 minutes on this task.The charts below show the levels of participation in education and science in developing and industralized countries in 1980 and 1990. Write a report for a university lecturer describing the information shownbelow.The data shows the differences between developing and industrialized countries’ participation in education and science.In terms of the number of years of schooling received, we see that the length of time people spend at school in industrialized countries was much greater at8.5 years in 1980, 比较compared to 2.5 years in developing countries. T he gap was increased further in 1990 when the figures rose to 10.5 years and 3.5 years respectively.We can see a familiar pattern比较 in the second graph, which shows thatthe number of people working as scientists and technicians in industrialized countries increased 增长from 55 to 85 per 1,000 people between 1980 and 1990, while比较 the number in d eveloping countries went from 12 to 20.Finally, the figures for spending on research and development show that industrialized countries m ore than doubled 加倍their spending, from $200bn to $420bn, whereas但developing countries actually decreased theirs, from $75bn down to $25bn.Overall we can see that not only are there very large differences between the two economies but that these gaps are widening.剑3 T3 W2You should spend about 40 minutes on this task.Present a written argument or case to an educated reader with no specialist knowledge of the following topic.In many countries children are engaged in some kind of paid work. Some people regard this as completely wrong, while others consider it as valuable work experience, important for learning and taking responsibility. What are your opinions on this?表态,教育You should use your own knowledge and experience and support your argument with examples and relevant evidence.You should write at least 250 words.The issue of children doing paid work is a complex and sensitive one. It is difficult to say who has the right to judge whether children working is ‘wrong’or ‘valuable’. Opinions will also differ as to ‘learning’benefits: no doubt teachers and factory owners, for example, would have varying concerns.An important consideration is 工作种类不同the kind of work undertaken. Young children 不同意这种工作d oing arduous and repetitive tasks on a factory production line, for example, are less likely to be‘learning’than older children helping in an old people’s home. There are health and safety issues to be considered as well. It is an unfortunate fact 同位语从句that many employers雇主省钱 may prefer to use the services of children simply to save money by paying them less than adults and it is 强调句this type of exploitation that should be discouraged.However, in many countries c hildren work because their families need the additional income家庭需要收入, no matter how small.This was certainly true in the past in many industrialized countries, and it is very difficult to judge that it is wrong for children today to contribute to the family income in this way.Nevertheless, in better economic circumstances, few parents would choose to send their children out to full-time paid work. If learning responsibilities and work experience责任和经验 are considered to be important,then children can acquire these by having light, part-time jobs or even doing tasks such as helping their parents around the family。
剑桥雅思1-3&5-7 考官范文Writing Task 1

The graph below shows the consumption of fish and some different kinds of meat in a European country between 1979 and 2004.Summarise the information by selecting and reporting the main features, and make comparisons where relevant.The graph illustrates changes in the amounts of beef, lamb, chicken and fish consumed in a particular European country between 1979 and 2004.In 1979, beef was by far the most popular of these foods, with about 225 grams consumed per person per week. Lamb and chicken were eaten in similar quantities (around 150 grams), while much less fish was consumed (just over 50 grams). However, during this 25-year period the consumption of beef and lamb fell dramatically to approximately 100 grams and 55 grams respectively. The consumption of fish also declined, but much less significantly to just below 50 grams, so although it remained the least popular food, consumption levels were the most stable.The consumption of chicken, on the other hand, showed an upward trend, overtaking that of lamb in 1980 and that of beef in 1989. By2004 it had soared to almost 250 grams per person per week.Overall, the graph shows how the consumption of chicken increased dramatically while the popularity of these other foods decreased over the period. (173 words)The charts compare the sources of electricity in Australia and France in the years1980 and 2000. Between these years, electricity production almost rising from 100 units to 170 in Australia, and from 90 to 180 units in France.In 1980, Australia used coal the main the electricity source (50 units) and the remainder was produced from natural gas, hydro power (each producing 20 units) and oil (which produced only 10 units). By 2000, coal had become the fuel for more than 75% of electricity produced and only hydro continued to be another significant source supplying approximately 20%.In contrast, France used coal as a source for only 25 units of electricity in 1980, which was matched by natural gas. The remaining 40 units were produced largely from oil and nuclear power, with hydro contributing only 5 units. But by 2000, nuclear power, which was not used at all in Australia, had developed into the main source, producing almost 75% of electricity, at 126 units, while coal and oil together produced only 50 units. Other sources were no longer significant.Overall, it is clear that by 2000 these two countries relied on different principal fuel sources: Australia relied on coal and France on nuclear power. (206 words)2. 剑二-Test1-Task1 (Table)The table below shows the consumer durables (telephone, refrigerator, etc.) owned in Britain from 1972 to 1983.Write a report for a university lecturer describing the information shown below.The chart shows that the percentage of British households with a range of consumer durables steadily increased between 1972 and 1983. The greatest increase was in telephone ownership, rising from 42% in 1972 to 77% in 1983. Next came central heating ownership, rising from 37% of households in 1972 to 64% in 1983. The percentage of households with a refrigerator rose 21% over the same period and of those with a washing machine by 14%. Households with vacuum-cleaners, televisions and dishwashers increased by 8%, 5% and 2%, respectively. In 1983, the year of their introduction, 18% of households had a video recorder.The significant social changes reflected in the statistics are that over the period the proportion of British houses with central heating rose from one to two thirds, and of those with a phone from under a half to over three-quarters. Together with the big increases in the ownership of washing machines and refrigerators, they are evidence of both rising living standards and the trend to lifestyles based on comfort and convenience. (173 words)剑二-Test3-Task1 (Table)Band 73. 剑二-Test2-Task1 (Bar chart)The chart below shows the amount of leisure time enjoyed by men and women of different employment status.Write a report for a university lecturer describing the information shown below.The chart shows the number of hours of leisure enjoyed by men and women in a typical week in 1998-9, according to gender and employment status.Among those employed full-time, men on average had fifty hours to leisure, whereas women had approximately thirty-seven hours. There were no figures given for male part-time workers, but female part-time had forty hours of leisure time, only slightly more than women in full-time employment, perhaps reflecting their work in the home.In the unemployed and retired categories, leisure time showed an increase for both sexes, as might have been expected. Here too, men enjoyed more leisure time—over eighty hours, compared with seventy hours for women, perhaps once again reflecting the fact that women spend more time working in the home than men.Lastly, housewives enjoyed approximately fifty-four hours of leisure, on average. There were no figures given for househusbands! Overall, the chart demonstrates that in the categories for which statistics on male leisure time were available, men enjoyed at least ten hours of extra leisure time. (173 words)4. 剑二-Test4-Task1 (Bar chart)The table below shows the figures for imprisonment in five countries between1930 and 1980.Write a report for a university lecturer describing the information shown below.The table shows that figures for imprisonment in the five countries mentioned indicate no overall pattern of increase of decrease. In fact there is considerable fluctuation from country to country.In Great Britain the numbers in prison have increased steadily 30,000 to 80,000 in 1980. On the other hand in Australia, and particularly in New Zealand, the numbers fell markedly from 1930 to 1940. Since then they have increased gradually, apart from in 1980 when the numbers in prison in New Zealand fell by about 30,000 from the 1970 total. Canada is the only country in which the numbers in prison have decreased over the period 1930 and 1980, although there have been fluctuations in this trend. The figures for the United States indicate the greatest number of prisoners compared to the other four countries but population size needs to be taken into account in this analysis. The prison population in the United States increased rapidly from 1970 to 1980 and this must be a worrying trend. (167 words)剑七-Test3-Task1 ( Bar chart)Band 6.51.剑一--Practice Test 3, Writing Task 1 (bar chart combined with line graph) The chart below shows the amount of money per week spent on fast foods in Britain. The graph shows the trends in consumption of fast-foods.Write a report for a university lecturer describing the information shown below.(Model answer 165 words)The chart shows that high income earners consumed considerably more fast foods than the other income groups, spending more than twice as much on hamburgers (43 pence per person per week) than on fish and chips or pizza (bothunder 20 pence). Average income earners also favoured hamburgers, spending 33 pence per person per week, followed by fish and chips at 24 pence, then pizza at 11 pence. Low income earners appear to spend less than other income groups on fast foods, though fish and chips remains their most popular fast food, followed by hamburgers and then pizza.From the graph we can see that in 1970, fish and chips were twice as popular as burgers, pizza being at that time the least popular fast food. The consumption of hamburgers and pizza has risen steadily over the 20 year period to 1990 while the consumption of fish and chips has been in decline over that same period with a slight increase in popularity since 1985.。
剑桥10task1范文

剑桥10task1范文请高手批改雅思作文!task1,test3,剑桥5正文:...应该说语言的应用应该算是成功的.但文章的解题思路有些乱,这也是流程图的大忌.此图应从S1和S2周边的基础设施分类来分析,不用特别涉及到哪个具体城镇来,否则就会失去整体感.因为凌乱.所以本文是5.5 分The map illustrates the two possible locations for a new planned supermarket(S) for the town of Garlson whose population is 65,000.It can be seen clearly from the map that the Garlson town is made up of four parts. In the middle is the town centre,surrounded by the housing part at each the north and south side of which is an industrial part./这句话很混乱,可以调整为:situated in the middle, the town center is surrounded by an industrial part in both north and south side.All of the above three parts are surroundede by the countryside as a whole.Both the two possible sites for the new supermarket,S1 and S2,have a railwaynearby.The difference of the two locations are as follows.S2 is in the town centre and it has access to three main roads to three places(Hindon,Bransdon and Cransdon) with a total population of 54,000.However,S1 located in the countrside with only one main road available to Hindon(population,10,000).It is easy to draw a conclusion from the map that, in parison with S1,S2 is relatively better in terms of transportation available and the number of people the new supermarket may serve.雅思写作Task1饼状图考官范文怎么写?The pie charts below show the average household expenditures in a country in 1950 and 2010. Summarise the information by selecting and reporting the main features, and make parisons where relevant. Sample Answer: The provided pie charts shows the expenses made in housing, food, health care, education, transportation and other items in a country in 1950and 2010. As is observed from the pie charts, in 1950 almost two-third expenditure was in housing whereasthis average expenditure has been increased for food, transportation etc. in 2010. According to the given data, more than 70% expenditure was in housing in 1950. The second most expenditure in this country was in food. All other expenditures including health care, education, transportation etc. were less than 20% in total. After 60 years the trends of expenditure inthis country significantly changed. People's expenditure in housing decreased to only 22% while the expenditure for food increased to 34%. Interestingly the expenditure on education decreased over time while the expenses for transportation increased to 14%. All other expenditure in 1950 was only 4.4% whichincreased to 19.2% in 2010 which indicates the new addition on category where people started expensing than they did in 1950. In summary, the expenditure nature of people had changed significantly in 2010than that had been in 1950.【有篇雅思小作文哪位高手帮忙看看能得计分,有错请批评指正(这是...第一句用show更好些 suitation 比较生僻,是situation?第二段第一句话graph是名词,并且你一定要注意graph和chart是不一样的第一句应该是 in many categories 还有large本身就是形容词,后面不用跟of.which后应该是has 因为你用它代diploma. times是可数,用as many as.还有In undergraduate diploma和however做同一成分,它俩不能并存,可把however放后面些还有the percentage of women ?这也不清楚有时间再帮你改...我先睡一觉你要多多加油了如何攻克雅思作文剑桥雅思10作文范文2英语基础差如何攻克雅思写作难关?首先,雅思写作难在思维与逻辑。
剑5 A类Test 1 Task 1考官范文翻译、分析

剑5 A类Test 1 Task 1Q: The graph below shows the proportion of population aged 65 and over between 1940 and 2040 in three different countries.下图显示的是不同国家在1940年到2040年间,65岁及以上年龄人口占总人口的比重。
Summarise the information by selecting and reporting the main features, and make comparisons where relevant.对表中信息进行筛选,总结出该表格的主要信息特点,并对相关信息进行比较。
考官范文翻译:The graph shows the increase in the ageing population in Japan, Sweden and the USA. It indicates that the percentage of elderly people in all three countries is expected to increase to almost 25% of the respective populations by the year 2040.图表显示了在日本,瑞典和美国老龄化人口的增长。
该图表明,预计到2040年,这三个国家的老龄人口所占比重分别都将增长至接近25%In 1940 the proportion of people aged 65 or more stood at only 5% in Japan, approximately 7% in Sweden and 9% in the US. However, while the figures for the Western countries grew to about 15% in around 1990, the figure for Japan dipped to only 2.5% for much of this period, before rising to almost 5% again at the present time.1940年,日本65岁及以上年龄人口所占比重不过5%,而瑞典和美国大约是7%和9%。
剑桥雅思考官范文

剑桥雅思考官范文Well, let me tell you about this amazing trip I had. It was to Thailand, you know, that place full of all kinds of wonders.I landed in Bangkok first. Oh my god, the moment I stepped out of the airport, it was like being hit by a wave of heat and chaos, but in a really exciting way. The traffic was just crazy. There were tuk tuks zoomingaround everywhere. They look like these little three wheeled buggies, and the drivers are always trying to get you to take a ride with them. I hopped on one and it was like being on a rollercoaster, zipping in and out of the traffic.The food in Thailand is out of this world. I mean, I'm a big foodie and this place was like a paradise for me. There were street stalls everywhere selling things like pad thai. It's this delicious noodle dish with peanuts and lime and all sorts of goodness. And the mango sticky rice, that waslike a little slice of heaven. The mango was so ripe and sweet, and the sticky rice was just the perfect complement.Then I went to the beaches in Phuket. The water was so clear, like a giant blue mirror. I could see all the colorful fish swimming around justby looking down from my boat. I tried snorkeling for the first time. At first, I was a bit scared, you know, thinking about all those fish and what if something bites me. But once I put my face in the water, it was like entering a whole new world. There were these beautiful coral reefs, all shapes and colors, and the fish were just swimming around me like theydidn't care I was there. It was an incredible feeling.The people in Thailand are also super friendly. They always have asmile on their face. Even when there was a bit of a language barrier, wecould still communicate with gestures and a few broken English words. I remember asking a local where the nearest temple was, and he not only told me but actually walked me part of the way there.All in all, it was a trip that I'll never forget. It had a bit of everything adventure, great food, beautiful scenery and lovely people. Ican't wait to go back there again someday.I'm going to talk about my grandpa. He's one of the most interesting people I've ever known.My grandpa looks like a character out of an old fashioned movie. He's got this big, bushy white mustache that he twirls around when he's thinking. His eyes are always twinkling with mischief or kindness, depending on the situation. He's not a very tall man, but he has this big presence, you know.He's a real jack of all trades. He can fix just about anything around the house. I remember when our old clock stopped working. Everyone was thinking we should just buy a new one, but not grandpa. He got his toolbox out, which is this big, rusty box full of all kinds of strange looking tools. He spent the whole afternoon tinkering with the clock, and by theend of the day, it was ticking away as good as new.Grandpa also has a great sense of humor. He loves to tell jokes, especially those old fashioned ones that make you groan and laugh at the same time. For example, he'll say, “Why don't scientists trust atoms? Because they make up everything.” And then he'll laugh this big bellylaugh that's really contagious.He's also really into gardening. His garden is like a little piece of paradise. There are all kinds of flowers and vegetables growing there. In the spring, it's full of colorful tulips and daffodils. And in the summer,he has these huge tomatoes and cucumbers. He spends hours out there, watering the plants, talking to them as if they can understand him. He says that if you talk nicely to your plants, they'll grow better.My grandpa is also a bit of a storyteller. He'll sit us down on the porch and start telling us stories about his youth. How he used to travel around on his old bicycle, exploring the countryside. He'll tell us about the adventures he had, like the time he got caught in a thunderstorm while out in the fields and had to take shelter in an old barn. His stories are always full of details and they make you feel like you were there with him.All in all, my grandpa is an amazing person. He's full of life, knowledge and love, and I'm really lucky to have him in my life.。
剑桥雅思真题9Test 1 Task 2考官范文英译汉
剑桥雅思真题9Test 1 Task 2考官范文英译汉1. Traditionally,children have begun studying foreign languages atsecondary school, but introducing them earlier is recommended by some educationalists.2. This policy has been adopted by some educational authorities or individualschools, with both positive and negative outcomes.3. The obvious argument in its favour is that young children pick uplanguages much more easily than teenagers.4. Their brains are still programmed to acquire their mother tongue, whichfacilitates learning another language, and unlike adolescents, they are not inhabited by self-consciousness.5. The greater flexibility of the primary timetable allows for more frequent,shorter sessions and for a play-centred approach, thus maintaining learners’ enthusiasm and progress.6. Their command of the language in later life will benefit from this earlyexposure, while learning other languages subsequently will be easier for them.7. They may also gain a better understanding of other cultures.8. There are, however, some disadvantages.9. Primary school teachers are generalists, and may not have the necessarylanguage skills themselves.10. If specialists have to be brought in to deliver these sessions, the flexibilityreferred to above is diminished.11. If primary language teaching is not standardised, secondary schools couldbe faced with a great variety of levels in different languages within their intake, resulting in a classroom experience which undoes the earlier gains.12. There is no advantage if enthusiastic primary pupils become demotivatedas soon as they change schools.13. However, these issues can be addressed strategically within the policyadopted.14. Anything which encourages language learning benefits societyculturallyand economically, and early exposure to language learning contributes to this.15. Young children’s innate abilities should be harnessed to make thesebenefits more achievable.感谢您的阅读,祝您生活愉快。
剑桥雅思4口语Test1P1范文

剑桥雅思4口语Test1P1范文雅思为各位考生推荐复习材料-剑4 口语Test1 P1范文-Friends,需要本单元写作教程的同学,请点击:剑桥雅思4Test1写作Task1范文-The table。
PART 1FriendsQ: Are your friends mostly your age or different ages? Why?同年龄:my friends—my classmates—in school—no chance to know other people—we can only make friends with the people we know—common interests—common background of growing up—stay together everyday—do everything together—become part of our growing memory—develop trust—no generation gap—easily fast friends.不同年龄:older friends—more experience—make me more mature—learn from them—I can outgrow people of my own age younger friends—enjoy your power—tell them what to do —the decision making right is always in your hand—responsibility—growth—leadership —younger people want to learn from you—pressure-become betterQ: Do you usually see your friends during the week or at weekends? Why?We see each other almost everyday since we’re classmates, duh?We go to class together, we recess together, we go for independent study together.Over the weekend, we often do sports or go to the coffee shop or just hang out by the lake.Q: The last time you saw your friends, what did you do together?Play basketball—my friends—I met on the basketball court—so naturally—the most common thing we do is playing basketball—it’s boring?—not really—We enjoy it very much—it’s like our common language.Q: In what ways are your friends important to you?讲义51 页I can learn a lot from my friends, such as how to deal with difficulties, how to work with others, how to express myself clearly.True friends should listen to each other, give each other understandings and supports and respect the choices each makes.By making friends, I can communicate with different people at different time.Friends are one of the most important assets in life, they keep you from being lonely, having friends around is a blessing.。
剑桥雅思6第一套写作Task1真题+考官范文+参考译文+分析
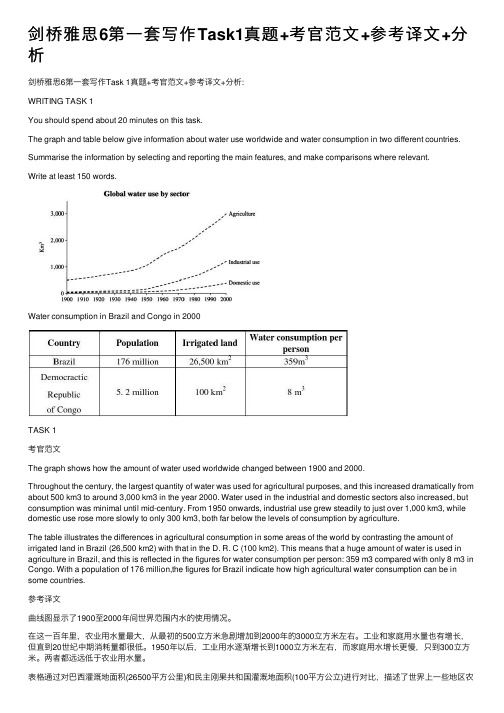
剑桥雅思6第⼀套写作Task1真题+考官范⽂+参考译⽂+分析剑桥雅思6第⼀套写作Task 1真题+考官范⽂+参考译⽂+分析:WRITING TASK 1You should spend about 20 minutes on this task.The graph and table below give information about water use worldwide and water consumption in two different countries. Summarise the information by selecting and reporting the main features, and make comparisons where relevant.Write at least 150 words.Water consumption in Brazil and Congo in 2000TASK 1考官范⽂The graph shows how the amount of water used worldwide changed between 1900 and 2000.Throughout the century, the largest quantity of water was used for agricultural purposes, and this increased dramatically from about 500 km3 to around 3,000 km3 in the year 2000. Water used in the industrial and domestic sectors also increased, but consumption was minimal until mid-century. From 1950 onwards, industrial use grew steadily to just over 1,000 km3, while domestic use rose more slowly to only 300 km3, both far below the levels of consumption by agriculture.The table illustrates the differences in agricultural consumption in some areas of the world by contrasting the amount of irrigated land in Brazil (26,500 km2) with that in the D. R. C (100 km2). This means that a huge amount of water is used in agriculture in Brazil, and this is reflected in the figures for water consumption per person: 359 m3 compared with only 8 m3 in Congo. With a population of 176 million,the figures for Brazil indicate how high agricultural water consumption can be in some countries.参考译⽂曲线图显⽰了1900⾄2000年间世界范围内⽔的使⽤情况。
雅思考官及翻译
雅思考官及翻译雅思考官范文及翻译我们都使用同一种货币,贸易和旅行将更方便。
你同意或不同意这个说法吗?单一货币会引起任何问题吗?下面是店铺整理的雅思英语作文,大家可以参考参考。
雅思作文范文【1】Trade and travel would be a lot easier with a single, global currency that we all use.Do you agree or disagree with this statement? Would a single currency cause any problems?Model Answer:It is clear to me that the idea of a single global currency is an excellent ideal to work towards. There can be no doubt that trade and travel would be vastly easier. On the other hand I believe that it would cause problems today.The benefits of a single currency can be seen with the use in Europe of the Euro. Whenever you are travelling between countries using the Euro, the problems of currency changing and exchange rates are history. Similarly business between countries using the Euros is so much easier; no more worrying about exchange rate risk and pricing. Everyone‛s money is the same. The same thing is true with the US dollar. Most countries do not use the US dollar but it is accepted in many places. There are many countries that you can travel to and just take US dollars to use.At present though a global currency would be impossible. Firstly most countries would not accept the idea. Secondly all countries are in different economic states. Some are economically very strong and some are in a state of collapse withinflation ruining the economy. Such countries could not be brought into a world currency as it would cause massive financial instability worldwide. So it is clear that a global currency would indeed cause some serious problems.So, in conclusion I see a global currency as a future ideal but it will not happen in my lifetime. It would make trade and travel much easier but the problems it would cause nowadays would be insurmountable.参考翻译我很清楚,一个单一的全球货币的想法是一个理想的工作。
剑桥雅思11test1写作真题范文解析
剑桥雅思11test1写作真题范文解析剑桥雅思是比较热门的雅思考生参考资料,为了帮助大家提高雅思作文分数,下面小编给大家带来剑桥雅思11test1写作真题范文解析。
剑桥雅思11test1写作task1范文+真题Writing Task 1You should spend about 20 minutes on this task.The charts below show the percentage of water used for different purposes in six areas of the world.Summarise the information by selecting and reporting the main features, and make comparisons where relevant.Write at least 150 words.1.图表类型:饼状图2.主体段时态:一般现在时3.题目要求:根据饼状图,描述世界上六个不同地方的三种水资源的使用的分布情况。
4.描述重点:①整体来看,agricultural use所占的比例较大;domestic use所占的比例较小。
②在industrial use方面,North America和Europe所占的比例较大,分别为48%和53%。
③在agricultural use方面,Central Asia所占的比例最大,为88%,其次分别是Africa (84%),South East Asia (81%),South America (71%),North America和Europe所占的比例相对略小,分别为39%和32%。
剑桥雅思11test1写作task2范文+真题Governments should spend money on railways rather than roads.To what extent do you agree or disagree with this statement?1.话题和题型分类政府类;同意不同意型2.题目分析政府是否应该将更多的资金投入放在铁路建设上而不是公路建设上3.思路提示A.同意增强对铁路系统的建设可以提高运输效率,降低运输成本铁路系统建设包含各种新型交通设施,比如高铁,空中列车等等,完善了公共交通系统,让人们有更多的更方便舒适的出行选择铁路系统建设得更完善可以一定程度减少公路的拥堵情况,提高公共交通效率,比如地铁。
剑桥雅思写作13test1真题解析及范文
剑桥雅思写作13test1真题解析及范文为了帮助大家能够多多参考一些有价值的雅思写作备考资料,下面小编给大家带来剑桥雅思写作13test1真题解析及范文,希望你们喜欢。
剑桥雅思写作13test1task1真题解析【题目+解题思路+范文】题目:WRITING TASK 1You should spend abo20 minutes on this task.The two maps below show road access to a city hospital in 2007 and in 2010.Summarise the information by selecting and reporting the main features, and make comparisons where relevant.Write at least 150 words.解题思路:1. 图表类型:地图题2. 主体段时态:一般过去时3. 题目要求:两幅地图分别展示了2007年和2010年去城市医院的通行道路。
选择一些主要的特点来描述并作出一些相关的对比。
4. 描述重点:1)2007年地图中的city hospital的东南风是staff and public car park,而在2010年这个地方变为了staff car park。
2)2007年Hospital Rd 两边的六个bus stops 没有了,在道路西边建造了较大的bus station,并有道路通往北边和南边两个环岛,分别与围绕医院的ring road 和city road相连。
范文:SAMPLE ANSWERThis is an answer written by a candidate who achieved a Band5.5 score. Here is the examiner’s comment:The candidate has identified all the key features (hospital, ring road, new public car park, staff car park and bus station in 2010) but the descriptions are not always accurate e.g. [two features that still remained. This two features are City Hospital and staff carpark] whereas the staff car park was formerly a car park for both staff and public, while the mention of the bus station is not developed. Organisation is clear, however, with some good use of cohesive devices [According to | Apart from | The further additional features], although there is an error in the use of reference pronouns [This/These two features]. The range of vocabulary is sufficient for the task [two different years | features | remained | additional], though [features] is over-used.A spelling error is noted in the second line [sourrounded] but this does not cause any difficulty for the reader; similarly, the use of [around-turn] can be easily understood as ‘roundabout’. There is a mix of simple and complex sentences, mainly used accurately.Two maps illustrate, the way to get to a city hospital of two different years (2007 and 2010).According to both maps, the main features which is city hospital is sourrounded by Ring Road. In these two maps, there have been two features that still remained. This two features are City Hospital and staff car park. Apart from these two features there are some features that shows on 2010 map but haven’t shown on 2007 map. The additional features that appear on the map of 2010 are public car parte which located on the east-side of the city hospital. The further additional features are two around-turn on the hospital Rd. which can lead to the bus station.Overall, there are two major features that never change on both 2007 and 2010 map. These features are city hospital andstaff car park. However, there are some additional features that appear on the map of 2010 but not on 2007. These features are public car park, bus station and two around-turns.剑桥雅思写作13test1task2真题解析【题目+解题思路+范文】题目:WRITING TASK 2You should spend about 40 minutes on this task.Write about the following topic:Living in a country where you have to speak a foreign language can cause serious social problems, as well as practical problems.To what extent do you agree or disagree with this statement?Give reasons for your answer and include any relevant examples from your own knowledge or experience.Write at least 250 words.解题思路:1. 话题和题型分类社会文化类单边讨论题型2. 题目分析居住在一个你不得不说外语的国家可能会导致严重的社交问题以及实际问题。
剑桥雅思11Test1Task1小作文范文及解析

剑桥雅思11Test1Task1小作文范文及解析剑桥雅思11出版时间虽不长,同学们争先恐后做题的热情却十分高涨,下面是雅思栏目为大家提供的剑桥雅思11Test1Task1小作文范文及解析,希望对大家备考有所帮助哦!剑桥雅思11Test1Task1小作文范文及解析The charts below show the percentage of water used for different purposes in six areas of the world.Summarise the information by selecting and reporting the main features, and make comparisons where relevant.导语:剑桥雅思小作文有史以来第一次出现6个饼对比的图,无疑对于整理信息和组织信息的难度加大.而该篇文章官方只给出了4.5分的参考范文,大部分烤鸭都没有办法把它充分利用起来.所以今天老师带领大家重新解析并完成该篇作文题目的全文写作过程.思路分析:(1) 切入点:6个饼6个地区,3个方面的用水情况.按照3个方面来描述会更容易一些.它们分别是工业用水,农业用水和家庭用水.(2) overview概述:对于北美和欧洲这两个发达国家集中的地区来说,3个部分的用水量分布模式相似.而其他四个欠发达地区总体模式差别不大.(3) 细节一:发达地区包括北美和欧洲,工业用水量都是占主导地位,约占总用水量的一半左右(分别是48%和53%),而紧随其后的都是农业用水,差不多占1/3的比重.相比之下,家庭用水量在这两个地区是最少的,只有13%和15%,但是这个比重也远远高出其他4个地区.(4) 细节二:显然,欠发达地区利用更多的水资源在农业方面,这个比重高达80%多,最少的也有71%(在南美洲)而最多的已经快占到90%的比重了.因此可想而知,其他两个方面的用水量的比重一定是比较小的.其中非洲,中亚和东南亚家庭用水量不超过总量的10%,而这些地区的工业用水量更少5%~7%,最高也就只有12%.相比之下南美在家庭用水方面还算比较多的地区,差不多20%的水资源用于人民生活,这个数据的一半被用于该地区的工业生产.(5) 总结:可见,发达地区的水资源更多地分配到经济类产品方面,包括工业和农业,而欠发达地区只在农业方面消耗相当大比重的淡水.文章结构:第一段——改写题目第二段——(2)概述第三段——(3)细节一第四段——(4)细节二第五段——(5)总结参考范文:The given six pie charts totally illustrate the using proportion of water for three different aspects in six regions worldwide.Generally in the relatively developed continents including North America and the Europe, the pattern of water-usage distribution shares great similarity, whereas other four underdeveloped regions indicates another type of smaller gaps.To be more specific, the water utilization of industry is both dominant in the two flourishing territory,approximately half of the whole (48% versus 53%), followed by that of agriculture, which take up marginally more than one-third of the total. In correspondence, the using percentage of water resource for residents is the least, with only 13% and 15% respectively, which still largely exceed the figures for the other four regions.Apparently, the developing areas invest far more water in agriculture, each having around 80%, and even the least, thefigure for South America still constitute 71% while the largest number even reach nearly 90%. Thereby it is obvious that the use of other two respects is bound to be less: no more than 10% domestic use in Central Asia and Southeast Asia. These areas even use less water in industry (merely 5%~7%, with the highest percentage12%). By contrast, people in South America utilize a higher proportion of water in domestic aspect, almost 20%, half of which is used in industrial part of the region.Overall, the water resource of developed areas is distributed more in economic products involving industry and agriculture, while developing ones only consume a considerable number of water in agriculture.(255 words)雅思作文栏目推荐阅读:。
最新雅思Task1写作范文

最新雅思Task1写作范文最新雅思Task1写作范文,地图题之村庄变迁,今天就给大家带来了最新雅思Task1写作范文,希望能够帮助到大家,下面就和大家分享,来欣赏一下吧。
最新雅思Task1写作范文地图题之村庄变迁The map shows the village of Chorleywood showing development between 1868 and 1994该地图展示村庄Chorleywood 在1868到1994年间的发展。
请作答。
雅思图表小作文地图型9分范文:The map shows the growth of a village called Chorleywood between 1868 and 1994.It is clear that the village grew as the transport infrastructure was improved. Four periods of development are shown on the map, and each of the populated areas is near to the main roads, the railway or the motorway.From 1868 to 1883, Chorleywood covered a small area next to one of the main roads. Chorleywood Park and Golf Course is nowlocated next to this original village area. The village grew along the main road to the south between 1883 and 1922, and in 1909 a railway line was built crossing this area from west to east. Chorleywood station is in this part of the village.The expansion of Chorleywood continued to the east and west alongside the railway line until 1970. At that time, a motorway was built to the east of the village, and from 1970 to 1994, further development of the village took place around motorway intersections with the railway and one of the main roads.(174) 附雅思小作文考官范文基本套路段一:话题重述段二:概括话题数据的主要特征或规律段三:详述特征规律一段四:详述特征规律二注意:simon考官主张雅思小作文无须总结!大家可留心这一点。
雅思task1范文
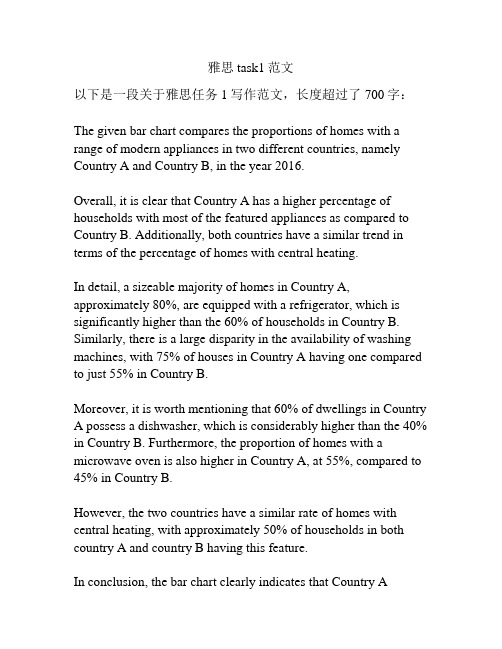
雅思task1范文以下是一段关于雅思任务1写作范文,长度超过了700字:The given bar chart compares the proportions of homes with a range of modern appliances in two different countries, namely Country A and Country B, in the year 2016.Overall, it is clear that Country A has a higher percentage of households with most of the featured appliances as compared to Country B. Additionally, both countries have a similar trend in terms of the percentage of homes with central heating.In detail, a sizeable majority of homes in Country A, approximately 80%, are equipped with a refrigerator, which is significantly higher than the 60% of households in Country B. Similarly, there is a large disparity in the availability of washing machines, with 75% of houses in Country A having one compared to just 55% in Country B.Moreover, it is worth mentioning that 60% of dwellings in Country A possess a dishwasher, which is considerably higher than the 40% in Country B. Furthermore, the proportion of homes with a microwave oven is also higher in Country A, at 55%, compared to 45% in Country B.However, the two countries have a similar rate of homes with central heating, with approximately 50% of households in both country A and country B having this feature.In conclusion, the bar chart clearly indicates that Country Aoutperforms Country B in terms of home appliances. This is evident from the higher percentage of households in Country A that have refrigerators, washing machines, dishwashers, and microwave ovens. Nevertheless, both countries have a similar trend in the percentage of homes with central heating.。
雅思c15t1范文

雅思c15t1范文Task 1.The bar chart illustrates the number of visitors to four different museums in a city in 2007 and 2009.Well, let's take a look at this bar chart. It's like a little snapshotof the museum going scene in this city over those two years.In 2007, the Museum of Natural History was the most popular of the four, with around 400,000 visitors. It was like the cool kid on the block that everyone wanted to visit. The Science Museum was next, with about 300,000 visitors. It was doing pretty well, but not as good as the Museum ofNatural History. Then there was the Art Museum, which had approximately 200,000 visitors. It seemed a bit more niche, you know, not everyone's cupof tea. And the least popular was the Local History Museum, with only about 100,000 visitors. It was like the shy, quiet cousin that not many people knew about.Now, fast forward to 2009. Things had changed a bit. The Museum of Natural History still held the top spot, but its numbers had dropped to around 350,000 visitors. Maybe some of the exhibits got a bit old fashioned or something. The Science Museum, on the other hand, had a bit of a boost and had around 320,000 visitors. It was like it had some new, shinyexhibits that attracted more people. The Art Museum also saw an increase, reaching about 250,000 visitors. Maybe there were some new, trendy art shows that got people interested. And the Local History Museum had a small increase too, up to about 120,000 visitors. It was starting to get a bit more recognition.Overall, it's interesting to see how the popularity of these museums changed over the two year period. Some went up, some went down, but theyall had their own little stories to tell.Task 2.Some people say that advertising has a positive influence on our lives. To what extent do you agree or disagree?Well, you know, advertising is like that chatty neighbor who won't stop talking but sometimes has some really interesting things to say. I kind of agree that advertising has a positive influence on our lives, but it's not all sunshine and roses.On the positive side, advertising can be really informative. It's likea little news bulletin for products and services. For example, when a new smartphone comes out, the ads tell us all about its cool features, like the amazing camera or the super fast processor. It helps us make more informed decisions when we're thinking about buying something. And it's not just about products. Advertising can also let us know about events in our area, like a cool music concert or a big food festival. It's like a little invitation to go out and have some fun.Advertising can also be a great source of inspiration. Have you ever seen those really creative ads on TV or online? They can make you think in new ways. They can be like little works of art that get your creativejuices flowing. And for small businesses, advertising is a way to get their name out there and compete with the big guys. It gives them a chance to show what they've got and maybe grow into something bigger.But, and here's the big but, advertising can also be a pain in the neck. There's so much of it everywhere! It's like being bombarded with a millionvoices all shouting at once. Some ads are really misleading too. They make products look way better than they actually are. You know, like those diet pills that promise you'll lose 10 pounds in a week but are really just a bunch of empty promises. And then there are those annoying pop up ads on the internet that seem to pop up at the most inconvenient times, like when you're in the middle of reading something really important.So, all in all, I think advertising has a positive influence to a certain extent. It has its good points, but we also need to be careful and not let it take over our lives or deceive us. It's like having a friend who sometimes gives great advice but other times just talks too much.。
- 1、下载文档前请自行甄别文档内容的完整性,平台不提供额外的编辑、内容补充、找答案等附加服务。
- 2、"仅部分预览"的文档,不可在线预览部分如存在完整性等问题,可反馈申请退款(可完整预览的文档不适用该条件!)。
- 3、如文档侵犯您的权益,请联系客服反馈,我们会尽快为您处理(人工客服工作时间:9:00-18:30)。
TEST2此图表显示在所列出的四个欧洲国家中,英国对图中所包含各种商品的花费最高。
对任一种商而言,英国人的相应花费都要比其它国人高出许多。
只在网球拍上,英国人和另一个国家意大利人消费相当。
相比之下,德国人消费额度最低。
在其对胶卷的消费上可见一斑,德国人远不如英国人对胶卷的花费。
德国只在两种商品上的消费高于法国,分别是网球拍和香水。
与此同时,法国和意大利两国居民大体上消费水平居中,平均额度也趋同。
具体来说,法国人对唱片和胶卷的消费要高于意大利人,然而对网球拍的消费不及意大利人。
意大利人对随身听的花费略高于法国,玩具消费则在两国人中等同。
数据清楚表明,欧洲国家之间的消费习惯存在巨大差异。
TEST3此数据表明了发展和发达国家对科教投入之间的差异。
就在校年数而言,我们可以看到在1980年,发达国家的人在校学习所用时间为8.5年,相比之下远远超过发展中国家的2.5年。
这一差距在1990年扩大,两个数据分别增至10.5年和3.5年。
在图表二中,趋势也是如此。
1980年至1990年,发达国家的科学家和技师的人数从每1000人中的55人升到85人,然而这一数据在发展中国家从12人升到20人。
最后,对研发项目的投资显示发达国家数据的不止翻了两番,从2000亿美元增长到4200亿美元,而发展中国家实际上有所削减,从750亿美元降至250亿美元。
总体上,我们可以看出两经济体之间不仅存在巨大差异,而且这一差异正在扩大。
IELTS4TEST1此表格对1999年澳大利亚不同类型的贫困家庭进行了分类。
平均来说,11%的家庭属于贫困家庭,其组成人数近200万。
然而,那些单亲或独身家庭几乎在此比例上翻了两番,分别为21%和19%。
夫妇家庭一般更为富有。
对丁克家庭而言,贫困比例(7%)较有孩子的家庭(12%)要低。
明显的是,那时对有孩子的家庭来说,其贫困比例要高于平均比例。
老年人的贫穷可能性较小,即使数据再一次倾向老年夫妇(仅4%),而不是单身老年家庭(6%)。
总体上,表格显示单身家庭和那些有孩子的家庭生活贫困的可能性比那些夫妇家庭要大。
TEST3此柱状图给出了1999年澳大利亚男性和女性所进修中学以上各个水平的教育文凭的信息。
我们可以很快看出,男女比例在不同教育水平之间存在着巨大差异。
最大的性别差异在于最低的中学以上水平,其中90%的男性获得了技校文凭,而女性只有10%的比例。
相比之下,更多的女性获得了高职高专文凭(70%),女性中学历达到本科水平(55%)的比例也略高于男性。
就更高水平的教育而言,拥有研究生文凭的男性显然比女性多(分别为70%和30%)。
此外,男性数量占博士生毕业的60%。
因此我们可以得出,更多的男性较女性来说获得了低等或高等教育文凭,而更多的女性拿到了本科水平。
尽管男性差异在本科阶段最小。
TEST2此曲线图显示了老龄人口在日本,瑞典和美国的增长,表明在三个国家中,老年人数的百分比预期于2024年都会增至大约25%。
1940年,日本65岁或以上的人口比例仅为5%,瑞典为大约7%,美国为9%。
然而,在1990前后,西方国家的此数据上升至大约15%,日本却降至仅仅2.5%。
随后上升至现今的大约5%。
即使在预期的百分比中有些波动,三个国家的老年人口比例将有可能在接下来的20年间继续上升。
2030年至2040年之间,预期在日本会有一个更快的增长。
同样,到那时人们认为三个国家的老年人口比例将会趋同。
TEST3此地图展示了为卡尔斯顿镇一个即将开业的超级市场所推荐的两个位置。
第一个潜在地址在小镇之外,并恰好坐落于通往欣登镇的要道旁边,此镇位于西北方12千米。
由于选址在郊区,因此能够提供大量停车位。
这对来自欣登镇和卡尔斯顿镇的购物者来说,驾车会非常便利。
也由于地址接近连接两镇到卡兰斯顿(东南方25千米)的铁路,大量的潜在顾客也将能够通过火车达到商场。
相比之下,第二个推荐地址坐落于小镇正中心,这对当地居民有优势。
理论上,商场应能够和周边城镇,包括布兰斯顿镇的道路或铁路连接,但因为中心地带是一个步行区,所以汽车将无法泊车,以至于交通困难。
总体上,对这个小镇来说,无论哪一个地址都适合。
然而对卡兰斯顿,欣登以及卡尔斯顿的消费者而言,镇外的选址(地址1)会更有优势。
IELTS6TEST1此曲线图显示了水在全世界范围内的使用量在1900年至2000年之间是怎样变化的。
一个世纪以来,最多的水用于农业,从初始的大约500立方千米大幅度增长至2000年的大约3000立方千米。
用在工业和国内方面的水量也有所增长,但直到世纪中,水消耗量一直非常少。
自1950年来,工业用水量稳步增长至刚过1000立方千米,而国内用水量以更慢的速度增长至仅300立方千米。
两者都远远低于工业水消耗水平。
此图表通过对比巴西(26500平方千米)和刚果民主共和国(100平方千米)的农耕地面积描述了农业耗水在世界上一些地区的差异。
这意味着在巴西,大量水被用于农业,这在人均用水量(359立方米)的数据上得以体现,相比之下,刚果只有8立方米。
拥有17.6千万人口的巴西,其数据证明农业用水在某些国家是如此之高。
TEST3第一张图展示了桑蚕的四个主要生命阶段。
首先,由母蛾产的卵子需要10天时间孵化成桑蚕幼虫,它们以桑叶为食。
这一阶段持续6周,直到幼蚕吐丝成茧围绕自己。
大概3周之后,发育成熟的蛾最终破茧成蝶,再次进入生命轮回。
蚕茧是制作丝布的原材料。
一旦被筛选出来,在沸水中煮过蚕茧能够在解旋阶段中分散开来。
每一个蚕茧的丝有300至900米长,这意味着蚕丝可被缠绕在一起。
经染色之后,就可以被用来织布。
总体上,这两个图展示了桑蚕的茧可以被用来制造丝布,步骤很简单。
TEST2此曲线图描述了自1979年至2004年欧洲一个特定国家的牛肉,羊肉,鸡肉和鱼肉消耗量的改变。
1979年,牛肉是这几种肉类中最受欢迎的食物,其人均消耗量每周大约达到225克。
羊肉和鸡肉的食用量(大约150克)相同,而鱼肉的食用量(仅仅50多克)则非常少。
然而,在这25年间,牛羊肉的消耗量大幅下跌分别至近100克和55克。
鱼肉的消耗量也有所下降,但幅度较非常小,仅仅跌至50克以下。
因此即使鱼肉一直是最不受欢迎的食物,其消耗量水平是最稳定的。
另一方面,鸡肉的消耗量呈上升趋势。
在1980年超过羊肉并在1989年超过牛肉。
到2004年,鸡肉人均每周消耗量飙升至近250克。
总体上,此曲线图显示了在整个时期鸡肉消耗量是怎样剧烈上升而其它食物受欢迎度则有所下降。
TEST4饼状图对1980年到2000年间在澳大利亚和法国的发电资源做出了比较。
在此期间,产电量几乎翻了一番,在澳大利亚从100个单位升至170个单位,在法国从90个单位升至180个单位。
1980年,澳大利亚使用煤作为发电的主要资源(50单位),其它电力产生于天然气,水力(分别生产20单位电力)以及石油(生产仅10单位电力)。
到2000年,煤成为超过75%的电力生产燃料,只有水力持续担当另一意义重大的供电资源,占大约20%。
相比之下,1980年法国仅25单位的电力产自于煤资源,和天然气相当。
其它的40单位电力很大程度上产自于石油和核能源,水力只提供了5单位电力。
然而到2000年,在澳大利亚根本没用到的核能源发展成为生产大约75%电力的主要资源,达到126个单位。
而煤和石油一共生产了仅50个单位。
其它资源不再重要。
总体上,很清楚的是到2000年这两个国家依赖的是不同的主要燃料资源:澳大利亚依赖于煤而法国依赖于核能源。
The chart shows that Britain, among the four European countries listed, has spent most heavily on the range of consumer goods included. In every case, British spending is considerably higher than that of other countries; only in the case of tennis racquets does another country, Italy, come close. In contrast, Germany is generally the lowest spender. This is most evident in photographic film, where Germany spends much less than Britain. Germany only spends more than another country, France, in two cases: tennis racquets and perfumes.Meanwhile, France and Italy generally maintain middle positions, averaging approximately similar spending overall. Specifically, France spends more on CDs and photographic film but less on tennis racquets than Ital y does. Italy’s spending on personal stereos is only marginally greater than that of France, while spending on toys is equal between the two.It is clear from the data given that there are some significant differences in spending habits within Europe.The charts below show the levels of participation in education and science in developing and industrialised countries in 1980 and 1990.The data shows the differences between developing and industrialised countries' participation in education and science.In terms of the number of years of schooling received, we see that the length of time people spend at school in industrialised countries was much greater at 8.5 years in 1980, compared to 2.5 years in developing countries. The gap was increased further in 1990 when the figures rose to 10.5 years and 3.5 years respectively.we can see a similar pattern in the second graph, which shows that the number of people working as scientists and technicians in industrialised countries increased from 55 to 85 per 1,000 people between 1980 and 1990, while the numrber in developing countries went from 12 to 20.Finally, the figures for spending on research and development show that industrialised countries more than double their spending, from$200bn to $420bn, whereas developing countries actually decreased theirs, from $75bn down to $25bn.Overall we can see that not only are there very large differences between the two economies but that these gaps are widening.剑4test1The table gives a breakdown of the different types of family who were living in poverty in Australia in 1999.On average, 11% of all households, comprising almost two million people, were in this position. However, those consisting of only one parent or a single adult had almost double this proportion of poor people, with 21% and 19% respectively.Couples generally tended to be better off, with lower poverty levels for couples without children (7%) than those with children (12%). It is noticeable that for both types of household with children, a higher than average proportion were living in poverty at this time.Older people were generally less likely to be poor, though once again the trend favoured elderly couples (only 4%) rather than single elderly people (6%).Overall the table suggests that households of single adults and those with children were more likely to be living in poverty than those consisting of couples.剑四test3:The chart gives information about post-school qualifications in terms of the different levels of further education reached by men and women in Australia in 1999.We can see immediately that there were substantial differences in the proportion of men and women at different levels. The biggest gender difference is at the lowest post-school level, where 90% of those who held a skilled vocational diploma were men, compared with only 10% of women. By contrast, more women held undergraduate diplomas (70%) and marginally more women reached degree level (55%).At the higher levels of education, men with postgraduate diplomas clearly outnumbered their female counterparts (70% and 30%, respectively), and also constituted 60% of Master’s gradu ates.Thus we can see that more men than women hold qualifications at the lower and higher levels of education, while more women reach undergraduate diploma level than men. The gender difference is smallest at the level of Bachelor’s degree, however.The graph shows the increase in the ageing population in Japan, Sweden and the USA. It indicates that the percentage of elderly people in all three countries is expected to increase to almost 25% of the respective populations by the year 2040.In 1940 the proportion of people aged 65 or more stood at only 5% in Japan, approximately 7% in Sweden and 9% in the US. However, while the figures for the Western countries grew to about 15% in around 1990, the figure for Japan dipped to only 2.5% for much of this period, before rising to almost 5% again at the present time.In spite of some fluctuation in the expected percentages, the proportion of older people will probably continue to increase in the next two decades in the three countries. A more dramatic rise is predicted between 2030 and 2040 in Japan, by which time it is thought that the proportion of elderly people will be similar in the three countries.剑5 test3The map shows two proposed locations for a new supermarket for the town of Garlsdon.The first potential location(S1) is outside the town itself, and is sited just off the main road to the town of Hindon, lying 12 kms to the north-west. This site is in the countryside and so would be able to accommodate a lot of car parking. This would make it accessible to shoppers from both Hindon and Garlsdon who could travel by car. As it is also close to the railway line linking the two towns to Gransdon(25 km to the south-east), and a potentially large number of shoppers would be also to travel by train.In contrast, the suggested location, S2, is right in the town centre, which would be good for local residents. Theoretically the store could be accessed by road or rail from the surrounding towns, including Bransdon, but as the central area is ano-traffic zone, cars would be unable to park and access would be difficult. Overall, neither site is appropriate for all the towns, but for customers in Cransdon, Hindon and Garlsdon, the out-of-town site (S1) would probably offer more advantages.The graph shows how the amount of water used worldwide changed between 1900 and 2000.Throughout the century, The largest quantity of the global water used for agricultural purpose and this increased dramatically from about 500 km³ to around 3000 km³ in the year 2000.Water used in the industrial and domestic sectors also increased, but consumption was minimal until mid-century. From 1950 onwards, industrial use grew steadily to just over 1000 km³, while domestic use rose more slowly to only 300 km³,both far below the levels of consumption by agriculture.The table illustrates the differences in agricultural consumption in some areas of the world by contrasting the amount of irrigated land in Brazil(26500㎞²)with that in the D.R.C(100㎞²). This means that a huge amount of water is used in agriculture in Brazil, and this is reflected in the figures for water consumption per person:359 m³ compared with only 8 m³in the Congo. With a population of 176 million,the figures for Brazil indicate how high agricultural water consumption can be in some countries.剑6test3The first diagram shows that there are four main stages in the life of the silk worm.First of all, eggs are produced by the moth and it takes ten days for each egg to become a silkworm larva that feeds on mulberry leaves. This stage lasts for up to six weeks until the larva produces a cocoon of silk thread around itself. After a period of about three weeks, the adult moths eventually emerge from these cocoons and the life cycle begins again.The cocoons are the raw material used for the production of silk cloth. Once selected, they are boiled in water and the threads can be separated in the unwinding stage. Each thread is between 300 and 900 metres long, which means they can be twisted together, dyed and then used to produce cloth in the weaving stage.Overall, the diagrams show that the cocoon stage of the silkworm can be used to produce silk cloth through a very simple process.剑7test2The graph illustrates changes in the amounts of beef, lamp, chicken, and, fish consumed in a particular European country between 1979 and 2004.In 1979 beef was by far the most popular of these foods, with about 225 grams consumed per person per week. Lamp and chicken were eaten in similar quantities (around 150 grams), while much less fish was consumed (just over 50 grams) However, during this 25-year period the consumption of beef and lamp fell dramatically to approximately 100 grams and 55 grams respectively. The consumption of fish also declined, but much less significantly to just below 50 grams,so although it remained the least popular food, consumption levels to were the stable.The consumption of chicken, in the other hand, showed an upward trend, overtaking that of lamb in 1980 and that of beef in 1989. By 2004 it had soared to almost 250 grams per person per week.Overall, the graph shows the consumption of chicken increased drammatically while the popularity of these other foods decreased over the period.剑7test4The charts compare the source of electricity in Australia and France in the years 1980 and 2000. Between these years electricity production almost doubled, rising from 100 units to 170 in Australia, and from 90 to 180 units in France.In 1980 Australia used coal as the main electricity source(50 units) and the remainder was produced from natural gas, hydro power(each producing 20 units) and oil(which produced only 10 units). By 2000, coal had become the fuel for more than 75% of electricity produced and only hydro continued to be another significant source supplying approximately 20%.In contrast, France used coal as a source for only 25 units of electricity in 1980, which was matched by natural gas. The remaining 40 units were produced largely from oil and nuclear power, with hydro contributing only 5 units. But by 2000 nuclear power, which was not used at all in Australia, had developed into the main source, producing almost 75% of electricity, at 126 units, while coal and together produced only 50 units. Other sources were no longer significant.Overall, it is clear that by 2000 these two countries relied on different principal fuel sources: Australia relied on coal and France on nuclear power.。