应用统计学_卡方检验
医学统计学6卡方检验

进行拟合优度 x2 检验,一般要求有足够的样本含量,理论频数不小于 5 。
1
理论频数小于 5 时,需要合并计算。
2
注意事项
2
独立样本四格表的x2检验
3
行×列的x2检验
1检验
4
配对设计分类资料的x2检验
x2检验
四格表的卡方检验,也是通过计算代表实际频数A与理论频数T之间的吻合程度的卡方值来进行检验的。
行×列卡方检验计算公式
n为总例数;R和C分别为行数和列数;A为第R行、第C列位置上的实际频数;nR为实际频数所在行的行合计;nC为实际频数所在列的列合计。
STEP4
STEP3
STEP2
STEP1
SPSS软件操作
定义变量
输入原始数据
定义频数
选择数据→加权个案 频数→加权个案(频数变量)
输出2种相关系数: pearson相关系数 spearman相关系数
列联系数:分析行与列之间的关联程度
03
04
02
01
第4步:x2检验(2)
选择统计量按钮
在交叉表:统计量对话框:勾上卡方
第4步:x2检验(3)
选择单元格按钮 在交叉表:单元显示对话框:勾上观察值、百分比:行、列
第5步:结果解读(1)
如果出现上述情况,可以考虑:增大样本量;根据专业知识合理地合并相邻的组别;删除理论数太小的行列 ;改用其它方法分析,例如确切概率法或似然比卡方检验。
02
同四格表资料一样,R×C表的卡方分布是建立在大样本的假定上的,要求总例数不可过少,不能有1/5以上的格子理论频数小于5,且不能有一个格子的理论频数小于1。
01
行×列表卡方检验注意事项
行×列表卡方检验注意事项
卡方检验在统计学中的应用

公式
根据不同的理论分布,拟合优度 卡方检验的公式也有所不同,但 基本思路是计算样本数据与理论 分布之间的差异程度。
应用场景
例如,判断某地区居民的身高是 否符合正态分布。
03 卡方检验在统计学中的应 用场景
分类变量间关系的研究
研究两个分类变量之间的关系,判断它们 是否独立。通过卡方检验可以比较观测频 数与期望频数的差异,从而判断两个分类 变量之间是否存在关联或因果关系。
公式
与独立性卡方检验类似,但计算的是同一观察对象在不同条件下的实际观测频数与期望频数的差异程度。
应用场景
例如,判断某药物在不同剂量下的疗效是否一致。
拟合优度卡方检验
定义
拟合优度卡方检验用于检验一个 样本数据是否符合某个理论分布 或模型。假设有一组样本数据, 拟合优度卡方检验的目的是判断 这组数据是否符合正态分布、二 项分布等理论分布。
数据来源
市场调查中的消费者数据,包括消费者的年龄、性别、收 入等信息以及他们对某一产品的评价和偏好。
分析方法
使用卡方检验分析不同消费者群体对同一产品的偏好程度 ,判断是否存在显著性差异。
结果解释
如果卡方检验结果显著,说明不同消费者群体对同一产品 的偏好程度存在显著差异;如果结果不显著,则说明消费 者偏好较为接近。
它通过计算观测频数与期望频 数之间的卡方值,评估两者之 间的差异是否具有统计学显著 性。
卡方检验常用于分类数据的分 析,如计数数据和比例数据。
卡方检验的基本思想
1 2
基于假设检验原理
卡方检验基于假设检验的基本思想,首先提出原 假设和备择假设,然后通过样本数据对原假设进 行检验。
比较实际观测与期望值
要点二
自由度
《卡方检验正式》课件

卡方检验的结果可以直接解释为实际意义 ,例如,如果卡方值较大,则说明观察频 数与期望频数存在显著差异。
缺点
对数据要求高
卡方检验要求数据量较大,且各分类的期望频数不能太小,否则可能 导致结果不准确。
对离群值敏感
卡方检验对离群值比较敏感,离群值可能会对结果产生较大的影响。
无法处理缺失值
卡方检验无法处理含有缺失值的数据,如果数据中存在缺失值,需要 进行适当的处理。
案例二:市场研究中的卡方检验
总结词
市场研究中,卡方检验用于评估不同市 场细分或产品特征与消费者行为之间的 关联。
VS
详细描述
在市场研究中,卡方检验可以帮助研究者 了解消费者对不同品牌、产品或服务的偏 好。例如,通过比较不同年龄段消费者对 某品牌的选择比例,企业可以更好地制定 市场策略和产品定位。
案例三:社会调查中的卡方检验
小,表示两者之间的差异越小。通常根据卡方值的概率水平来判断差异
是否具有统计学显著性。
02
卡方检验的步骤
建立假设
假设1
观察频数与期望频数无显著差异
假设2
观察频数与期望频数有显著差异
收集数据
从样本数据中获取观察频数 确定期望频数,可以使用理论值或预期频数
制作交叉表
将收集到的数据整理成二维表格形式,行和列分别表示分类变量
卡方检验的基本思想
01
基于假设检验原理
卡方检验基于假设检验的原理,通过构建原假设和备择假设,利用观测
频数与期望频数的差异来评估原假设是否成立。
02
比较实际观测频数与期望频数
卡方检验的核心是比较实际观测频数与期望频数,通过卡方值的大小来
评估两者之间的差异程度。
03
统计学-第十二章卡方检验

避免误用与误判的建议
充分理解卡方检验的原理 和适用条件,避免在不满 足条件的情况下使用。
结合专业知识判断观察频数与 期望频数的差异是否具有实际 意义,避免过度解读统计结果 。
ABCD
在进行卡方检验前,对数据 进行充分的描述性统计分析 ,了解数据的分布特点。
统计学-第十二章卡方检验
目 录
• 第十二章概述 • 卡方检验的基本原理 • 卡方检验的应用场景 • 卡方检验的步骤与实现 • 卡方检验的优缺点及注意事项 • 实例分析与操作演示
01
第十二章概述
章节内容与目标
01
掌握卡方检验的基本原理和假设检验流程
02
了解卡方检验在不同类型数据中的应用
能够运用卡方检验进行实际问题的分析和解决
THANK YOU
卡方分布及其性质
卡方分布的定义
若$n$个相互独立的随机变量$X_1, X_2, ldots, X_n$均服从标准正态分布$N(0,1)$,则它们的 平方和$X^2 = sum_{i=1}^{n}X_i^2$服从自 由度为$n$的卡方分布,记为$chi^2(n)$。
期望和方差
$E(X) = n$,$D(X) = 2n$,其中$X sim chi^2(n)$。
运行分析
点击“确定”按钮,运行卡方检验分 析。
结果解读与报告撰写
结果解读
根据卡方检验的结果,判断各组分类数据的 分布是否存在差异,以及差异的显著性水平 。
报告撰写
将分析结果以文字、表格和图表的形式呈现 出来,包括研究目的、数据收集与整理过程 、卡方检验结果和结论等部分。同时,需要
注意报告的规范性和可读性。
统计学卡方检验

根据分析结果,为患者提供个体化的干预措施,提高生存质量。
06
卡方检验注意事项及局限 性讨论
样本量要求及抽样方法选择
样本量要求
卡方检验对样本量有一定的要求,通常建议每个单元格的期望频数不小于5,以确保检验结果的稳定性和可靠性 。当样本量不足时,可能会导致检验效能降低,增加第二类错误的概率。
抽样方法选择
在进行卡方检验时,应选择合适的抽样方法。简单随机抽样是最常用的方法,但在某些情况下,如分层抽样或整 群抽样可能更适合。选择合适的抽样方法有助于提高检验的准确性和可靠性。
期望频数过低时处理策略
合并类别
当某个单元格的期望频数过低时,可以考虑 合并相邻的类别,以增加期望频数。合并类 别时应注意保持类别的逻辑性和实际意义。
适用范围及条件
适用范围
卡方检验适用于多个分类变量之间的独立性或相关性检验,如医学、社会科学等领域的调查研究。
条件
使用卡方检验需要满足一些前提条件,如样本量足够大、每个单元格的期望频数不宜过小等。此外, 对于有序分类变量或存在空单元格的情况,需要采用相应的处理方法或选择其他适合的统计方法。
02
卡方检验方法
统计学卡方检验
目录
• 卡方检验基本概念 • 卡方检验方法 • 数据准备与预处理 • 卡方检验实施步骤 • 卡方检验在医学领域应用举例 • 卡方检验注意事项及局限性讨论
01
卡方检验基本概念
定义与原理
01
02
定义
原理
卡方检验是一种基于卡方分布的假设检验方法,用于推断两个或多个 分类变量之间是否独立或相关。
确定分组界限
在确定分组界限时,可以采用等距分组、等频分组或 基于数据分布的分组方法。选择合适的分组界限有助 于保持各组之间的均衡性,减少信息损失。
卡方检验的原理与应用
卡方检验的原理与应用卡方检验是一种常用的统计方法,用于判断两个或多个分类变量之间是否存在关联关系。
它的原理基于统计学中的卡方分布和假设检验,通过计算实际观察值和理论预期值之间的差异来评估变量之间的独立性。
本文将介绍卡方检验的原理及其应用,并通过实例加深对该方法的理解。
一、卡方检验的原理在介绍卡方检验的原理之前,需要先了解两个重要的概念:观察频数和理论频数。
1. 观察频数(Observed Frequencies):指实际观察到的变量组合发生的次数。
2. 理论频数(Expected Frequencies):指在变量之间不存在关联的情况下,根据总体比例和样本数计算出的预期次数。
基于观察频数和理论频数,卡方检验的原理可以概括为以下步骤:步骤一:建立假设。
假设零(H0):变量之间不存在关联。
假设备选(H1):变量之间存在关联。
步骤二:计算卡方统计量。
卡方统计量计算公式为:其中,O为观察频数,E为理论频数。
卡方统计量越大,观察频数与理论频数之间的差异就越大。
步骤三:确定自由度。
自由度的计算公式为:自由度 = (行数-1) * (列数-1)。
在卡方检验中,自由度用于确定卡方统计量的分布情况。
步骤四:计算P值。
根据卡方统计量的分布情况,可以计算出对应的P值。
P值表示在零假设成立的情况下,出现观察到的差异或更大差异的概率。
步骤五:做出决策。
根据事先设定的显著性水平(通常为0.05),比较所计算得到的P值和显著性水平的大小。
若P值小于显著性水平,则拒绝零假设,认为变量之间存在关联;若P值大于显著性水平,则接受零假设,认为变量之间不存在关联。
二、卡方检验的应用卡方检验在各个领域都有广泛的应用。
下面将分别以医学研究和市场调研为例,介绍卡方检验在实际问题中的应用。
1. 医学研究中的应用假设研究人员通过对某种疾病的患者进行观察,并记录了是否接受治疗和治疗效果的数据。
他们想要判断接受治疗与否与治疗效果之间是否存在关联。
以“是否接受治疗”和“治疗效果”为两个分类变量,可以构建一个2x2的列联表。
卡方检验在统计分析中的应用研究
卡方检验在统计分析中的应用研究随着科学技术和社会发展的进步,人们在处理数据方面越来越重视统计分析方法的应用。
其中,卡方检验是一种常见的统计分析方法,它被广泛应用于医学、社会科学、生物学等领域。
在本文中,我们将探讨卡方检验在统计分析中的应用研究。
一、卡方检验的定义卡方检验是用来检验样本和总体、样本之间、样本分类的偏差程度是否具有统计学意义的一种方法。
它的基本思想是计算实际观测值和理论值之间的差异程度,并将其转化为统计指标。
卡方检验属于非参数检验方法,即它不依赖于参数的具体值,而是基于一定的假设,对样本进行比较。
二、卡方检验的应用1. 医学领域在医学领域,卡方检验被广泛用于疾病的流行病学研究。
例如,对于某种疾病,我们可以通过卡方检验来判断该疾病在不同年龄段、不同性别、不同地域、不同职业等因素上的分布情况,从而进一步探讨其病因、预防对策等方面的问题。
2. 社会科学领域在社会科学领域,卡方检验被广泛用于研究人群调查数据。
例如,对于某个调查,我们可以通过卡方检验来比较不同群体的答案分布情况,从而发现不同人群的人口、社会心态等方面的差异。
3. 生物学领域在生物学领域,卡方检验被广泛用于遗传学分析。
例如,我们可以通过卡方检验来检验一种基因在某个群体中的遗传型分布是否符合硬性规律,从而确定遗传模式、评估遗传风险等方面的问题。
三、卡方检验的局限性尽管卡方检验在统计分析中拥有广泛的应用,但它也存在一些局限性。
其中最主要的就是对样本量的要求较高。
如果样本量过小,那么检验结果的准确性就会受到影响,从而不具有可靠性。
此外,卡方检验基于假设前提,如果假设前提不准确,那么检验结果也会失去可靠性。
四、结语卡方检验是一种重要的统计分析方法,在医学、社会科学、生物学等领域都有着广泛的应用。
通过卡方检验,我们可以了解样本的分布情况,分析样本之间的关联性,进一步探讨其背后的原因和意义。
当然,卡方检验也存在一些局限性,我们需要在实际应用中合理运用,以达到更好的研究效果。
卡方检验的适用范围与局限性
卡方检验的适用范围与局限性在统计学中,卡方检验是一种常用的假设检验方法,用于确定观察数据与期望数据之间的差异性。
它适用于离散型数据,常被用于判断两个变量之间是否存在相关性或者进行分类变量的比较。
然而,卡方检验也有其适用范围和局限性。
本文将对卡方检验的适用范围和局限性进行论述。
一、卡方检验的适用范围卡方检验适用于离散型数据的分析,常被应用于以下几个方面:1. 拟合优度检验拟合优度检验用于检验观察频数与理论频数之间的差异,判断观察数据是否符合某个理论模型的分布。
例如,在医学研究中,可以使用卡方检验来判断某种疾病的发病率是否符合预期分布。
2. 相关性分析卡方检验可用于判断两个分类变量之间是否存在相关性。
通过计算卡方值和查表得到显著性水平,来判断两个变量之间的关系是否达到统计学上的显著程度。
3. 分类比较卡方检验可以用于比较两个或多个独立样本的分类比例是否有差异。
例如,在市场调查中,可以使用卡方检验来比较不同性别人群对某一产品的喜好程度是否存在显著差异。
二、卡方检验的局限性除了适用范围之外,卡方检验也存在一定的局限性,需要在应用中注意以下几点:1. 样本容量卡方检验对样本容量有一定的要求,一般要求每个格子中的期望频数至少为5。
如果样本容量过小,可能导致卡方检验的结果不稳定或不准确。
2. 数据类型卡方检验只适用于离散型数据,对于连续型数据不能直接应用。
如果面对连续型数据,需要进行离散化处理后再进行卡方检验。
3. 数据独立性卡方检验假设各个样本之间相互独立。
如果样本之间存在相关性或者重复观测,则可能导致卡方检验的结果失真。
4. 检验的局限性卡方检验只能判断观察数据和期望数据之间是否存在差异,但无法确定具体是哪个格子导致了差异。
因此,无法提供变量之间的因果关系。
结论卡方检验作为一种常用的假设检验方法,在统计学中具有广泛的应用。
然而,我们在进行卡方检验时需要考虑适用范围和局限性,以确保结果的准确性和可靠性。
同时,应结合实际问题和数据特点,选择合适的统计方法进行分析,以获得更具说服力的结论。
医学统计学-卡方检验

卡方检验是一种常用的统计方法,用于比较观察值和期望值之间的差异。它 在医学研究中有着广泛的应用,可以帮助我们验证假设、推断总体特征以及 分析类别变量的相关性。
卡方检验的定义和原理
卡方检验是一种基于卡方分布的统计检验方法。它基于观察值与期望值之间 的差异来判断样本数据与理论分布的拟合程度。
卡方检验的局限性和注意事项
• 卡方检验只能验证分类变量之间的关联性,不能验证因果关系。 • 卡方检验对样本足够大和数据分类合理的要求比较严格。 • 卡方检验结果受样本选择和观察误差的影响,需要谨慎解释。 • 在进行卡方检验前,需要对数据进行充分的清洗和准备。
结论和要点
卡方检验是一种常用的统计方法
卡方检验的应用领域
医学研究
卡方检验可以用来分析疾病的发生与某个因素之间的关联性,如吸烟与肺癌。
社会科学
卡方检验可以用来研究不同人群之间的行模式和态度偏好,如性别与政治观点。
市场调研
卡方检验可以用来分析消费者的购买偏好和市场细分,如年龄与产品偏好。
卡方检验的假设和前提条件
1 独立性假设
卡方检验基于观察值和期望值之间的差异来验证两个变量之间是否存在独立性。
它可以帮助我们验证假设、推断总体特征以 及分析类别变量的相关性。
结果解读和意义
卡方检验的结果可以帮助我们了解变量之间 的关系,并为决策提供依据。
应用广泛
卡方检验在医学研究、社会科学和市场调研 等领域都有着重要的应用。
局限性和注意事项
卡方检验有一定的局限性,需要注意样本大 小和数据分类的合理性。
4
比较卡方值和临界值
判断卡方值是否大于临界值,从而做出关于拒绝或接受原假设的决策。
卡方检验的结果解读和意义
《卡方检验》课件

制作交叉表
确定交叉表的行列变量
根据研究目的和内容,选择合适的行列变量,构建交叉表。
制作交叉表
将分组后的数据按照行列变量制作成交叉表,以便于进行卡 方检验。
计算理论频数
确定期望频数
根据交叉表中的数据,结合各组 的概率计算期望频数。
计算理论频数
根据期望频数和实际频数计算理 论频数,为后续的卡方检验提供 依据。
计算卡方值
计算卡方值
使用卡方检验的公式计算卡方值,该 值反映了实际频数与理论频数的差异 程度。
自由度的确定
在计算卡方值时,需要确定自由度, 自由度通常为行数与列数的减一。
显著性水平的确定
选择显著性水平
显著性水平是衡量卡方值是否显著的指标,通常选择0.05或0.01作为显著性水 平。
判断显著性
根据卡方值和自由度,结合显著性水平判断卡方检验的结果是否显著,从而得 出结论。
3.84、6.63等),可以确定观测频数与期望频数之间的差异是否具有统
计学显著性。
02
卡方检验的步骤
收集数据
确定研究目的
制定调查问卷或收集程序
在开始收集数据之前,需要明确研究 的目的和假设,以便有针对性地收集 相关数据。
根据研究目的和内容,制定合适的调 查问卷或建立数据收集程序,确保数 据的完整性和准确性。
详细描述
例如,在市场调研中,我们可以通过卡方检验来分析不同年龄段、性别、职业等 人群对于某产品的态度或购买意愿是否有显著差异,从而为产品定位和营销策略 提供依据。
实际案例二:医学研究中的应用
总结词
在医学研究中,卡方检验常用于病例 对照研究和队列研究中的分类变量关 联性分析。
详细描述
例如,在病例对照研究中,我们可以 通过卡方检验来比较病例组和对照组 在某些基因型、生活方式或暴露因素 上的分布是否有统计学差异,从而探 讨病因或危险因素。
医学统计学卡方检验 t检验使用场景例题
医学统计学中的卡方检验和t检验是两种常见的假设检验方法,它们在医学研究和临床实践中具有重要的应用价值。
下面我们将分别介绍这两种方法的使用场景,并通过实际例题加以说明。
一、卡方检验的使用场景1. 适用于分类型数据的比较分析在医学研究中,经常需要对不同的类别进行比较,例如治疗组和对照组、男性患者和女性患者等。
此时可以使用卡方检验来判断两个或多个分类变量之间是否存在相关性或差异性。
2. 适用于观察数据和期望数据的拟合程度检验在一些医学实验中,我们会根据已知的理论分布假设,计算出期望的数据分布情况。
然后通过卡方检验来判断实际观察到的数据与期望数据之间的拟合程度。
二、t检验的使用场景1. 适用于两组数值型数据的均值比较在医学实验或临床研究中,我们常常需要比较两组数值型数据的均值,例如药物治疗组和安慰剂对照组的疗效比较。
此时可以使用t检验来判断两组数据的均值是否有显著差异。
2. 适用于独立样本和配对样本的比较根据样本数据的不同特点,t检验可以分为独立样本t检验和配对样本t检验。
独立样本t检验适用于两组数据之间的比较,而配对样本t检验适用于同一组数据在不同条件下的比较。
三、卡方检验和t检验的实际例题下面我们通过具体的实例来进一步说明卡方检验和t检验的使用方法。
例题一:卡方检验某医院对两种不同治疗方案的疗效进行比较,收集了100例患者的数据,其中治疗方案A的疗效有效的有60例,无效的有40例;治疗方案B的疗效有效的有45例,无效的有55例。
现在需要使用卡方检验来判断两种治疗方案的疗效是否存在显著差异。
解析:(1)建立假设H0:两种治疗方案的疗效没有显著差异H1:两种治疗方案的疗效存在显著差异(2)计算卡方值根据实际观察到的数据和期望数据,计算出卡方值,并查找卡方分布表得到显著性水平。
(3)判断结果根据计算得到的卡方值和显著性水平,判断是否拒绝原假设,从而得出结论。
例题二:t检验某药厂新研发了一种降压药,为了评价其降压效果,随机选择了30名患者接受治疗,并记录治疗前后的收缩压数据。
应用统计学_卡方检验

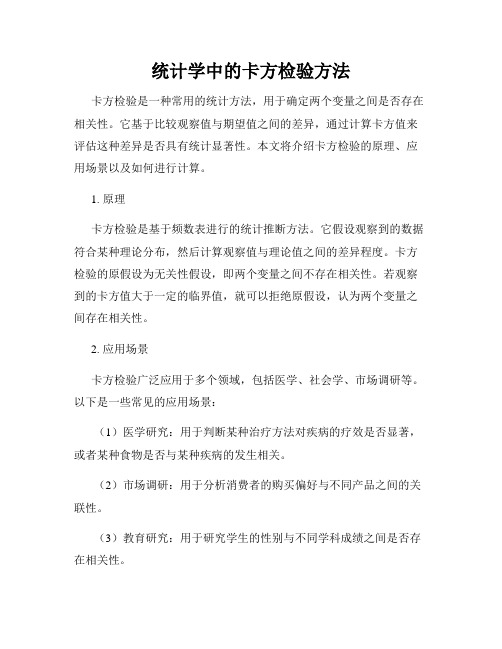
Example: We test the null hypothesis that consumers in the target population have no preference for any of three colours of packaging.
Main display colour Observed N 26 37 27 90 Expected N 30.0 30.0 30.0 Residual -4.0 7.0 -3.0
(39 25) 2 3 25 2 3 12 . 08
2
(16 25)2 (20 25)2 (25 25)2 25 25 25
Obtain the critical value of chi square
Critical 23 = 7.82. Obtain the critical value at 5% significance level at 3 d.f., (Table E4, page 742, Berenson et.al. 2013)
Under the null hypothesis We expect 25 consumers to nominate glass, 25 to nominate plastic, 25 to nominate steel and 25 to nominate aluminium
These are the expected frequencies, Ei.
This week lecture will cover...
Analysing categorical data (nominal) Chi-square test of differences between proportions Chi-square test of independence
统计推断中卡方检验的应用范围与局限性
统计推断中卡方检验的应用范围与局限性统计学是一门研究数据的收集、分析和解释的学科。
在统计学中,推断统计学是一种通过对样本数据进行分析来推断总体特征的方法。
而卡方检验作为推断统计学中一种常用的假设检验方法,广泛应用于各种研究领域。
本文将探讨卡方检验的应用范围和其所面临的局限性。
一、卡方检验的应用范围卡方检验适用于以下几种情况:1. 分类变量的分析卡方检验主要用于分析分类变量之间是否存在相关性。
例如,在医学研究中,可以使用卡方检验来确定某种疾病是否与某种基因型相关。
2. 频数统计卡方检验适用于对数据进行频数统计的情况。
例如,市场调查中,可以使用卡方检验来判断不同年龄段消费者的购买偏好是否存在差异。
3. 检验统计假设卡方检验还可以用于检验统计假设。
例如,在教育研究中,可以使用卡方检验来验证某种教学方法是否对学生的成绩有显著影响。
二、卡方检验的局限性尽管卡方检验在很多情况下是非常有用的,但它也存在一些局限性:1. 样本容量要求卡方检验对样本容量有一定的要求。
当样本容量较小时,卡方检验的结果可能不够可靠。
因此,在进行卡方检验时,需要确保样本容量充分大。
2. 变量独立性要求卡方检验假设变量之间相互独立。
如果变量之间存在相关性,卡方检验的结果可能会产生偏差。
因此,在应用卡方检验时,需要确保变量之间相互独立。
3. 只适用于分类数据卡方检验只适用于分类数据,对于连续数据无法直接应用。
如果需要对连续数据进行分析,可以考虑使用其他统计方法,如t检验或方差分析。
4. 数据分布要求卡方检验假设数据满足特定的分布要求,即期望频数大于5。
如果观察频数小于5,卡方检验的结果可能不准确。
在这种情况下,可以考虑使用精确的卡方检验或者其他非参数方法。
总结:卡方检验作为一种常用的假设检验方法,在统计推断中有着广泛的应用。
它适用于分类变量分析、频数统计和检验统计假设等情况。
然而,卡方检验也存在样本容量要求、变量独立性要求、分类数据限制和数据分布要求等局限性。
《医学统计课件:卡方检验应用》

I. 前言 A. 课程介绍 B. 统计学基础概述 C. 本课程的目的和意义
卡方检验基础
ห้องสมุดไป่ตู้
卡方统计量概述
卡方检验是一种常用的统计方法,用于判断 观察频数与期望频数之间的差异。
自由度解释
自由度是指在进行统计检验时可以自由变化 的数据的个数。
卡方分布
卡方统计量的分布是自由度的函数,对于不 同的自由度有不同的分布。
假设检验
卡方检验基于假设检验的思想,通过对比观 察频数和期望频数来判断样本是否来自同一 总体。
卡方检验应用
1
实验设计与数据收集
合理的实验设计和数据收集是进行卡
单因素卡方检验
2
方检验的关键步骤。
单因素卡方检验用于比较不同组别之
间的差异,常用于医学研究和质量控
制。
3
双因素卡方检验
双因素卡方检验用于研究两个或多个
卡方检验的局限性和改进
A. 局限性解释
卡方检验具有一定的局限性, 特别是在样本量小或数据不 符合假设的情况下。
B. 结果误判的可能 性
卡方检验结果的误判可能会 产生错误的结论,需要谨慎 解读。
C. 如何提高检验效 度和效力
通过合理的实验设计、样本 选择和统计方法选择等方式 来提高卡方检验的效度和效 力。
C. 数据整理
将分析结果整理并合理呈现 是进行卡方检验后续工作的 一部分。
结果解读与应用
结果如何解释
对卡方检验结果的解释需要考 虑实际情况,并结合其他知识 进行分析。
统计分析结果的意义
卡方检验的统计显著性结果对 研究结论的科学性和可信度具 有重要意义。
卡方检验例题与题解
通过练习例题和深入理解题解, 能更好地掌握卡方检验的应用。
统计学中的卡方检验
统计学中的卡方检验卡方检验是一种常用的统计学方法,用于判断两个或多个变量之间是否存在显著性差异。
本文将介绍卡方检验的原理、应用场景以及实际操作步骤。
一、卡方检验原理卡方检验基于观察数据与理论数据之间的差异来判断变量之间的相关性。
它通过计算卡方值来衡量观察值与理论值之间的偏离程度,进而判断差异是否具有统计学意义。
二、卡方检验的应用场景卡方检验广泛应用于以下几个方面:1. 样本观察与理论值比较:用于比较观察数据与理论数据之间的差异,例如检验一个硬币是否是公平的。
2. 不同群体之间的差异性:用于比较不同群体之间某一属性的差异,例如男性和女性在某一疾病患病率上是否存在显著性差异。
3. 假设检验:用于判断两个或多个变量之间是否存在显著性关联,例如是否存在两个变量之间的相关性。
三、卡方检验的基本思路卡方检验的基本思路是建立原假设和备择假设,通过计算卡方值和查表得到结果。
具体步骤如下:1. 建立假设:设立原假设H0和备择假设H1。
原假设通常假定两个变量之间不存在显著性关联,备择假设则相反。
2. 构建列联表:将观察数据按照行和列分别分类计数,得到列联表。
3. 计算期望频数:根据原假设计算每个单元格的期望频数,即在假设成立的条件下,各个单元格的理论频数。
4. 计算卡方值:根据观察频数和期望频数计算卡方值,计算公式为Χ²=∑[(O-E)^2/E],其中O为观察频数,E为期望频数。
5. 查找临界值:根据自由度和显著性水平,在卡方分布表中找到对应的临界值。
6. 判断结果:比较计算得到的卡方值与临界值,若卡方值大于临界值,则拒绝原假设,认为差异具有统计学意义。
四、卡方检验的实例分析假设我们想要研究吸烟和肺癌之间的关系,我们收集了300人的数据,包括是否吸烟和是否患有肺癌的情况。
观察数据如下:吸烟非吸烟总计患有肺癌 80 40 120未患肺癌 100 80 180总计 180 120 300根据这些数据,我们想要判断吸烟与肺癌之间是否存在显著性关联。
统计学方法卡方检验描述
统计学方法卡方检验描述引言统计学是科学研究中不可或缺的一个工具,其应用广泛,包括了推断统计学和假设检验。
在统计学中,卡方检验是一种重要的方法,能够用来判断两个离散变量之间是否存在关联。
本文将详细介绍卡方检验的原理、应用场景、步骤以及其在统计分析中的重要性。
卡方检验的原理卡方检验,全称卡方独立性检验,是由卡尔·皮尔逊提出的一种统计方法。
其原理基于对观察值与期望值之间的差异进行比较,以判断两个变量之间是否存在关联。
卡方检验的基本思想是通过比较实际观察到的频数与期望频数之间的差异,来判断两个变量之间的关系。
具体而言,对于给定的统计样本,我们可以计算出每一组的期望频数,然后使用卡方检验统计量来衡量实际观察频数与期望频数之间的差异。
如果差异足够大,我们就可以认为两个变量之间存在关联。
卡方检验的应用场景卡方检验在实际应用中具有广泛的应用场景,特别适用于以下情况:1.检验两个离散变量之间是否存在关联。
例如,研究两个疾病之间的关联性、两个药物之间的疗效差异等。
2.检验两个分类变量之间是否存在关联。
例如,研究性别与是否吸烟之间的关系、教育程度与收入水平之间的关系等。
3.对样本数据进行拟合优度检验。
例如,将观察到的频数与理论上的频数进行比较,判断数据是否符合特定的分布。
4.检验数据的独立性。
例如,检验调查结果是否受到回答者特定属性的影响。
卡方检验的步骤卡方检验主要包括以下几个步骤:步骤一:建立假设在进行卡方检验前,我们首先需要建立起原假设和备择假设。
通常情况下,原假设是两个变量之间没有关联,备择假设是两个变量之间存在关联。
步骤二:计算期望频数计算期望频数是卡方检验的关键步骤之一。
通过使用样本中的观察频数和总体的比例,我们可以计算出每一组的期望频数。
步骤三:计算卡方检验统计量卡方检验统计量是衡量观察频数和期望频数之间差异的指标。
常见的卡方检验统计量包括皮尔逊卡方统计量和对数似然比统计量。
步骤四:确定显著性水平和自由度根据问题的要求和样本的特点,确定显著性水平和自由度。
医学统计学课件卡方检验

队列研究中的卡方检验
总结词
在队列研究中,卡方检验用于比较不同暴露 水平或不同分组在某个分类变量上的分布差 异,以评估暴露因素与疾病发生之间的关系 。
详细描述
队列研究是一种前瞻性研究方法,按照暴露 因素的不同将参与者分为不同的组,追踪各 组的疾病发生情况。通过卡方检验,可以比 较不同暴露水平或不同分组在分类变量上的 分布差异,如分析不同饮食习惯的人群中患
卡方检验与相关性分析的区别
卡方检验主要用于比较实际观测频数与期望频数之间的差异,而相关性分析则用于研究 两个或多个变量之间的关联程度。
卡方检验与相关性分析的联系
在某些情况下,卡方检验的结果可以为相关性分析提供参考,帮助了解变量之间的关联 程度。
05
卡方检验的应用实例
病例对照研究中的卡方检验
总结词
02
公式
卡方检验的公式为 $chi^{2} = sum frac{(O_{ij} - E_{ij})^{2}}{E_{ij}}$,
其中 $O_{ij}$ 表示实际观测频数,$E_{ij}$ 表示期望频数。
03
适用范围
卡方检验适用于两个分类变量的比较,可以用于分析病例对照研究、队
列研究等类型的研究。
卡方检验的用途
如比较不同年龄组、性别组等人群中某种疾病的患病率。
卡方检验的基本假设
每个单元格中的期望 频数应该大于5。
卡方检验对于样本量 较小的情况可能不适 用。
观察频数与期望频数 应该服从相同的概率 分布。
02
卡方检验的步骤
收集数据
01
02
03
确定研究目的
在开始卡方检验之前,需 要明确研究的目的和假设 ,以便有针对性地收集数 据。
统计学中的卡方检验方法
统计学中的卡方检验方法卡方检验是一种常用的统计方法,用于确定两个变量之间是否存在相关性。
它基于比较观察值与期望值之间的差异,通过计算卡方值来评估这种差异是否具有统计显著性。
本文将介绍卡方检验的原理、应用场景以及如何进行计算。
1. 原理卡方检验是基于频数表进行的统计推断方法。
它假设观察到的数据符合某种理论分布,然后计算观察值与理论值之间的差异程度。
卡方检验的原假设为无关性假设,即两个变量之间不存在相关性。
若观察到的卡方值大于一定的临界值,就可以拒绝原假设,认为两个变量之间存在相关性。
2. 应用场景卡方检验广泛应用于多个领域,包括医学、社会学、市场调研等。
以下是一些常见的应用场景:(1)医学研究:用于判断某种治疗方法对疾病的疗效是否显著,或者某种食物是否与某种疾病的发生相关。
(2)市场调研:用于分析消费者的购买偏好与不同产品之间的关联性。
(3)教育研究:用于研究学生的性别与不同学科成绩之间是否存在相关性。
(4)调查研究:用于分析样本调查结果与总体情况之间的差异。
3. 计算方法卡方检验的计算过程包括以下几个步骤:(1)建立假设:首先,我们需要明确研究的假设,包括原假设和备择假设。
(2)制作频数表:将观察到的数据按照行和列分组,形成一个频数表。
表中的值表示观察到的频数。
(3)计算期望值:根据无关性假设,计算期望频数,评估观察值与期望值之间的差异。
(4)计算卡方值:利用计算公式,将观察频数和期望频数代入,得到卡方值。
(5)确定显著性水平:根据显著性水平和自由度,查找卡方分布表,找到对应的临界值。
(6)比较卡方值和临界值:如果卡方值大于临界值,拒绝原假设,认为两个变量之间存在相关性;如果卡方值小于临界值,则无法拒绝原假设,即认为两个变量之间不存在相关性。
总结:卡方检验是一种简单而有效的统计方法,用于分析两个变量之间的相关性。
它的应用领域广泛,可以在医学、社会学、市场调研等领域中发挥重要作用。
通过计算卡方值和比较临界值,我们可以推断两个变量之间是否存在相关性。
40. 什么是统计学中的卡方检验?

40. 什么是统计学中的卡方检验?40、什么是统计学中的卡方检验?在统计学这个广袤的领域中,卡方检验是一种非常重要且常用的方法。
那么,究竟什么是卡方检验呢?卡方检验,简单来说,就是一种用于比较观察值和期望值之间差异的统计方法。
它通过计算一个叫做卡方值的统计量,来判断两个或多个变量之间是否存在显著的关联。
为了更清楚地理解卡方检验,让我们先从一个简单的例子说起。
假设我们想研究吸烟是否与患肺癌有关系。
我们可以收集一组人群的数据,其中一部分人吸烟,另一部分人不吸烟,然后观察他们中患肺癌和未患肺癌的人数。
在这个例子中,我们可以先根据一些已知的信息或者假设,计算出在没有任何关联的情况下,吸烟和不吸烟人群中患肺癌和未患肺癌的理论人数,也就是期望值。
然后,将实际观察到的人数与这些期望值进行比较。
卡方检验的核心思想就是,如果观察值与期望值之间的差异非常小,那么我们就可以认为吸烟与患肺癌之间可能没有关联;但如果差异很大,那就说明两者之间很可能存在关联。
那么,卡方值是怎么计算出来的呢?其实就是将每个类别中的观察值与期望值相减,然后平方,再除以期望值,最后把所有类别的结果相加。
卡方检验有不同的类型,其中最常见的是拟合优度检验和独立性检验。
拟合优度检验主要用于检验一组观察数据是否符合某种理论分布,比如正态分布、泊松分布等。
比如说,我们想知道某个城市中家庭人口数量的分布是否符合某种预期的模式,就可以使用拟合优度检验。
独立性检验则用于判断两个分类变量之间是否相互独立。
就像前面提到的吸烟与患肺癌的例子,吸烟与否和是否患肺癌就是两个分类变量。
在实际应用中,卡方检验有着广泛的用途。
比如在医学研究中,它可以帮助研究人员判断某种治疗方法是否有效;在市场调查中,可以了解消费者的不同特征与购买行为之间的关系;在社会学研究中,能够探究不同社会因素之间的相互影响。
不过,使用卡方检验也有一些需要注意的地方。
首先,样本量不能太小,否则卡方检验的结果可能不准确。
- 1、下载文档前请自行甄别文档内容的完整性,平台不提供额外的编辑、内容补充、找答案等附加服务。
- 2、"仅部分预览"的文档,不可在线预览部分如存在完整性等问题,可反馈申请退款(可完整预览的文档不适用该条件!)。
- 3、如文档侵犯您的权益,请联系客服反馈,我们会尽快为您处理(人工客服工作时间:9:00-18:30)。
Categorical variable
Variables that describe categories of entities Dealing with them all the time in statistics Making comparisons among variables
These are the expected frequencies, Ei.
Ei = n pi.
We compare the expected frequencies with the sample results or the observed frequencies, Oi. If they are approximately the same we would conclude that the null hypothesis is true.
The null hypothesis is that they are indifferent (or that equal numbers prefer glass, plastic, steel and aluminium).
Example 1
Data
Let pG be the probability that an individual selected at random will nomபைடு நூலகம்nate glass as his/her preference if required to make a choice.
Gender and preference for a product, whether the preference for a product is independent from gender
Chi-square test for differences between proportions
BEO2255 Applied Statistics
for Business
Week Six – Analyzing categorical data: Chi-squared tests
This week lecture will cover...
Analysing categorical data (nominal)
Example 1cont..
Procedure:
Select a random sample of, say, 100 consumers and determine their preferences.
Under the null hypothesis
We expect 25 consumers to nominate glass, 25 to nominate plastic, 25 to nominate steel and 25 to nominate aluminium
Chi-square test of differences between proportions Chi-square test of independence
SPSS单样本非参数检验
总体分布的chi-square检验
(1)目的: 根据样本数据推断总体的分布与某个已知分布是否有显著差异--吻合性检验。
population has a particular probability distribution.
Example 1
We might test whether consumers are indifferent to which of four materials (glass, plastic, steel or aluminium) that could be used to make soft drink containers.
For example, whether consumers prefer a particular brand of a product among other competing brands.
Checking whether there is a relationship between two categorical variables
This test involves with nominal data produced by multinomial experiment
It is a generalisation of a binomial experiment These test the null hypothesis that data in the target
适用于分类资料的统计推断
SPSS单样本非参数检验
总体分布的chi-square检验 (2)基本假设: H0:总体分布与理论分布无显著差异 (3)基本方法
– 根据已知总体的构成比计算出样本中各类别的期望频 数,计算实际观察频数与期望频数的差距,即:计算卡 方值
– 卡方值较小,则实际频数和期望频数相差较小.如果P大 于a,不能拒绝H0,认为总体分布与已知分布无显著差异. 反之
Similarly for pP (plastic), pS (steel) and pA (aluminium)
Hypotheses
HO: pG = pP = pS = pA = 0.25. HA: at least one pi 0.25.
The alternative is that at least one material is more preferred (or less preferred) than the others.
SPSS单样本卡方检验
总体分布的chi-square检验 (4)基本操作步骤:
菜单:analyze->nonparametric test->chi square 选定待检验变量入test variable list 框 确定待检验个案的取值范围(expected range)
get from data:全部样本 use specified range:用户自定义个案范围 指定期望频数(expected values) all categories equal:所有类别有相同的构成比 value:用户自定义构成比