ZedGraph控件属性及基础教程详解
C#上位机中ZedGraph控件的使用
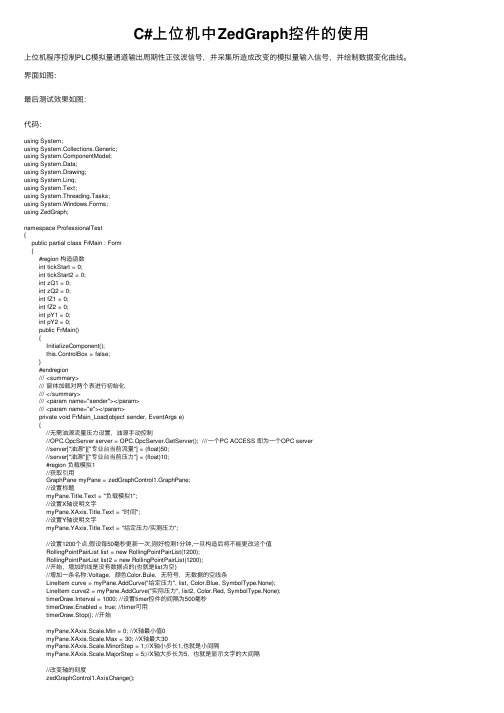
C#上位机中ZedGraph控件的使⽤上位机程序控制PLC模拟量通道输出周期性正弦波信号,并采集所造成改变的模拟量输⼊信号,并绘制数据变化曲线。
界⾯如图:最后测试效果如图:代码:using System;using System.Collections.Generic;using ponentModel;using System.Data;using System.Drawing;using System.Linq;using System.Text;using System.Threading.Tasks;using System.Windows.Forms;using ZedGraph;namespace ProfessionalTest{public partial class FrMain : Form{#region 构造函数int tickStart = 0;int tickStart2 = 0;int zQ1 = 0;int zQ2 = 0;int fZ1 = 0;int fZ2 = 0;int pY1 = 0;int pY2 = 0;public FrMain(){InitializeComponent();this.ControlBox = false;}#endregion/// <summary>/// 窗体加载对两个表进⾏初始化/// </summary>/// <param name="sender"></param>/// <param name="e"></param>private void FrMain_Load(object sender, EventArgs e){//⽆需油源流量压⼒设置,油源⼿动控制//OPC.OpcServer server = OPC.OpcServer.GetServer(); ///⼀个PC ACCESS 即为⼀个OPC server//server["油源"]["专业台当前流量"] = (float)50;//server["油源"]["专业台当前压⼒"] = (float)10;#region 负载模拟1//获取引⽤GraphPane myPane = zedGraphControl1.GraphPane;//设置标题myPane.Title.Text = "负载模拟1";//设置X轴说明⽂字myPane.XAxis.Title.Text = "时间";//设置Y轴说明⽂字myPane.YAxis.Title.Text = "给定压⼒/实测压⼒";//设置1200个点,假设每50毫秒更新⼀次,刚好检测1分钟,⼀旦构造后将不能更改这个值RollingPointPairList list = new RollingPointPairList(1200);RollingPointPairList list2 = new RollingPointPairList(1200);//开始,增加的线是没有数据点的(也就是list为空)//增加⼀条名称:Voltage,颜⾊Color.Bule,⽆符号,⽆数据的空线条LineItem curve = myPane.AddCurve("给定压⼒", list, Color.Blue, SymbolType.None);LineItem curve2 = myPane.AddCurve("实际压⼒", list2, Color.Red, SymbolType.None);timerDraw.Interval = 1000; //设置timer控件的间隔为500毫秒timerDraw.Enabled = true; //timer可⽤timerDraw.Stop(); //开始myPane.XAxis.Scale.Min = 0; //X轴最⼩值0myPane.XAxis.Scale.Max = 30; //X轴最⼤30myPane.XAxis.Scale.MinorStep = 1;//X轴⼩步长1,也就是⼩间隔myPane.XAxis.Scale.MajorStep = 5;//X轴⼤步长为5,也就是显⽰⽂字的⼤间隔//保存开始时间//tickStart = Environment.TickCount;#endregion#region 负载模拟2//获取引⽤GraphPane myPane1 = zedGraphControl2.GraphPane;//设置标题myPane1.Title.Text = "负载模拟2";//设置X轴说明⽂字myPane1.XAxis.Title.Text = "时间";//设置Y轴说明⽂字myPane1.YAxis.Title.Text = "给定压⼒/实测压⼒";//设置1200个点,假设每50毫秒更新⼀次,刚好检测1分钟,⼀旦构造后将不能更改这个值RollingPointPairList list3 = new RollingPointPairList(1200);RollingPointPairList list4 = new RollingPointPairList(1200);//开始,增加的线是没有数据点的(也就是list为空)//增加⼀条名称:Voltage,颜⾊Color.Bule,⽆符号,⽆数据的空线条LineItem curve3 = myPane1.AddCurve("给定压⼒", list3, Color.Blue, SymbolType.None); LineItem curve4 = myPane1.AddCurve("实际压⼒", list4, Color.Red, SymbolType.None); timer1Draw.Interval = 1000; //设置timer控件的间隔为500毫秒timer1Draw.Enabled = true; //timer可⽤timer1Draw.Stop(); //暂不启动myPane1.XAxis.Scale.Min = 0; //X轴最⼩值0myPane1.XAxis.Scale.Max = 30; //X轴最⼤30myPane1.XAxis.Scale.MinorStep = 1;//X轴⼩步长1,也就是⼩间隔myPane1.XAxis.Scale.MajorStep = 5;//X轴⼤步长为5,也就是显⽰⽂字的⼤间隔//改变轴的刻度zedGraphControl2.AxisChange();//保存开始时间//tickStart2 = Environment.TickCount;#endregion}/// <summary>/// 负载1模拟开始/// </summary>/// <param name="sender"></param>/// <param name="e"></param>private void button1_Click(object sender, EventArgs e){try{zQ1 = int.Parse(textBox1.Text);fZ1 = int.Parse(textBox2.Text);pY1 = int.Parse(textBox5.Text);if (zQ1<=10){MessageBox.Show("周期过⼩,请将周期设为10秒以上") ;return;}if (fZ1<=5){MessageBox.Show("幅值过⼩,请将幅值设为5MPa以上");return;}else if (fZ1>=15){MessageBox.Show("幅值过⼤,请将幅值设为15MPa以下");return;}if (pY1-fZ1 <0){MessageBox.Show("压⼒过⼩,请将压⼒设为0MPa以上");return;}else if (fZ1 +pY1> 31.5){MessageBox.Show("压⼒过⼤,请将压⼒设为15MPa以下");return;}button1.Enabled = false;timerDraw.Start();//保存开始时间tickStart = Environment.TickCount;#region 清空原有图表//确保CurveList不为空if (zedGraphControl1.GraphPane.CurveList.Count <= 0)//取Graph第⼀个曲线,也就是第⼀步:在GraphPane.CurveList集合中查找CurveItemLineItem curve = zedGraphControl1.GraphPane.CurveList[0] as LineItem;LineItem curve2 = zedGraphControl1.GraphPane.CurveList[1] as LineItem;if (curve == null | curve2 == null){return;}//第⼆步:在CurveItem中访问PointPairList(或者其它的IPointList),根据⾃⼰的需要增加新数据或修改已存在的数据 IPointListEdit list = curve.Points as IPointListEdit;IPointListEdit list2 = curve2.Points as IPointListEdit;list.Clear();list2.Clear();//第三步:调⽤Form.Invalidate()⽅法更新图表zedGraphControl1.Invalidate();#endregion}catch (Exception){MessageBox.Show("请输⼊正确数值");}}/// <summary>/// 负载2模拟开始/// </summary>/// <param name="sender"></param>/// <param name="e"></param>private void button2_Click(object sender, EventArgs e){try{zQ2 = int.Parse(textBox3.Text);fZ2 = int.Parse(textBox4.Text);pY2 = int.Parse(textBox6.Text);if (zQ2 <= 10){MessageBox.Show("周期过⼩,请将周期设为10秒以上");return;}if (fZ2 <= 5){MessageBox.Show("幅值过⼩,请将幅值设为5MPa以上");return;}else if (fZ2 >= 15){MessageBox.Show("幅值过⼤,请将幅值设为15MPa以下");return;}if (pY2 - fZ2 < 0){MessageBox.Show("压⼒过⼩,请将压⼒设为0MPa以上");return;}else if (fZ2 + pY2 > 31.5){MessageBox.Show("压⼒过⼤,请将压⼒设为15MPa以下");return;}button2.Enabled = false;timer1Draw.Start();//保存开始时间tickStart2 = Environment.TickCount;#region 清空原有图表//确保CurveList不为空if (zedGraphControl2.GraphPane.CurveList.Count <= 0){return;}//取Graph第⼀个曲线,也就是第⼀步:在GraphPane.CurveList集合中查找CurveItemLineItem curve3 = zedGraphControl2.GraphPane.CurveList[0] as LineItem;LineItem curve4 = zedGraphControl2.GraphPane.CurveList[1] as LineItem;if (curve3 == null | curve4 == null){return;}//第⼆步:在CurveItem中访问PointPairList(或者其它的IPointList),根据⾃⼰的需要增加新数据或修改已存在的数据 IPointListEdit list3 = curve3.Points as IPointListEdit;IPointListEdit list4 = curve4.Points as IPointListEdit;if (list3 == null | list4 == null)list3.Clear();list4.Clear();//第三步:调⽤Form.Invalidate()⽅法更新图表zedGraphControl2.Invalidate();#endregion}catch (Exception){MessageBox.Show("请输⼊正确数值");}}/// <summary>/// 负载1模拟停⽌/// </summary>/// <param name="sender"></param>/// <param name="e"></param>private void button3_Click(object sender, EventArgs e){timerDraw.Enabled = false;timerDraw.Stop();button1.Enabled = true;OPC.OpcServer server = OPC.OpcServer.GetServer();server["专业试验台"]["⽐例溢流阀4_1模拟缓存"] = (float)0;//写⼊压⼒0}/// <summary>/// 负载2模拟停⽌/// </summary>/// <param name="sender"></param>/// <param name="e"></param>private void button4_Click(object sender, EventArgs e){timer1Draw.Enabled = false;timer1Draw.Stop();button2.Enabled = true;OPC.OpcServer server = OPC.OpcServer.GetServer();server["专业试验台"]["⽐例溢流阀4_2模拟缓存"] = (float)0;//写⼊压⼒0}/// <summary>/// 负载模拟1表格定时更新/// </summary>/// <param name="sender"></param>/// <param name="e"></param>private void timerDraw_Tick(object sender, EventArgs e){//确保CurveList不为空if (zedGraphControl1.GraphPane.CurveList.Count <= 0){return;}//取Graph第⼀个曲线,也就是第⼀步:在GraphPane.CurveList集合中查找CurveItemLineItem curve = zedGraphControl1.GraphPane.CurveList[0] as LineItem;LineItem curve2 = zedGraphControl1.GraphPane.CurveList[1] as LineItem;if (curve == null | curve2 == null){return;}//第⼆步:在CurveItem中访问PointPairList(或者其它的IPointList),根据⾃⼰的需要增加新数据或修改已存在的数据 IPointListEdit list = curve.Points as IPointListEdit;IPointListEdit list2 = curve2.Points as IPointListEdit;if (list == null | list2 == null){return;}// 时间⽤秒表⽰double time = (Environment.TickCount - tickStart) / 1000.0;// 周期为zQ1,幅值为fZ1OPC.OpcServer server = OPC.OpcServer.GetServer();float gDYL = (float)(fZ1 * Math.Sin(2.0 * Math.PI * time / zQ1))+pY1;//给定压⼒值float sJYL = server["专业试验台"]["负载模拟压⼒缓存1_1"];//实际读取压⼒值server["专业试验台"]["⽐例溢流阀4_1模拟缓存"] = gDYL;//将周期值写⼊PLClist.Add(time, (double)gDYL);list2.Add(time, (double)sJYL);Console.WriteLine(time.ToString());Scale xScale = zedGraphControl1.GraphPane.XAxis.Scale;if (time > xScale.Max - xScale.MajorStep){xScale.Max = time + xScale.MajorStep;xScale.Min = xScale.Max - 30.0;}zedGraphControl1.AxisChange();//第四步:调⽤Form.Invalidate()⽅法更新图表zedGraphControl1.Invalidate();}/// <summary>/// 负载模拟2表格定时更新/// </summary>/// <param name="sender"></param>/// <param name="e"></param>private void timer1Draw_Tick(object sender, EventArgs e){//确保CurveList不为空if (zedGraphControl2.GraphPane.CurveList.Count <= 0){return;}//取Graph第⼀个曲线,也就是第⼀步:在GraphPane.CurveList集合中查找CurveItemLineItem curve3 = zedGraphControl2.GraphPane.CurveList[0] as LineItem;LineItem curve4 = zedGraphControl2.GraphPane.CurveList[1] as LineItem;if (curve3 == null | curve4 == null){return;}//第⼆步:在CurveItem中访问PointPairList(或者其它的IPointList),根据⾃⼰的需要增加新数据或修改已存在的数据 IPointListEdit list3 = curve3.Points as IPointListEdit;IPointListEdit list4 = curve4.Points as IPointListEdit;if (list3 == null | list4 == null){return;}// 时间⽤秒表⽰double time = (Environment.TickCount - tickStart2) / 1000.0;// 周期为zQ2,幅值为fZ2OPC.OpcServer server = OPC.OpcServer.GetServer();float gDYL = (float)(fZ2 * Math.Sin(2.0 * Math.PI * time / zQ2))+pY2;//给定压⼒值float sJYL = server["专业试验台"]["负载模拟压⼒缓存1_2"];//实际读取压⼒值server["专业试验台"]["⽐例溢流阀4_2模拟缓存"] = gDYL;//将周期值写⼊PLClist3.Add(time, gDYL);list4.Add(time, sJYL);Console.WriteLine(time.ToString());Scale xScale = zedGraphControl2.GraphPane.XAxis.Scale;if (time > xScale.Max - xScale.MajorStep){xScale.Max = time + xScale.MajorStep;xScale.Min = xScale.Max - 30.0;}//第三步:调⽤ZedGraphControl.AxisChange()⽅法更新X和Y轴的范围zedGraphControl2.AxisChange();//第四步:调⽤Form.Invalidate()⽅法更新图表zedGraphControl2.Invalidate();}/// <summary>/// 关闭窗体/// </summary>/// <param name="sender"></param>/// <param name="e"></param>private void button5_Click(object sender, EventArgs e){OPC.OpcServer server = OPC.OpcServer.GetServer();server["专业试验台"]["⽐例溢流阀4_1模拟缓存"] = (float)0;//写⼊压⼒0server["专业试验台"]["⽐例溢流阀4_2模拟缓存"] = (float)0;//写⼊压⼒0this.Close();}}}。
ZedGraph介绍
前言原文地址:/KB/graphics/zedgraph.aspxZedGraph是用于创建任意数据的二维线型、棒型、饼型图表的一个类库,也可以作为Windows窗体用户控件和ASP网页访问控件。
这个类库具有高度的灵活性,几乎所有式样的图表都能够被创建。
这个类库的用法在于通过提供所有图表属性的省缺值来保持使用性的简单。
这个类库包含了基于要绘制的数值范围内可选择适当度量范围和跨度的代码。
此外,ZedGraph与.NET 2.0和2005兼容的。
ZedGraph保持作为建立在SourceForge开源开发项目。
该网站包括项目信息、文件、更新支持和所有发布版本。
一套图表实例连同所有的源代码(样本许多包括C#和VB代码)对于SourceForge也是同样有用的。
ZedGraph目前支持的.NET 2.0和.NET 1.1。
对于.NET 2.0,使用ZedGraph版本5.0 +。
对于.NET 1.1,使用ZedGraph版本4.5 +。
背景世面上有许多的图表组件,但是没有一个符合我的要求。
我发现MSChart 太奇怪,而且许多配置选项没有我所需要的适应性用来完成一个漂亮的视觉效果。
当然大多数的商业包能够作到这些,但是我需要一些免费的东西,所以ZedGragh诞生了。
这些类将在一个窗体上产生一个线条,条型,或者图表,并给予一个矩形和一些数据点。
ZedGraph 可以构建二维的线性/离散的图形,横/纵坐标轴,花哨的棒图,精致的百分比棒图,错误图和饼型图——他不能构建三维的外观或图表。
最近还加入了对于页面中图形处理方法。
可以参看下载资料中的关于ASP的文档。
所绘制的图表能够配上轴标签和标题,一个图例,文本标签和箭头,图片等等。
ZedGraphWiki和在线类文档提供很多有用的技巧和说明。
更多的详细资料——ZedGraph有很多在说明文档中没有说明的配置选项。
VB 用户本文专门利用C#作为例子,但是,所有的代码示例教程和其他的例子是针对Visual Basic关于ZedGraphWiki样品图一节。
ZedGraph源码学习(一)

ZedGraph源码学习(⼀)因⼯作原因,学习相关ZedGraph源码来解决⼀些问题。
刚看到这个开源图表控件时,感觉还是短⼩精悍的。
结合ZedGraph控件的例⼦⼤致看了下对应的源码,写下点感悟。
这⾥先⼤致说⼀些ZedGraph⾥的元素。
1.Panel:ZedGraph控件是如何画出来的,就是这这个上⾯画出来,后⾯的元素如坐标轴,线条,饼图。
2.Axis:轴线,任何⼆维线型、条型、饼型图表都需要⼀个坐标轴,⾄少有X轴,Y轴,然后我们才能在上⾯画相应的线条,饼型等元素。
3.CurveItem:我们刚说到在有坐标轴后,那么需要画我们的线条,条型,饼型什么的,CurveItem就是存储我们的数据然后画出对应的图形。
4.GraphObj:我们在整个Panel⾥可能要标出⼀些信息,如某点要添加相应描述,或是我们要标⽰有⼀部分是警告区域,都可以由这个来完成。
5.MajorTic与MinorTic:这⼆个对象都是针对Axis来说的,主要是描述上⾯的轴线上的主⾼刻度与副刻度。
6.Scale:这个和上⾯的对象⼀样是Axis来说的,主要是描述轴线上的刻度显⽰的对应的数字与标识。
7.PointPair:这个就是针对CurveItem来说的,CurveItem⾥保存着相应的数据,⽽这些数据就放在PointPair队例⾥。
这些其实就是构成统计图⼀些主要元素了,当然还有⼀些⽤于辅助的如:Legend(简单来说就是对应CurvItem图形的缩微图),Fill(⽤于填充对象的),Border(描述元素边界的),Symbol(点上的图形).上⾯的1-7中,除5,6外都是有对应的集合类。
它们之间的关系如下。
Panel可以包含Axis,CurveItem,GraphObj这些元素的集合,⽽在其中⼀个CurveItem可以对应⼀个X轴和Y轴,也可以多个CurveItem对应⼀个X轴,⽽GraphObj与Axis和CurveItem没有直接关系。
GraphViz常用属性学习笔记
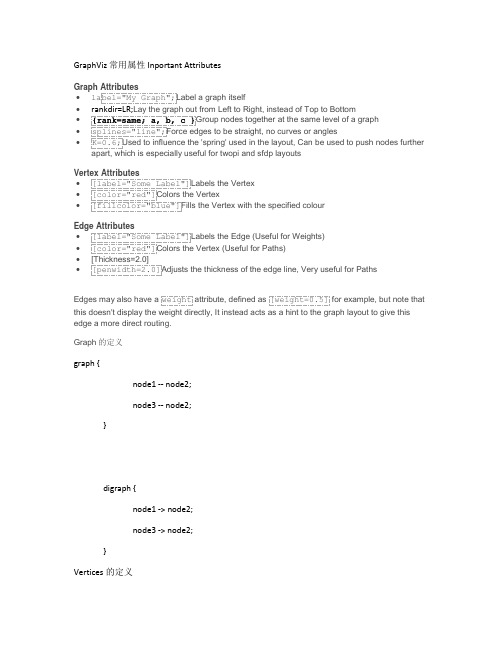
GraphViz 常用属性Inportant AttributesGraph Attributes•label="My Graph";Label a graph itself••••Vertex Attributes•[label="Some Label"]Labels the Vertex•[color="red"]Colors the Vertex•[fillcolor="blue"]Fills the Vertex with the specified colourEdge Attributes•[label="Some Label"]Labels the Edge (Useful for Weights)•[color="red"]Colors the Vertex (Useful for Paths)•[Thickness=2.0]•[penwidth=2.0]Adjusts the thickness of the edge line, Very useful for PathsEdges may also have a weight attribute, defined as[weight=0.5]for example, but note that this doesn't display the weight directly, It instead acts as a hint to the graph layout to give this edge a more direct routing.Graph的定义graph {node1 -- node2;node3 -- node2;}digraph {node1 -> node2;node3 -> node2;}Vertices的定义可以先声明其属性,再使用digraph {someVertex[label="A Complicated Label"];someVertex -> node2;node2 -> node3;}定义和使用线条,定义colour/thickness, labeldigraph {node1 -> node2[color="red" label=”edge1”];}在Graph中定义edge和note的全局变量,以及支持中文输入。
基于ZedGraph的在线动态数据图表绘制
基于ZedGraph的在线动态数据图表绘制作者:杨伟杰来源:《软件导刊》2014年第01期摘要:在基于Web的程序开发中,动态地绘制数据图表能清晰地呈现数据处理和分析结果。
在介绍当前主流数据图表绘制常用工具的基础上,阐述了在.NET环境下使用免费开源控件ZedGraph绘制数据图表的基本过程和效果。
关键词:ZedGraph;;动态数据图表;开源图表类库中图分类号:TP391 文献标识码:A 文章编号文章编号:16727800(2014)001012803基金项目基金项目:全国教育信息技术“十二五”规划研究重点项目2011年度(116220111)作者简介作者简介:杨伟杰(1981-),男,硕士,广东外语艺术职业学院信息技术系讲师,研究方向为计算机教育、教育信息技术。
0 引言在基于Web的程序开发中,使用数据图表能清楚地呈现数据处理和分析结果,方便用户理解数据的含义。
在许多情形中,用户希望能定时刷新生成的图表,以呈现数据库中数据的变化,动态地绘制这些数据图表就成为我们需要关注和解决的问题。
1 在线动态数据图表常用绘制工具在基于.Net的Windows服务器环境中,一般生成图表有两种途经:一是使用基于JavaScript的图表绘制工具或类库,它们对.NET环境没有依赖,但通常需要使用Ajax和D3可视化库、Query扩展和jQuery等来实现数据的读取和展示,常见的工具有Flotr2、AwesomeChartJS、Highchart 和JS Charts等[1];二是使用.NET环境下的类库或控件,这些类库又分为系统内置类库和第三方开发的类库或控件。
在.Net Framework中内置了功能强大的System.Drawing 命名空间中的GDI+类[2],用它可以创建各种饼图、柱状图、线性图等图表,但开发工作量较大,而且不够灵活;而第三方开发的工具则有收费的.NetCHARTING[3]、免费开源的ZedGraph[4]和NPlot等。
天地图JavaScript API接口说明

JavaScript API接口文档V2.0天地图有限公司2013年3月文档说明本文档包含所有的内容除说明以外,版权均属天地图有限公司所有,受《中华人民共和国著作权法》保护及相关法律法规和中国加入的所有知识产权方面的国际条约的保护。
未经本公司书面许可,任何单位和个人不得以任何方式翻印和转载本文档的任何内容,否则视为侵权,天地图有限公司保留已发追究其法律责任的权利。
本文档是天地图Java Script API的用户使用参考手册,详细阐述了API提供用户的类和方法,以及可以实现的功能介绍。
天地图Java Script API让您可以将地图嵌入您自己的网页中。
API 提供了许多方法与地图进行交互,以及一系列向地图添加内容的服务,从而使您可以在自己的网站上创建稳定的地图应用程序。
本文档分为地图主类、控件类、工具类、叠加物、右键菜单类、实体类、事件类7个大章节。
以类(描述、属性、构造函数、方法)为索引讲述接口用法。
用户在阅读下面的文档时,可以根据需求对文档进行查询或跳跃式阅读。
从而更好地应用API类服务于自己的领域。
JavaScript API 整体概要设计API接口基本结构图API接口类基本关系图目录JavaScript API接口文档V2.0..........................................................................................................................I JavaScript API 整体概要设计............................................................................................................................II 1 地图主类 (5)1.1 TMap类 (5)1.1.1 构造函数 (5)1.1.2 配置方法 (5)1.1.3 地图状态方法 (5)1.1.4 修改地图状态方法 (6)1.1.5 坐标变换 (6)1.1.6 覆盖物方法 (7)1.1.7 控件 (7)1.1.8 地图图层方法 (7)1.1.9 事件方法 (8)1.2 TMapOptions类 (8)1.2.1 属性 (9)1.3 TMapTypeOptions类 (9)1.3.1 属性 (9)1.4 TMapType 类 (9)1.4.1 构造函数 (9)1.4.2 方法 (9)1.4.3 常量 (10)1.5 TTileLayer 类 (10)1.5.1 构造函数 (10)1.5.2 方法 (10)1.5.3 事件 (11)1.6 TTileLayerOptions类 (11)1.6.1 属性 (11)2 控件类 (11)2.1 TControl类 (11)2.1.1 方法 (12)2.2 TNavigationControlOptions类 (12)2.2.1 属性 (12)2.3 TNavigationControl类 (13)2.3.1 构造函数 (13)2.4 TOverviewMapControlOptions类 (13)2.4.1 属性 (13)2.5 TOverviewMapControl类 (13)2.5.1 构造函数 (13)2.5.2 方法 (14)2.5.3 事件 (14)2.6 TScaleControl类 (14)2.6.1 构造函数 (14)2.6.2 方法 (14)2.8 TCopyright类 (15)2.8.1 属性 (15)2.9 TMapTypeOptions类 (15)2.9.1 属性 (15)2.10 TMapTypeControl类 (15)2.10.1 构造函数 (15)3 工具类 (16)3.1 TMarkToolOptions类 (16)3.1.1 属性 (16)3.2 TMarkTool类 (16)3.2.1 构造函数 (16)3.2.2 方法 (16)3.2.3 事件 (17)3.3 TPolygonToolOptions类 (17)3.3.1 属性 (17)3.4 TPolygonTool类 (17)3.4.1 构造函数 (17)3.4.2 方法 (17)3.4.3 事件 (18)3.5 TPolylineToolOptions类 (18)3.5.1 属性 (18)3.6 TPolylineTool类 (18)3.6.1 构造函数 (19)3.6.2 方法 (19)3.6.3 事件 (19)3.7 TRectToolOptions类 (19)3.7.1 属性 (19)3.8 TRectTool类 (20)3.8.1 构造函数 (20)3.8.2 方法 (20)3.8.3 事件 (20)4 叠加物 (20)4.1 TOverlay类 (20)4.1.1 属性 (21)4.1.2 方法 (21)4.2 TLabelOptions类 (21)4.2.1 属性 (21)4.3 TLabel类 (22)4.3.1 构造函数 (22)4.3.2 方法 (22)4.3.3 事件 (23)4.4 TMarkerOptions类 (23)4.4.1 属性 (23)4.5 TMarker类 (24)4.6 TIconOptions类 (25)4.6.1 属性 (26)4.7 TIcon类 (26)4.7.1 构造函数 (26)4.7.2 方法 (26)4.8 TPolylineOptions类 (26)4.8.1 属性 (26)4.9 TPolyline类 (27)4.9.1 构造函数 (27)4.9.2 方法 (27)4.9.3 事件 (27)4.10 TPolygonOptions类 (28)4.10.1 属性 (28)4.11 TPolygon类 (28)4.11.1 构造函数 (28)4.11.2 方法 (28)4.11.3 事件 (29)4.12 TInfoWindowOptions类 (29)4.12.1 属性 (29)4.13 TInfoWindow类 (29)4.13.1 构造函数 (29)4.13.2 方法 (30)4.13.3 事件 (30)4.14 TRectOptions类 (31)4.14.1 属性 (31)4.15 TRect类 (31)4.15.1 构造函数 (31)4.15.2 方法 (31)4.15.3 事件 (32)4.16 TCircleOptions类 (32)4.16.1 属性 (32)4.17 TCircle类 (32)4.17.1 构造函数 (32)4.17.2 方法 (33)4.17.3 事件 (33)4.18 TEllipseOptions类 (33)4.18.1 属性 (33)4.19 TEllipse类 (34)4.19.1 构造函数 (34)4.19.2 方法 (34)4.19.3 事件 (35)5 右键菜单类 (35)5.1 TContextMenu类 (35)5.2 TMenuItem类 (35)5.2.1 构造函数 (36)5.2.2 属性 (36)5.3 TContextMenuOptions类 (36)5.3.1 属性 (36)6 实体类 (36)6.1 TLngLat类 (36)6.1.1 构造函数 (36)6.1.2 方法 (36)6.2 TBounds类 (37)6.2.1 构造函数 (37)6.2.2 方法 (37)6.3 TPixel类 (37)6.3.1 属性 (38)6.3.2 构造函数 (38)6.3.3 方法 (38)6.4 TSize类 (38)6.4.1 属性 (38)6.4.2 方法 (38)7 事件类 (38)7.1 TEvent类 (38)7.1.1 静态方法 (39)7.1.2 事件 (39)7.2 TEventListener 类 (39)1地图主类1.1TMap类此类是天地图地图API的基础类,是地图实例化的基础函数。
ZedGraph控件生成饼图、拆线图和柱状图例程
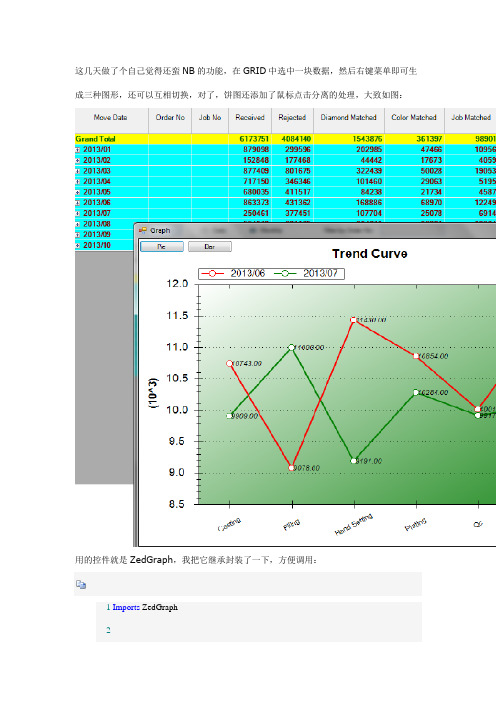
这几天做了个自己觉得还蛮NB的功能,在GRID中选中一块数据,然后右键菜单即可生成三种图形,还可以互相切换,对了,饼图还添加了鼠标点击分离的处理,大致如图:用的控件就是ZedGraph,我把它继承封装了一下,方便调用:1Imports ZedGraph23Public Class FinexGraph4'用于切换图型的5Private dtSource As DataTable67Private Function FinexGraph_MouseDownEvent(ByVal sender As ZedGraph.ZedGraphControl, ByVal e As System.Windows.Forms.MouseEventArgs) As System.Boolean Handles MyBase.MouseDownEvent89If e.Button = Windows.Forms.MouseButtons.Left Then10Dim pane As GraphPane = sender.GraphPane11Dim pt As New PointF(e.X, e.Y)12Dim curve As CurveItem = Nothing13Dim i%14If pane.FindNearestPoint(pt, curve, i) Then15If curve.IsPie Then16Dim pi As PieItem = CType(curve, PieItem)17If pi.Displacement > 0Then18pi.Displacement = 019Else20pi.Displacement = 0.321End If22sender.Refresh()23End If24End If25End If26Return True2728End Function2930Public Sub SetTitle(ByVal title As String)31'' Set the pane title32GraphPane.Title.Text = title33End Sub3435Public Sub SetPieDataB(ByVal dt As DataTable, ByVal title As String) 3637'为多列一行的数据,按列分块,不支持切换,不推荐使用3839Dim ds As New DataSet40Dim i, j As Integer41Dim cc, rc As Integer4243rc = dt.Rows.Count44cc = dt.Columns.Count45If rc = 0Or cc = 0Then Return4647GraphPane.CurveList.Clear()48GraphPane.GraphObjList.Clear()49GraphPane.Legend.IsVisible = True50GraphPane.Legend.Position = LegendPos.Right51GraphPane.Legend.FontSpec.Size = 752If String.IsNullOrEmpty(title) = False Then53GraphPane.Title.Text = title54End If5556Dim labels(cc - 1) As String57Dim values(cc - 1) As Double5859For i = 0To cc - 160labels(i) = dt.Columns(i).ColumnName61values(i) = dt.Rows(0).Item(i)62Next63'Dim colors() As Color = {Color.Red, Color.Blue, Color.Green, Color.Yellow, Color.Purple, Color.Brown, Color.Coral, Color.ForestGreen}64Dim slices() As PieItem = GraphPane.AddPieSlices(values, labels) 65GraphPane.Fill = New Fill(Color.Cornsilk)66GraphPane.Chart.Fill = New Fill(Color.Cornsilk)67'GraphPane.Fill = New Fill(Color.White, Color.Goldenrod, 45.0F) 6869For i = 0To cc - 170slices(i).LabelType = _Value_Percent 71Next7273GraphPane.AxisChange()74Refresh()75dtSource = Nothing76FlowLayoutPanel1.Controls.Clear()7778End Sub7980Public Sub SetPieData(ByVal dt As DataTable, ByVal title As String)8182'TABLE内容应为第一列为各块名称,第二列为各块的值,不能只有一列8384Dim ds As New DataSet85Dim i, j As Integer86Dim cc, rc As Integer8788rc = dt.Rows.Count89cc = dt.Columns.Count90If rc = 0Or cc <= 1Then Return9192GraphPane.CurveList.Clear()93GraphPane.GraphObjList.Clear()94GraphPane.Legend.IsVisible = True95GraphPane.Legend.Position = LegendPos.Right96GraphPane.Legend.FontSpec.Size = 797If String.IsNullOrEmpty(title) = False Then98GraphPane.Title.Text = title99End If100101Dim labels(rc - 1) As String102Dim values(rc - 1) As Double103104For j = 1To cc - 1105For i = 0To rc - 1106labels(i) = dt.Rows(i).Item(0)107values(i) = dt.Rows(i).Item(j)108Next109'Dim colors() As Color = {Color.Red, Color.Blue, Color.Green, Color.Yellow, Color.Purple, Color.Brown, Color.Coral, Color.ForestGreen}110Dim slices() As PieItem = GraphPane.AddPieSlices(values, labels) 111GraphPane.Fill = New Fill(Color.Cornsilk)112GraphPane.Chart.Fill = New Fill(Color.Cornsilk)113'GraphPane.Fill = New Fill(Color.White, Color.Goldenrod, 45.0F) 114115For i = 0To rc - 1116slices(i).LabelType = _Value_Percent 117Next118Next119120GraphPane.AxisChange()121Refresh()122dtSource = dt123124FlowLayoutPanel1.Controls.Clear()125AddButton("Curve", AddressOf btnCurve_Click)126AddButton("Bar", AddressOf btnBar_Click)127128End Sub129130Public Sub SetPieData(ByVal dt As DataTable)131132SetPieData(dt, "")133134End Sub135136Public Sub SetCurveData(ByVal dt As DataTable)137SetCurveData(dt, "", "", "")138End Sub139140Public Sub SetCurveData(ByVal dt As DataTable, ByVal title As String)141SetCurveData(dt, title, "", "")142End Sub143144Public Sub SetCurveData(ByVal dt As DataTable, ByVal title As String, ByVal xAxisTitle As String, ByVal yAxisTitle As String)145146'TABLE内容应为第一列为X轴值,第二列开始为Y轴数值,除非只有一列147148If dt Is Nothing Then Return149150Dim cc As Integer = dt.Columns.Count151Dim rc As Integer = dt.Rows.Count152153If rc = 0Or cc = 0Then Return154155GraphPane.CurveList.Clear()156GraphPane.GraphObjList.Clear()157158If String.IsNullOrEmpty(title) = False Then159GraphPane.Title.Text = title160End If161If String.IsNullOrEmpty(xAxisTitle) Then162GraphPane.XAxis.Title.Text = xAxisTitle163End If164If String.IsNullOrEmpty(yAxisTitle) Then165GraphPane.YAxis.Title.Text = yAxisTitle166End If167168GraphPane.Legend.IsVisible = cc > 1169GraphPane.Legend.Position = LegendPos.Top170171Dim values(rc - 1) As Double172Dim labels(rc - 1) As String173174Dim i%, j%, k%, b%175Dim alone As Boolean = cc = 1176'只有一列的情况下,X轴为序号177For i = 0To rc - 1178If alone Then179labels(i) = i + 1180Else181labels(i) = dt.Rows(i).Item(0)182End If183Next184185Dim colors() As Color = {Color.Red, Color.Green, Color.Blue, Color.Orange, Color.Purple, Color.Pink}186Dim curve As LineItem187 b = IIf(alone, 0, 1)188For j = b To dt.Columns.Count - 1189For i = 0To dt.Rows.Count - 1190values(i) = dt.Rows(i).Item(j)191Next192k = j - b193If k >= colors.Length Then194k = j - b - colors.Length195End If196curve = GraphPane.AddCurve(dt.Columns(j).ColumnName, Nothing, values, colors(k), SymbolType.Circle)197curve.Line.Width = 2.5198curve.Line.IsAntiAlias = True199curve.Symbol.Fill = New Fill(Color.White)200curve.Symbol.Size = 8201202For i = 0To curve.Points.Count - 1203Dim pt As PointPair = curve.Points(i)204Dim text As New TextObj(pt.Y.ToString("f2"), pt.X, pt.Y + GraphPane.YAxis.Scale.Max * 0.02, CoordType.AxisXYScale, AlignH.Left,AlignV.Center)205text.ZOrder = ZOrder.A_InFront206text.FontSpec.Size = 9207text.FontSpec.Border.IsVisible = False208text.FontSpec.Fill.IsVisible = False209'text.FontSpec.Fill = new Fill( Color.FromArgb( 100,Color.White ) )210text.FontSpec.IsItalic = True211'text.FontSpec.Angle = 30 '字体倾斜度212GraphPane.GraphObjList.Add(text)213Next214215Next216GraphPane.Chart.Fill = New Fill(Color.White, Color.FromArgb(255, Color.ForestGreen), 45.0F)217218GraphPane.XAxis.Scale.TextLabels = labels219GraphPane.XAxis.Type = AxisType.Text220GraphPane.XAxis.Scale.FontSpec.Size = 9221If labels.Length > 4And labels(0).Length > 4Then222GraphPane.XAxis.Scale.FontSpec.Angle = 30223End If224GraphPane.XAxis.IsVisible = True225GraphPane.YAxis.IsVisible = True226GraphPane.YAxis.MajorGrid.IsVisible = True227228GraphPane.AxisChange()229Refresh()230dtSource = dt231232FlowLayoutPanel1.Controls.Clear()233AddButton("Pie", AddressOf btnPie_Click)234AddButton("Bar", AddressOf btnBar_Click)235236End Sub237238Public Sub SetBarData(ByVal dt As DataTable)239SetBarData(dt, Nothing, Nothing, Nothing)240End Sub241242Public Sub SetBarData(ByVal dt As DataTable, ByVal title As String)243SetBarData(dt, title, Nothing, Nothing)244End Sub245246Public Sub SetBarData(ByVal dt As DataTable, ByVal title As String, ByVal xAxisTitle As String, ByVal yAxisTitle As String)247248'TABLE内容应为第一列为X轴值,第二列开始为Y轴数值,除非只有一列249250Dim cc As Integer = dt.Columns.Count251Dim rc As Integer = dt.Rows.Count252253If cc = 0Or rc = 0Then Return254255Dim x(rc - 1) As Double256Dim values(rc - 1) As Double257Dim labels(rc - 1) As String258259GraphPane.CurveList.Clear()260GraphPane.GraphObjList.Clear()261If String.IsNullOrEmpty(title) = False Then262GraphPane.Title.Text = title263End If264If String.IsNullOrEmpty(xAxisTitle) Then 265GraphPane.XAxis.Title.Text = xAxisTitle 266End If267If String.IsNullOrEmpty(yAxisTitle) Then 268GraphPane.YAxis.Title.Text = yAxisTitle 269End If270GraphPane.Legend.IsVisible = cc > 1271GraphPane.Legend.Position = LegendPos.Top 272273Dim i%, j%, k%, b%274Dim alone As Boolean = cc = 1275Dim bi As BarItem276277'只有一列的情况下,X轴为序号278For i = 0To rc - 1279If alone Then280labels(i) = i + 1281Else282labels(i) = dt.Rows(i).Item(0)283End If284Next285286If alone Then287For i = 0To rc - 1288x(i) = i + 1289values(i) = dt.Rows(i).Item(0)290Next291bi = GraphPane.AddBar(dt.Columns(0).ColumnName, x, values, Color.Blue)292bi.Bar.Fill = New Fill(Color.Blue, Color.White, Color.Green)293Else294Dim colors() As Color = {Color.Red, Color.Green, Color.Blue, Color.Orange, Color.Purple, Color.Pink}295296For j = 1To dt.Columns.Count - 1297For i = 0To rc - 1298values(i) = dt.Rows(i).Item(j)299Next300k = j - 1301If k >= colors.Length Then302k = j - 1 - colors.Length303End If304bi = GraphPane.AddBar(dt.Columns(j).ColumnName, Nothing, values, colors(k))305bi.Bar.Fill = New Fill(colors(k), Color.White, colors(k))306Next307308For i = 0To bi.Points.Count - 1309Dim pt As PointPair = bi.Points(i)310Dim text As New TextObj(pt.Y.ToString("f2"), pt.X, pt.Y + GraphPane.YAxis.Scale.Max * 0.02, CoordType.AxisXYScale, AlignH.Left, AlignV.Center)311text.ZOrder = ZOrder.A_InFront312text.FontSpec.Size = 9313text.FontSpec.Border.IsVisible = False314text.FontSpec.Fill.IsVisible = False315text.FontSpec.IsItalic = True316GraphPane.GraphObjList.Add(text)317Next318319End If320321GraphPane.Chart.Fill = New Fill(Color.White, Color.FromArgb(255, Color.ForestGreen), 45.0F)322323'GraphPane.XAxis.Scale.TextLabels = labels324GraphPane.XAxis.Type = AxisType.Text325GraphPane.XAxis.Scale.FontSpec.Size = 9326If labels.Length > 4And labels(0).Length > 4Then327GraphPane.XAxis.Scale.FontSpec.Angle = 30328End If329GraphPane.XAxis.IsVisible = True330GraphPane.YAxis.IsVisible = True331GraphPane.YAxis.MajorGrid.IsVisible = True332333GraphPane.AxisChange()334Refresh()335dtSource = dt336337FlowLayoutPanel1.Controls.Clear()338AddButton("Pie", AddressOf btnPie_Click)339AddButton("Curve", AddressOf btnCurve_Click)340341End Sub342343Private Sub AddButton(ByVal text As String, ByVal clickEvent As EventHandler)344Dim btn As New Button345btn.Text = text346AddHandler btn.Click, clickEvent347FlowLayoutPanel1.Controls.Add(btn)348End Sub349350Private Sub btnPie_Click(ByVal sender As Object, ByVal e As System.EventArgs)351If dtSource Is Nothing Then Return352353SetPieData(dtSource, CType(sender, Button).Text)354End Sub355356Private Sub btnCurve_Click(ByVal sender As Object, ByVal e AsSystem.EventArgs)357If dtSource Is Nothing Then Return358359SetCurveData(dtSource, CType(sender, Button).Text)360End Sub361362Private Sub btnBar_Click(ByVal sender As Object, ByVal e AsSystem.EventArgs)363If dtSource Is Nothing Then Return364365SetBarData(dtSource, CType(sender, Button).Text)366End Sub367368Private Sub FinexGraph_Resize(ByVal sender As System.Object, ByVal e As System.EventArgs) Handles MyBase.Resize369GraphPane.AxisChange()370Refresh()371End Sub372End Class注意,我拖了个FlowLayoutPanel1放在控件最上面,放切换图型按钮的调用方法很简单,把它拖到FORM上,然后准备好数据源(datatable),完了调用控件的setxxxdata()方法即可,当然我这里是在GRID的菜单点击后弹出个窗口来显示的。
多维数据图形显示中ZedGraph控件的应用
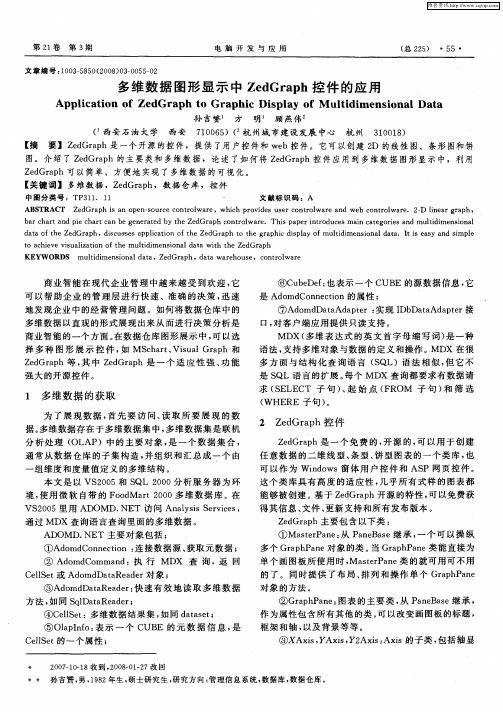
AB TRACT Z d a h i a p n s u c o t o wa e S e Gr p s n o e — o r e c n r l r ,wh c r v d s u e o to wa e a d we o to wa e 2 D i e r g a h, ih p o i e s rc n r l r n b c n r l r . - l a r p n b r c a ta d p ec a tc n b e e a e y t e Z d a h c n r l r .Th s p p r i t o u e i a e o is a d mu t i n in l a h r n i h r a eg n r t d b h e Gr p o t o wa e i a e r d c s ma n c t g re n li me so a n d d t ft e Z d a h,d s u s s a p ia i n o h e Gr p o t e g a h c d s ly o li i n i n ld t .I s e s n i l a a o h e Gr p ic s e p l to ft e Z d a h t h r p i ip a f mu tdme s o a a a ti a y a d smp e c t c iv iu l a i n o h u td me so a a a wih t e Z d a h o a h e e vs a i to f t em li i n in ld t t h e Gr p z KEYW ORDS m u tdm e s o a a a li i n i n ld t ,Ze Gr p d a h,d t r h u e。c n r l r a a wa e o s o t o wa e
zedgraphcontrol用法

ZedGraphControl 是一个用于显示图表的控件,可以用于显示各种类型的图表,包括柱状图、折线图、饼图等。
以下是一些使用ZedGraphControl 的基本方法:1. 添加数据:使用ZedGraphControl 的AddCurve 方法可以添加一条曲线,AddBar 方法可以添加柱状图。
例如:```csharpzedGraphControl1.GraphPane.AddCurve("AD", frameList, Data.adLineColor, SymbolType.None);```2. 设置图表样式:可以使用SetAxisScale 方法设置坐标轴的范围,使用SetTitle 方法设置标题,使用SetLegend 方法设置图例。
例如:```csharpzedGraphControl1.GraphPane.Title.Text = "Spectrogram";zedGraphControl1.GraphPane.XAxis.Title.Text = "WaveLength/nm";zedGraphControl1.GraphPane.YAxis.Title.Text = "Intensity";zedGraphControl1.GraphPane.XAxis.Scale.Min = 0; // X轴最小值0 x轴的两边留出一定余量zedGraphControl1.GraphPane.XAxis.Scale.Max = 512; // X轴最大值512 MainWindow.waveData[512] + 3;zedGraphControl1.GraphPane.YAxis.Scale.Min = 0; // Y轴最小值0 y轴的数据从波形取得,所以设置为0```3. 设置交互:可以使用ZedGraphControl 的IsZoomOnMouseCenter 和IsShowPointValues 属性来设置鼠标滚轮缩放和平滑显示点值。
initialize_graph()语法
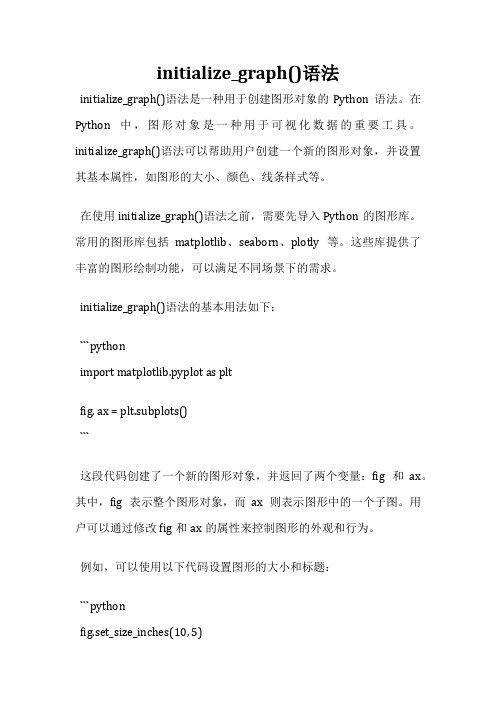
initialize_graph()语法initialize_graph()语法是一种用于创建图形对象的Python语法。
在Python中,图形对象是一种用于可视化数据的重要工具。
initialize_graph()语法可以帮助用户创建一个新的图形对象,并设置其基本属性,如图形的大小、颜色、线条样式等。
在使用initialize_graph()语法之前,需要先导入Python的图形库。
常用的图形库包括matplotlib、seaborn、plotly等。
这些库提供了丰富的图形绘制功能,可以满足不同场景下的需求。
initialize_graph()语法的基本用法如下:```pythonimport matplotlib.pyplot as pltfig, ax = plt.subplots()```这段代码创建了一个新的图形对象,并返回了两个变量:fig和ax。
其中,fig表示整个图形对象,而ax则表示图形中的一个子图。
用户可以通过修改fig和ax的属性来控制图形的外观和行为。
例如,可以使用以下代码设置图形的大小和标题:```pythonfig.set_size_inches(10, 5)fig.suptitle('My Graph')```这段代码将图形的大小设置为10英寸×5英寸,并设置了图形的标题为“My Graph”。
除了设置图形的基本属性外,initialize_graph()语法还可以用于绘制不同类型的图形。
例如,可以使用以下代码绘制一个简单的折线图:```pythonimport numpy as npx = np.linspace(0, 10, 100)y = np.sin(x)ax.plot(x, y)```这段代码使用numpy库生成了一组x和y的数据,并使用ax.plot()方法将数据绘制成折线图。
用户可以根据自己的需求修改数据和绘图参数,以获得不同类型的图形。
ZedGraph绘制统计图浓缩教程
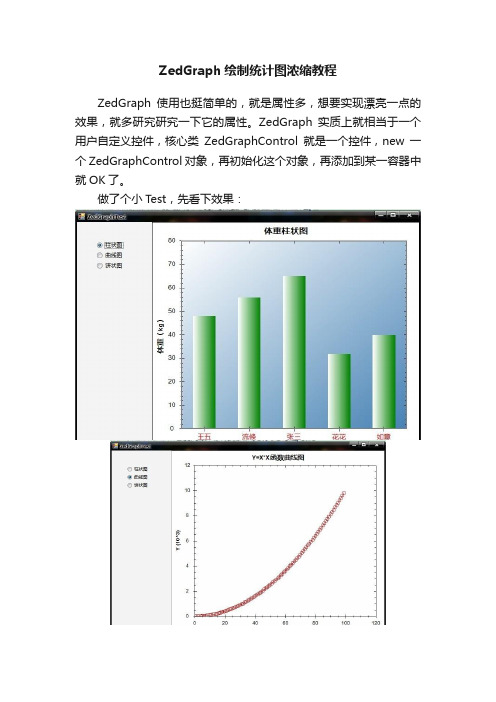
ZedGraph绘制统计图浓缩教程ZedGraph使用也挺简单的,就是属性多,想要实现漂亮一点的效果,就多研究研究一下它的属性。
ZedGraph实质上就相当于一个用户自定义控件,核心类ZedGraphControl就是一个控件,new一个ZedGraphControl对象,再初始化这个对象,再添加到某一容器中就OK了。
做了个小Test,先看下效果:怎么样,效果很漂亮吧,其实代码精简起来很简单,其他图形效果大家就自己研究吧!using System;using System.Collections.Generic;using ponentModel;using System.Data;using System.Drawing;using System.Linq;using System.Text;using System.Windows.Forms;using ZedGraph;namespace WindowsFormsApplication2{public partial class Form1 : Form{public Form1()InitializeComponent();}private void DrawCurve(){ZedGraphControl zgc = new ZedGraphControl();GraphPane myPane = zgc.GraphPane;myPane.Title.Text = "Y=X*X函数曲线图";myPane.XAxis.Title.Text = "X";myPane.YAxis.Title.Text = "Y";myPane.Border = new Border(Color.Gray, 2.0F);PointPairList list = new PointPairList();for (int x = 0; x < 100; x++){list.Add((double)x, (double)(x * x));}LineItem myCurve = myPane.AddCurve("", list, Color.Red, SymbolType.Default);zgc.AxisChange();splitContainer1.Panel2.Controls.Clear();splitContainer1.Panel2.Controls.Add(zgc);zgc.Width = this.Width;zgc.Height = this.Height;zgc.Dock = DockStyle.Fill;}private void DrawPie()ZedGraphControl zgc = new ZedGraphControl();GraphPane myPane = zgc.GraphPane;myPane.Title.Text = "人员缺勤比例饼形图";myPane.Border = new Border(Color.Gray, 2.0F);PieItem segment1 = myPane.AddPieSlice(20, Color.Navy, Color.White, 45f, 0, "小华");PieItem segment2 = myPane.AddPieSlice(40, Color.SandyBrown, Color.White, 45f, 0.0, "张三");PieItem segment3 = myPane.AddPieSlice(30, Color.Purple, Color.White, 45f, .0, "王五");PieItem segment4 = myPane.AddPieSlice(10.21, Color.LimeGreen, Color.White, 45f, 0, "李四");PieItem segment6 = myPane.AddPieSlice(250, Color.Red, Color.White, 45f, 0, "小明");PieItem segment7 = myPane.AddPieSlice(50, Color.Blue, Color.White, 45f, 0.0, "流倏");PieItem segment8 = myPane.AddPieSlice(400, Color.Green, Color.White, 45f, 0, "花花");PieItem segment9 = myPane.AddPieSlice(50, Color.Yellow, Color.White, 45f, 0.0, "如意");zgc.AxisChange();splitContainer1.Panel2.Controls.Clear();splitContainer1.Panel2.Controls.Add(zgc);zgc.Width = this.Width;zgc.Height = this.Height;zgc.Dock = DockStyle.Fill;}private void DrawBar(){ZedGraphControl zgc = new ZedGraphControl();GraphPane myPane = zgc.GraphPane;myPane.Title.Text = "体重柱状图";myPane.XAxis.Title.Text = "姓名";myPane.YAxis.Title.Text = "体重(kg)";double[] y = { 48, 56, 65, 32, 40 };string[] str = { "王五", "流倏", "张三", "花花", "如意" };myPane.XAxis.Type = AxisType.Text;myPane.XAxis.Scale.TextLabels = str;myCurve.Bar.Border.IsVisible = false;myPane.Chart.Fill = new Fill(Color.White, Color.SteelBlue, 45.0f);myPane.Chart.Border.Color = Color.Gray;myPane.Chart.Border.Width = 2.0F;myPane.XAxis.Scale.FontSpec.FontColor = Color.Red;BarItem myCurve = myPane.AddBar("", null, y, Color.Green);zgc.AxisChange();splitContainer1.Panel2.Controls.Clear();splitContainer1.Panel2.Controls.Add(zgc);zgc.Width = this.Width;zgc.Height = this.Height;zgc.Dock = DockStyle.Fill;private void rdo_CheckedChanged(object sender, EventArgs e){if (rdoCurve.Checked == true)DrawCurve();if (rdoPie.Checked == true)DrawPie();if (rdoBar.Checked == true)DrawBar();}private void Form1_Load(object sender, EventArgs e){DrawPie();}}}。
ZedGraph图形控件在Web开发中的应用
击 Bo s 按钮 , r e w 定位到 Zd r h b l eGa . .l p We d 程序集文 件( 本文 中使用 的是 zdr h d _51 . o 。在解 eg p_ l v.28 ) a l . 8 决方案浏览器中右击项 目, 选择 N w Fl r e o e, d 命名为 Zd r hm gsZ d r h 用此文件夹存放呈 现 eGa I ae,eGa 使 p p 到客户端的图片 , 必须添加这个文件夹。
应 用到 We b开发 中。
关键 词 : e G a h图形控件 ; b开发 ; 线 图 ; Z d rp We 折 柱状 图
1 技 术 背 景
Tobx面板 的空 白处 单 击 鼠标 右 键 ,选 择 C os olo hoe I ms , 弹 出 的 C os olo t 对 话框 中单 t … 在 e hoeTobxI ms e
,
Da C r ( r uv 针对基数样条 ) Da B z r 前者开 w e 和 r e e 等。 w i 发 比较方便 , 但浏览时需要用户下载 A t e c vX插件 , i 而这个往往是忌讳的, 插件带毒 。后者需要绘图、 生 成 图片 的类 库 , 编程 代码 量 较 大 , 现起 来 较麻 烦 。 实
41 引人命名 空 间 .
‘
在 D fut sx S e lap . 文件 中 ,为 了使 用 Z d rp a . C eG ah
和数据源 提供 的服务 ,需 要 引入 它 们 的 名字控 件 , 括 uigSs m,rwn ;s gZ d rp ;s g 包 s yt D a igui eGah ui n e n n
ZedGraph一些参数的含义
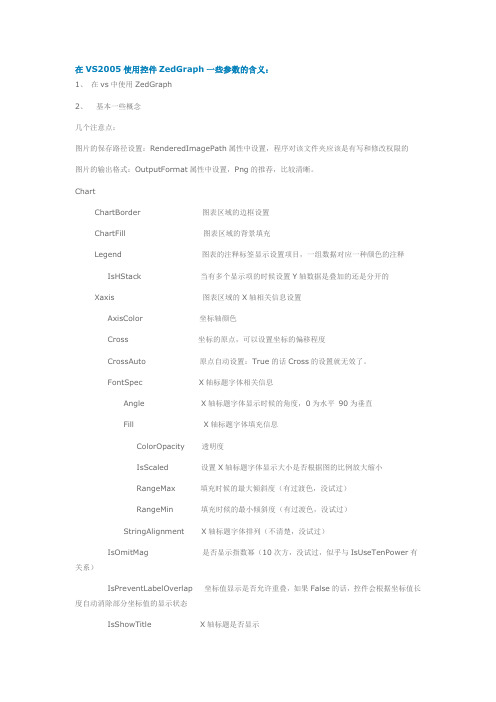
在VS2005使用控件ZedGraph一些参数的含义:1、在vs中使用ZedGraph2、基本一些概念几个注意点:图片的保存路径设置:RenderedIm agePath属性中设置,程序对该文件夹应该是有写和修改权限的图片的输出格式:OutputFormat属性中设置,Png的推荐,比较清晰。
ChartChartBorder 图表区域的边框设置ChartFill 图表区域的背景填充Legend 图表的注释标签显示设置项目,一组数据对应一种颜色的注释IsHStack 当有多个显示项的时候设置Y轴数据是叠加的还是分开的Xaxis 图表区域的X轴相关信息设置AxisColor 坐标轴颜色Cross 坐标的原点,可以设置坐标的偏移程度CrossAuto 原点自动设置:True的话Cross的设置就无效了。
FontSpec X轴标题字体相关信息Angle X轴标题字体显示时候的角度,0为水平90为垂直Fill X轴标题字体填充信息ColorOpacity 透明度IsScaled 设置X轴标题字体显示大小是否根据图的比例放大缩小RangeMax 填充时候的最大倾斜度(有过渡色,没试过)RangeMin 填充时候的最小倾斜度(有过渡色,没试过)StringAlignment X轴标题字体排列(不清楚,没试过)IsOmitMag 是否显示指数幂(10次方,没试过,似乎与IsUseTenPower有关系)IsPreventLabelOverlap 坐标值显示是否允许重叠,如果False的话,控件会根据坐标值长度自动消除部分坐标值的显示状态IsShowTitle X轴标题是否显示IsTicsBetweenLabels 两个坐标值之间是否自动显示分隔标志IsUseTenPower 是否使用10次幂指数IsVisible 是否显示X轴IsZeroLine 当数据为0时候是否显示(在饼状图显示的时候有用)MajorGrid 大跨度的X轴表格虚线线显示信息DashOff 虚线中孔间距DashOn 虚线单位长度MajorTic 大跨度的X轴刻度信息IsInside 在Chart内部是否显示IsOutSide 在Chart外部是否显示IsOpposite 在对面的轴上是否显示MinorGrid 小跨度的X轴表格虚线显示信息MinorTic 小跨度的x轴刻度信息MinSpace 刻度和轴之间的距离(没试过)Scale 刻度值的一些设定IsReverse X轴的刻度值从高到低还是从低到高MajorStep 大刻度步长MajorStepAuto 是否自动设置大刻度步长MajorUnit 大刻度步长单位Max 刻度最大值MaxAuto 根据输入数据自动设置刻度最大值Min 刻度最小值MinAuto 根据输入数据自动设置刻度最小值MinGrace 不清楚,没试过MinorStep 小刻度步长MinorStepAuto 是否自动设置小刻度步长MinorUnit 小刻度单位Type 数据显示方式Liner直接现实(自动)Date按日期方式显示Log 按指数幂方式显示Ordinal顺序显示Y2Axis 第二个Y轴坐标信息显示(具体设置看X轴)Yaxis 第一个Y轴坐标信息显示(具体设置看X轴)GraphPaneBarBase 在生成柱状图的时候设置柱状是基于X轴还是其他轴BarType 柱状的类型叠加或其他。
用ZedGraph控件画统计分析图
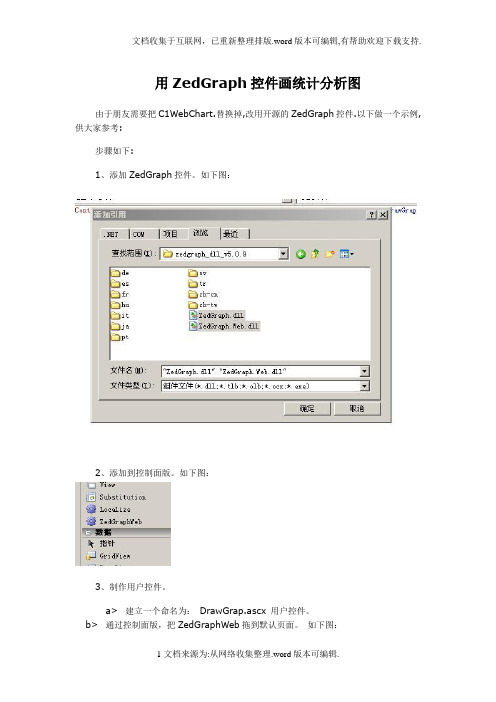
用ZedGraph控件画统计分析图由于朋友需要把C1WebChart.替换掉,改用开源的ZedGraph控件.以下做一个示例,供大家参考:步骤如下:1、添加ZedGraph控件。
如下图:2、添加到控制面版。
如下图:3、制作用户控件。
a> 建立一个命名为:DrawGrap.ascx 用户控件。
b> 通过控制面版,把ZedGraphWeb拖到默认页面。
如下图:c> 生成代码(DrawGrap.ascx)如下:<%@ Control Language="C#" AutoEventWireup="true" CodeFile="" Inherits="DrawG rap" %><%@ Register T agPrefix="zgw" Namespace="ZedGraph.Web" Assembly="ZedGraph.Web " %><ZGW:ZEDGRAPHWEB id="zedGraphControl" runat="server" width="500" Height="375 " RenderMode="ImageT ag"/>d> 生成代码(using System;using System.Data;using System.Configuration;using System.Collections;using System.Web;using ;using ;using ;using ;using ;using System.Drawing;using ZedGraph;using ZedGraph.Web;using ;///<summary>///显示统计图形类型///</summary>public enum AnalyticsType {Line, //折线图Bar, //柱状图Pie //饼图};public partial class DrawGrap : {Private AttributePublic Propertyprotected void Page_Load(object sender, EventArgs e) {zedGraphControl.RenderGraph += new ;}private void InitDefaultColors(){defaultColors.Add(Color.Red);defaultColors.Add(Color.Green);defaultColors.Add(Color.Blue);defaultColors.Add(Color.Yellow);defaultColors.Add(Color.YellowGreen);defaultColors.Add(Color.Brown);defaultColors.Add(Color.Aqua);defaultColors.Add(Color.Cyan);defaultColors.Add(Color.DarkSeaGreen);defaultColors.Add(Color.Indigo);}///<summary>///如果属性为空则初始化属性数据///</summary>private void InitProperty(){InitDefaultColors();if (string.IsNullOrEmpty(Title)){Title = "未命名统计图";}if (string.IsNullOrEmpty(XAxisTitle)) {XAxisTitle = "横轴";}if (string.IsNullOrEmpty(YAxisTitle)) {YAxisTitle = "纵轴";}if (Type == AnalyticsType.Pie){Count = ScaleData.Count;}else{Count = DataSource.Count;}if (Colors.Count == 0 || Colors.Count != Count) {Random r = new Random();int tempIndex = 0;List<int> tempIndexList = new List<int>();for (int i = 0; i < Count; i++){tempIndex = r.Next(defaultColors.Count);if (tempIndexList.Contains(tempIndex)) {i--;}else{tempIndexList.Add(tempIndex);Colors.Add(defaultColors[tempIndex]); }}}if (NameList.Count == 0){if (Type == AnalyticsType.Bar){for (int i = 0; i < DataSource[0].Count; i++) {NameList.Add("第" + i.ToString() + "组"); }}else{for (int i = 0; i < Count; i++){NameList.Add("第" + i.ToString() + "组"); }}}if (LabelList.Count == 0){for (int i = 0; i < Count; i++){LabelList.Add("含义" + i.ToString());}}}///<summary>///画图///</summary>///<param name="webObject"></param>///<param name="g"></param>///<param name="pane"></param>private void zedGraphControl_RenderGraph( webObject, g, ZedGraph.MasterPane p ane){InitProperty();GraphPane myPane = pane[0];= Title;= XAxisTitle;= YAxisTitle;//if (true)//{// DrawMessage(myPane, "yiafdhaskjhfasfksahfasdlhfaslf lasgfasglgsadi");// pane.AxisChange(g);// return;//}switch (Type){case AnalyticsType.Line: DrawLine(myPane);break;case AnalyticsType.Bar: DrawBar(myPane);break;case AnalyticsType.Pie: DrawPie(myPane);break;default:break;}pane.AxisChange(g);}Draw}e> 用户控件制作完成。
ZedGraph控件属性及基础教程详解
ArrayList types = new ArrayList(); types.Add( type ); types.Add( type2 ); Init( description, title, types ); } public DemoBase( string description, string title, ICollection types ) { Init( description, title, types ); } private void Init( string description, string title, ICollection types ) { this.description = description; this.title = title; this.types = types; control = new ZedGraphControl(); } 函数中的变量含义如下: Description:对此结构的描述。 Title:在树形结构(TreeView)中显示的标题。 Types:要把此类显示在哪个树形结构的区域中。若有多个 Types,则把此类分入不同的树形区域中。例如 MasterPane Sample 在 Tutori al Sample 和 Special Features 两个区域都有。见图中的相应区域标注。
C# ZedGraph实时柱图(总结)
建一个winform项目,将ZedGraph.dll添加到bin里,这样就可以调用它的方法了.打开winform设计界面,从工具箱上拖一个zedGraphControl控件进来(注:这里须要你先将zedgraph的控件都添加进来的哦).我们先声时一个静态的全局变量和一个全局方法:private static int num = 1;public double[] getArrvalues(){double[] arr ={ 100, 135, 115, 125, 75, 120 };arr[0] += num;arr[1] += num * 2;arr[2] += num * 3;arr[3] += num * 4;arr[4] += num * 5;arr[5] += num * 6;num++;return arr;}然后把下面这段代码加到Form_Load里面:this.zedGraphControl1.GraphPane.Title.Text = "快乐男声实时投票显示";this.zedGraphControl1.GraphPane.XAxis.Title.Text = "选手";this.zedGraphControl1.GraphPane.YAxis.Title.Text = "票数";this.zedGraphControl1.GraphPane.XAxis.Type = ZedGraph.AxisType.DateAsOrdinal;double[] arrValues = getArrvalues();string[] xtitles = { "王栎鑫", "吉杰", "魏晨", "苏醒", "张杰", "陈楚生" };BarItem myBar = this.zedGraphControl1.GraphPane.AddBar("票数", null, arrValues, Color.Red);myBar.Bar.Fill = new Fill(Color.Red, Color.White, Color.Red);myBar.Bar.Border.Color = Color.Transparent;this.zedGraphControl1.GraphPane.XAxis.Scale.TextLabels = xtitles;this.zedGraphControl1.GraphPane.XAxis.Scale.FontSpec.Size = 10f;this.zedGraphControl1.GraphPane.XAxis.Scale.FontSpec.FontColor = Color.Blue;this.zedGraphControl1.AxisChange();this.zedGraphControl1.GraphPane.XAxis.Type = AxisType.Text;运行,这时你可以看到静态的柱图显示.那如何动态显示数据呢?在Winform里面,我们可用Timer控件,也可以用多线程,这里我用的是Timer控件.从工具箱里面拖一个Tmier控件到Form窗体,然后将其Enable置为true,在其timer1_Tick事件里面加入下面代码(注:这里大家一般是实时读取数据库作为柱图的数据源):double[] arrValues = getArrvalues();// Shift the text items up by 5 user scale units above the barsstring[] xtitles = { "王栎鑫", "吉杰", "魏晨", "苏醒", "张杰", "陈楚生" };const float shift = 5;this.zedGraphControl1.GraphPane.YAxis.Scale.MaxAuto = false;this.zedGraphControl1.GraphPane.YAxis.Scale.Max = 10000;this.zedGraphControl1.GraphPane.YAxis.Scale.Min = 0;this.zedGraphControl1.GraphPane.YAxis.Scale.MinorStep = 1;this.zedGraphControl1.GraphPane.YAxis.Color = Color.Transparent;this.zedGraphControl1.GraphPane.Chart.Fill = new Fill(Color.White, Color.Green, 45.0F);this.zedGraphControl1.GraphPane.YAxis.IsVisible = false;for (int i = 0; i < arrValues.Length; i++){// format the label string to have 1 decimal placestring lab = arrValues[i].ToString();// create the text item (assumes the x axis is ordinal or text)// for negative bars, the label appears just above the zero valueTextObj text = new TextObj(lab, (float)(i + 1), (float)(arrValues[i] < 0 ? 0.0 : arrValues[i]) + shift);// tell Zedgraph to use user scale units for locating the TextObjtext.Location.CoordinateFrame = CoordType.AxisXYScale;// AlignH the left-center of the text to the specified pointtext.Location.AlignH = AlignH.Center;text.Location.AlignV = AlignV.Center;text.FontSpec.Border.IsVisible = false;text.FontSpec.Fill.IsVisible = false;// rotate the text 90 degreestext.FontSpec.Angle = 0;// add the TextObj to the listthis.zedGraphControl1.GraphPane.GraphObjList.Add(text);}BarItem myBar = this.zedGraphControl1.GraphPane.AddBar(null, null, arrValues, Color.Red);myBar.Bar.Fill = new Fill(Color.Red, Color.White, Color.Red);myBar.Bar.Border.Color = Color.Transparent;this.zedGraphControl1.GraphPane.XAxis.Scale.TextLabels = xtitles;this.zedGraphControl1.GraphPane.XAxis.Scale.FontSpec.Size = 4.5f;this.zedGraphControl1.GraphPane.BarSettings.Type = BarType.Overlay;this.zedGraphControl1.GraphPane.XAxis.Type = AxisType.Text;int num = 0;num = this.zedGraphControl1.GraphPane.GraphObjList.Count;this.zedGraphControl1.GraphPane.GraphObjList.RemoveRange(0, num - 6);this.zedGraphControl1.AxisChange();this.zedGraphControl1.Refresh();运行后,你就可以看到动态显示的柱图了,是不是很简单?。
在WPF中使用WinForm控件
在WPF中使用WinForm控件方法:下面以在Wpf中添加ZedGraph(用于创建任意数据的二维线型、条型、饼型图表的一个开源类库)控件,说明在WPF中使用Winform控件的方法。
1、首先添加对如下两个dll文件的引用:WindowsFormsIntegration.dll,System.Windows.Forms.dll。
2、由于要用到ZedGraph控件,所以也要添加对ZedGraph.dll的引用。
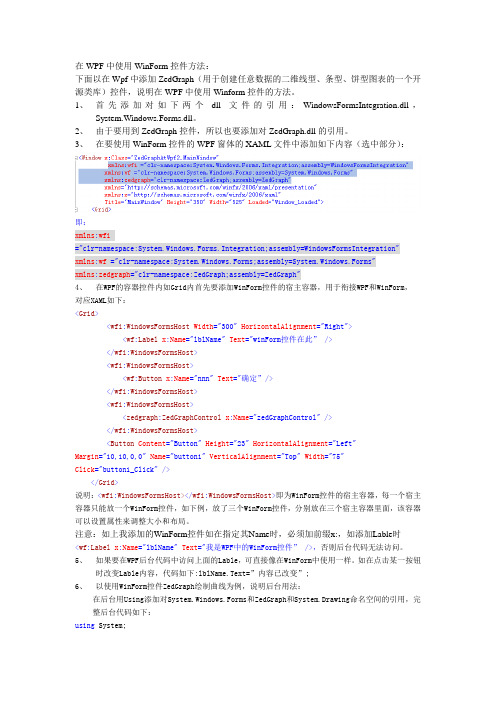
3、在要使用WinForm控件的WPF窗体的XAML文件中添加如下内容(选中部分):即:xmlns:wfi ="clr-namespace:System.Windows.Forms.Integration;assembly=WindowsFormsIntegration" xmlns:wf ="clr-namespace:System.Windows.Forms;assembly=System.Windows.Forms"xmlns:zedgraph="clr-namespace:ZedGraph;assembly=ZedGraph"4、在WPF的容器控件内如Grid内首先要添加WinForm控件的宿主容器,用于衔接WPF和WinForm,对应XAML如下:<Grid><wfi:WindowsFormsHost Width="300" HorizontalAlignment="Right"><wf:Label x:Name="lblName" Text="winForm控件在此” /></wfi:WindowsFormsHost><wfi:WindowsFormsHost><wf:Button x:Name="nnn" Text="确定”/></wfi:WindowsFormsHost><wfi:WindowsFormsHost><zedgraph:ZedGraphControl x:Name="zedGraphControl" /></wfi:WindowsFormsHost><Button Content="Button" Height="23" HorizontalAlignment="Left" Margin="10,10,0,0"Name="button1" VerticalAlignment="Top" Width="75" Click="button1_Click" /></Grid>说明:<wfi:WindowsFormsHost></wfi:WindowsFormsHost>即为WinForm控件的宿主容器,每一个宿主容器只能放一个WinForm控件,如下例,放了三个WinForm控件,分别放在三个宿主容器里面,该容器可以设置属性来调整大小和布局。
ZedGraph 控件使用示例源代码
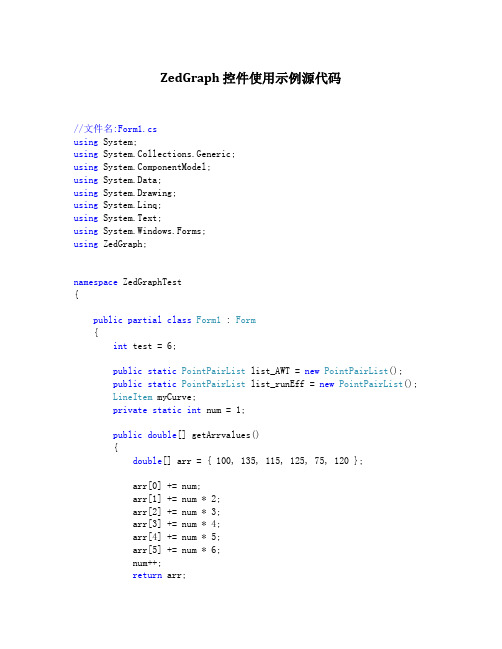
ZedGraph 控件使用示例源代码//文件名:Form1.csusing System;using System.Collections.Generic;using ponentModel;using System.Data;using System.Drawing;using System.Linq;using System.Text;using System.Windows.Forms;using ZedGraph;namespace ZedGraphTest{public partial class Form1 : Form{int test = 6;public static PointPairList list_AWT = new PointPairList();public static PointPairList list_runEff = new PointPairList();LineItem myCurve;private static int num = 1;public double[] getArrvalues(){double[] arr = { 100, 135, 115, 125, 75, 120 };arr[0] += num;arr[1] += num * 2;arr[2] += num * 3;arr[3] += num * 4;arr[4] += num * 5;arr[5] += num * 6;num++;return arr;}public Form1(){InitializeComponent();// zedGraphControl1//this.zedGraphControl1.Location = new System.Drawing.Point(12, 12); = "zedGraphControl1";this.zedGraphControl1.ScrollGrace = 0;this.zedGraphControl1.ScrollMaxX = 0;this.zedGraphControl1.ScrollMaxY = 0;this.zedGraphControl1.ScrollMaxY2 = 0;this.zedGraphControl1.ScrollMinX = 0;this.zedGraphControl1.ScrollMinY = 0;this.zedGraphControl1.ScrollMinY2 = 0;this.zedGraphControl1.Size = new System.Drawing.Size(647, 444);this.zedGraphControl1.TabIndex = 0;double[] db = getArrvalues();for (int i = 0; i < db.Length; i++){list_AWT.Add(i, db[i]);list_runEff.Add(i, db[i]*1.5);}}private void ZedG_Load(object sender, EventArgs e){this.zedGraphControl1.GraphPane.Title.Text = "楼市运行参数";//图表主标题this.zedGraphControl1.GraphPane.XAxis.Title.Text = "时间";//X轴标题this.zedGraphControl1.GraphPane.YAxis.Title.Text = "楼价";//Y轴标题this.zedGraphControl1.GraphPane.Y2Axis.Title.Text = "楼盘数量";//Y2轴标题//this.zedGraphControl1.GraphPane.XAxis.Type =AxisType.Ordinal; //x轴的最小刻度更变大一点,其他功能变化也很大myCurve = zedGraphControl1.GraphPane.AddCurve("AA", list_AWT, Color.Red, SymbolType.None);myCurve.Symbol.Fill = new Fill(Color.Red);myCurve = zedGraphControl1.GraphPane.AddCurve("BB",list_runEff, Color.Blue, SymbolType.None);myCurve.Symbol.Fill = new Fill(Color.Blue);myCurve.IsY2Axis = true; //true to assign the curveto the Y2Axis, false to assign the curve to the YAxis/////////////////////////////////////////////////////////////////this.zedGraphControl1.GraphPane.XAxis.MajorGrid.IsVisible = true; //x轴上竖着的虚线this.zedGraphControl1.GraphPane.YAxis.Scale.FontSpec.FontColor =Color.Red;this.zedGraphControl1.GraphPane.YAxis.Title.FontSpec.FontColor =Color.Red; //y轴的title和刻度变成红色this.zedGraphControl1.GraphPane.YAxis.MajorTic.IsOpposite = false;this.zedGraphControl1.GraphPane.YAxis.MinorTic.IsOpposite = false; //??????this.zedGraphControl1.GraphPane.YAxis.MajorGrid.IsZeroLine = false; // Don't display the Y zero linethis.zedGraphControl1.GraphPane.YAxis.Scale.Align =AlignP.Inside; //??????this.zedGraphControl1.GraphPane.YAxis.Scale.Min = 60;this.zedGraphControl1.GraphPane.YAxis.Scale.Max = 150;//////////////////////////////////////////////////////////////////////// /////this.zedGraphControl1.GraphPane.Y2Axis.IsVisible = true; this.zedGraphControl1.GraphPane.Y2Axis.Scale.FontSpec.FontColor =Color.Blue;this.zedGraphControl1.GraphPane.Y2Axis.Title.FontSpec.FontColor = Color.Blue;this.zedGraphControl1.GraphPane.Y2Axis.MajorTic.IsOpposite = false;this.zedGraphControl1.GraphPane.Y2Axis.MinorTic.IsOpposite = false; //??????this.zedGraphControl1.GraphPane.Y2Axis.MajorGrid.IsVisible = true; //y轴上横着的虚线this.zedGraphControl1.GraphPane.Y2Axis.Scale.Align = AlignP.Inside; //??????this.zedGraphControl1.GraphPane.Y2Axis.Scale.Min = 0;this.zedGraphControl1.GraphPane.Y2Axis.Scale.Max = 200;this.zedGraphControl1.GraphPane.Chart.Fill = newFill(Color.White, Color.LightGray, 45.0f);// Fill the axis background with a gradient//////////////////////////////////////////////////////////////////////// ///////////// Add a text box with instructionsTextObj text = new TextObj("Zoom: left mouse & drag\nPan: middle mouse &drag\nContext Menu: right mouse",0.05f, 0.95f, CoordType.ChartFraction, AlignH.Left, AlignV.Bottom);text.FontSpec.StringAlignment = StringAlignment.Near;this.zedGraphControl1.GraphPane.GraphObjList.Add(text);// Enable scrollbars if neededzedGraphControl1.IsShowHScrollBar = true;zedGraphControl1.IsShowVScrollBar = true;zedGraphControl1.IsAutoScrollRange = true;zedGraphControl1.IsScrollY2 = true;SetSize();this.zedGraphControl1.AxisChange();this.zedGraphControl1.Refresh();}private void ZedG_Resize(object sender, EventArgs e) //改变窗体大小时发生{SetSize();}private void SetSize(){zedGraphControl1.Location = new Point(10, 10);// Leave a small margin around the outside of the control zedGraphControl1.Size = new Size(this.ClientRectangle.Width - 20,this.ClientRectangle.Height - 20);}public void refreshAll(){if (zedGraphControl1.GraphPane != null){zedGraphControl1.GraphPane.XAxis.Scale.MaxAuto = true;this.zedGraphControl1.AxisChange();this.zedGraphControl1.Refresh(); //强制控件使其工作区无效并立即重绘自己和任何子控件}}private void button1_Click(object sender, EventArgs e){list_runEff.Add(test++, 100+test);refreshAll();}}}//文件名:Form1.Design.csnamespace ZedGraphTest{partial class Form1{///<summary>///必需的设计器变量。
- 1、下载文档前请自行甄别文档内容的完整性,平台不提供额外的编辑、内容补充、找答案等附加服务。
- 2、"仅部分预览"的文档,不可在线预览部分如存在完整性等问题,可反馈申请退款(可完整预览的文档不适用该条件!)。
- 3、如文档侵犯您的权益,请联系客服反馈,我们会尽快为您处理(人工客服工作时间:9:00-18:30)。
2 / 33
ZedGraph 属性及基础教程
基本教程篇--第一节:InitialSampleDemo.cs 介绍
为了讲解方便,我先附上源代码和效果图。
代码如下: using System; using System.Drawing; using System.Collections; using ZedGraph; namespace ZedGraph.Demo { ///<summary> /// Summary description for SimpleDemo. ///</summary> public class InitialSampleDemo : DemoBase { public InitialSampleDemo() : base( "Code Project Initial Sample","Initial Sample", DemoType.Tutorial ) { GraphPane myPane = base.GraphPane; // Set the title and axis labels 3 / 33
5 / 33
ZedGraph 属性及基础教程
myPane.Title = "My Test Graph\n(For CodeProject Sample)"; myPane.XAxis.Title = "My X Axis"; myPane.YAxis.Title = "My Y Axis"; 分别指定这个 Pane 的 title、XAxis 和 YAxis 的标题。见上图。 PointPairList list1 = new PointPairList(); PointPairList list2 = new PointPairList(); for ( int i=0; i<36; i++ ) { double x = (double) i + 5; double y1 = 1.5 + Math.Sin( (double) i * 0.2 ); double y2 = 3.0 * ( 1.5 + Math.Sin( (double) i * 0.2 ) ); list1.Add( x, y1 ); list2.Add( x, y2 ); } PointPairList 类是一个集合类,继承自 System.Object System.Collections.CollectionBase ZedGraph.CollectionPlus 它是 PointPair 对象的集合,PointPair 类是一个包含(X,Y)的坐标类。 6 / 33
是否自动设置大刻度步长 大刻度步长单位 刻度最大值 根据输入数据自动设置刻度最大值 刻度最小值 根据输入数据自动设置刻度最小值 不清楚,没试过 小刻度步长 是否自动设置小刻度步长 小刻度单位 数据显示方式 Liner 直接现实(自动) Date 按日期方式显示 Log 按指数幂方式显示 Ordinal 顺序显示 第二个 Y 轴坐标信息显示(具体设置看 X 轴) 第一个 Y 轴坐标信息显示(具体设置看 X 轴) 在生成柱状图的时候设置柱状是基于 X 轴还是其他轴 柱状的类型叠加或其他。 图比例变化时候图表上的文字是否跟着自动缩放 是否忽略初始值 是否忽略缺省值 图比例变化时候图表上的画笔的粗细是否跟着自动缩放 图表标题是否显示 Pane 的一些填充信息 缩放比例基数(可以试试效果) 未测试过。不知道如何和数据库绑定 不清楚干吗用的 是否允许自动绘图(没试过,一般都 true,动态绘图) Cache 保存时间 0 输出格式 输出路径 输出模式,不太清楚一般都是 ImageTag,另一个输出的是乱码不是图片
1 / 33
ZedGraph 属性及基础教程
MajorStepAuto MajorUnit Max MaxAuto Min MinAuto MinGrace MinorStep MinorStepAuto MinorUnit Type
Y2Axis Yaxis GraphPane BarBase BarType IsFontsScaled IsIgnoreInitial IsIgnoreMissing IsPenWidthScaled IsShowTitle PaneFill MasterPane BaseDimension 数据 外观 IsImageMap 行为 AxisChaneged CacheDuration OutputFormat RenderedImagePath RenderMode
ZedGraph 属性及基础教程 myPane.Title = "My Test Graph\n(For CodeProject Sample)"; myPane.XAxis.Title = "My X Axis"; myPane.YAxis.Title = "My Y Axis";
// Make up some data arrays based on the Sine function PointPairList list1 = new PointPairList(); PointPairList list2 = new PointPairList(); for ( int i=0; i<36; i++ ) { double x = (double) i + 5; double y1 = 1.5 + Math.Sin( (double) i * 0.2 ); double y2 = 3.0 * ( 1.5 + Math.Sin( (double) i * 0.2 ) ); list1.Add( x, y1 ); list2.Add( x, y2 ); } // Generate a red curve with diamond // symbols, and "Porsche" in the legend LineItem myCurve = myPane.AddCurve( "Porsche",list1, Color.Red, SymbolType.Diamond ); // Generate a blue curve with circle // symbols, and "Piper" in the legend LineItem myCurve2 = myPane.AddCurve( "Piper",list2, Color.Blue, SymbolType.Circle ); base.ZedGraphControl.AxisChange(); } } } 我们可以看到,InitialSampleDemo 继承自 CemoBase 类,而 DemoBase 又继承自 ZedGraphDemo 这个接口。ZedGraphDe mo 接口定义了 String Description、String Title、ZedGraph. ZedGraphControl ZedGraphControl 和 System.Collection.IColl ection Types 这四个属性。DemoBase 除了实现这四个属性外,还添加了 PaneBase Pane 和 MasterPane MasterPane 这两个属性, 此外 DemoBase 还实现了多载构造函数。关于各个类的具体含义和用法,我会在以后的篇幅中陆续介绍。这里只是给大家一个整体的大致结 构。 下面进行对代码的分析,由于这是第一个例子,所有我会讲得比较细,以后的例子就不会了。 我们可以看到程序首先 4 / 33
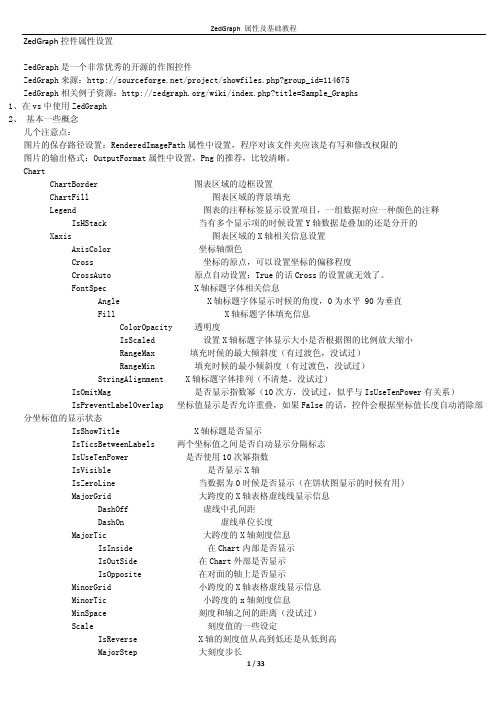
ZedGraph 属性及基础教程
ZedGraph 控件属性设置 ZedGraph 是一个非常优秀的开源的作图控件 ZedGraph 来源:/project/showfiles.php?group_id=114675 ZedGraph 相关例子资源:/wiki/index.php?title=Sample_Graphs 1、在 vs 中使用 ZedGraph 2、 基本一些概念 几个注意点: 图片的保存路径设置:RenderedImagePath 属性中设置,程序对该文件夹应该是有写和修改权限的 图片的输出格式:OutputFormat 属性中设置,Png 的推荐,比较清晰。 Chart ChartBorder 图表区域的边框设置 ChartFill 图表区域的背景填充 Legend 图表的注释标签显示设置项目,一组数据对应一种颜色的注释 IsHStack 当有多个显示项的时候设置 Y 轴数据是叠加的还是分开的 Xaxis 图表区域的 X 轴相关信息设置 AxisColor 坐标轴颜色 Cross 坐标的原点,可以设置坐标的偏移程度 CrossAuto 原点自动设置:True 的话 Cross 的设置就无效了。 FontSpec X 轴标题字体相关信息 Angle X 轴标题字体显示时候的角度,0 为水平 90 为垂直 Fill X 轴标题字体填充信息 ColorOpacity 透明度 IsScaled 设置 X 轴标题字体显示大小是否根据图的比例放大缩小 RangeMax 填充时候的最大倾斜度(有过渡色,没试过) RangeMin 填充时候的最小倾斜度(有过渡色,没试过) StringAlignment X 轴标题字体排列(不清楚,没试过) IsOmitMag 是否显示指数幂(10 次方,没试过,似乎与 IsUseTenPower 有关系) IsPreventLabelOverlap 坐标值显示是否允许重叠,如果 False 的话,控件会根据坐标值长度自动消除部 分坐标值的显示状态 IsShowTitle X 轴标题是否显示 IsTicsBetweenLabels 两个坐标值之间是否自动显示分隔标志 IsUseTenPower 是否使用 10 次幂指数 IsVisible 是否显示 X 轴 IsZeroLine 当数据为 0 时候是否显示(在饼状图显示的时候有用) MajorGrid 大跨度的 X 轴表格虚线线显示信息 DashOff 虚线中孔间距 DashOn 虚线单位长度 MajorTic 大跨度的 X 轴刻度信息 IsInside 在 Chart 内部是否显示 IsOutSide 在 Chart 外部是否显示 IsOpposite 在对面的轴上是否显示 MinorGrid 小跨度的 X 轴表格虚线显示信息 MinorTic 小跨度的 x 轴刻度信息 MinSpace 刻度和轴之间的距离(没试过) Scale 刻度值的一些设定 IsReverse X 轴的刻度值从高到低还是从低到高 MajorStep 大刻度步长