无线测温外文翻译
关于测温的英文综述

关于测温的英文综述英文回答:Thermometry is the measurement of temperature. It is a fundamental science that has applications in various fields such as physics, chemistry, biology, and medicine. Thefield of thermometry has evolved significantly over the centuries, with the development of new and more accurate methods for measuring temperature.One of the earliest methods of thermometry was the use of a mercury thermometer. Mercury thermometers consist of a glass tube with a bulb at one end. The bulb is filled with mercury, which expands or contracts when the temperature changes. The expansion or contraction of the mercury can be measured on a scale to determine the temperature. Mercury thermometers are still widely used today, but they are being replaced by other types of thermometers, such as digital thermometers and infrared thermometers.Digital thermometers use a thermistor to measure temperature. A thermistor is a semiconductor whose resistance changes with temperature. By measuring the resistance of the thermistor, the temperature can be determined. Digital thermometers are more accurate than mercury thermometers and they are also more convenient to use.Infrared thermometers measure temperature by detecting the infrared radiation emitted by an object. The intensity of the infrared radiation is proportional to the temperature of the object. By measuring the intensity of the infrared radiation, the temperature can be determined. Infrared thermometers are non-contact thermometers, which means that they can measure the temperature of an object without touching it. This makes them ideal for measuring the temperature of objects that are difficult or dangerous to touch, such as electrical equipment or hot surfaces.The field of thermometry is constantly evolving, with the development of new and more accurate methods for measuring temperature. These new methods are making itpossible to measure temperature with greater precision and accuracy than ever before.中文回答:测温。
医学红外无接触体温计 LX-26 型号英文用户手册说明书
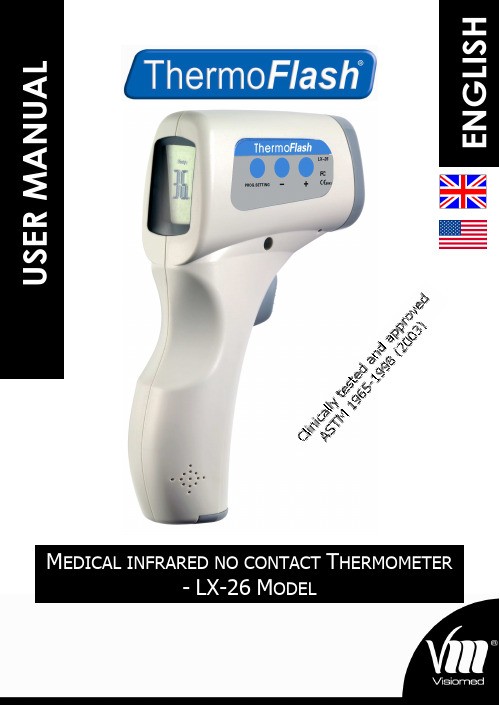
M T HERMOMETER- LX-26 M ODELE N G L ICONTENTSI.S AFETY PRECAUTIONS (3)II.I NTRODUCTION (4)III.P RECAUTIONS BEFORE USE (4)IV.O PERATING P RINCIPLE (5)T HE DIFFERENT METHODS OF TEMPERATURE MEASUREMENT (5)N ORMAL TEMPERATURES ACCORDING TO MEASUREMENT METHOD (6)A DVANTAGES OF TEMPORAL ARTERY (TA) TEMPERATURE (7)N ORMAL TEMPERATURE ACCORDING TO AGE (7)P RACTICAL CONSIDERATIONS WHEN TAKING A TEMPERATURE (7)H OW TO TAKE A TEMPERATURE (8)C ONSTRAINTS (8)V.D ESCRIPTION OF THE T HERMO F LASH LX-26 (9)VI.F UNCTIONS (11)VII.U SE (11)VIII.S ETTING &F UNCTION OF MENU (12)1.C HOOSING THE TEMPERATURE UNIT –F1M ENU (12)2. ALARME SETUP –F2M ENU (12)3.C HOICE OF DISPLAY MODE:B ODY OR S URFACE T EMP –F3M ENU (13)4.T OTAL DIFFERENCE –F4M ENU (14)5.B UZZER O N /O FF –F5M ENU (14)6.E XITING THE SETTING MODE (14)7.D ATA M EMORY (14)8.C HANGING THE BATTERIES (15)IX.T ECHNICAL C HARACTERISTICS & PRECISION (15)X.R EMARKS (16)XI.A CCESSORIES SUPPLIED (16)XII.T ROUBLESHOOTING (17)I.S AFETY PRECAUTIONS-Follow the maintenance advice stipulated in this instruction manual.-This device may be used for personal home use.-This device must only be used for the purposes described in this instruction manual.-This device must only be used in an ambient temperature range of between 10 and 40 °C.-This device must always be kept in a clean, dry area.-Do not expose this thermometer to electric shocks.-Do not expose this thermometer to extreme temperature conditions of >50°C or > - 20°C.-Do not use this device in relative humidity higher than 85%.-The protective glass over the lens is the most fragile part of the thermometer.-Do not touch the glass of the infrared lens with your fingers.-Clean the glass with a cotton bud lightly moistened with 70° alcohol.-Do not expose the thermometer to sunlight or to water.-Do not use this device outside.-Never drop the device.-Should a problem occur with your device, please contact your retailer. Do not attempt to repair this device yourself.I MPORTANT S AFEGUARDSFor your safety, ONLY use the charger supplied.Do not dismantle the device or the rechargeable base station.II.I NTRODUCTIONThe Visiomed Thermo Flash LX-26thermometer without contact has been developed using latest infrared technology. This technology allows temporal artery (TA) temperature to be taken at a distance of about 5cm away from the forehead.Precise, Instantaneous and without Contact, the Thermo Flash LX-26 is, to date, the most suitable thermometer for no risk temperature measurement. It has been demonstrated that this method of TA temperature measurement is more precise than tympanic thermometry and better tolerated than rectal thermometry (1).However, as with other types of thermometer, it is essential to use the Thermo Flash LX-26 properly in order to obtain reliable and stable results.You are therefore advised to read this instruction manual and the safety precautions carefully before use.(1) Greenes D, Fleisher G. Accuracy of a Noninvasive Temporal Artery Thermometer forUse in Infants. Arch Pediatr Adolesc Med 2001;155:376.III.P RECAUTIONS BEFORE USEThe Thermo Flash LX-26 is pre-set at the factory.It is not necessary to calibrate the device whenstarting it up.In order to obtain reliable and stable results, you are advised each time there is a significant change in the ambient temperature due to a change in environment, to allow the Thermo Flash LX-26 toacclimatise to this ambient temperature for 15 to 20 minutes before using it.It is important to allow a one minute interval between two measurements.IV.O PERATING PRINCIPLEAll objects, solid, liquid or gas, emit energy by radiation. The intensity of this energy depends on the temperature of the object. The Thermo Flash LX-26 infrared thermometer is therefore able to measure the temperature of a person by the energy the person emits. This measurement can be taken thanks to an external temperature probe on the device which permanently analyses and registers the ambient temperature. Therefore, as soon as the operator holds the thermometer near the body and activates the radiation sensor, the measurement is taken instantly by detection of the infrared heat generated by the arterial blood flow. Body heat can therefore be measured without any interference from the heat of the surrounding environment.T HE DIFFERENT METHODS OF TEMPERATURE MEASUREMENT Core temperatureCore temperature is the most precise measurement and involves measuring the temperature in the pulmonary artery by means of a catheter equipped with a thermal probe which can read the temperature in situ.The same method is employed for probes measuring the oesophageal temperature. However, such invasive temperature measurement methods require specific equipment and expertise.Rectal thermometryRectal temperature adjusts slowly in comparison to the evolution of the body’s internal temperature. It has been demonstrated that rectal temperature remains raised long after the internal temperature of the patient has started to drop and vice versa. Furthermore, rectal perforations have been known to occur as a result of this method and without appropriate sterilisation techniques, rectal thermometry can spread germs often found in faeces.Oral thermometryOral temperature is easily influenced by recent ingestion of food or drinks and by breathing through the mouth. To measure oral temperature, the mouth must remain closed and the tongue lowered for three to four minutes which is a difficult task for young children to accomplish.Axillary (armpit) temperatureAlthough it may be easy to measure axillary temperature, it has been proven that it does not provide an accurate measurement of the child’s internal temperature. To take this type of temperature, the thermometer must be wedged tightly over the axillary artery. Despite the low sensitivity and relative inaccuracy of axillary temperature in detecting fever, this method is recommended by The American Academy of Pediatrics as a screening test for fever in newborns.Tympanic thermometryIn order to obtain a precise temperature reading, good command of the measurement technique is required. The thermometer probe must be placed as close as possible to the warmest part of the external ear canal. An incorrectly placed probe could lead to a false temperature reading.NORMAL TEMPERATURES ACCORDING TO MEASUREMENT METHOD M EASUREMENT M ETHOD N ORMAL TEMP°R ECTAL36.6°C–38°CO RAL35.5°C–37.5°CA XILLARY34.7°C–37.3°CA URICULAR35.8°C–38°CT EMPORAL (T HERMO F LASH)35.8°C–37.8°CThe temperature of the human body varies throughout the day. It can also be influenced by numerous external factors: age, sex, type and thickness of skin…ADVANTAGES OF TEMPORAL ARTERY (TA) TEMPERATURE Infrared arterial temperature can be measured using a device placed on the forehead, in the temporal artery region. It has been demonstrated that this relatively new method of measuring temperature is more precise than tympanic thermometry and better tolerated than rectal thermometry.The Thermo Flash LX-26 thermometer has been designed to produce an instant forehead temperature reading without any contact with the temporal artery. As this artery is quite close to the surface of this skin and therefore accessible and given the blood flow is permanent and regular, it allows precise measurement of the temperature. This artery is linked to the heart by the carotid artery which is directly linked to the aorta. It forms part of the main trunk of the arterial system. The efficiency, speed and comfort of taking a temperature from this area make it ideal compared with other temperature measurements methods.NORMAL TEMPERATURES ACCORDING TO AGE0-2 years 36.4-38.0 97.5-100.43-10 years 36.1-37.8 97.0-100.011-65 years 35.9-37.6 96.6-99.7> 65 years 35.8-37.5 96.4-99.5P RACTICAL CONSIDERATIONS WHEN TAKING A TEMPERATURE-In order to ensure that precise and accurate temperature measurements are obtained, it is essential that each user has received adequate information on and training in the temperature measurement technique when using such a device.-It is essential to remember that although procedures such as taking a temperature may be simple they must not be trivialised. -Temperature should be taken in a neutral context. The patient must not have undertaken vigorous physical activity prior totaking his/her temperature and the room temperature must be moderate.-Be aware of physiological variations in temperature which must be taken into consideration when evaluating the results: temperature increases by 0.5C° between 6am and 3pm. Women have a temperature that is higher, on average, by around 0.2C°.Their temperature also varies in accordance with their ovarian cycle. It rises by 0.5C° in the second half of the cycle and at the early stages of pregnancy.-When sitting, temperature is lower by about 0.3 to 0.4C° than when standing.H OW TO TAKE A TEMPERATUREAim at the FOREHEAD, overthe right temporal region,from a distance of about5cm, press the thermometer’smeasurement button and thetemperature is instantlydisplayed.The reliability of themeasurement cannotbe guaranteed if thetemperature is measured overanother part of the body (e.g.arm, torso…)C ONSTRAINTSPlease observe the following before any temperature measurement to ensure a stable and reliable result:- Push back hair from the forehead- Wipe away any perspiration from the forehead- Avoid any drafts (e.g. from nasal specs, air conditioning…)- Allow a 1 minute interval between two measurements.- Each time there is a significant change in the ambient temperature due to a change in environment, to allow the Thermo Flash LX-26 to acclimatise to this ambient temperature for at least 15 minutes before using it.V.D ESCRIPTION OF THE ThermoFlash LX-26VI.F UNCTIONS1.Specially designed to take the body temperature of a personregardless of the room temperature.2.Quick and reliable results as it use the HEIMMANN infrareddetection system.3.Sound alarm if temperature is exceeded.4.Memorization of the 32 last measures.5.LCD back-lighted digital screen.6.Data displayed in Celsius or Fahrenheit.7.Automatic stop (energy saver).8.Small, convenient, easy to use.A DDITIONAL USES:ThermoFlash LX-26 can also be used to measure the temperature ofa baby-bottle or bath, or room temperature (by using the SurfaceTemp function). This function is in accordance with the Directive 89/336/EEC Electromagnetic Compatibility.VII.U SE1.Install battery2.For the first use or when insertingnew batteries wait between 10minutes for the warm-up of theapparatus and when inserting thenew batteries.3.Aim towards the forehead (see thediagram below for the ThermoFlashpositioning), from a distance of 5 cm(2 in), press the measuring key, thetemperature is displayed in 1 second.The temperature can also be takenbehind the ear lobe.4.Before taking the temperature,make sure to remove hair andperspiration from the forehead.You can also take the temperaturebehind the ear lobe.VIII.C ONFIGURATION AND FUNCTION OF MENU1.C HOOSING THE TEMPERATURE UNIT –F1F UNCTIONPress PROG SETTING button for 3 seconds, the screen displays: F1.Select ‘-’ for degrees Celsius, ‘+’ for degrees Fahrenheit.Confirm by pressing PROG SETTING button.2.A LARM SETUP –F2M ENUPress PROG SETTING button for 3 seconds, the screen displays: F1.Press twice PROG SETTING button to get F2.Select ‘+’ to increase the threshold by 0.1°C (0.1°F), ‘-’ to reduce it by 0.1°C (0.1°F).Confirm by pressing PROG SETTING button.Note: The alarm threshold default value is 38°C (100.4°F).3.C HOICE OF DISPLAY MODE:B ODY OR S URFACE T EMP –F3M ENU The ThermoFlash LX-26 is specially designed to take the body temperature of a human being.For this, use the BODY mode.Measurement range for Body mode: 32°C – 42.9°C (90°F – 109°F) You can also use the ThermoFlash LX-26 to measure the temperature of an area or an object, a food, a liquid or a room temperature.For this, use the SURFACE TEMP mode.Measurement range for Surface TEMP mode: 0°C – 60°C (32°F - 140°F)Press PROG SETTING button for 3 seconds, the screen displays: F1. Press PROG SETTING button twice to get F3.Select 0 by pressing ‘-’ button to get the BODY mode.Select 1 by pressing ‘+’ button to get the SURFACE TEMP mode Confirm by pressing PROG SETTING button.Note: The ThermoFlash LX-26 is automatically set to BODY Important: The area temperature differs from the internal body temperature. To obtain the internal temperature always use the BODY mode.Please make sure to select the BODY mode for an internal temperature reading and the SURFACE TEMP mode for an external area reading (bottle, bath, room…).4.T OTAL DIFFERENCE –F4M ENUTo adjust the total variation of your Thermoflash LX-26Press PROG SETTING button for 3 seconds, the screen displays: F1. Press PROG SETTING button three times to get F4.Select ‘+’ to increase the difference by 0.1°C (0.1°F), ‘-’ to reduce it by 0.1°C (0.1°F).Confirm by pressing PROG SETTING button.If in doubt, you are advised to leave the total variance at +0.8°C (original setting).Each time there is a significant change in the ambient temperature due to a change in environment, to allow the Thermo Flash LX-26 to acclimatise to this ambient temperature for at least 15 minutes before using it.5.B UZZER O N/O FF –F5M ENUPress PROG SETTING button for 3 seconds, the screen displays: F1. Press four times PROG SETTING button to get F5.Select ‘+’ to open the buzzer (a sound icon is displayed on the LCD screen), press ‘-’ to stop it (the icon disappear).Confirm by pressing PROG SETTING button.6.E XITING THE SETTING MODEPress PROG SETTING button until the screen turns off.7.D ATA M EMORYTo display the last temperature measurement, press simultaneously the ‘-’ and ‘+’ button.You will obtain the last temperature measurement. To switch on the last measurement, press the '+' button.The number indicated in interval of two measures corresponds to the number of measurements.Press on the button '-' for reviewTo exit data memory, press the measure key. The Thermoflash switches off in 5 seconds.8.C HANGING THE BATTERIESDisplay: when the LCD screen displays ‘Battery’, the battery is used. Operation: Open the lid and change the batteries, taking great care with the correct positioning. A mistake with this could cause damage to the apparatus and compromise the guarantee of your ThermoFlash LX-26.Never use rechargeable batteries. Use only batteries for single usage.IX.TECHNICAL CHARACTERISTICS1.Normal conditions of useOperating temperature: 10° C ῀40° C (50° ῀ 140° F)Humidity rate: ≤ 85%2.Power: DC3 V (2 batteries AA)3.Size: 196 x 150 x 50 mm – 7.7 x 5.9 x 1.9 in (L x W x H)4.Weight: 220g5.Display Resolution: 0.1° C (0.1°F)6.Measuring range:In body mode: 32°C – 42.9°C (90°F – 109°F)In Surface Temp mode: 0°C ῀ 60°C (32°F to 140°F)7.Precision: From 36°C to 39°C (96.8°F to 102.2°F) = +/-0.2°C/F8.Consumption: ≤ 50mW9.Accuracy: ± 0.3° C (0.54° F)10.Measuring distance: 5 cm – 8 cm (2 in – 3.14 in)11.Automatic stop: 5 sec.THERMOFLASH PRECISIONFrom 34°C to 35.9°C = ± 0.3°C From 93.2°F to 96.6°F =± 0.3°FFrom 36°C to 39°C = ±0.2°C From 96.8°F to 102.2°F = ±0.2°F From 39°C to 42.5°C = ± 0.3°C From 102.2°F to 108.5°F = ± 0.3°F According to ASTM Standard E1965-1998 (2003)The ThermoFlash LX-26 can take temperature readings below 32°C or above 42.9°C (90°F to 109°F) but precision is not guaranteed outside of this range.LONGEVITY USEThe ThermoFlash is guaranteed for 40.000 readings.X.A DVICE-The protective glass over the lens is the most important and fragile part of the thermometer, please take great care of it.-Clean the glass with cotton fabric, wet with water or 70° alcohol-Do not use other batteries than mentioned batteries, do not recharge non rechargeable batteries, do not throw in fire.-Remove the batteries when thermometer is not used for an extended period of time.-Do not expose the thermometer to sunlight or water.-An impact will damage the product.XI.A CCESSORIES SUPPLIEDUser Manual in EnglishFast learning user manualGuarantee cardCarrying bagBatteries supplied (AA)XII.T ROUBLESHOOTINGIf you have one of the following problems while using your ThermoFlash, please refer to this breakdown service guide to help resolve the problem. If the problem persists please contact our customer service at ***************************T HE SCREEN DISPLAYS TEMPERATURE SUPERIOR TO 95°The temperature is in Fahrenheit change the measurement to Celsius (by pressing the Program Setting button to get the F1 function key)T HE SCREEN DISPLAYS THE BODY TEMPERATURE INFERIOR TO 32°C(89.6°F) To take a body temperature the function key F3 must be on Body mode. If you’re on Surface Temp mode the 32°C (89.6°F) temperature displayed is showing the external temperature that your body releases.T HE SCREEN DISPLAYS THE MESSAGE HIWhen using the ThermoFlash LX-26 themessage HI can show on the screen.The analysis is above the measurement rangeselected, either superior to 42.9°C (109°F)inBody Mode or superior to 60°C (140°F) inSurface Temp Mode.T HE SCREEN DISPLAYS THE MESSAGE LOWhen using the ThermoFlash LX-26 themessage Lo can show on the screen.The temperature analyzed is under themeasuring range selected, either less than 32°C(90°F) in Body Mode or less than 0°C (32°F) inSurface Temp Mode.This message displays in various cases – please find below a list of the main cases:Reasons for LO message displayAdviceTemperature reading hampered by hair, perspiration… Make sure that there is no obstruction prior to taking a temperature.Temperature hampered by an air flux. Make sure there is no air flux as this could interfere with the infrared system.Temperature readings too close together, the ThermoFlash did not have the chance to boot itself. Respect the pause of 15 seconds minimum between two readings – 1 minute pause is advised.The measuring distance is too far. Please respect the measuring distance (between 5 and 8 cm –2 in and 3.14 in).。
无线测温工作原理

无线测温工作原理
无线测温是一种利用无线技术进行温度测量的方法。
其工作原理如下:
1. 温度传感器:无线测温系统中使用一种温度传感器,可以是热电偶、热敏电阻或红外线传感器等。
这些传感器可以测量环境的温度变化。
2. 数据采集:传感器通过测量环境的温度变化,将温度信号转换为相应的电信号。
3. 无线传输:通过无线通信技术,将温度数据传输到接收设备。
无线通信技术可以是蓝牙、Wi-Fi或以太网等。
传输的距离可
以根据通信技术和设备的工作范围来确定。
4. 数据接收:接收设备接收到传输的温度数据,并将其转换为数字信号。
接收设备可以是手机、计算机或专用的接收器。
5. 数据处理:接收设备对接收到的温度数据进行处理,可以进行数据分析、存储或显示等操作。
总结:无线测温工作原理是通过温度传感器测量温度变化,将数据通过无线通信技术传输到接收设备,接收设备对数据进行处理与显示。
这种方法可以使温度测量更为方便、灵活,并且不限制测量位置的距离。
热电偶温度传感器中英文对照外文翻译文献
中英文对照外文翻译文献(文档含英文原文和中文翻译)外文翻译:Thermocouple Temperatur sensorIntroduction to ThermocouplesThe thermocouple is one of the simplest of all sensors. It consists of two wires of dissimilar metals joined near the measurement point. The output is a small voltage measured between the two wires.While appealingly simple in concept, the theory behind the thermocouple is subtle, the basics of which need to be understood for the most effective use of the sensor.Thermocouple theoryA thermocouple circuit has at least two junctions: the measurement junction and a reference junction. Typically, the reference junction is created where the two wires connect to the measuring device. This second junction it is really two junctions: one for each of the two wires, but because they are assumed to be at the same temperature (isothermal) they are considered as one (thermal) junction. It is the point where the metals change - from the thermocouple metals to what ever metals are used in the measuring device - typically copper.The output voltage is related to the temperature difference between the measurement and the reference junctions. This is phenomena is known as the Seebeck effect. (See the Thermocouple Calculator to get a feel for the magnitude of the Seebeck voltage). The Seebeck effect generates a small voltage along the length of a wire, and is greatest where the temperature gradient is greatest. If the circuit is of wire of identical material, then they will generate identical but opposite Seebeck voltages which will cancel. However, if the wire metals are different the Seebeck voltages will be different and will not cancel.In practice the Seebeck voltage is made up of two components: the Peltiervoltage generated at the junctions, plus the Thomson voltage generated in the wires by the temperature gradient.The Peltier voltage is proportional to the temperature of each junction while the Thomson voltage is proportional to the square of the temperature difference between the two junctions. It is the Thomson voltage that accounts for most of the observed voltage and non-linearity in thermocouple response.Each thermocouple type has its characteristic Seebeck voltage curve. The curve is dependent on the metals, their purity, their homogeneity and their crystal structure. In the case of alloys, the ratio of constituents and their distribution in the wire is also important. These potential inhomogeneous characteristics of metal are why thick wire thermocouples can be more accurate in high temperature applications, when the thermocouple metals and their impurities become more mobile by diffusion.The practical considerations of thermocouplesThe above theory of thermocouple operation has important practical implications that are well worth understanding:1. A third metal may be introduced into a thermocouple circuit and have no impact, provided that both ends are at the same temperature. This means that the thermocouple measurement junction may be soldered, brazed or welded without affecting the thermocouple's calibration, as long as there is no net temperature gradient along the third metal.Further, if the measuring circuit metal (usually copper) is different to that of the thermocouple, then provided the temperature of the two connecting terminals is the same and known, the reading will not be affected by the presence of copper.2. The thermocouple's output is generated by the temperature gradient along the wires and not at the junctions as is commonly believed. Therefore it is important that the quality of the wire be maintained where temperature gradients exists. Wire quality can be compromised by contamination from its operating environment and the insulating material. For temperatures below 400°C, contamination of insulated wires is generally not a problem. At temperatures above 1000°C, the choice of insulationand sheath materials, as well as the wire thickness, become critical to the calibration stability of the thermocouple.The fact that a thermocouple's output is not generated at the junction should redirect attention to other potential problem areas.3. The voltage generated by a thermocouple is a function of the temperature difference between the measurement and reference junctions. Traditionally the reference junction was held at 0°C by an ice bath:The ice bath is now considered impractical and is replace by a reference junction compensation arrangement. This can be accomplished by measuring the reference junction temperature with an alternate temperature sensor (typically an RTD or thermistor) and applying a correcting voltage to the measured thermocouple voltage before scaling to temperature.The correction can be done electrically in hardware or mathematically in software. The software method is preferred as it is universal to all thermocouple types (provided the characteristics are known) and it allows for the correction of the small non-linearity over the reference temperature range.4. The low-level output from thermocouples (typically 50mV full scale) requires that care be taken to avoid electrical interference from motors, power cable, transformers and radio signal pickup. Twisting the thermocouple wire pair (say 1 twist per 10 cm) can greatly reduce magnetic field pickup. Using shielded cable or running wires in metal conduit can reduce electric field pickup. The measuring device should provide signal filtering, either in hardware or by software, with strong rejection of the line frequency (50/60 Hz) and its harmonics.5. The operating environment of the thermocouple needs to be considered. Exposure to oxidizing or reducing atmospheres at high temperature can significantly degrade some thermocouples. Thermocouples containing rhodium (B,R and S types) are not suitable under neutron radiation.The advantages and disadvantages of thermocouplesBecause of their physical characteristics, thermocouples are the preferred methodof temperature measurement in many applications. They can be very rugged, are immune to shock and vibration, are useful over a wide temperature range, are simple to manufactured, require no excitation power, there is no self heating and they can be made very small. No other temperature sensor provides this degree of versatility.Thermocouples are wonderful sensors to experiment with because of their robustness, wide temperature range and unique properties.On the down side, the thermocouple produces a relative low output signal that is non-linear. These characteristics require a sensitive and stable measuring device that is able provide reference junction compensation and linearization.Also the low signal level demands that a higher level of care be taken when installing to minimise potential noise sources.The measuring hardware requires good noise rejection capability. Ground loops can be a problem with non-isolated systems, unless the common mode range and rejection is adequate.Types of thermocoupleAbout 13 'standard' thermocouple types are commonly used. Eight have been given an internationally recognised letter type designators. The letter type designator refers to the emf table, not the composition of the metals - so any thermocouple that matches the emf table within the defined tolerances may receive that table's letter designator.Some of the non-recognised thermocouples may excel in particular niche applications and have gained a degree of acceptance for this reason, as well as due to effective marketing by the alloy manufacturer. Some of these have been given letter type designators by their manufacturers that have been partially accepted by industry.Each thermocouple type has characteristics that can be matched to applications. Industry generally prefers K and N types because of their suitability to high temperatures, while others often prefer the T type due to its sensitivity, low cost and ease of use.A table of standard thermocouple types is presented below. The table also showsthe temperature range for extension grade wire in brackets.Accuracy of thermocouplesThermocouples will function over a wide temperature range - from near absolute zero to their melting point, however they are normally only characterized over their stable range. Thermocouple accuracy is a difficult subject due to a range of factors. In principal and in practice a thermocouple can achieve excellent results (that is, significantly better than the above table indicates) if calibrated, used well below its nominal upper temperature limit and if protected from harsh atmospheres. At higher temperatures it is often better to use a heavier gauge of wire in order to maintain stability (Wire Gauge below).As mentioned previously, the temperature and voltage scales were redefined in 1990. The eight main thermocouple types - B, E, J, K, N, R, S and T - were re-characterised in 1993 to reflect the scale changes. (See: NIST Monograph 175 for details). The remaining types: C, D, G, L, M, P and U appear to have been informally re-characterised.Try the thermocouple calculator. It allows you the determine the temperature by knowing the measured voltage and the reference junction temperature.Thermocouple wire gradesThere are different grades of thermocouple wire. The principal divisions are between measurement grades and extension grades. The measurement grade has the highest purity and should be used where the temperature gradient is significant. The standard measurement grade (Class 2) is most commonly used. Special measurement grades (Class 1) are available with accuracy about twice the standard measurement grades.The extension thermocouple wire grades are designed for connecting the thermocouple to the measuring device. The extension wire may be of different metals to the measurement grade, but are chosen to have a matching response over a much reduced temperature range - typically -40°C to 120°C. The reason for using extension wire is reduced cost - they can be 20% to 30% of the cost of equivalent measurementgrades. Further cost savings are possible by using thinnergauge extension wire and a lower temperature rated insulation.Note: When temperatures within the extension wire's rating are being measured, it is OK to use the extension wire for the entire circuit. This is frequently done with T type extension wire, which is accurate over the -60 to 100°C range.Thermocouple wire gaugeAt high temperatures, thermocouple wire can under go irreversible changes in the form of modified crystal structure, selective migration of alloy components and chemical changes originating from the surface metal reacting to the surrounding environment. With some types, mechanical stress and cycling can also induce changes.Increasing the diameter of the wire where it is exposed to the high temperatures can reduce the impact of these effects.The following table can be used as a very approximate guide to wire gauge:At these higher temperatures, the thermocouple wire should be protected as much as possible from hostile gases. Reducing or oxidizing gases can corrode some thermocouple wire very quickly. Remember, the purity of the thermocouple wire is most important where the temperature gradients are greatest. It is with this part of the thermocouple wiring where the most care must be taken.Other sources of wire contamination include the mineral packing material and the protective metal sheath. Metallic vapour diffusion can be significant problem at high temperatures. Platinum wires should only be used inside a nonmetallic sheath, such as high-purity alumna.Neutron radiation (as in a nuclear reactor) can have significant permanent impact on the thermocouple calibration. This is due to the transformation of metals to different elements.High temperature measurement is very difficult in some situations. In preference, use non-contact methods. However this is not always possible, as the site of temperature measurement is not always visible to these types of sensors.Colour coding of thermocouple wireThe colour coding of thermocouple wire is something of a nightmare! There are at least seven different standards. There are some inconsistencies between standards, which seem to have been designed to confuse. For example the colour red in the USA standard is always used for the negative lead, while in German and Japanese standards it is always the positive lead. The British, French and International standards avoid the use of red entirely!Thermocouple mountingThere are four common ways in which thermocouples are mounted with in a stainless steel or Inconel sheath and electrically insulated with mineral oxides. Each of the methods has its advantages and disadvantages.Sealed and Isolated from Sheath: Good relatively trouble-free arrangement. The principal reason for not using this arrangement for all applications is its sluggish response time - the typical time constant is 75 secondsSealed and Grounded to Sheath: Can cause ground loops and other noise injection, but provides a reasonable time constant (40 seconds) and a sealed enclosure.Exposed Bead: Faster response time constant (typically 15 seconds), but lacks mechanical and chemical protection, and electrical isolation from material being measured. The porous insulating mineral oxides must be sealedExposed Fast Response: Fastest response time constant, typically 2 seconds but with fine gauge of junction wire the time constant can be 10-100 ms. In addition to problems of the exposed bead type, the protruding and light construction makes the thermocouple more prone to physical damage.Thermocouple compensation and linearizationAs mentioned above, it is possible to provide reference junction compensation in hardware or in software. The principal is the same in both cases: adding a correction voltage to the thermocouple output voltage, proportional to the reference junction temperature. To this end, the connection point of the thermocouple wires to the measuring device (i.e. where the thermocouple materials change to the copper of thecircuit electronics) must be monitored by a sensor. This area must be design to be isothermal, so that the sensor accurately tracks both reference junction temperatures.The hardware solution is simple but not always as easy to implement as one might expect.The circuit needs to be designed for a specific thermocouple type and hence lacks the flexibility of the software approach.The software compensation technique simplifies the hardware requirement, by eliminating the reference sensor amplifier and summing circuit (although a multiplexer may be required).The software algorithm to process the signals needs to be carefully written. A sample algorithm details the process.A good resource for thermocouple emf tables and coefficients is at the US Commerce Dept's NIST web site. It covers the B, E, J, K, N, R, S and T types.The thermocouple as a heat pumpThe thermocouple can function in reverse. If a current is passed through a thermocouple circuit, one junction will cool and the other warm. This is known as the Peltier Effect and is used in small cooling systems. The effect can be demonstrated by alternately passing a current through a thermocouple circuit and then quickly measuring the circuit's Seebeck voltage. This process has been used, with very fine thermocouple wire (0.025 mm with about a 10 mA current), to measure humidity by ensuring the cooled junction drops below the air's dew point. This causes condensation to form on the cooled junction. The junction is allowed to return to ambient, with the temperature curve showing an inflection at the dew point caused by the latent heat of vaporization.Measuring temperature differencesThermocouples are excellent for measuring temperatures differences, such as the wet bulb depression in measuring humidity. Sensitivity can be enhanced by constructing a thermopile - a number of thermocouple circuits in series.In the above example, the thermopile output is proportional to the temperaturedifference T1 - T2, with a sensitivity three times that of a single junction pair. In practice, thermopiles with two to hundreds of junctions are used in radiometers, heat flux sensors, flow sensors and humidity sensors. The thermocouple materials can be in wire form, but also printed or etched as foils and even electroplated.An excellent example of the thermopile is in the heat flux sensors manufactured by Hukseflux Thermal Sensors. Also see RdF Corp. and Exergen Corp.The thermocouple is unique in its ability to directly measure a temperature difference. Other sensor types require a pair of closely matched sensors to ensure tracking over the entire operational temperature range.The thermoelectric generatorWhile the Seebeck voltage is very small (in the order of 10-70μV/°C), if the circuit's electrical resistance is low (thick, short wires), then large currents are possible (e.g. many amperes). An efficiency trade-off of electrical resistance (as small as possible) and thermal resistance (as large as possible) between the junctions is the major issue. Generally, electrical and thermal resistances trend together with different materials. The output voltage can be increased by wiring as a thermopile.The thermoelectric generator has found its best-known application as the power source in some spacecraft. A radioactive material, such as plutonium, generates heat and cooling is provided by heat radiation into space. Such an atomic power source can reliably provide many tens of watts of power for years. The fact that atomic generators are highly radioactive prevents their wider application.译文:热电偶温度传感器热电偶的定义热电偶是最简单的传感器之一。
ATC450-C 无线测温收发器使用说明书
362ATC450-C无线测温收发器ATC450-C wireless temperature measurementtransceiver使用说明书V1.1Operation Manual V1.1安科瑞电气股份有限公司申明DECLARATION版权所有,未经本公司之书面许可,此手册中任何段落,章节内容均不得被摘抄、拷贝或以任何形式复制、传播,否则一切后果由违者自负。
本公司保留一切法律权利。
All rights reserved.No part of this publication may be reproduced,stored in a retrieval system,or transmitted in any form by any means,electronic,mechanical photocopying,recording,or otherwise without prior permission of our company.The violator will bear the dependent legal responsibility.We reserve all the rights.本公司保留对本手册所描述之产品规格进行修改的权利,恕不另行通知。
订货前,请垂询当地代理商以获悉本产品的最新规格。
We reserve all the rights to revise product specification without notice.Please consult local agent to get the latest information of our products specification目录1.1技术指标 (1)1.1Technical Features (1)1.2产品安装及尺寸 (2)1.2Product installation and size (2)1.2.1无线温度收发器 (2)1.2.1Wireless temperature transceiver (2)1.2.2无线温度传感器尺寸 (2)1.2.2Wireless temperature sensor size (2)1.2.3无线温度传感器ATE400安装 (4)1.2.3Wireless temperature sensor ATE400installation (4)1.3接线方法 (4)1.3Wiring method (4)2.通讯指南 (5)munications (5)2.1通讯格式详解 (5)2.1Communication Examples (5)2.1.1读取数据(功能码03H/04H) (5)2.1.1Read Data(Function code03H/04H) (5)2.1.2预置单个寄存器(功能码06H) (6)2.1.2Preset Single Register(Function code06H) (6)2.1.3预置多个寄存器(功能码10H) (6)2.1.3Preset Multi Registers(Function code10H) (6)2.2通讯地址表 (7)2.2Parameter address table (7)1.安装使用1.Install and use 1.1技术指标1.1Technical Features项目Items指标Features收发器ATC450-C TransceiverATC450-C工作电源Power sourceDC24V功耗Power Consumption≤1W测温点数points不大于60点分辨率Resolution0.1℃通讯端口CommunicationRS485协议ProtocolMODBUS-RTU波特率(bps)Baud rate(bps)2400、4800、9600、19200工作环境Environment温度:-20℃~+55℃;相对湿度≤95%Temperature:-20℃~+55℃;Humidity:≤95%传感器ATE100M/100/200Sensor ATE100M/100/200测温范围Range of temperature-50℃~+125℃测温精度Precision±1℃无线频率Wireless frequency470M通讯距离Communication distance空旷150m150m in open area采样频率Sampling frequency25S电池寿命Battery life≥5年≥5years安装方式Installation磁吸式/螺栓式/表带式Magnetic/bolted/Belt工作环境Environment温度:-40℃~+125℃;相对湿度≤95%Temperature:-40℃~+125℃;Humidity:≤95%1.2产品安装及尺寸1.2Product installation and size1.2.1无线温度收发器1.2.1Wireless temperature transceiverATC450-C 无线测温接收器,可以采用导轨(DIN35mm )安装方式,也可以使用螺栓固定方式。
智能红外传感器外文文献翻译中英文
外文文献翻译(含:英文原文及中文译文)文献出处:M G B r a y.Smart Infrared Sensors[J] International Journal of Computational Science & Engineering, 2015, 3(1 ):21-31 •英文原文Smart Infrared SensorsMG BrayKeeping up with continuously evolving process technologies is a major challenge for process engineers. Add to that the demands of staying current with rapidly evolving methods of monitoring and controlling those processes, and the assignment can become quite intimidating. However,infrared (IR) temperature sensor manufacturers are giving users the tools they need to meet these challenges: the latest computer-related hardware, software, and communications equipment, as well as leading-edge digital circuitry. Chief among these tools, though, is the next generation of IR thermometers —the smart sensor. Today^s new smart IR sensors represent a union of two rapidly evolving sciences that combine IR temperature measurement with high-speed digital technologies usually associated with the computer These instruments are called smart sensors because they incorporate microprocessors programmed to act as transceivers for bidirectional, serial communications between sensors onthe manufacturing floor and computers in the control room (see Photo 1).And because the circuitry is smaller,the sensors are smaller,simplifying installation in tight or awkward areas. Integrating smart sensors into new or existing process control systems offers an immediate advantage to process control engineers in terms of providing a new level of sophistication in temperature monitoring and controLIntegrating Smart Sensors into Process LinesWhile the widespread implementation of smart IR sensors is new, IR temperature measurement has been successful 1 y used in process monitoring and control for decades (see the sidebar,“How Infrared Temperature Sensors W o r k,‟‟below). In the past, if process engineers needed to change a sensor‟s settings,they would have to either shut down the line to remove the sensor or try to manually reset it in place. Either course could cause delays in the line,and,in some cases, be very dangerous. Upgrading a sensor usually required buying a new unit,calibrating it to the process, and installing it while the process line lay inactive. For example, some of the sensors in a wire galvanizing plant used to be mounted over vats of molten lead,zinc,and/or muriatic acid and accessible only by reaching out over the vats from a catwalk. In the interests of safety, the process line would have to be shut down for at least24 hours to cool before changing and upgrading a sensor.Today, process engineers can remotely configure, monitor,address,upgrade, and maintain their IR temperature sensors. Smart models with bidirectional RS-485 or RS-232 communications capabilities simplify integration into process control systems. Once a sensor is installed on a process line,engineers can tailor all its parameters to fit changing conditions—all from a PC in the control room. If, for example, the ambient temperature fluctuates, or the process itself undergoes changes in type, thickness, or temperature, all a process engineer needs to do is customize or restore saved settings at a computer terminal. If a smart sensor fails due to high ambient temperature conditions, a cut cable,or failed components, its fail-safe conditions engage automatically. The sensor activates an alarm to trigger a shutdown, preventing damage to product and machinery. If ovens or coolers fail, HI and LO alarms can also signal that there is a problem and/or shut down the line.Extending a Sensor‟s Useful LifeFor smart sensors to be compatible with thousands of different types of processes, they must be fully customizable. Because smart sensors contain EPROMs (erasable programmable read only memory), users can reprogram them to meet their specific process requirements using field calibration, diagnostics,and/or utility software from the sensor manufacturer.Another benefit of owning a smart sensor is that its firmware, the software embedded in its chips, can be upgraded via the communications link to revisions as they become available —without removing the sensor from the process line. Firmware upgrades extend the working life of a sensor and can actually make a smart sensor smarter.The Raytek Marathon Series is a full line of 1- and 2-color ratio IR thermometers that can be networked with up to 32 smart sensors. Available models include both integrated units and fiber-optic sensors with electronic enclosures that can be mounted away from high ambienttemperatures.Clicking on a sensor window displays the configuration settings for that particular sensor. The Windows graphical interface is intuitive and easy to use. In the configuration screen, process engineers can monitor current sensor settings, adjust them to meet their needs, or reset the sensor back to the factory defaults. All the displayed information comes from the sensor by way of the RS-485 or RS-232 serial connection.The first two columns are for user input. The third monitors the sensor‟s parameters in real time. Some parameters can be changed through other screens, custom programming, and direct PC-to-sensor commands. Parameters that can be changed by user input include the following:•Relay contact can be set to NO (normally open) or NC (normallyclosed).•Relay function can be set to alarm or setpoint.•Temperature units can be changed from degrees Celsius to degrees Fahrenheit,or vice versa. -Display and analog output mode can be changed for smart sensors that have combined one- and two-color capabilities-•Laser (if the sensor is equipped with laser aiming) can be turned on or off.•Milliamp output settings and range can be used as automaticprocess triggers or alarms.•Emissivity (for one-color) or slope (for two-color) ratio thermometers values can be set. Emissivity and slope values for common metal and nonmetal materials, and instructions on how to determine emissivity and slope, are usually included with sensors.•Signal processing defines the temperature parameters returned. Average returns an object‟s average temperature over a period of time; peak-hold returns an object‟s peak temperature either over a period of time or by an external trigger.•HI alarm/LO alarm can be set to warn of improper changes in temperature. On some process lines, this could be triggered by a break in a product or by malfunctioning heater or cooler elements-•Attenuation indicates alarm and shut down settings for two-color ratio smart sensors. In this example, if the lens is 95% obscured, an alarm warns that the temperature results might be losing accuracy (known as a “dirty window”alarm). More than 95% obscurity can trigger an automatic shutdown of the process-Using Smart SensorsSmart IR sensors can be used in any manufacturing process in which temperatures are crucial to high-quality product.Six IR temperature sensors can be seen monitoring producttemperatures before and after the various thermal processes and before and after drying. The smart sensors are configured on a high-speed multidrop network (defined below) and are individually addressable from the remote supervisory computer. Measured temperatures at all sensor locations can be polled individually or sequentially; the data can be graphed for easy monitoring or archived to document process temperature data. Using remote addressing features,set points, alarms, emissivity,and signal processing,information can be downloaded to each sensor. The result is tighter process control.Remote Online Addressability,smart sensors can In a continuous process similar to that in Figure 2be connected to one another or to other displays,chart recorders, and controllers on a single network. The sensors may be arranged in multidrop or point-to-point configurations, or simply stand alone.In a multidrop configuration, multiple sensors (up to 32 in some cases) can be combined on a network-type cable. Each can have its own ……address,”allowing it to be configured separately with different operating parameters- Because smart sensors use RS-485 or FSK (frequency shift keyed) communications, they can be located at considerable distances from the control room computer —up to 1200 m (4000 ft.) for RS-485, or 3000 m (10,000 ft.) for FSK. Some processes use RS-232communications, but cable length is limited to <100 ftIn a point-to-point installation, smart sensors can be connected to chart recorders,process controllers, and displays, as well as to the controlling computer In this type of installation, digital communications can be combined with milliamp current loops for a complete all-around process communications package. Sometimes,however,specialized processes require specialized software. A wallpaper manufacturer might need a series of sensors programmed to check for breaks and tears along the entire press and coating run,but each area has different ambient and surface temperatures, and each sensor must trigger an alarm if it notices irregularities in the surface. For customized processes such as this,engineers can write their own programs using published protocol data. These custom programs can remotely reconfigure sensors on the fly —without shutting down the process line.Field Calibration and Sensor UpgradesWhether using multidrop,point-to-point, or single sensor networks,process engineers need the proper software tools on their personal computers to calibrate, configure, monitor, and upgrade those sensors. Simple,easy-to-use data acquisition,configuration,and utility programs are usually part of the smart sensor package when purchased, or custom software can be usedWith field calibration software, smart sensors can be calibrated, new parameters downloaded directly to the sensor‟s circuitry,and the sensor‟s current parameters saved and stored as computer data files to ensure that a complete record of calibration and/or parameter changes is kept. One set of calibration techniques can include one-point offset and two- and three-point with variable temperatures:•One-point offset. If a single temperature is used in a particular process, and the sensor reading needs to be offset to make it match a known temperature, one-point offset calibration should be used. This offset will be applied to all temperatures throughout the entire temperature range. For example, if the known temperature along a float glass line is exactly 1800°F, the smart sensor, or series of sensors, can be calibrated to that temperature.•Two-point. If sensor readings must match at two specific temperatures, the two-point calibration shown in Figure 3 should be selected. This technique uses the calibration temperatures to calculate a gain and an offset that are applied to all temperatures throughout the entire range.•Three-point with variable temperature. If the process has a wide range of temperatures,and sensor readings need to match at three specific temperatures, the best choice is three-point variable temperaturecalibration (see Figure 4). This technique uses the calibration temperatures to calculate two gains and two offsets. The first gain and offset are applied to all temperatures below a midpoint temperature, and the second set to all temperatures above the midpoint. Three-point calibration is less common than one- and two-point, but occasionally manufacturers need to perform this technique to meet specific standards- Field calibration software also allows routine diagnostics, including power supply voltage and relay tests, to be run on smart sensors. The results let process engineers know if the sensors are performing at their optimum and make any necessary troubleshooting easier.ConclusionThe new generation of smart IR temperature sensors allows process engineers to keep up with changes brought on by newer manufacturing techniques and increases in production. They now can configure as many sensors as necessary for their specific process control needs and extend the life of those sensors far beyond that of earlier,“non -smart”designs. As production rates increase, equipment downtime must decrease. By being able to monitor equipment and fine-tune temperature variables without shutting down a process, engineers can keep the process efficientand the product quality high. A smart IR sensor\s digital processing components and communications capabilities provide a level of flexibility,safety, and ease of use not achieved until now.How Infrared Temperature Sensors WorkInfrared (IR) radiation is part of the electromagnetic spectrum,which includes radio waves,microwaves,visible light, and ultraviolet light, as well as gamma rays and X-rays. The IRrange falls between the visible portion of the spectrum and radio waves. IR wavelengths are usually expressed in microns,with the IR spectrum extending from 0.7 to 1000 microns. Only the 0.7-14 micron band is used for IR temperature measurement.Using advanced optic systems and detectors, noncontact IR thermometers can focus on nearly any portion or portions of the 0.7-14 micron band. Because every object (with the exception of a blackbody) emits an optimum amount of IR energy at a specific point along the IR band, each process may require unique sensor models with specific optics and detector types. For example, a sensor with a narrow spectral range centered at 3.43 microns is optimized for measuring the surface temperature of polyethylene and related materials- A sensor set up for 5 microns is used to measure glass surfaces. A 1 micron sensor is used for metals and foils. The broader spectral ranges are used to measure lower temperature surfaces, such as paper, board, poly, and foil composites.The intensity of an object's emitted IR energy increases or decreasesin proportion to its temperature. It is the emitted energy, measured as the t a rg e t‟s emissive,that indicates an object丨s temperature.Emissive is a term used to quantify the energy-emitting characteristics of different materials and surfaces. IR sensors have adjustable emissive settings, usually from 0.1 to 1.0, which allow accurate temperature measurements of several surface types.The emitted energy comes from an object and reaches the IR sensor through its optical system, which focuses the energy onto one or more photosensitive detectors. The detector then converts the IR energy into an electrical signal, which is in turn converted into a temperature value based on the sensor's calibration equation and the target's emissive. This temperature value can be displayed on the sensor, or, in the case of the smart sensor, converted to a digital output and displayed on a computer terminal。
NY401无线测温说明书

图4 6.键盘编程说明 6.1.1、用户密码确认(图 5)
在首次加电开机或在测试状态下按【○】键后,系统将要求进行用户 密码确认(系统默认用户密码为 1006),如下图所示,用户可按【 】键 把光标切换到需要更改的数字上,当光标位于某个数字上并不断闪烁时, 表示该数字已被选中,此时用户可按【▲】键改变当前数字,当所有的数 字设置完成后,用户可按【 】键确认本次密码设置,只有输入的密码正 确方可进入后面的功能设置,否则返回测试状态。
NY401无线测温装置 (版本号:1.00)
使 用 说 明 书
上海南月电气自动化有限公司
南月电气
无线测温装置使用说明书
1、简述 1.1NY401 的功能
NY401 系列的无线测温装置是一款用于高中低压电力系统(110KV, 6—35KV 和 0.4KV)和对温度有较高要求电气接点设备的智能化装置。它 集在线温度测量、数据采集、数据分析和控制功能于一体的现代化高科技 产品。其各项技术指标均能到达国际标准,无线测温装置具有在线采集温 度接点数可设定,数据中续单元可根据现场情况而可选。该装置提供通讯 接口可与计算机监控系统连接,支持 RS485 接口 MODBUS 通讯协议或多种 协议,波特率可选。 1.2 NY401 的特点 1.2.1 有以下部份组成
图5 6.1.2、功能设置(图 6)
在密码功能修改之后,按下【○】键,系统将进入功能设置窗口:第 一行是综合设置:08 表示循环显示间隔时间 8 秒;12 表示本机通讯的波特 率是 1200,波特率可选 24 为 2400,48 为 4800,96 为 9600.设备在出厂时默 认为“1200”;第二行 00 作为保留;01 是 RS485 的通讯地址. 具体操作方法
建议用线截面积(平方毫米) 2.5 单芯线 2.5 单芯线
无线测温说明书
无线测温说明书一、简介无线测温是一种新型的测量温度的技术,通过无线传输的方式,实时监测物体的温度变化。
本说明书将介绍无线测温的原理、使用方法和注意事项,以帮助用户更好地了解和使用这一技术。
二、工作原理无线测温利用了物体在不同温度下发射的红外辐射,通过红外传感器将物体的辐射信号转化为电信号。
然后通过无线传输模块将这一电信号发送给接收器,接收器再将信号转化为温度数值进行显示。
三、使用方法1. 准备:首先要确保测温设备中的电池充足,以确保正常使用。
同时,需要在接收器和测温设备之间建立好无线连接,确保信号的稳定传输。
2. 测量:将测温设备对准需要测量温度的物体,保持适当距离,按下测温键进行测量。
测温时,设备会发出简短的信号提示,同时在显示屏上显示测量结果。
3. 记录:用户可根据需要将测量的温度数据进行记录,方便后续分析和比较。
四、注意事项1. 距离:在使用过程中,应保持一定的距离进行测温,距离过远或过近都可能导致测量误差。
通常建议距离物体3-5厘米。
2. 环境:确保测温环境没有强光照射或大量的粉尘,这可能会对测温结果产生干扰。
3. 物体表面:在测量时,应尽量选择物体表面平整光滑的位置进行测量,以获得更准确的结果。
4. 温度范围:请根据设备的规格和要求,选择适合的温度范围进行测量。
避免超出设备的测量范围,否则可能导致测量结果不准确。
5. 小样本测试:在测量液体或小尺寸物体的温度时,可使用特殊的测试头或环保套装,以确保测量的准确性。
免责声明:无线测温仅供参考,不作为判定温度的唯一依据。
对于测温过程中可能产生的误差,我们不承担任何责任。
五、维护与保养1. 清洁:当设备出现灰尘或污渍时,应使用柔软的干净布擦拭,不要使用有腐蚀性的溶液进行清洁。
2. 储存:如长时间不使用,请将设备放置在干燥通风的环境中,避免暴露于高温或潮湿的环境中。
3. 检修:如设备出现故障或异常,请及时联系专业维修人员进行检修,不要私自拆卸或维修。
无线测温外文翻译
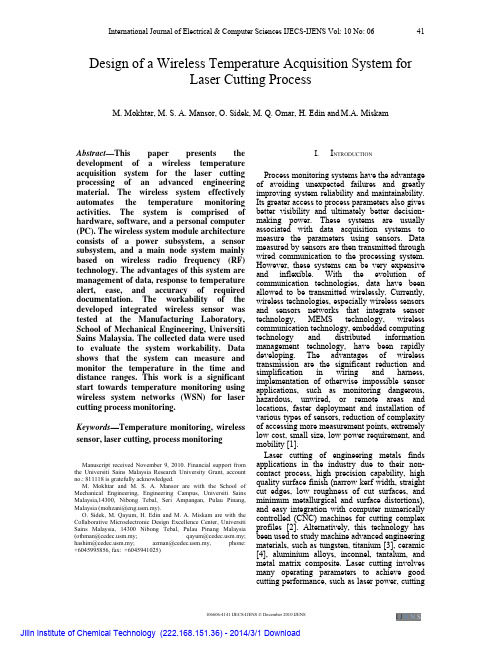
Design of a Wireless Temperature Acquisition System forLaser Cutting ProcessM. Mokhtar, M. S. A. Mansor, O. Sidek, M. Q. Omar, H. Edin and M.A. MiskamAbstract —This paper presents thedevelopment of a wireless temperature acquisition system for the laser cutting processing of an advanced engineering material. The wireless system effectively automates the temperature monitoring activities. The system is comprised of hardware, software, and a personal computer (PC). The wireless system module architecture consists of a power subsystem, a sensor subsystem, and a main node system mainly based on wireless radio frequency (RF)technology. The advantages of this system are management of data, response to temperature alert, ease, and accuracy of required documentation. The workability of the developed integrated wireless sensor was tested at the Manufacturing Laboratory, School of Mechanical Engineering, Universiti Sains Malaysia. The collected data were used to evaluate the system workability. Data shows that the system can measure and monitor the temperature in the time and distance ranges. This work is a significant start towards temperature monitoring using wireless system networks (WSN) for laser cutting process monitoring. Keywords —Temperature monitoring, wireless sensor, laser cutting, process monitoringI. I NTRODUCTIONProcess monitoring systems have the advantage of avoiding unexpected failures and greatly improving system reliability and maintainability. Its greater access to process parameters also gives better visibility and ultimately better decision-making power. These systems are usually associated with data acquisition systems to measure the parameters using sensors. Data measured by sensors are then transmitted throughwired communication to the processing system.However, these systems can be very expensiveand inflexible. With the evolution of communication technologies, data have been allowed to be transmitted wirelessly. Currently, wireless technologies, especially wireless sensors and sensors networks that integrate sensor technology, MEMS technology, wireless communication technology, embedded computing technology and distributed information management technology, have been rapidly developing. The advantages of wireless transmission are the significant reduction andsimplification in wiring and harness,implementation of otherwise impossible sensor applications, such as monitoring dangerous, hazardous, unwired, or remote areas and locations, faster deployment and installation ofvarious types of sensors, reduction of complexityof accessing more measurement points, extremelylow cost, small size, low power requirement, and mobility [1].Laser cutting of engineering metals findsapplications in the industry due to their non-contact process, high precision capability, high quality surface finish (narrow kerf width, straight cut edges, low roughness of cut surfaces, and minimum metallurgical and surface distortions), and easy integration with computer numerically controlled (CNC) machines for cutting complex profiles [2]. Alternatively, this technology has been used to study machine advanced engineering materials, such as tungsten, titanium [3], ceramic [4], aluminium alloys, inconnel, tantalum, and metal matrix composite. Laser cutting involvesmany operating parameters to achieve goodcutting performance, such as laser power, cuttingManuscript received November 9, 2010. Financial support from the Universiti Sains Malaysia Research University Grant, account no.: 811118 is gratefully acknowledged.M. Mokhtar and M. S. A. Mansor are with the School of Mechanical Engineering, Engineering Campus, Universiti Sains Malaysia,14300, Nibong Tebal, Seri Ampangan, Pulau Pinang, Malaysia (mohzani@m.my). O. Sidek, M. Qayum, H. Edin and M. A. Miskam are with theCollaborative Microelectronic Design Excellence Center, Universiti Sains Malaysia, 14300 Nibong Tebal, Pulau Pinang Malaysia (othman@m.my; qayum@m.my; hashim@m.my; azman@m.my, phone: +6045995856, fax: +6045941025)speed, frequency, duty cycle, focal length, standoff distance, assist gas pressure, beam nozzle, and cutting lenses. These cutting parameters should be monitored during the cutting process to determine the desired cutting parameters. However, current technologies that have been used to monitor the process cutting are based on wired communication, which lacks the flexibility, for example, to deploy the required fixed wiring for power supplies and data transmission. In addition, this system faces difficulties in retrofitting when existing facilities are used for new processing operations (each of the cutting process parameters must be analyzed independently). To address this problem, wireless process monitoring system should be developed for laser cutting of advanced engineering material. There are many types of wireless technologiesbeing developed ranging from simple infrared data association (IrDA), which uses infrared light for short-range and point-to-pointcommunications; wireless personal area network(WPAN) for short range and point-to multi-point communications, such as Bluetooth and ZigBee; mid-range, multi-hop wireless local area network (WLAN) to long-distance cellular phone systems, such as global system for mobile/general packet radio service (GSM/GPRS) and code division multiple access (CDMA). Among them, Infrared, Zigbee, Bluetooth, and GSM are potential candidates for wireless data telemetry for the laser cutting data monitoring system. Infrared is a license-free communication techniques that requires a transmitter and a receiver in one line for data transmission. Zigbee is widely used innetwork data collections for monitoring temperature, gases, and others. Zigbee is not a power hungry system, but it cannot transmit over a large area of distance. Bluetooth is proven to transmit in the range of 10 m. However, high power usage makes the Bluetooth not commonly used for data transmission. Another technique for wireless transmission is the GSM. Although GSM can transmit over a large range of distance,it needs much money to carry out data transmission. GSM requires credit in the subscriber identity module (SIM) card for transmission. Credit will be deducted each time a message is sent depending on the operator and recipients. Our applications require continuous data sending for process monitoring purposes.Thus, GSM is not the best choice for our paper.Radio frequency (RF) transmission at 433 MHz offers a great advantage in terms of distance, power, and unit size. Certain RF modules can transmit over a 4 km distance and at the same time draw a small portion of power. In our applications, 433 MHz RF transmission is thebest option that offers limited power usage, high range of data transmission, low cost, and low maintenance. Previous researchers chose the RF transmission system based on its large monitoring range, low cost, reliability, low power, intelligence, installation flexibility, mobility, and miniaturization [5] - [13]. Currently, the laser cutting process has been studied at Universiti Sains Malaysia to examine its application in cutting advance engineering material [14] - [17]. The data monitoring system used is wired telecommunication. In this paper, we describe the design, fabrication, and preliminary investigation on a wireless temperature monitoring system for the laser cutting process. This work is a significant step towards temperature monitoring using a WSN for laser cutting process monitoring. II. T EMPERATURE W IRELESS S YSTEM D ESIGN A. Wireless System Module Architecture Fig. 1 shows a block diagram of a wireless sensor node. The system consists of two major parts: sensing element and data acquisitions. The sensing node is a combination of a multiple-type sensor, Analog to Digital Converter (ADC), memory, controller, and RF transceiver. A radio transceiver is often used for data transmission within a selected specific range. The major concern in WSN is power usage. Generally, a battery is used for power for computational and data transfer. Due to the application of this device in the laboratory, we decided to use a 12V source from a power supply.Fig. 1 Block diagram of a wireless sensor node. B. Sensor Node HardwareA thermocouple is a combination of two different metals (Alumel, Chromel) that produces voltage related to the temperature difference. Thermocouple type K is a wide range of temperature detection that extends from -200 to 1200ºC. It is suitable for the laser cuttingtemperature monitoring process. Thermocouple type K produces a very small analog output in linear form. This small signal output needs to amplify before 0-5V output can be produced. One method to gain the small signal and at the sametime obtain a stable output is using AD595 (Fig.2). The formula to obtain 10 mv/°C isAD595 output = (Type K Voltage + 11µV) x 247.3 (1)Fig. 2 AD595 completed systems.Based on Fig. 2, Constantan (Alumel) and Iron (Chromel) are connected to AD595 pin 14 and pin 1. The amplifying process starts at AD595 with a fixed gain at 247.3. The output gain of 10mV/°C from AD595 is stable. This output is then connected to a microcontroller for processing and transmitting at a selected range. In this system, the programmable system-on-chip (PSoC) microcontroller was selected to process the data from AD595. Operating at 5V makes the PSoC chip suitable for temperature monitoring applications. This application consists of two parts: the transmission part and the receiver part. After data are received from the sensor, the microcontroller processes the data and transmits to the receiver using a transceiver module. The receiver then receives the data. Power is the common factor in choosing the transceiver module. In this project, we used 508 RF modules that operate at a frequency of 403MHz and can transmit over a distance of 500m.C.Printed Circuit Board DesignA properly designed printed circuit board (PCB) is very important for the operation of the sensor and interfaces. The PCB is a two-layer standard FR-4 board 0.95 mm in thickness. The outline dimensions of the PCB are 89mm x 71mm. The top view (Fig. 3) shows the design using software Orcad Family Release 9.2. To maintain a small PCB layout, LED, MAX232, and PSoC chip were surface mounted.Fig. 3 Top view of the PCB design.D.Node SoftwareThis part describes how the system is developed, focusing on software programming implementation. The system is divided into several sections: sensor signal conditioning, displaying data from the sensor, sending data from the sensor through wireless, and receiving data from the transmitter node and monitor or logging the data into a form of raw information data that can be further analyzed.Fig. 4 shows how the system functions from sensor reading to the transmission of data from the sensor to the receiver. This project used the thermocouple sensor type K to monitor the temperature. The thermocouple sensor has a small output voltage in the milivolt range. A monolithic thermocouple amplifier with cold junction compensation (AD595) is used to amplify the output voltage that can integrate with the microcontroller, as shown in Fig. 5. The AD595 produces an output voltage of 10mv/°C. The maximum output voltage is about 15V depending on the power supply for IC AD595. The potential divider circuit is attached to the output voltage of AD595, which is used to scale down the voltage in the 0-5V output range. To obtain the same value of the output voltage from AD595, the output voltage at R2=5KΩ in Fig. 5 is multiplied by a value of three. This method is used because the ADC in the microcontroller can only measure input voltage (0-5V). In the microcontroller part, a 12-bit ADC is used to sample the 0-5V input voltage and then to convert the voltage signal into degree celsius. All the data can be displayed by an LCD module, and they are sent through a universal asynchronous receive transmit (UART) module integrated with the RF module. The interval time of transmitting the data for this test is about one minute.Fig. 4 Flow chart of the transmitter node software implementation.Fig. 5 Schematic diagram of the AD595 monolithic thermocouple amplifiers with cold junction compensation.Fig. 6 shows the flow chart of the receiver for the sensors database. It describes how the wireless receiver module system is integrated with the computer system. In the receiver part,the system is arranged and processed for display, allowing the user to monitor the sensors data byusing the data logger software. Raw data can be stored and logged in the form of text files, whichcan be used for further analysis by using software such as Microsoft Excel or other related software.Fig. 6 Flow chart of the receiver node software implementation.E. Data Logger SoftwareThe data logger software is designed to monitor and log the data from the sensors. The software can run using Microsoft Windows XP and Microsoft Windows Vista. Communication features include serial data transfers at 9600 bps. It can be directly connected to a PC using a serial port or a commercially available RS-232 com port. It can monitor the data from the sensor in real time with a time stamp included. All data recorded and logged as text files that can be further analyzed. All data are arranged in a line, as shown in Table 1.Table 1. Arrangement of dataTime Date Temperature (o C)09:20AM 27-01-2010 23.75 09:21AM 27-01-2010 23.75 09:22AM 27-01-2010 23.75III. E XPERIMENTAL M ETHODSThis experiment involves the transmitter and receiver parts. The transmitter part consists of a temperature controller, sensor node (transmitter), heater, and holder, as shown in Fig. 7. On the other hand, the receiver part is made up of a receiver node and a laptop, as shown in Fig. 8. The temperature controller can set the temperature in the range of 0-400ºC. The thermocouple sensor in the sensor node is attached to the heater to obtain the temperature data. The holder is used to hold the thermocouplesensor and the heater during the experiment. When the temperature controller is set at a certain temperature, the heater burns, and the thermocouple reads the temperature value displaydata on the LCD and transmits the data from thesensor node to the receiver node at the same time.Fig. 7 Experiment setup of the transmitter part.In the receiver, data from the transmitter part are received by the receiver node. Data are stored and logged in the laptop using the database software. A universal serial bus (USB) to serial converter is used to connect between the receiver node and the laptop. The temperature value is monitored in real time mode on the LCD in the transmitter part. The receiver node collects the data at an interval time of about one minute, which can be monitored using the laptop. The range between the transmitter part and the receiver part is about 5m. Therefore, data are wirelessly transmitted from the sensor node to the receiver node at about 5m. This experiment was conducted in a laboratory at the School ofTemperature controller Sensor node (Transmitter)Heater and holderMechanical Engineering, Universiti Sains Malaysia.Fig. 8 Experiment setup of the receiver partIV. R ESULTS AND D ISCUSSIONFig. 9 shows the record data for one minute an interval time and 5m range. The results showed that the device was capable to measure temperature and transmit the data wirelessly to the computer. The measured data was verified with type K thermocouple attached to digitalthermometer from Digitron, model 2020T during the test.V.C ONCLUSIONIn this work, hardware and software architectures of wireless temperature acquisition system for laser cutting process were designed and presented that is based on RF technology.Type K thermocouple had been integrated in the PSoC platform to monitor temperature during thecutting process. Preliminary test prove that thedeveloped prototype is capable to monitortemperature, while the device has severaladvantages in term of its compact size, low costand high accuracy. The designed wireless temperature acquisition system could meet the goal of providing real-time data on temperaturemonitoring and remote querying. This device also can be used in other process industries, mining,defense and bio-medical applications. Therefore, future work will focus on implementation of multi-node network and implement the network for real-time control application in laser cutting process. The scope for future research will include data analysis, control solution and complex networks setups.VI. R EFERENCES[1] Ning Wang, Naiqian Zhang, Maohua Wang,"Wireless sensors in agriculture and food industry-Recent development and future perspective," Computers and Electronics in Agriculture , vol. 50, pp. 1–14 (2006). [2] Yilbas B.S., Karatas C., Uslan, I., Keles, O.,Usta, Y., Yilbas, Z., Ahsan, M., "Wedge cutting of mild steel by CO2 laser and cut-quality assessment in relation to normal cutting," Optics and Lasers in Engineering , vol. 46, pp. 777– 784 (2008). [3] Tirumala, R. B., Rakesh Kaul, Pragya Tiwari,A.K. Nath, "Inert gas cutting of titanium sheet with pulsed mode CO2 laser," Optics and Lasers in Engineering , vol. 43, no. 12, pp. 1330-1348 (2005).[4] Black, I., "Laser cutting speeds for ceramic tile: atheoretical–empirical comparison," Optics & Laser Technology , 30(2): 95-101 (1998). [5] Cheng Wang, Chunjiang Zhao, Xiaojun Qiao,Xin Zhang, Yunhe Zhang, IFIP International Federation for Information Processing , Springer Boston, Vol. 259, (2008). [6] Qingshan Shan, David Brown, Ying Liu,"Wireless Temperature Sensor Network for Refrigerated Vehicles," Proc. IEEE ISIE'05,IEEE International Symposium on Industrial Electronics, Dubrovnik, Croatia (2005).[7] Mikko Kohvakka, Marko Hannikainen, Timo D.Hamalainen, "Ultra Low Energy WirelessTemperature Sensor Network Implementation,"Proc. IEEE 6th International Symposium on Personal, Indoor and Mobile Radio Communications (2005).[8] Xiping Yang, Keat G. Ong, William R. Dreschel,Kefeng Zeng, Casey S. Mungle and Craig A. Grimes, "Design of a Wireless Sensor Network for Long Term, In-Situ Monitoring of an Aqueous Environment," Sensors , vol. 2, no. 11, pp. 455-472 (2002). [9] Changsu Suh, Young-Bae Ko, Cheul-Hee Lee and Hyung-Joon Kim, "The Design and Computerfor database ReceivernodeImplementation of Smart Sensor-Based HomeNetworks," Proc. IEEE SENSORS'06, International Conference for Sensors (2006). [10]Tavares, J., Velez, F. J., Ferro, J.M., "Applicationof Wireless Sensor Networks to Automobiles,"Measurement Science Review, vol. 8, no. 3, pp.65 - 70 (2008).[11]Son, Byungrak, Her, Yong-sork and Kim, Jung-Gyu., "A Design and Implementation of Forest-Fires Surveillance System based on WirelessSensor Networks for South Korea Mountains,"International Journal of Computer Science andNetwork Security, vol. 6, no. .9b, pp. 124-130(2006).[12]Lopez Riquelme J., Soto F., Suardíaz J., SánchezP., Iborra A., Vera J., "Wireless Sensor Networksfor precision horticulture in Southern Spain,"Computers and Electronics in Agriculture, vol.68, no. 1, pp. 25-35 (2009).[13]Xuhui Zhang, "Automatic Calibration of MethaneMonitoring Based on Wireless Sensor Network,"Proc. WiCOM '08. 4th International Conferenceon Wireless Communications, Networking andMobile Computing, vol., no., pp.1-4, 12-14(2008).[14]Nyon, K.Y., Mokhtar, M., M.R. Abdul Rahman,“Studies on temperature profiles in inconel 718during laser cutting using FE simulation,” Proc.MERC'09, 9th Mechanical Engineering ResearchColloquium (2009).[15]Mokhtar, M. and Yusoff, T. K. T., "Effect ofLaser Power Output and Cutting Speed inControlling the Surface Roughness Formation ofIncoloy ® 800," Proc. MERC'09, 9th MechanicalEngineering Research Colloquium (2009).[16]Mokhtar, M., Nyon K. Y. & Muhamad, M. R.,“Practical approach for real-time temperaturemeasurement for carbon dioxide (CO2) lasercutting.” Proc. ICAME'09, International Conference on Advances in Mechanical Engineering (2009).[17]Mokhtar, M., Yusoff, T. K. T and Muhamad, M.R., "Effect of Laser Power Output and CuttingSpeed in Controlling the Kerf Width Formationof Incoloy® 800," Proc. ICAME'09, InternationalConference on Advances in Mechanical Engineering (2009).。
AcuRite 无线温度计说明书
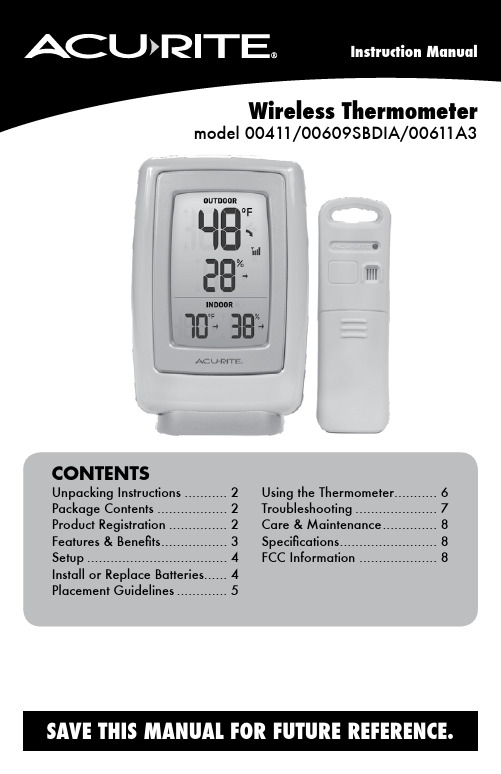
CONTENTS Unpacking Instructions (2)Package Contents (2)Product Registration (2)Features & Benefits (3)Setup (4)Install or Replace Batteries (4)Placement Guidelines (5)Using the Thermometer (6)Troubleshooting (7)Care & Maintenance (8)Specifications (8)FCC Information (8)Wireless Thermometermodel 00411/00609SBDIA/00611A3Congratulations on your new AcuRite product. To ensure the best possible product performance, please read this manual in its entirety and retain it for future reference.Unpacking InstructionsRemove the protective film that is applied to the LCD screen prior to using this product. Locate the tab and peel off to remove.Package Contents1.Display unit with tabletop stand2.Outdoor sensor3.Instruction ManualFeatures & BenefitsArrow icon indicates the direction the temperature is trending 2.High Outdoor Temperature Record 3.Low Outdoor Temperature Record 4.High Outdoor Humidity Record 5.Current Outdoor HumidityArrow icon indicates the direction the humidity is trending.6.Low Outdoor Humidity Record 7.Current Indoor TemperatureArrow icon indicates the direction the temperature is trending8.Low Indoor Temperature andHumidity Recordthe humidity is trending 10.High Indoor Temperature andHumidity Record 11.Display Low Battery Indicator 12.Outdoor Sensor LowBattery Indicator13.Outdoor Sensor Signal StrengthOUTDOOR SENSOR14.Integrated Hangerfor easy placement15.Wireless Signal IndicatorFlashes when data is being sent to the display unit 16.Battery Compartment Cover 1723465Main Unit Detachable StandIncluded with the main unit is a detachablestand for tabletop placement.Install or Replace BatteriesAcuRite recommends high quality alkalinebatteries for the best product performance. Heavy duty or rechargeable batteries are not recommended.The outdoor sensor requires lithium batteries in low temperature conditions. Cold temperatures can cause alkaline batteries to function improperly. Use lithium batteries in the outdoor sensor for temperatures below -4ºF / -20ºC.Outdoor Sensor1.S lide off the battery compartment cover.2.I nsert 2 x AA batteries into the batterycompartment, as shown. Follow the polarity(+/-) diagram in the battery compartment.3.R eplace the battery cover.Display Unit1.S lide off the battery compartment cover.2.I nsert 2 x AA batteries into the batterycompartment, as shown. Follow the polarity(+/-) diagram in the battery compartment.3.R eplace the battery cover.Select Degrees Fahrenheit or CelsiusTo select between degrees Fahrenheit (ºF) or Celsius (ºC) temperature units, press the “ºF/ºC” button located on the back of display.batteries properly. Only batteries of the same or equivalent type as recommended are to be used. DO NOT incinerate used batteries. DO NOT dispose of batteries in fire, as batteries may explode or leak. DO NOT mix old and new batteries or types of batteries (alkaline/standard). DO NOT use rechargeable batteries. DO NOT recharge non-rechargeable batteries. DO NOT short-circuit the supply terminals.Placement for Maximum AccuracyAcuRite sensors are sensitive to surrounding environmental conditions. Proper placement of both the display unit and outdoor sensor are critical to the accuracy and performance of this product.Display Unit PlacementPlace the display unit in a dry area free of dirt and dust. Display unit stands upright for tabletop use or is wall-mountable.Outdoor Sensor PlacementSensor must be placed outside to observe outdoor conditions. Sensor is water resistant and is designed for general outdoor use, however, to extend its life place the sensor in an area protected from direct weather elements.Hang the sensor using the integrated hang holes or hanger, orby using string (not included) to hang it from a suitable location, like a well covered tree branch. The best location is 4 to 8 feet above the ground with permanent shade and plenty of fresh air to circulate around the sensor.Important Placement Guidelines•To ensure accurate temperature measurement, place units out of direct sunlight and away from heat sources or vents. •Display unit and outdoor sensor must be within 165 ft (50 m) of each other.•To maximize wireless range, place units away from large metallic items, thick walls, metal surfaces, or other objects that may limit wireless communication.•To prevent wireless interference, place both units at least 3 ft (.9 m) away from electronic devices (TV, computer, microwave, radio, etc.)Setup is CompleteThe sensor will now synchronize with the display unit. It may take a few minutes for synchronization to complete. Please refer to the troubleshooting section of this manual if anything appears to be functioning improperly.(50 meters)(165 feet maximum)Using the ThermometerHigh/Low RecordsHigh an low records reflect the minimum and maximum temperature recorded since the unit was powered on, since the batteries were changed, or since it was manually reset (whichever was most recent).To view the LOW temperature record, press and release the “” button. The “” icon appears on the display next to the low records.To view the HIGH temperature record, press and release the “” button. The “” icon appears on the display next to the high records.To reset the LOW records, press AND HOLD the “” button while viewing the low records. Dashes will display to confirm all low values have been cleared. To reset the HIGH records, press AND HOLD the “” button while viewing the high records. Dashes will display to confirm all high values have been cleared.TroubleshootingCare & MaintenanceDisplay Unit CareClean with a soft, damp cloth. Do not use caustic cleaners or abrasives. Keep away from dust, dirt and moisture. Clean ventilation ports regularly with a gentle puff of air.Outdoor Sensor CareClean with a soft damp cloth. Do not use caustic cleaners or abrasives. SpecificationsTEMPERATURE RANGE Outdoor: -40ºF to 158ºF; -40ºC to 70ºCIndoor: 32ºF to 122ºF; 0ºC to 50ºCHUMIDITY RANGE1% to 99% RHWIRELESS RANGE165 ft / 50 m depending on home construction materials WIRELESS FREQUENCY433 MHzPOWER Display: 2 x AA alkaline batteriesSensor: 2 x AA alkaline or lithium batteriesDATA REPORTING Outdoor data: 31 second updatesIndoor data: 60 second updatesFCC InformationThis device complies with part 15 of FCC rules. Operation is subject to the following two conditions:1- This device may NOT cause harmful interference, and2- This device must accept any interference received, including interference that may cause undesired operation. WARNING: Changes or modifications to this unit not expressly approved by the party responsible for compliance could void the user’s authority to operate the equipment.NOTE: This equipment has been tested and found to comply with the limits for a Class B digital device, pursuant to Part 15 of the FCC rules. These limits are designed to provide reasonable protection against harmful interference in a residential installation. This equip-ment generates, uses and can radiate radio frequency energy and, if not installed and used in accordance with the instructions, may cause harmful interference to radio communications. However, there is no guarantee that interference will not occur in a particular installation. If this equipment does cause harmful interference to radio or television reception, which can be determined by turning the equipment off and on, the user is encouraged to try to correct the interference by one or more of the following measures:• Reorient or relocate the receiving antenna.• Increase the separation between the equipment and the receiver.• Connect the equipment into an outlet on a circuit different from that to which the receiver is connected.• Consult the dealer or an experienced radio/TV technician for help.NOTE: The manufacturer is not responsible for any radio or TV interference caused by unauthorized modifications to this equipment. Such modifications could void the user authority to operate the equipment.This device complies with Industry Canada licence-exempt RSS standard(s).Operation is subject to the following two conditions:(1) This device may not cause interference, and(2) This device must accept any interference received, including interference that may cause undesired operation of the device.。
TEMP-WiFi-TP 无线温度数据日志器说明书
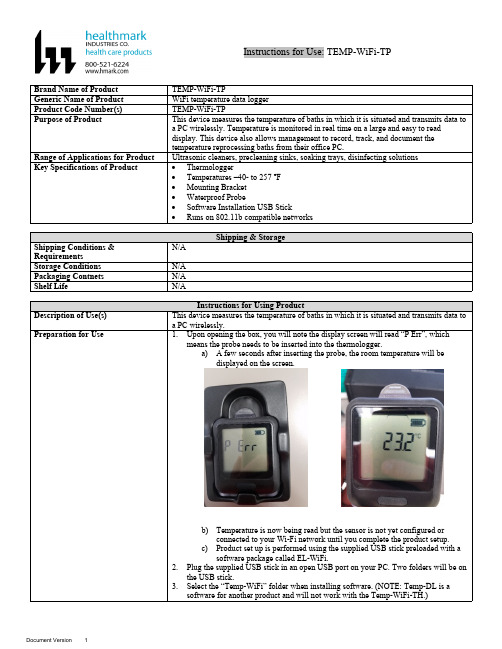
Instructions for Use: TEMP-WiFi-TPBrand Name of Product TEMP-WiFi-TPGeneric Name of Product WiFi temperature data loggerProduct Code Number(s)TEMP-WiFi-TPPurpose of Product This device measures the temperature of baths in which it is situated and transmits data toa PC wirelessly. Temperature is monitored in real time on a large and easy to readdisplay. This device also allows management to record, track, and document thetemperature reprocessing baths from their office PC.Range of Applications for Product Ultrasonic cleaners, precleaning sinks, soaking trays, disinfecting solutionsKey Specifications of Product∙Thermologger∙Temperatures –40- to 257 ℉∙Mounting Bracket∙Waterproof Probe∙Software Installation USB Stick∙Runs on 802.11b compatible networksa PC wirelessly.1.Upon opening the box, you will note the display screen will read “P Err”, whichmeans the probe needs to be inserted into the thermologger.a) A few seconds after inserting the probe, the room temperature will bedisplayed on the screen.b)Temperature is now being read but the sensor is not yet configured orconnected to your Wi-Fi network until you complete the product setup.c)Product set up is performed using the supplied USB stick preloaded with asoftware package called EL-WiFi.2.Plug the supplied USB stick in an open USB port on your PC. Two folders will be onthe USB stick.3.Select the “Temp-WiFi” folder when installing software. (NOTE: Temp-DL is asoftware for another product and will not work with the Temp-WiFi-TH.)USE THESE PICTURES (ALONG WITH THE NUMBERED STEPS BELOW) FOR ACCURATE SET UP.1.2. 3.4. 5.6.7.8.9.10.11.12.13.14.15.16.17.18.19.20.21.Steps for Use of Product 1.When the thermometer is plugged into your PC, you will see the “New hardwaredetected.” NOTE: The driver should automatically install. If not, you may needadministrative rights assistance from your IT department.2.Browse to the USB drive.3.Open the folder titled “Temp-WiFi”.4.Double click the “Setup” icon to launch the installation of the software.5.When presented the option, select “Next” from the installation window.6.Select “Install” from the installation window.7.Please note, you may wait a few minutes before installation takes place.8.This window will inform you of what destination the “Temp-WiFi” software will beinstalled on your computer. If you are satisfied with the folder location, select“Next”. If you would like to change the installation destination, select the “Change”button to the right of the screen.9.Once completed, click “Finish” to close the install window.YOU ARE NOW DONE WITH THE SETUP.10.There should now be an EasyLog WiFi icon on your desktop.11.When EasyLog WiFi icon is selected, you will see a screen to set up sensor, viewsensors, or view previously saved data.12.To set up sensor, select “Set up Sensor” icon and connect your sensor to the PC withthe USB cable provided.13.To find a wireless network for the sensor to connect to click “Next” to search fornetworks.14.Select the wireless network you wish to connect to and click “Next”. NOTE: Youwill need a Wi-Fi access code for this step.15.Wi-Fi temp program will link to wireless network.16.To view and adjust a temperature sensor, click “view sensor” from the home screen.17.Viewing and adjusting sensor general settings:∙Give the sensor a unique identity∙Select temperature scale∙Select sample rate. (This will set how often the sensor takes readings.)To determine an accurate sample rate, use an appropriate reference thatrelates to your specific need for the Temp WiFi.∙Select how often the sensor will communicate with the PC (eachcommunication reduces battery life).18.Temperature Alarm will appear when the alarm is triggered (whether it’s a low alarmor high alarm).19.When you see the “Set up Complete” screen, you may disconnect your USB cable.All future settings can now be adjusted without a physical connection.20.Now, position the monitor in the location you want to monitor. To view the signalstrength, press the button on the sensor three (3) times.21.For more information and instructions on using the sensor and software, click the “i”button on the home screen.Interpretation of Results N/AContraindications of Test Results N/ADocumentation N/ASpecial Warnings and Cautions∙Recharging: The sensor will automatically start recharging while connected to a PC.The battery life of your sensor depends on the regularity of the transmissions.∙Be sure (when mounting the sensor) that it is secure and in an area that won’t get wet.The probe is designed to be submerged in liquid, but the thermologger is not. Disposal N/AReassembly Instructions N/APackaging N/ASterilization N/AStorage N/AAdditional Information N/ARelated Healthmark Products N/AOther Product Support Documents ProFormance™ Brochure, ProFormance™ Price List Reference Documents N/ACustomer Service Contact Healthmark Industries Company, Inc.18600 Malyn Blvd.Fraser, MI 480261-586-774-7600********************。
标智测温枪英文说明
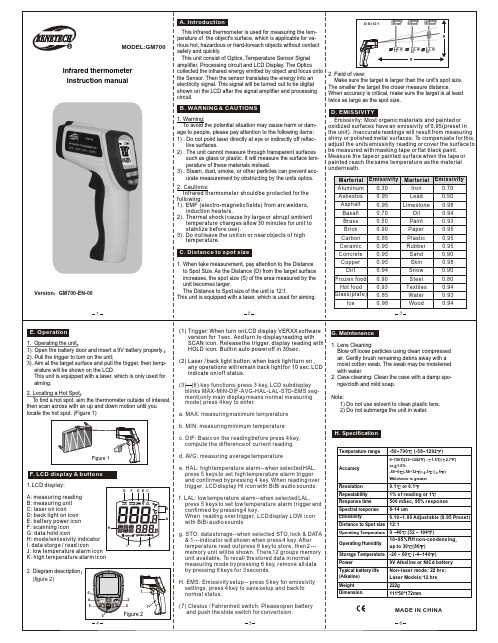
(1) Trigger: When turn on LCD display VERXX software version for 1 sec. And turn to display reading with SCAN icon. Release the trigger, display reading with HOLD icon. Built in auto power off in 30sec.
a. MAX: measuring maximum temperature
G. Maintenence
1. Lens Cleaning: Blow off loose particles using clean compressed air. Gently brush remaining debris away with a moist cotton swab. The swab may be moistened with water.
2. Cautions: Infrared thermometer should be protected for the
following: 1). EMF (electro-magnetic fields) from arc welders,
induction heaters. 2). Thermal shock (cause by large or abrupt ambient
H
G: data hold icon
H: mode/emissivity indicator
温度检测英文参考文献

An Automatic Measuring System Based on Atmospherical Measurement Used for Temperature Relay For temperature relay, it is very important to measure its temperatures for action and reversion. In this paper, anautomatic measuring system based on atmospherical measurement is discussed, which is very simple andprecise in practical application. In atmospherical measurement, it is crucial to design a favorable temperaturefield. The resistance stove is designed for simulating temperature field. The even temperature is improved bylong-time warm-up and placing orifice-board in testing room. According to the enactment controlling temperature curve, the algorithm of fuzzy control is used to control the temperature in temperature field. The regulating voltage mode of double-direction Bi-directional thyristors is used for controlling temperature. The system consists of the console and the resistance stove,and the console includes software platform and hardware platform. In this system, The method of grouping the resistance wire of resistance stove according to the power is put forward, and the performance of resistance stove is improved based on this method. The measuring precision is improved by using the minimum two-multiplication to calibrate the error. At present, the system has been practically applied in manufacture, which has gained obvious economy benefit and will be widely applied in the future.1. IntroductionThe temperature relay is one of common relays, which takes action when the outside temperature arrives at the given temperature. The temperature relay performs lots of functions, such as temperature control, fire alarm, automatic ignition, wiring heat-protection, so it is widely used in scientific research, industry and defense industry etc. For temperature relay, it is very important to measure its temperatures for action and reversion. But in the current manufacture, the manual measuring methods, such as spot-check method, mercuric thermometer method etc, dominate the measuring methods. However there are some inescapable short comings in these methods, such as low efficiency, large labor intensity and bad precision etc. Thus measurement has become the bottleneck of the quality of temperature relay. With theperpetual progress in the technology, the need for product quality gets more and more strict and the degree in manufacture automatization gets more and more deep. For temperature relay, today the manual measuring methods have become unfitted for the need for manufacture and will be necessarily replaced by the automatic measuring methods. In this paper, an automatic measuring system based on atmospherical measurement is discussed, which is very simple and precise in practical application.2. Measuring principieTwo kinds of metals whose inflated coefficient make a great deal of difference are hard composed together, and then the dishing twin-sheet metal comes into being.When the temperature relay arrives at a certain given value, one upward curving force will come into being in twin-sheet metal as a result of big expanding for nether metal and small expanding for upper metal. When the twin-sheet metal bends at a certain extent, it will drive the electric contact and switch on or switch off the circuit. When the temperature relay reduces at a certain given value, the twin-sheet metal gradually involutes. When the twin-sheet metal resumes at a certain extent, it will 3rd International Symposium on Instrumentation Science and Technology Aug. 18~22, 2004, Xi’an. China drive the electric contact in inverse direction and switch on or switch off the circuit. The working principle of dishing twin-sheet metal is described as Fig1:1-the initiatory state(room temperature), 2-the state after heated or cooled, 3-displacement.The temperature relay takes action due to the rising of ambience temperature or the heating of passing current.The resistance of relay is very small. So compared with the temperature rising caused by ambience temperature, the temperature rising caused by current heating also is very small and can be ignored. Thus measuring temperatures for action and reversion is implemented by controlling the environment temperature. There are three methods for measuring temperatures for action and reversion, which are liquid measurement, atmospherical measurement and testing-block measurement in GJB1517-92<Total criterion for constant temperature relay>.[1] Liquid MeasurementIn the constant temperature trough whose temperature can be intercalated, the medium that is water or oil is equably churned up. The measuring method is that the product is placed in the constant temperature trough heated or cooled. Because the liquid is equably churned up, the even temperature, good and the temperature precision is fairly high in which the temperature error is the temperature fluctuating degree is ±0.3℃. Thus the heating coherence of the products that are placed in different position in the constant temperature trough is very good, the measuring precision is very high and the parameter-repeating quality is all right. But this method is just applied in sealed temperature relay and the oil can stain the product. So few manufacturer adopts the method. Only the disputed appears and precise measurement is needed, the method is adopted.[2] Atmospherical MeasurementThe electrical oven whose temperature can be intercalated equably churns up the atmosphere. The measuring method is that the product is placed in the electrical oven heated or cooled. In the temperature field, the even temperature that is ±2℃and the temperature precision in which the temperature error is ±2℃and the temperature fluctuating degree is ±1.5℃are both not good. The heating coherence of the products that are placed in different position in the electrical oven, the measuring precision and the parameter-repeating quality apparently are not as much as liquid measurement. But the method is widely adopted because of simpleness,few pollution and batch.[3] Testing-block MeasurementA coppery block with a thermometer whose diameter isφ60~φ90mm and whose thickness is 20~30mm and a set of heating or cooling device make up of the measuring system.The measuring method is that in the room temperature the product is tightly placed on the surface of testing-block that is placed on the heating or cooling device whose temperature can be adjusted, and the temperature characteristic of the product is determined by measuring the temperature of the testing-block. Adjusting temperature of the testing-block is very hard because of measured in the room temperature, thus only a few product can be measured each time and the method unfitsfor volume-produce. But because of its simpleness, it fits for a small quantity of produce.Generally speaking, if the product is sealed and isn’t stained by oil, liquid measurement is adopted; if the product is placed in the heating or sealed body, atmospherical measurement is adopted; if the product is placed on the surface of the controlled object in room temperature, testing-block measurement is adopted. In this system, atmospherical measurement is adopted.In atmospherical measurement, the electrical oven is used for simulating the environmental temperature around the temperature relay. So for accomplishing measurement and enhancing precision, it is crucial to design a favorable temperature field. In this system, the resistance stove is designed for simulating temperature field. The performance of the temperature field is greatly improved by the even temperature and by the algorithm for controlling temperature.Because the temperature field takes atmosphere as the diathermanous medium, heat convection has a great effect on the distribution of the temperature field. In course of measuring, the fan is used for strengthening heat convection. But because of heat radiation in the testing room and obstruction from the diathermanous board onthe clamp that doesn’t make heated atmosphere swimmingly cycle, the temperature field degressively distributes by height in the vertical, and the temperature grads field comes into being. Thus the temperature asymmetry is inevitable. In this system, two methods are used for improving the even temperature. One is that by long-time warm-up atmosphere in testing room is adequately heated and the temperature grads is reduced.The other is that the orifice-board for making airflow equably flow is placed in testing room, thereby the temperature stability in the section of the measuring point is effectively ensured.In the light of academic analysis and repeating experimentation, the perfect controlling temperature curve of the temperature field is described as Fig 2:TB-the demarcated temperature for action , the parameter which express the decentralization of the temperature for action. Firstly the temperature high-rate rises. When the temperature arrives at the range of the temperature for action, the temperature rises bythe slower rate K2 and the temperature for action is measured. When the temperature arrives at the upper limit of the temperature for action, the temperature falls by the slower rate K3 and the temperature is measured. For the resistance stove, lag, inertia and nonlinear are bad and the parameter changes with time. Thus according to the enactment controlling temperature curve, the algorithm of fuzzy control is used to control the temperature in temperature field. So the model of the controlled object can be avoided identifying and Robust is excellent. The regulating voltage mode of double-direction Bi-directional thyristors is used for controlling temperature. Firstly the value and error of the temperature are fuzzied, and then the fuzzy rule from repeating experimentation does fuzzy illation, then through the barycenter method fuzzy estimate calculates the accurate value, at last after D/A transform the accurate value controls the Bi-directional thyristors by regulating voltage, so temperature risingOr falling of the resistance stove can be controlled.3. Automatic measuring systemAutomatically controlled by the computer, the temperature of the resistance stove reposefully rises from the lower limit of the temperature for action. When the relay takes action, the temperature for action is displayed and the arraignment appears, then the computer automatically controls the temperature reposefully falling. When the relay reverts, the temperature for reversion is also displayed and the arraignment appears, thereby an integrated measuring process ends.Based on Windows2000 operating system, the software developed by Microsoft Visual Basic 6.0 makes up of measuring module, user interface and database of measuring result. As control core of the measuring system, the measuring module automatically controls temperature rising or falling of the resistance stove, real-time acquires the temperature signal and the switch signal of the temperature relay, measures and records temperatures for action and reversion, alarms beyond the temperature range etc. The user interface consists of command button and menu, real-time temperature curve and the windows that real-time display measuring state and real-time modify parameters, which offers the user a friendly man-machineinterface. forms for the future analysis and estimate. Thus the database of measuring result is created, which effectively performs the functions of data backup and printing recordation. Furthermore, some accessorial programs are designed, such as hardware exception handles, real-time modify parameters program, upgrade program etc, which effectively enhance reliability and maintainability of the system.In this system, two methods are adopted aiming at some technical difficulty in measuring process, which obviously enhance the holistic quality.[1] The method of grouping the resistance wire of resistance stove according to the powerThe three-phase SSR electric power regulator indirectly regulates heating power through regulating switching on and off time of the resistance wire, thereby controls temperature rising or falling of the resistance stove. But the regulative extent of high-power stove wire is so wide that it is very difficult to accurately control the rate of rising or falling. For enhancing regulative sensitivity, lower-power stove wire should be adopted. However because the system comes down to more than twenty products and the measuring upper limit arrives at 600, the low-power stove wire cannot heat to such a high temperature. Facing to this problem, the method ofgrouping the resistance wire of resistance stove according to the power is put forward, which is that the low-power stove wire is applied in low temperature and the high-power stove wire is applied in high temperature. It is practically proved that the method effectively solves above problem and improves the quality of resistance stove.[2] The holistic minimum two-multiplication to calibrate the errorIn this system, the holistic minimum two-multiplication to calibrate the error is adopted. Firstly the current temperature at measuring point is mensurated by the high-precision temperature sensor, at the same time the current value output to computer is gained, and then a set of such data is mensurated in the temperature range.coefficients of the minimum two-multiplication multinomial are gained. At last when the coefficients are input nto program, the fitting of temperature cure is accomplished and the holistic system error is calibrated.4. ConclusionThe automatic measuring system used for temperature relay has been checked and accepted. The critical result is shown as follows. Thus it can be seen that the system has gained obvious economy benefit and will be widely applied in the future. References[1]HU Hong-bin. Measuring for temperature characteristic of temperature relay.Electro Mechanical element, 2003,(9):46-48[2]SUN Kai. Controlling temperature system of resistance stove. Sensor Technology,2003,22(2): 50-52[3]ZHONG Guo-min, WANG Gai-ming. A system used for controlling temperature.Automatization transaction, 1993,19(2):223-226[4]CHEN Hua, FU Li-hua.Application of controlling temperature using fuzzy controltheory. Journal of Liaoning university, 1995,22(1):34-38[5]LI Xian-ming.Research for automatic measuring system of temperature relay.Electron andAutomatization, 1997(3):24-27测量大气温度的自动测试系统温度继电器,它在国内外都有非常重要的作用,其温度的行动和逆转。
分布式温度传感器外文翻译

外文翻译(原文)Distributed Temperature SensorIn the human living environment, temperature playing an extremely important role。
No matter where you live, engaged in any work, ever-present dealt with temperature under. Since the 18th century, industry since the industrial revolution to whether can master send exhibition has the absolute temperature touch. In metallurgy, steel, petrochemical, cement, glass, medicine industry and so on, can say almost eighty percent of industrial departments have to consider the factors with temperature. Temperature for industrial so important, thus promoting the development of the temperature sensor.Major general through three sensor development phase: analog integrated temperature sensor. The sensor is taken with silicon semiconductor integrated workmanship, therefore also called silicon sensor or monolithic integrated temperature sensor. Such sensing instruments have single function (only measuring temperature), temperature measurement error is smaller, price low, fast response, the transmission distance, small volume, micro-consumption electronic etc, suitable for long distance measurement temperature, temperature control, do not need to undertake nonlinear calibration, peripheral circuit is simple. It is currently the most common application at home and abroad, an integrated sensor。
红外温度测试仪中英文翻译

附录一:英文技术资料翻译英文原文:Emerg Infect Dis. 2008 August; 14(8): 1255–1258.doi: 10.3201/eid1408.080059PMCID: PMC2600390Cutaneous Infrared Thermometry for Detecting Febrile PatientsPierre Hausfater, Yan Zhao, Stéphanie Defrenne, Pascale Bonnet, and Bruno Riou* Author information Copyright and License informationThis article has been cited by other articles in PMC.AbstractWe assessed the accuracy of cutaneous infrared thermometry, which measures temperature on the forehead, for detecting patients with fever in patients admitted to an emergency department. Although negative predictive value was excellent (0.99), positive predictive value was low (0.10). Therefore, we question mass detection of febrile patients by using this method.Keywords: Fever, mass detection, cutaneous infrared thermometry, infectious diseases, emergency, dispatchRecent efforts to control spread of epidemic infectious diseases have prompted health officials to develop rapid screening processes to detect febrile patients. Such screening may take place at hospital entry, mainly in the emergency department, or at airports to detect travelers with increased body temperatures (1–3). Infrared thermal imaging devices have been proposed as a noncontact and noninvasive method for detecting fever (4–6). However, few studies have assessed their capacity for accurate detection of febrile patients in clinical settings. Therefore, we undertook a prospective study in an emergency department to assess diagnostic accuracy of infrared thermal imaging.The StudyThe study was performed in an emergency department of a large academic hospital (1,800 beds) and was reviewed and approved by our institutional review board (Comitéde Protection des Personnes se Prêtant àla Recherche Biomédicale Pitié-Salpêtrière, Paris, France). Patients admitted to the emergency department were assessed by a trained triage nurse, and several variables were routinely measured, including tympanic temperature by using an infrared tympanic thermometer (Pro4000; Welch Allyn, Skaneateles Falls, NY, USA), systolic and diastolic arterial blood pressure, and heart rate.Tympanic temperature was measured twice (once in the left ear and once in the right ear). This temperature was used as a reference because it is routinely used in our emergency department and is an appropriate estimate of central core temperature (7–9). Cutaneous temperature was measured on the forehead by using an infrared thermometer (Raynger MX; Raytek, Berlin, Germany) (Figure 1). Rationale for an infrared thermometer device instead of a larger thermal scanner was that we wanted to test a method (i.e., measurement of forehead cutaneous temperature by using a simple infrared thermometer) and not a specific device. The forehead region was chosen because it is more reliable than the region behind the eyes (5,10). The latter region may not be appropriate for mass screening because one cannot accurately measure temperature through eyeglasses, which are worn by many persons. Outdoor and indoor temperatures were also recorded.Figure 1Measurement of cutaneous temperature with an infrared thermometer. A) The device is placed 20 cm from the forehead. B) As soon as the examiner pulls the trigger, the temperature measured is shown on the display. Used with permission.The main objective of our study was to assess diagnostic accuracy of infrared thermometry for detecting patients with fever, defined as a tympanic temperature >38.0°C. The second objective was to compare measurements of cutaneous temperature and tympanic temperature, with the latter being used as a reference point. Data are expressed as mean ± standard deviation (SD) or percentages and their 95% confidence intervals (CIs). Comparison of 2 means was performed by using the Student t test, and comparison of 2 proportions was performed by using the Fisher exact method. Bias, precision (in absolute values and percentages), and number of outliers (defined as a difference >1°C) were also recorded. Correlation between 2 variables was assessed by using the least square method. The Bland and Altman method was used to compare 2 sets of measurements, and the limit of agreement was defined as ±2 SDs of the differences (11). We determined the receiver operating characteristic (ROC) curves and calculated the area under the ROC curve and its 95% CI. The ROC curve was used to determine the best threshold for the definition of hyperthermia for cutaneous temperature to predict a tympanic temperature >38°C. We performed multivariate regression analysis to assess variables associated with thedifference between tympanic and infrared measurements. All statistical tests were 2-sided, and a p value <0.05 was required to reject the null hypothesis. Statistical analysis was performed by using Number Cruncher Statistical Systems 2001 software (Statistical Solutions Ltd., Cork, Ireland).A total of 2,026 patients were enrolled in the study: 1,146 (57%) men and 880 (43%) women 46 ± 19 years of age (range 6–103 years); 219 (11%) were >75 years of age, and 62 (3%) had a tympanic temperature >38°C. Mean tympanic temperature was 36.7°C ± 0.6°C (range 33.7°C–40.2°C), and mean cutaneous temperature was 36.7°C ± 1.7°C (range 32.0°C–42.6°C). Mean systolic arterial blood pressure was 130 ± 19 mm Hg, mean diastolic blood pressure was 79 ± 13 mm Hg, and mean heart rate was 86 ± 17 beats/min. Mean indoor temperature was 24.8°C ± 1.1°C (range 20°C–28°C), and mean outdoor temperature was 10.8°C ± 6.8°C (range 0°C–32°C). Reproducibility of infrared measurements was assessed in 256 patients. Bias was 0.04°C ± 0.35°C, precision was 0.22°C ± 0.27°C (i.e., 0.6 ± 0.7%), and percentage of outliers >1°C was 2.3%.Diagnostic performance of cutaneous temperature measurement is shown in Table 1. For the threshold of the definition of tympanic hyperthermia definition used (37.5°C, 38°C, or 38.5°C), sensitivity of cutaneous temperature was lower than that expected and positive predictive value was low. We attempted to determine the best threshold (definition of hyperthermia) by using cutaneous temperature to predict a tympanic temperature >38°C (Figure 2, panel A). Area under the ROC curve was 0.873 (95% CI 0.807–0.917, p<0.001). The best threshold for cutaneous hyperthermia definition was 38.0°C, a condition already assessed in Table 1. Figure 2, panels B and C shows the correlation between cutaneous and tympanic temperature measurements (Bland and Altman diagrams). Correlation between cutaneous and tympanic measurements was poor, and the infrared thermometer underestimated body temperature at low values and overestimated it at high values. Multiple regression analysis showed that 3 variables (tympanic temperature, outdoor temperature, and age) were significantly (p<0.001) and independently correlated with the magnitude of the difference between cutaneous and tympanic measurements (Table 2).Table 1Assessment of diagnostic performance of cutaneous temperature inpredicting increased tympanic temperature*Figure 2A) Comparison of receiver operating characteristic (ROC) curves showing relationship between sensitivity (true positive) and 1 – specificity (true negative) in determining value of cutaneous temperature for predicting various thresholds of hyperthermia ...Table 2Variables correlated with magnitude of the difference between cutaneous and tympanic temperature measurements*ConclusionsInfrared thermometry does not reliably detect febrile patients because its sensitivity was lower than that expected and the positive predictive value was low, which indicated a high proportion of false-positive results. Ng et al. (5) studied 502 patients, concluded that an infrared thermal imager can appropriately identify febrile patients, and reported a high area under the ROC curve value (0.972), which is similar to the area we found in the present study (0.925). However, such global assessment is of limited value because of low incidence of fever in the population. Rather than looking at positive predictive value or accuracy, one should determine negative predictive value. This determination might be of greater consequence if one considers an air traveler population or a population entering a hospital.Ng et al. (5) identified outdoor temperature as a confounding variable in cutaneous temperature measurement. Our study identified age as a variable that interferes with cutaneous measurement, but the role of gender is less obvious. Older persons showed impaired defense (stability) of core temperatures during cold and heat stresses, and their cutaneous vascular reactivity was reduced (12,13).Use of a simple infrared thermometry, rather than sophisticated imaging, should not be considered a limitation because this method concerns the relationship between cutaneous and central core temperatures. We can extrapolate our results to any devices that estimate cutaneous temperature and the software used to average it. Our study attempted to detect febrile patients, not infected patients. For mass detection of infection, focusing on fever means that nonfebrile patients are not detected. This last point is useful because fever is not a constant phenomenon during an infectious disease, antipyretic drugs may have been taken by patients, and a hypothermic ratherthan hyperthermic reaction may occur during an infectious process.In conclusion, we observed that cutaneous temperature measurement by using infrared thermometry does not provide a reliable basis for screening outpatients who are febrile because the gradient between cutaneous and core temperatures is markedly influenced by patient’s age and environmental characteristics. Mass detection of febrile patients by using this technique cannot be envisaged without accepting a high rate of false-positive results.AcknowledgmentWe thank David Baker for reviewing the manuscript.This study was supported by the Direction Générale de la Santé, Ministère de la Santé et de la Solidarité, Paris, France.Biography• Dr Hausfater is an internal medicine specialist in the emergency department of Centre Hospitalier Universitaire Pitié-Salpêtrière in Paris. His primary research interests are biomarkers of infection and inflammatory and infectious diseases. References1. Kaydos-Daniels SC, Olowokure B, Chang HJ, Barwick RS, Deng JF, Kuo SH, et al. ; SARS International Field Team. Body temperature monitoring and SARS fever hotline. Emerg Infect Dis2004;10:373–6. [PMC free article] [PubMed]2. Chng SY, Chia F, Leong KK, Kwang YPK, Ma S, Lee BW, et al. Mandatory temperature monitoring in schools during SARS. Arch Dis Child 2004;89:738–9. doi: 10.1136/adc.2003.047084. [PMC free article][PubMed] [Cross Ref]3. St John RK, King A, de Jong D, Brodie-Collins M, Squires SG, Tam TW Border screening for SARS.Emerg Infect Dis 2005;11:6–10. [PMC free article] [PubMed]4. Hughes WT, Patterson GG, Thronton D, Williams BJ, Lott L, Dodge R Detection of fever with infrared thermometry: a feasibility study. J Infect Dis 1985;152:301–6. [PubMed]5. Ng EY, Kaw GJ, Chang WM Analysis of IR thermal imager for mass blind fever screening. Microvasc Res 2004;68:104–9. doi: 10.1016/j.mvr.2004.05.003. [PubMed] [Cross Ref]6. Erickson RS, Meyer LT Accuracy of infrared ear thermometry and other temperature methods in adults. Am J Crit Care 1994;3:40–54. [PubMed]中文译文:新发传染性疾病.2008八月;14(8):1255–1258.DOI:10.3201/eid1408.080059PMCID: PMC2600390 红外测温仪检测发热患者的皮肤彼埃尔侯司法特,赵岩,史蒂芬妮德弗雷纳,帕斯卡尔,和布鲁诺里乌摘要我们评估皮肤红外测温的准确性,通过病人的额头检测温度,发热病人进入急科室进行检测。
Raytek STPro 类型无线电测温器说明书

The ST Pro Thermometer—The Professional’s RuggedDiagnostic Tool.Professionals diagnose car malfunctions, research heatingand ventilation problems, and monitor electrical motorperformance safely and easily with the professionalRaytek STPro thermometer.Handheld, and portable, RaytekSTPro infrared thermometersstand up to the day-to-day usageprofessionals require of their equipment.The STPro series leaps ahead of standardentry level models by providing expandedtemperature ranges, higher resolution optics,tighter accuracy and laser sighting choices.The single dot Laser Point™ (ST20) or theeight-point Laser Guide™ sighting systemsguide measurements to the right target. In less than a second, the large temperaturedisplay provides current and MAX surface temperatures. For continous temperaturemonitoring, professionals use the STPro locking trigger and tripod mount capability.For auto diagnostics, equipment maintenance, and heating and ventilationtroubleshooting, the professional STPro thermometer makes troubleshootingquick and easy.STPro™Portable Infrared Thermometer■1% accuracy■Laser Point™sighting (ST20)■Laser Guide™sighting (ST30)■Temperatures up to535ºC/999ºF (ST30)■MAX temperature displayModel ST30Noncontact Temperature Measurementfor up-to-the-minute featuresWorldwide HeadquartersRaytek Corporation1201 Shaffer Rd. PO Box 1820Santa Cruz, CA 95061-1820 USA Tel:180****5478183****1110Fax:183****4561********************Raytek China Company Beijing, ChinaTel: 86 10 6439 2255 Fax: 86 10 6437 0285***************.cn Raytek Japan, Inc. Osaka, Japan Tel:81 6 4390 5015Fax:81 6 4390 5016*******************.jpSouth American HeadquartersRaytek do Brasil Sorocaba, SP Brasil Tel:55 15 32176046Fax:55 15 32175694*****************.brEuropean HeadquartersRaytek GmbH Berlin, Germany Tel:49 30 4 78 00 80Fax:49 30 4 71 02 51**************Raytek UK Ltd.Milton Keynes, United Kingdom Tel:44 1908 630800Fax:44 1908 630900*****************Raytek France Palaiseau, France Tel:33 1 64 53 15 40Fax:33 1 64 53 15 44**************Worldwide ServiceRaytek offers services including emergency repairs and calibration. For more information,contact your local office or e-mail******************© 2003 Raytek Corporation (1-1301/Rev.E) 5/2003Raytek and the Raytek logo are registered trademarks,and ST,STPro,Laser Guide,and Laser Point are trademarks of Raytek Corp.Specifications subject to change without notice.Laser SightingThe ST20 offset single-point Laser Point ™indicates the approximate center of the measurement area; the ST30 offset 8-point circular Laser Guide ™highlights the approximate measurement area.*For more details, visit /emissivity.htmOptical ResolutionUse the ST20 and ST30 within six feet of theintended target. At greater distances, the measured area will be larger (approximately the distance divided by twelve).D:S (distance to spot using 90% encircled energy at focal point。
thermometer英文作文
thermometer英文作文英文:Thermometer is an essential tool to measure body temperature. It is widely used in hospitals, clinics, and households. There are various types of thermometers, such as digital thermometers, infrared thermometers, and mercury thermometers.I remember when I was a kid, my mom would use a mercury thermometer to check my temperature when I was sick. She would shake it down to the bottom and then put it under my armpit for a few minutes. I always hated that feeling of the cold metal against my skin, but I knew it was necessary to see if I had a fever.Nowadays, digital thermometers are more common. They are quick and easy to use, and they give accurate readings.I have one at home, and I use it whenever I feel under the weather. It's so convenient to just stick it in my mouth orear and get a reading within seconds.中文:温度计是一种测量体温的重要工具。
量体温的英文短语
量体温的英文短语温度测量是医疗保健中一个基本的步骤,它可以帮助检查人体的健康状况。
温度的测量多以体温测量为主,英文称之为body temperature measurement,即测量体温。
1. 测量体温:body temperature measurement2. 体温计:thermometer3. 温度范围:temperature range4. 口腔体温:oral temperature5. 腋窝体温:axillary temperature6. 肛门体温:rectal temperature7. 鼻咽体温:nasopharyngeal temperature8. 耳温:tympanic temperature9. 耳膜体温:tympanic membrane temperature10. 条带式温度计:strip-type thermometers11. 体表温度:skin surface temperature12. 非接触式温度计:non-contact thermometers13. 额温:forehead temperature14. 皮肤热量测量:skin heat measurement15. 正常体温范围:normal temperature range体温测量是医疗保健中很重要的一项测量,它可以帮助评估人体健康状况及发病因素。
目前,用于测量体温的方法有很多,一般都以体内部位的温度记录为主,其中最常用的有口腔体温、腋窝体温、肛门体温和鼻咽体温;耳温和耳膜体温也被用于特殊情况下的体温测量;此外,还有条带式温度计、非接触式温度计和体表温度测量等,都可以评估人体健康状况。
目前,健康的人体温度区间为36.5℃-37.3℃,但也因为温度文化的不同而有一定的程度的偏差,称为“正常温度范围”。
如果温度偏高或偏低,就说明可能出现了身体疾病,这时就要及时采取有效的治疗措施了。
除此之外,如果有必要,可以对患者皮肤进行热量测量。
- 1、下载文档前请自行甄别文档内容的完整性,平台不提供额外的编辑、内容补充、找答案等附加服务。
- 2、"仅部分预览"的文档,不可在线预览部分如存在完整性等问题,可反馈申请退款(可完整预览的文档不适用该条件!)。
- 3、如文档侵犯您的权益,请联系客服反馈,我们会尽快为您处理(人工客服工作时间:9:00-18:30)。
化工学院信息与控制工程学院毕业设计外文翻译粮食仓储无线测温系统的设计Design of wireless temperature measurement systemfor grain storage学生学号:10540108学生:王宪忠专业班级:测控1001指导教师:艾学忠职称:教授起止日期:2014.2.25~2014.3.16吉林化工学院Jilin Institute of Chemical Technology激光切割工艺中无线温度采集系统的设计摘要本文提出了一种先进的工程材料的激光切割加工的无线温度采集系统的开发。
该无线系统可以有效的进行自动温度监测。
该系统包括硬件,软件,和一台计算机。
该无线系统的包括电源子系统,传感器子系统,和一个主要基于无线射频(RF)技术的主节点系统。
该系统的优点是简单的数据管理温度报警和所需文件的准确性。
该集成无线温度传感器的有用性是在马来西亚理科大学机械工程学院制造实验室进行测试的。
在实验室收集的数据用来评估该系统的实用性。
数据表明,该系统可以测量和监测在硬顶的的时间和距离的围的温度。
这项工作是使用无线网络系统监控激光切削过程(WSN)温度的一个重要的开始。
关键词:温度监测;无线传感器;激光切割;过程监控1 简介该过程监控系统具有避免意外故障的优点,大大提高了系统的可靠性和可维护性。
其获取更大的工艺参数也给出了更好的可视性和更好的决策权。
这些系统通常与数据采集系统使用传感器测量相关的参数。
传感器测得的数据通过有线通信传输给处理系统。
然而,这些系统可以是非常昂贵和不灵活的。
随着通信技术的发展,数据已经可以通过无线方式来传输。
目前,无线技术,特别是无线传感器网络综合了传感器技术,MEMS 技术,无线通信技术,嵌入式计算技术、分布式信息管理技术,得到了迅速的发展。
无线传输的重要优势就是简化了系统的布线和管理。
否则,在一些危险,或者偏远的区域和地点不可能实现传感器的应用。
更快的部署和安装各种各样的传感器,可以使多点测量,低成本,低功耗,小体积,和便携成为可能。
在工业上激光切割金属的发现和应用是由于其加工复杂的工件时可以非接触式加工,并且精度高,表面光洁度高,易于数控(CNC)。
另外,这项技术已被用于先进的工程材料的研究,例如,钨,钛,瓷,铝合金,铬镍铁合金,钽,和金属基复合材料。
激光切割要达到良好的切削性能涉及许多操作参数,如激光功率,切割速度,频率,占空比,焦距,间隔距离,辅助气体压力,束喷嘴,和切割镜片。
应该在切削过程中监测测这些参数,来控制切削的动作,以达到预期的切削效果。
然而,目前的技术已被用来监测过程中切削是基于有线通信的,它缺乏灵活性。
例如,为了满足要求需要部署固定的连线来供电和传输数据。
另外,这个系统时面临着现有设施被用于新的加工业务改造的困难(必须独立的分析每个切削参数)。
为了解决这个问题,无线监控系统应该应用在先进的金属材料激光切割的过程中。
许多类型的无线技术发的展从简单的红外数据协议(IrDA)该协议利用红外光的短距离的点对点通信,短距离的无线个人区域网(WPAN)的一点对多点的通信,如蓝牙和ZigBee;中距离的多跳无线局域网(WLAN)远程蜂窝系统,如全球移动/通用分组无线服务系统(GSM/GPRS)和码分多址(CDMA)。
其中,红外,蓝牙,ZigBee,和GSM是为激光切割数据监测系统的无线数据遥测的潜在的选择。
其中红外线是一种需要一个发射机和一个接收机的但总显得无许可的通信技术。
ZigBee广泛应用于网络数据采集监测温度,气体,和其他。
ZigBee是一个不耗电的系统,但它不能在大面积和远距离传输。
蓝牙只能在10米的距离传输数据。
然而,高耗能使得蓝牙不是一种普通的数据传输方式。
另一种无线传输技术是GSM。
尽管GSM可以大围和远距离传输数据,但是它花费很高。
GSM通过SIM卡来传输数据,SIM卡里的资金每发送一条信心将被运营商扣除相应的金额。
为了达到检测的目的,我们的程序将持续发送数据。
因此,GSM不是本设计的最佳选择。
在433 MHz的射频(RF)传输在数据传输距离,系统功耗和单元尺寸方面拥有很大的优势。
某些射频模块可以传输超过4公里的距离,并且只消耗很少的功率。
在我们的应用中,433MHz的射频传输是最好的选择,应为其低功耗,低成本,维护方便,传输距离远。
以前的研究人员选择了射频传输系统基于其传输距离远,成本低,可靠性高,低功耗,智能化,安装灵活,便于移动和小型化等优点。
目前,马来西亚理工大学已经研究了激光切割技术在先进工程材料切割过程中的应用,使用的是有线的监控系统。
在本文中,我们初步研究一个激光切割工艺中无线温度监测系统的的设计,制造。
这对于在激光金属切割过程中使用无线温度监测系统有重要的意义。
2 无线温度监控系统的设计A 无线模块图2-1表示了一个无线传感器节点结构框图。
该系统由两个主要部分:传感元件和数据采集系统。
该传感节点是一个组合的多类型传感器,包括模数转换器(ADC),存储器,控制器,和射频收发器。
无线收发器通常特定围的数据传输。
无线传感器网络中的主要问题是电源使用。
一般来说,电池是为数据处理计算和数据传输提供能量。
由于该装置在实验室的应用,我们决定使用从电源的12V电源。
图2-1无线传感器节点结构框图B 传感器节点的硬件热电偶是一种结合了两种不同的金属(铝,铬)的特殊的合金,产生的温度差引起的电压。
K型热电偶是一个宽围的温度检测器件,检测围从-200ºC到1200ºC。
它用于激光切削过程温度监测是非常合适的。
K型热电偶残剩的是一个非常小的线性模拟输出啊信号,需要用放大器来把这个输出信号放大到0~5V的围。
一种稳定的小信号放大器是AD595(如图二)。
图2-2 AD595完整系统根据图2-2,铜(铝)和铁(镍铬)连接到AD595的14引脚和1引脚。
AD595放大过程开始于247.3这个固定的增益。
从AD9595输出10mV/°C的稳定的增益。
该输出信号输入到微控制器中进行处理,然后以一个合适的围发送出去。
在这个系统中,可编程微控制器(PSoC)选择从AD595输出的数据进行处理。
工作在5V使PSoC芯片适宜应用在温度监测中。
该应用程序由两部分组成:传送部分和接收部分。
数据从传感器传出,单片机使用收发模块接收并处理数据后发送给接收机,然后该接收器接收数据。
电源是在选择收发模块的共同因素。
在这个项目中,我们使用了508射频模块它工作在433mhz 下可以传输的距离超过500m。
C PCB板的设计一个设计适当的印刷电路板(PCB)对于传感器与接口的操作是非常重要的。
印刷电路板是一个2层0.95毫米厚的标准的FR-4板,PCB的轮廓尺寸为89mm×71毫米。
下图(图2-3)是使用ORCAD Family Release 9.2软件设计的PCB板。
为了维持PCB板的布局LED,MAX232西片,和PSoC芯片都安装在PCB板的表面。
图2-3 PCB的设计视图D 节点软件本部分介绍如何通过软件的编程来开发系统。
该系统被划分为几个部分:传感器的信号采集,传感器的数据显示,从传感器通过无线发送数据,接收数据进行处理,存储,并进行进一步的分析。
图2-4表示了从传感器读取数据到接收机接收数据的过程。
本项目采用K型热电偶传感器监测温度。
热电偶在一个很小的围呢输出一个很小的电压。
AD595是热电偶冷端补偿放大器,可以放大输出电压的,可以与单片机连接如图2-5。
AD595产生的输出电压为10mV/℃。
最大输出电压为15V,但是也要取决于电源的电压。
AD595电路能使输出电压的围保持在0~5V。
为了获得和AD595输出相同的电压,图2-5中R2上的电压应该是其三倍。
之所以使用这种方法是因为ADC的输出电压围只能是0~5V。
在控制部分,一个12位的ADC把输入的模拟电压信号进行转换,转换成表示温度的数字信号。
所有的数据可以通过液晶显示模块显示,他们是通过一个通用异步接收发送模块(UART)发送的。
每隔一分钟发送一次测试数据。
读取温度开始传感器数据读取完毕显示发送数据结束图2-4发射机节点软件实现流程图图2-5 AD595单片热电偶冷端补偿放大器图2-6显示的传感器数据库接收流程图。
介绍了无线接收模块的系统与计算机系统集成。
在接收端,允许用户通过使用数据记录器软件监视传感器的数据,对数据进行处理和加工然后显示出来。
原始数据可以以文本的形式存储和记录,可进一步的用其他的软件进行加工,如微软的EXCEL。
数据接收数据排列和处理保存数据数据显示开始结束图2-6接收器节点的软件实现流程图E数据记录软件数据记录软件是用来监测从传感器输出的数据的。
该软件可以在微软Windows XP和微软的Windows Vista系统运行。
可以在9600bps的速率下进行串行数据通信。
它可以直接通过串口或市售的RS-232接口连接到PC的COM端口。
它可以可以实时监测传感器输出的数据,并并把数据以文本的形式记录在一个表格中,如表1所示。
表2-1 实验数据资料3实验方法这个实验装置是由发射机和接收机组成的。
发射部分由温度控制器,传感器节点(发射机),加热器,和支架构成,如图3-1所示。
接收部分由接收模块和一个笔记本电脑组成,如图3-2所示。
温度控制器可以工作在0-400ºC的围。
温度传感器中的热电偶在加热器中可以把温度信号转变成电信号。
支架是用来安装热电偶温度传感器和加热器的。
温度控制器设置一定的温度,加热器加热,热电偶感受热信号并把温度信号以电信号的形式传送出去,温度信号经过处理后将在显示屏上实时显示。
温度控制加热器数据发送模块图3-1实验装置的发射部分计算机数据接收模块图3-2实验装置的接收器在接收机中,发射机发射的数据由接收节点接收。
在笔记本上使用数据库软件进行登陆和数据的存储。
通过USB来连接数据接收模块和笔记本电脑。
每隔一分钟在液晶显示器上实时显示温度的监测值。
发射部分和接收部分的距离大约为5米,因此数据的无线传输距离也是在5米的围进行的。
这个实验是在马来西亚理工大学的机械工程实验室里进行的。
4 结果与讨论图4-1显示了在一分钟,5米的远的距离传输数据的结果。
结果表明,该装置能够测量温度,并且能够把温度数据通过无线的方式传输到电脑上。
在该试验中用的是型号为2020T的K型热电偶,并将测量的温度数据在数码管上显示出来。
图4-1温度与时间5结论在本文中,对激光切割过程中的无线温度采集系统的硬件和软件提出了一种基于无线射频的设计方案。
K型热电偶集成在切割过程中PSoC温度监控平台上。
初步试验证明,所开发的模型是能够监测温度,并且设备有精度高,功耗低,尺寸小,成本低等优点。